
Bacterial Characteristics of Dust Particle Saltation in Gobi Dust Sites, Mongolia
by
 , and
, and
Katsuro Hagiwara
1,* ,
,
Tamaki Matsumoto
2,
Purevsuren Tsedendamba
2,
Kenji Baba
2 and
Buho Hoshino
2,* 1
School of Veterinary Medicine, Rakuno Gakuen University, Ebetsu 069-8501, Japan
2
Department of Environmental and Life Sciences, Rakuno Gakuen University, Ebetsu 069-8501, Japan
*
Authors to whom correspondence should be addressed.
Atmosphere 2021, 12(11), 1456; https://0-doi-org.brum.beds.ac.uk/10.3390/atmos12111456
Submission received: 13 October 2021
/
Revised: 29 October 2021
/
Accepted: 31 October 2021
/
Published: 3 November 2021
(This article belongs to the Section Air Quality)
Abstract
:The Gobi Desert is a major source of Asian dust events, and the resulting health hazards have increased significantly in recent years. We reported that a variety of live bacteria were distributed in the Gobi Desert in relation to land use. Bacterial distribution was confirmed in the environment and on the land used by animals; however, bacterial saltation due to dust events has not been investigated in detail. In this study, to understand the distribution of surface bacteria in the atmosphere by dust saltation, live bacteria in four dust-generating areas in the Gobi area were monitored using an artificial dust generating device. The live bacteria were detected by experimental saltation at a wind speed of 6.5–8 m/s in all areas. A certain number of live bacteria are constantly saltated by dust events, and these bacteria depend on land use. Moreover, the bacterial saltation strain depended on land use and diversity, indicating that live bacteria are lifted into the environment by dust events. These findings indicate that dust events saltate environmental bacteria on the ground, suggest the risk of animal-derived bacterial saltation affected by land use, and present cross-border public health challenges to be considered in the future.
1. Introduction
Recent developments in socio-economic activity have led to changes in atmospheric circulation due to climate change [1]. Cross-border infectious diseases are caused by viruses and bacteria that can threaten human and animal health, and zoonotic diseases are becoming increasingly problematic [2,3,4,5,6,7,8]. Asian dust events occur in arid and semi-arid areas, such as desert areas and the yellow soil plateau of East Asia, where substantial dust is blown by strong winds caused by low pressure [9,10,11,12,13,14]. This dust is carried by westerly winds to Northeast Asia and the western Pacific Ocean [15,16,17,18,19,20,21].
The threshold friction velocity for saltation is a critical parameter for describing the initiation of mobilization of sand particles from the ground surface into the atmosphere. The airborne sand particles fall due to gravity and hit the ground, dislodging dust particles that are then emitted and transported regionally and globally [22]. Knowing how much dust is emitted into the atmosphere is very important for understanding the global climate, environmental changes, and resulting health issues. However, critical wind speed has not been observed precisely in the field due to instrumental limitations and complicated ground surface conditions, such as sand particle size distribution, soil moisture and snow cover. For these reasons, few papers by dust modelers have presented practical values of critical wind speed [23]. The findings of Greeley et al. [24,25,26,27] for wind “threshold” curves derived from laboratory experiments showed: “wind has the potential for directly eroding material and redistributing it to other areas. Wind transports sediment via: suspension (mostly silt and clay particles, i.e., ≤60 µm), saltation (mostly sand size particles, 60 to 2000 µm in diameter), and surface creep (particles ≥ 2000 µm in diameter)”. Additionally, they define the minimum wind friction speed [28] to initiate the movement of particles in different planetary environments [29,30]. High winds above 8 m/s blow away dust from sand particles around Beijing [31]. In addition to wind speed, soil moisture and vegetation on the ground surface (surface roughness) affect the saltation of sand particles. Aeolian processes are capable of redistributing enormous quantities of sediment over planetary surfaces, resulting in the formation of various landforms and deposition of windblown sediments that can be hundreds of meters thick [32,33]. Therefore, it is expected that environmental microorganisms bound to sand will be scattered in the atmosphere together with dust. However, there are still unknowns about the information that was actually verified.
Our previous studies have revealed that seven predominant bacterial strains survived environmental stress on the surface of the dust-producing areas of the Gobi Desert [34]. Their distribution was characterized by the environmental factors of the land use; however, it is unclear whether the bacterial characteristics of the surface saltated by strong winds affect the characteristics of land use.
Bioaerosols are particulate matter derived from living organisms, including microorganisms such as bacteria, viruses, pollen, and organic dust [35]. During dust events, bacteria can attach to dust particles and travel long distances, causing environmental cross-border pollution [36]. In fact, bacteria attached to sand particles in the Gobi area are saltated by dust [37]. Previous findings indicate that various bioaerosols, including microorganisms, are alive [38,39]. Dust-borne microorganisms may have a direct impact on human health through etiology, exposure to allergens, promotion of immune-mediated disease, and increased susceptibility to asthma due to long-term exposure [40,41,42]. Previous reports indicate that dust saltation is concentrated in April–June and is related to the cyclone [43,44]. It has been reported that the dust generated in the Gobi Desert contains a large number of microorganisms; however, the characteristics of dust particles and the species of bacteria by saltation are poorly understood [37]. If dust-borne microorganisms are zoonotic disease pathogens or risk factors for human health, they can also affect livestock or humans directly or indirectly through animals. There is no detailed quantitative verification of actual saltated bacteria, and the consideration of their environmental risks is insufficient. Therefore, we developed our own saltation experimental device and conducted experimental verification to clarify the particle size of dust saltation and the characteristics of the strain in topographical change.
2. Materials and Methods
2.1. Sample Collection Sites
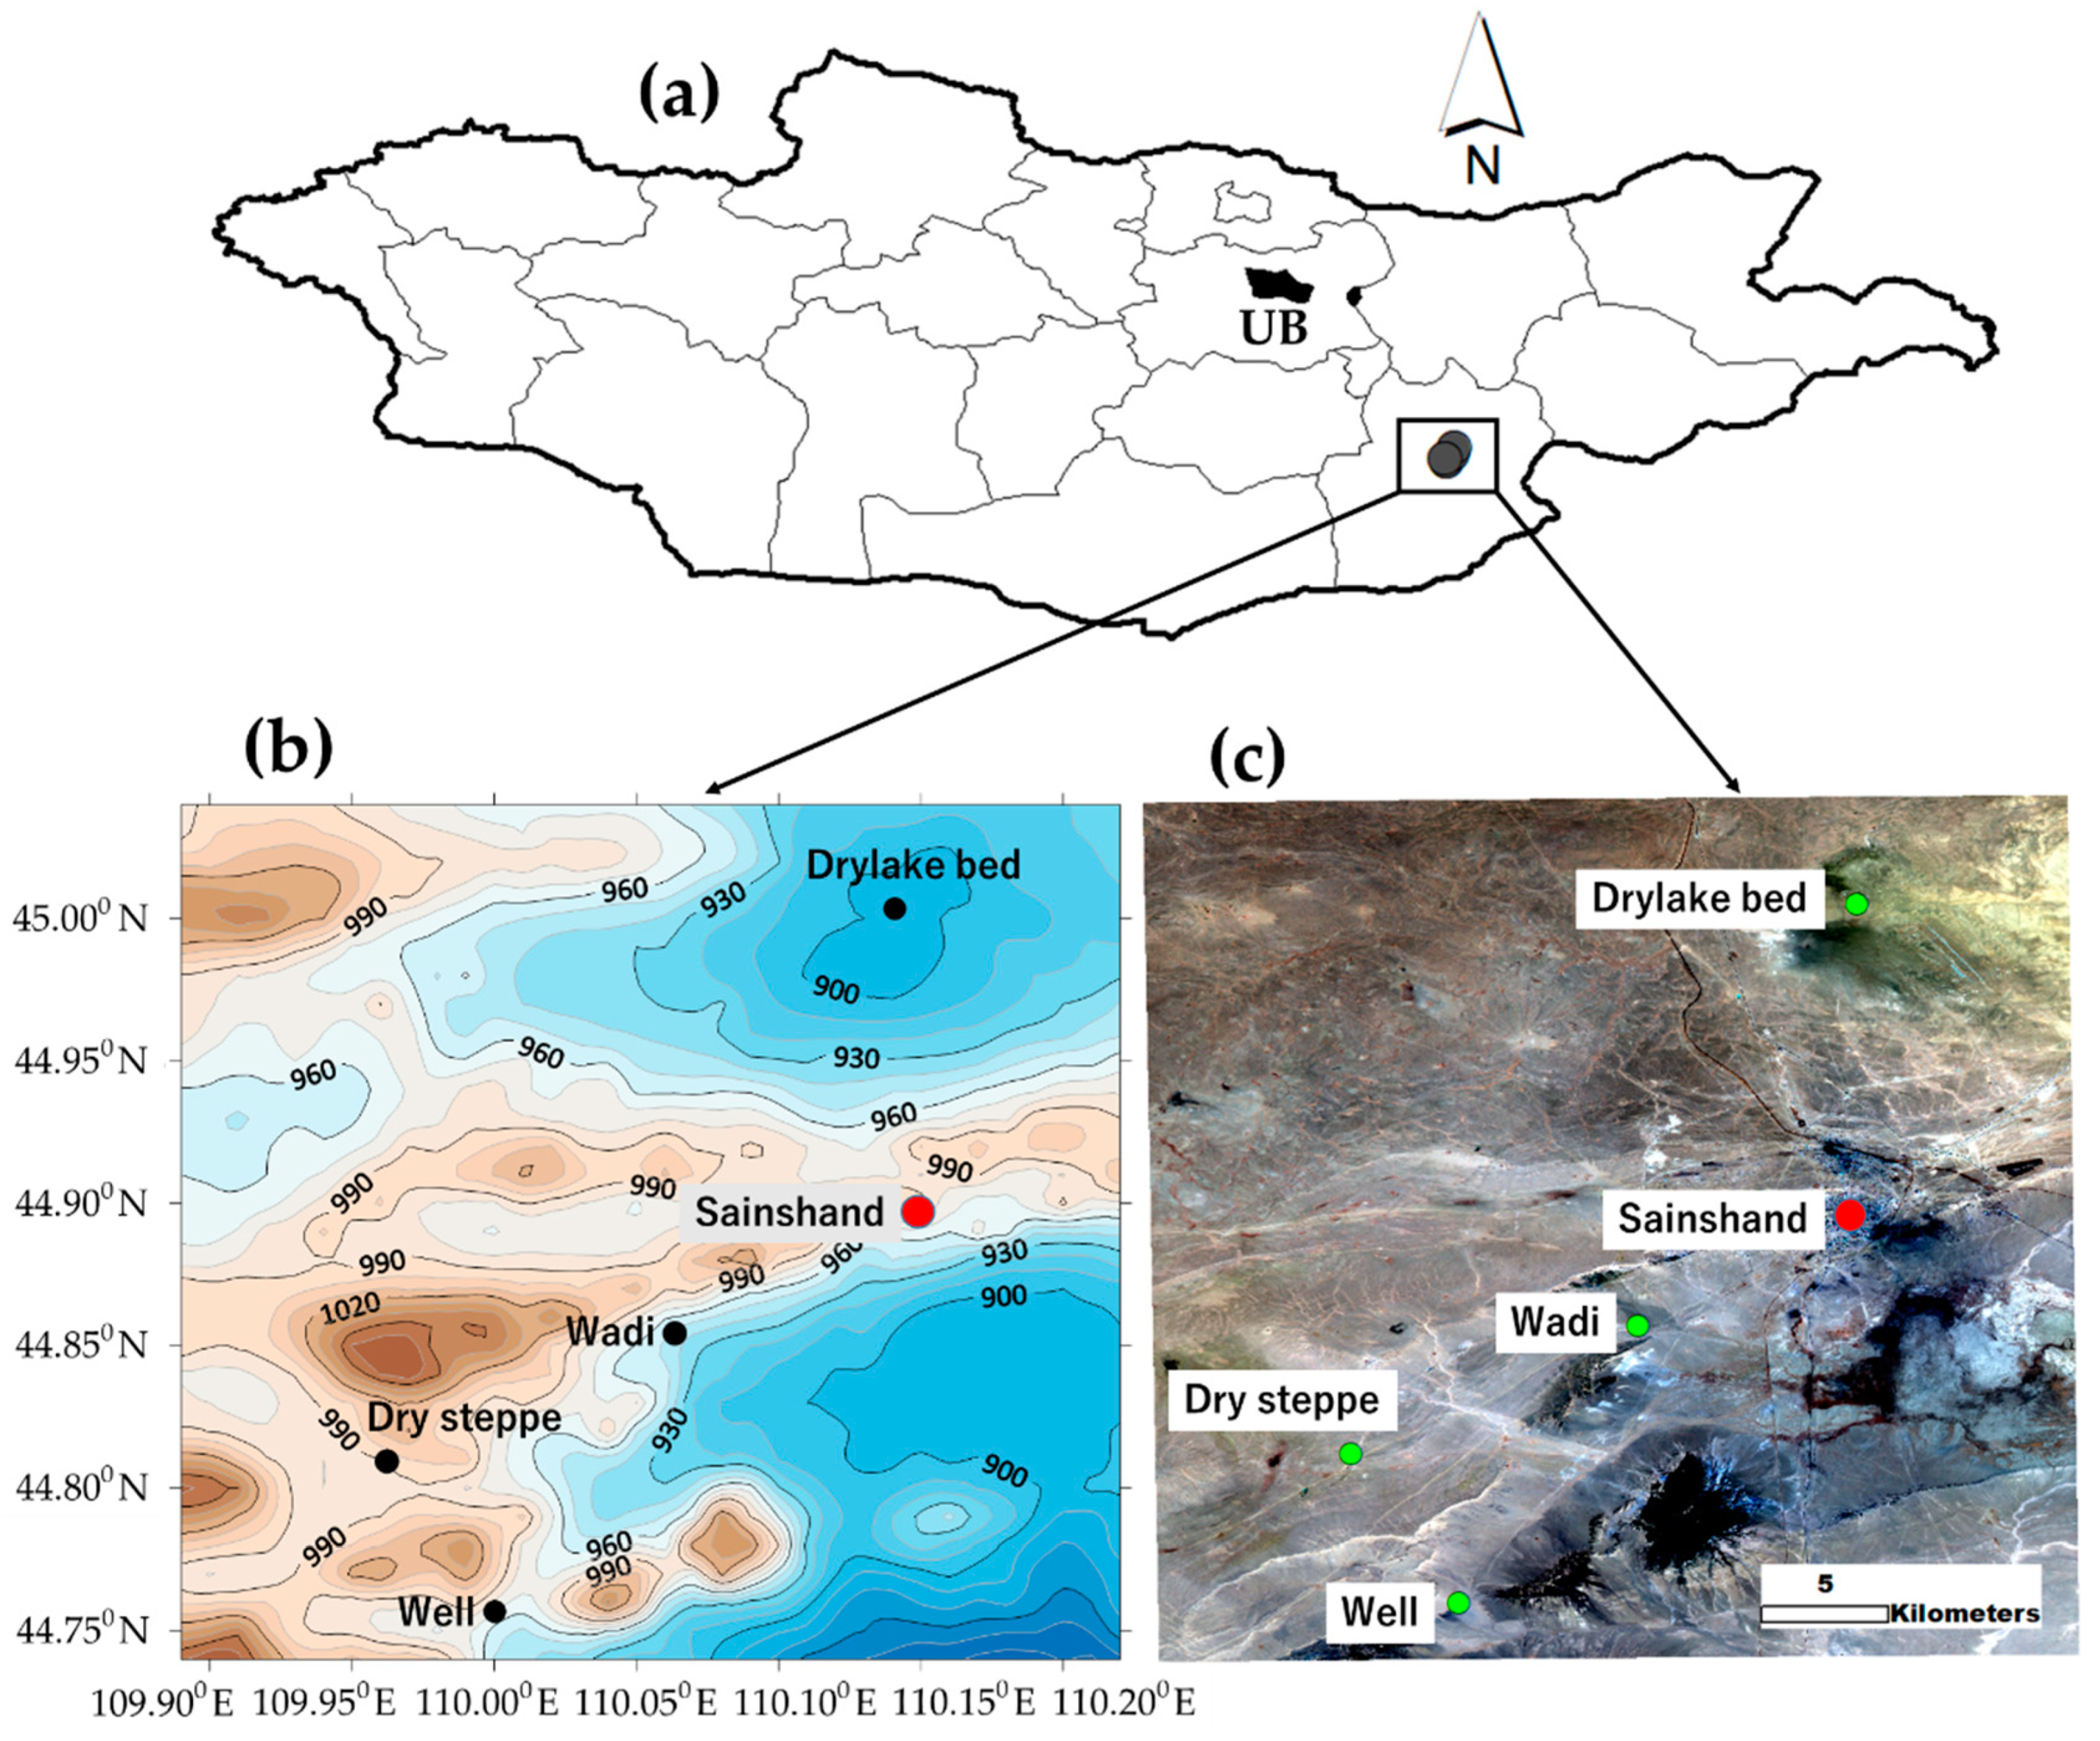
Four different locations were used as the study areas, classified according to their land use: a dry lake bed, a wadi, a well, and a desert steppe (Figure 1). The site for this survey was at the same location where surface microorganisms were surveyed in April 2018 [22]. (1) Dry lake bed (DL): Dry lake floors without vegetation are a source of sandstorms and a place where water has previously flowed. Topographically, dry lakes are called inland depressions (playas) and are shallow plains during the rainy season; however, when evaporated, they become salt pans with clay, salt, and gypsum deposits [43]. (2) Wadi (WA): wadis are dry waterways formed in the lowlands and seasonal rivers that appear temporarily during the rainy season, where small particles accumulate on the ground. (3) Well (WE): Wells are distributed in the Gobi Desert every 20–30 km. The area around the well is used by livestock and wildlife. (4) Desert steppe (DS): Desert grasslands possess the most widely distributed land vegetation for livestock. The areas are home to annual and perennial shrubs, which are involved in the control of dust storms. This research project was carried out by inheriting the following project: “International Observation of Yellow Sand and Environmental Regime Shift in Source Area”, Grant Scientific Research (A: 16H02703). The analysis of the survey sample was carried out with the permission of the Agriculture, Forestry, and Fisheries Plant Protection Station (29Y2490).
2.2. Dust Particle Saltation Experiments
Dust particle saltation experiments were conducted at four sites in the desert area, DL, and dry lake area. The water content and temperature of the soil collected at the sample points were measured using dedicated measuring instruments: the HH2 Moisture Meter© (Delta-T Devices Ltd., Cambridge, UK) and a radiation thermometer (Shinwa Rules Co., Ltd., Niigata, Japan), respectively. The conditions of the field environment are listed in Table 1.
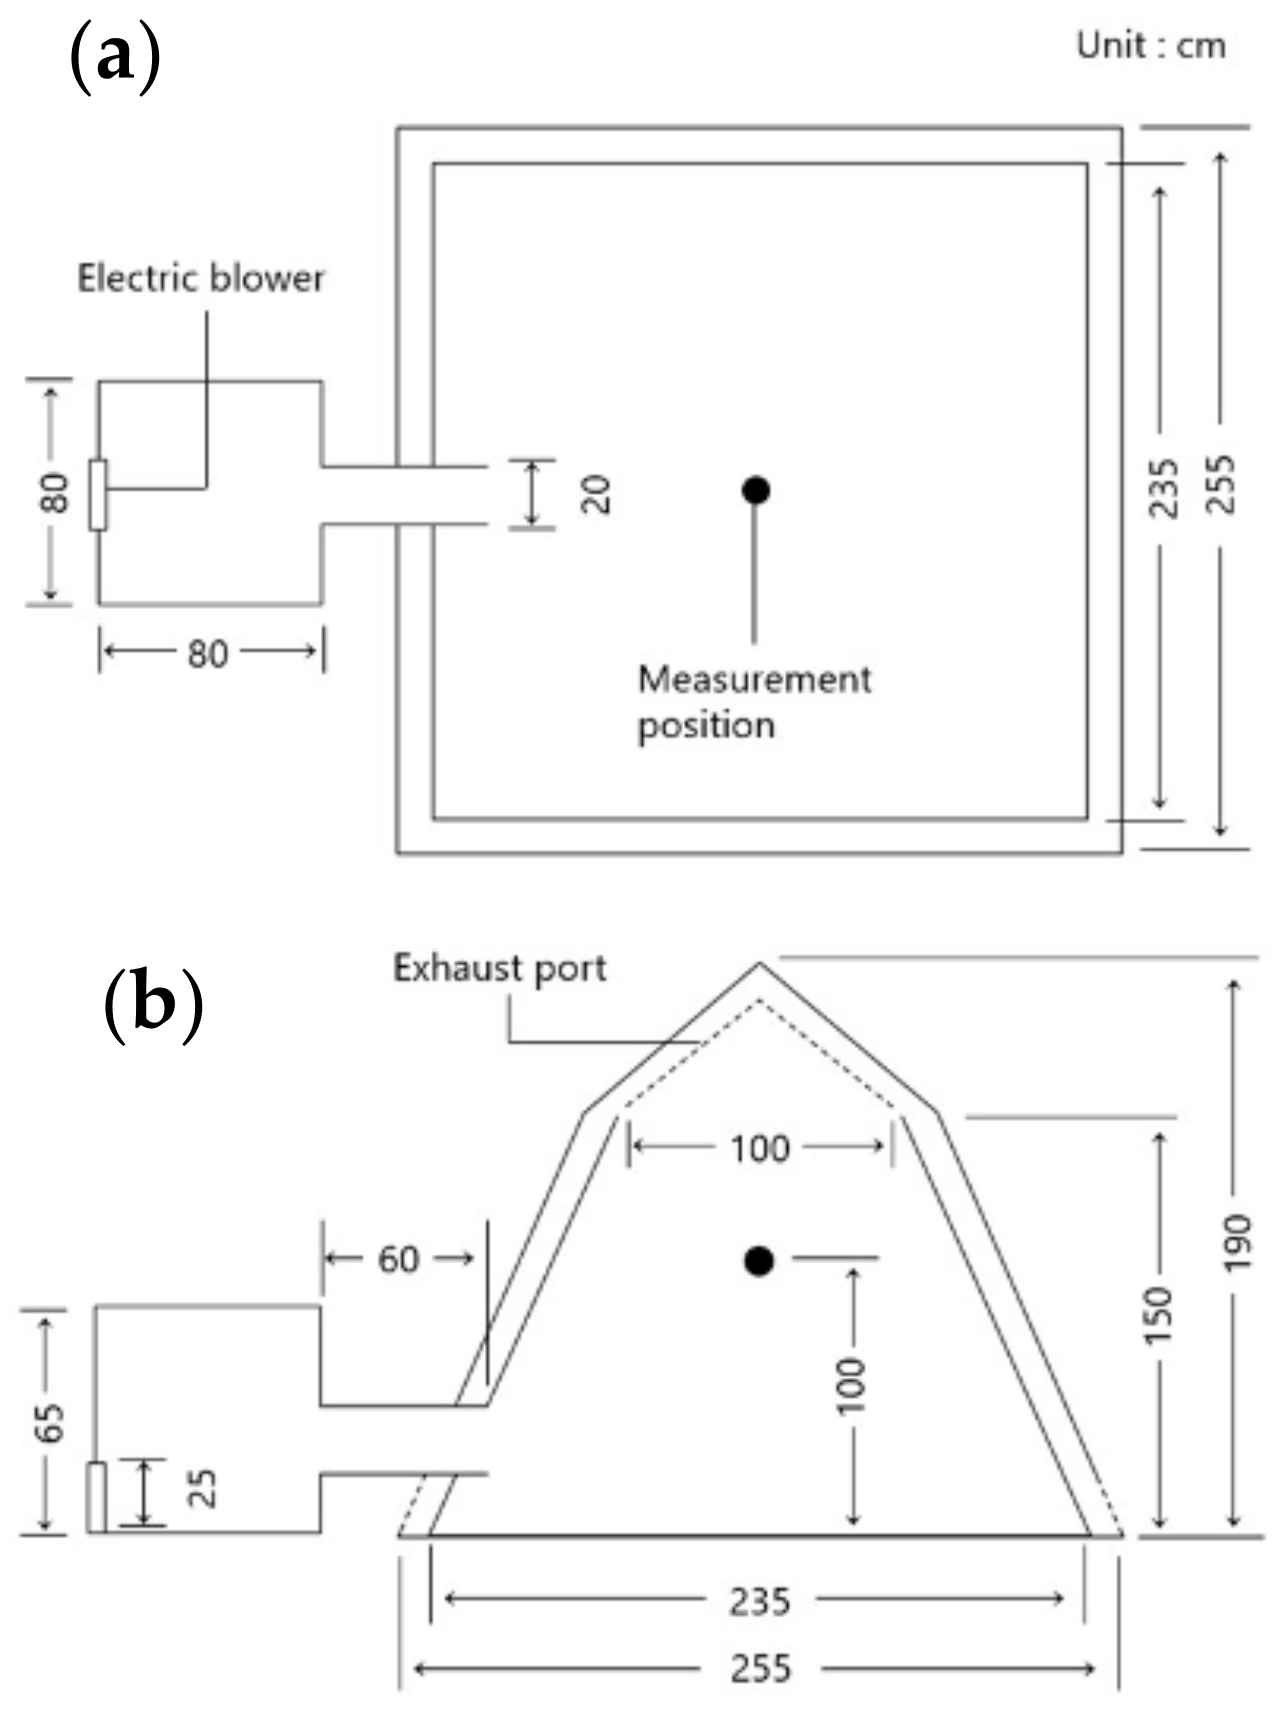
The dust concentration was measured for two particle sizes: 1 μm < 3 μm (3 μm) and 3 μm < 5 μm (5 μm). To measure the number of dust saltations, a handheld particle counter Model 3886 (KANOMAX Co., Ltd., Osaka, Japan) was used. The dimensions of the measuring equipment and photographs of the saltation experiments are shown in Figure 2. To minimize the influence of the outside air, the air inlet of the blower was installed on the windward side, and the blower and the measurement point were sealed, except for the air inlet and outlet. In the measurement method, an artificially generated wind was blown onto the ground surface stepwise by a blower, and the concentration of the dust particle saltation was measured. Here, stepwise means five stages of rotation speeds of the blower: 1200, 1400, 1600, 1800, and 1900 rpm (revolution per minute, corresponding to 5, 6.5, 8, 9, and 11 m/s at 1 cm from the land base). The wind speed was calculated from the number of revolutions using the following formula [45,46].
Estimation for 10 m wind speed:
U10: wind speed at 10 m.
(The standard exposure height of wind instruments over level; open terrain is 10 m above the ground).
Us: wind speed at 0.01 m.
(Height of wind speed measurement by fan).
h10: 10 m height; hs: 0.01 m height; z0: roughness length (flat desert).
In the saltation experiment, we carried out spray disinfection with 70% ethanol for each test to inactivate the environmental bacteria in the saltation area in the tent. Air was blown for one minute at each stage, and the dust particle saltation at each stage was measured. Furthermore, the wind speed for each rotation speed of the blower was measured. In this way, we examined the difference in the number of dust saltations for each wind speed in the research area. The dust particle data were analyzed using kernel density (Spatial Analyst, (c) Systat software version 13.2., Systat Software, Inc., Chicago, IL, USA) for each particle system. Furthermore, the relationship between topography and saltated particles was analyzed and drawn using GS + Geostatistics (Gamma Design Software, LLC., Plainwell, MI, USA).
2.3. Bacterial Isolation
Saltated particles were collected in a sterile Petri dish installed in the tent (mark point in Figure 2). The obtained particles were suspended in 10% sterile phosphate-buffered saline (PBS), and bacterial culture was carried out as follows. The suspension was diluted to 10−1–10−5 in PBS and aerobically cultured in LB agar media (BD Difco™, East Rutherford, NJ, USA) at 37 °C for 24 h. The generated colonies were first counted as the total number of bacteria and classified by morphology based on Bergey’s Manual [47]. DNA was subsequently extracted from three colonies of the same morphology from each sample location using the MagExtractor™-Genome-kit (Toyobo, Osaka, Japan) according to the manufacturer’s instructions.
Amplification of 16s rDNA and Determination of Gene Sequence
Amplification of 16s rDNA was performed using the extracted DNA as a template, and primers 27F (5′-AGAGTTTGATCMTGGCTCAG-3′) and 1492R (5′-CGGTTACCTTGTTACGACTT-3′). Gene amplification was carried out by polymerase chain reaction (PCR) using TaKaRa Ex Taq® (Takara Bio Inc., Shiga, Japan) as follows: an initial denaturation at 95 °C for 2 min, followed by thermocycling (35 cycles) at 98 °C for 10 s, 55 °C for 30 s, and 72 °C for 1 min, and a final extension at 68 °C for 5 min. DNA amplicons were resolved on a 1.0% agarose gel via electrophoresis, and an amplified band of 1466 bp in length was confirmed. Amplified DNA was purified using the Fast Gene Gel/PCR Extraction Kit (Genetics, Tokyo, Japan) to prepare samples for direct sequencing. Sequence analysis was performed using the 27F sequence primer. The resulting nucleotide sequence was aligned using BioEdit (version 7.0.9) [48]. The 16s rDNA variable regions 1–4 were subjected to BLAST analysis using the GenBank database (NCBI) to identify bacteria based on their previously determined classification.
2.4. Sample Data Analysis
The water content and temperature of the soil collected at the sample points were measured using dedicated measuring instruments: the HH2 Moisture Meter© (Delta-T Devices Ltd., Camberwell, UK) and a radiation thermometer (Shinwa Rules Co., Ltd., Sanjō-shi, Japan), respectively. Longitude–latitude interactive simulation was analyzed by GS + Geostatistics software (version 10) to compare with the same 2018 season of the scattering dust event. Sequence analysis was performed using MEGA-X (version 10) [49].
3. Results
In the Gobi Desert, four locations were selected based on the characteristics of the topography, and saltation experiments were conducted in each area. During the study period, the weather was fine, and no abnormal weather conditions, such as sandstorms, were observed. The outside air temperature was maintained in the range of 13.4–26.0 °C, and the wind speed was 2.5–4.4 m/s. These weather conditions did not affect the installed test tents.
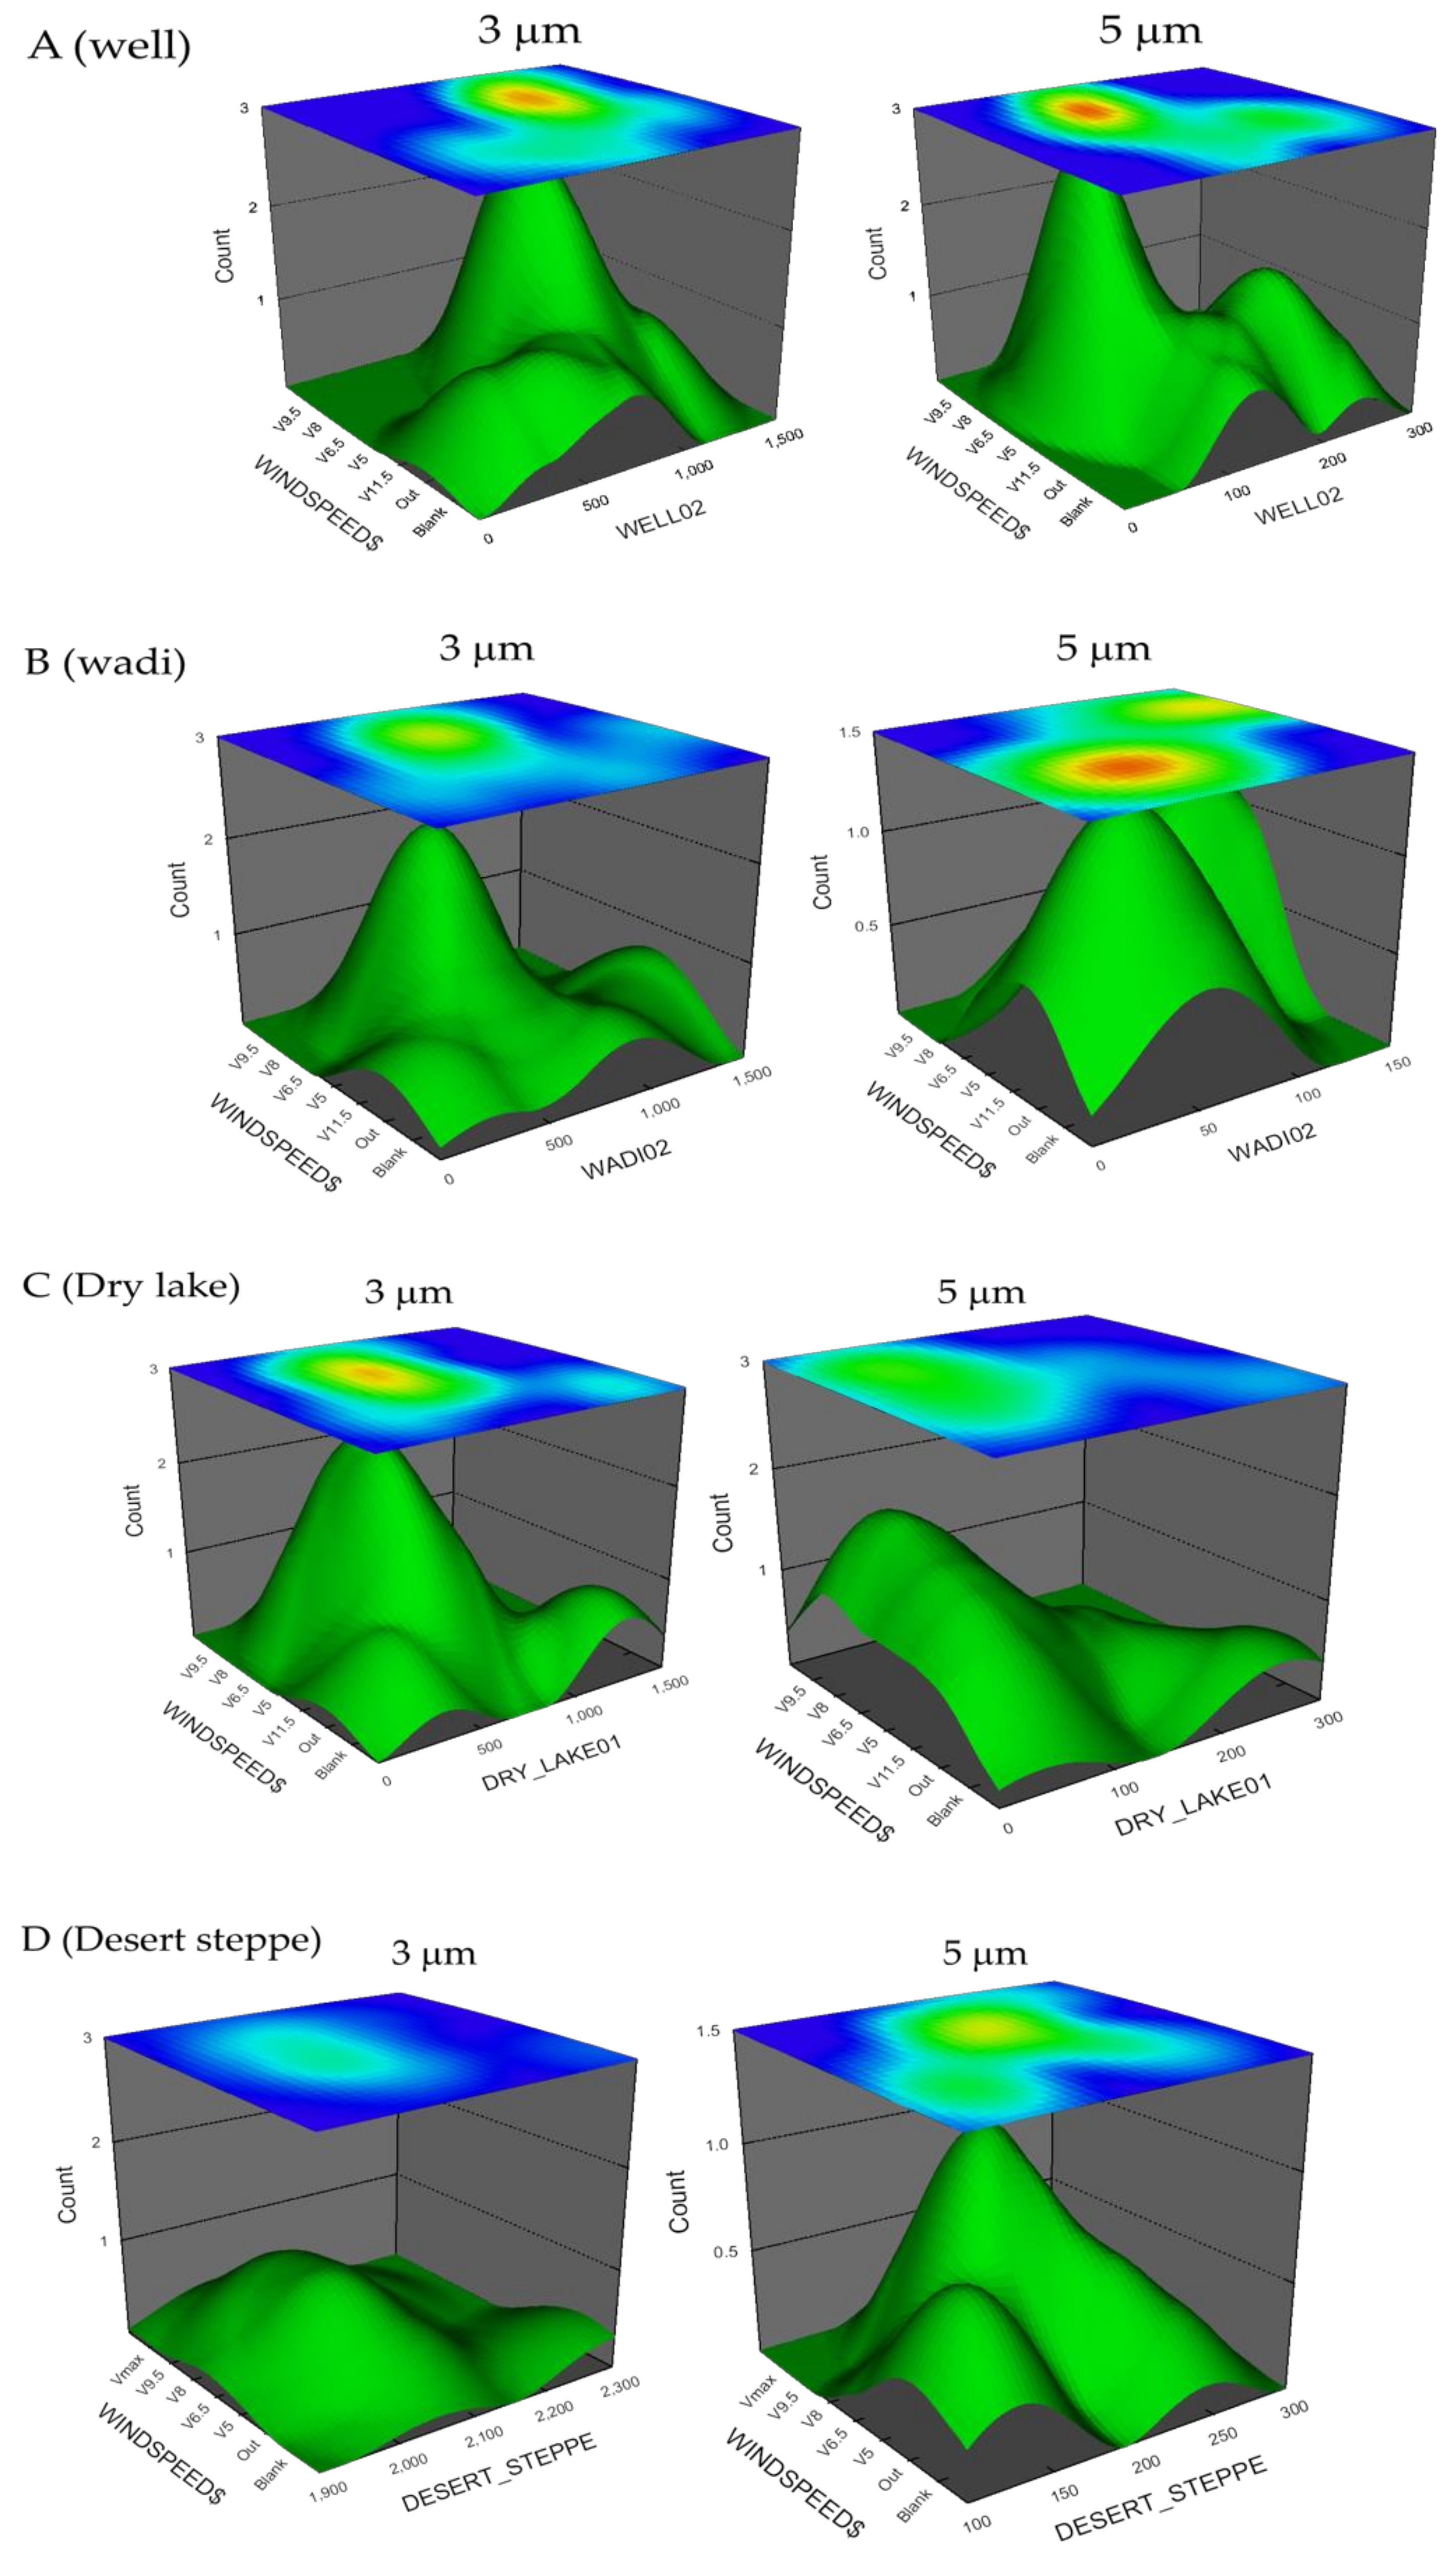
In the artificial saltation experiment, a particle counter and a sterile dish were installed to monitor particle scattering and microorganisms. For saltated particles, the values were divided into 3 µm and 5 µm, and the changes were analyzed by kernel density (Spatial Analyst, (c) Systat software version 13.2).
As a result of the scattering test, it was clarified that the scattering tendency of the particles differed depending on the change in wind speed, and that the scattering amount increased most between the wind speeds of 6.5 and 11.0 m/s (Figure 3A–D). In the DL, 8–11 m/s showed the most saltated particles. In other places, the wind speed of 6.5–8 m/s showed the largest saltated particles. Furthermore, it was shown that the relationship between the saltated particles and the topography was characteristic. The longitude–latitude interactive simulation was analyzed for dust size (3 µm and 5 µm) in the research area. From the field experiment, we found that the critical wind speed for dust generation was 9 m/s, and the dust particles were saltated more easily from the WA in different landscapes. Next, we analyzed the saltation from the DL. This is because many dust particles are saltated on the ground surface of these places. Dust is unlikely to occur in desert steppes where dry grass (non-photosynthetic vegetation) is distributed (Figure 3A–D).
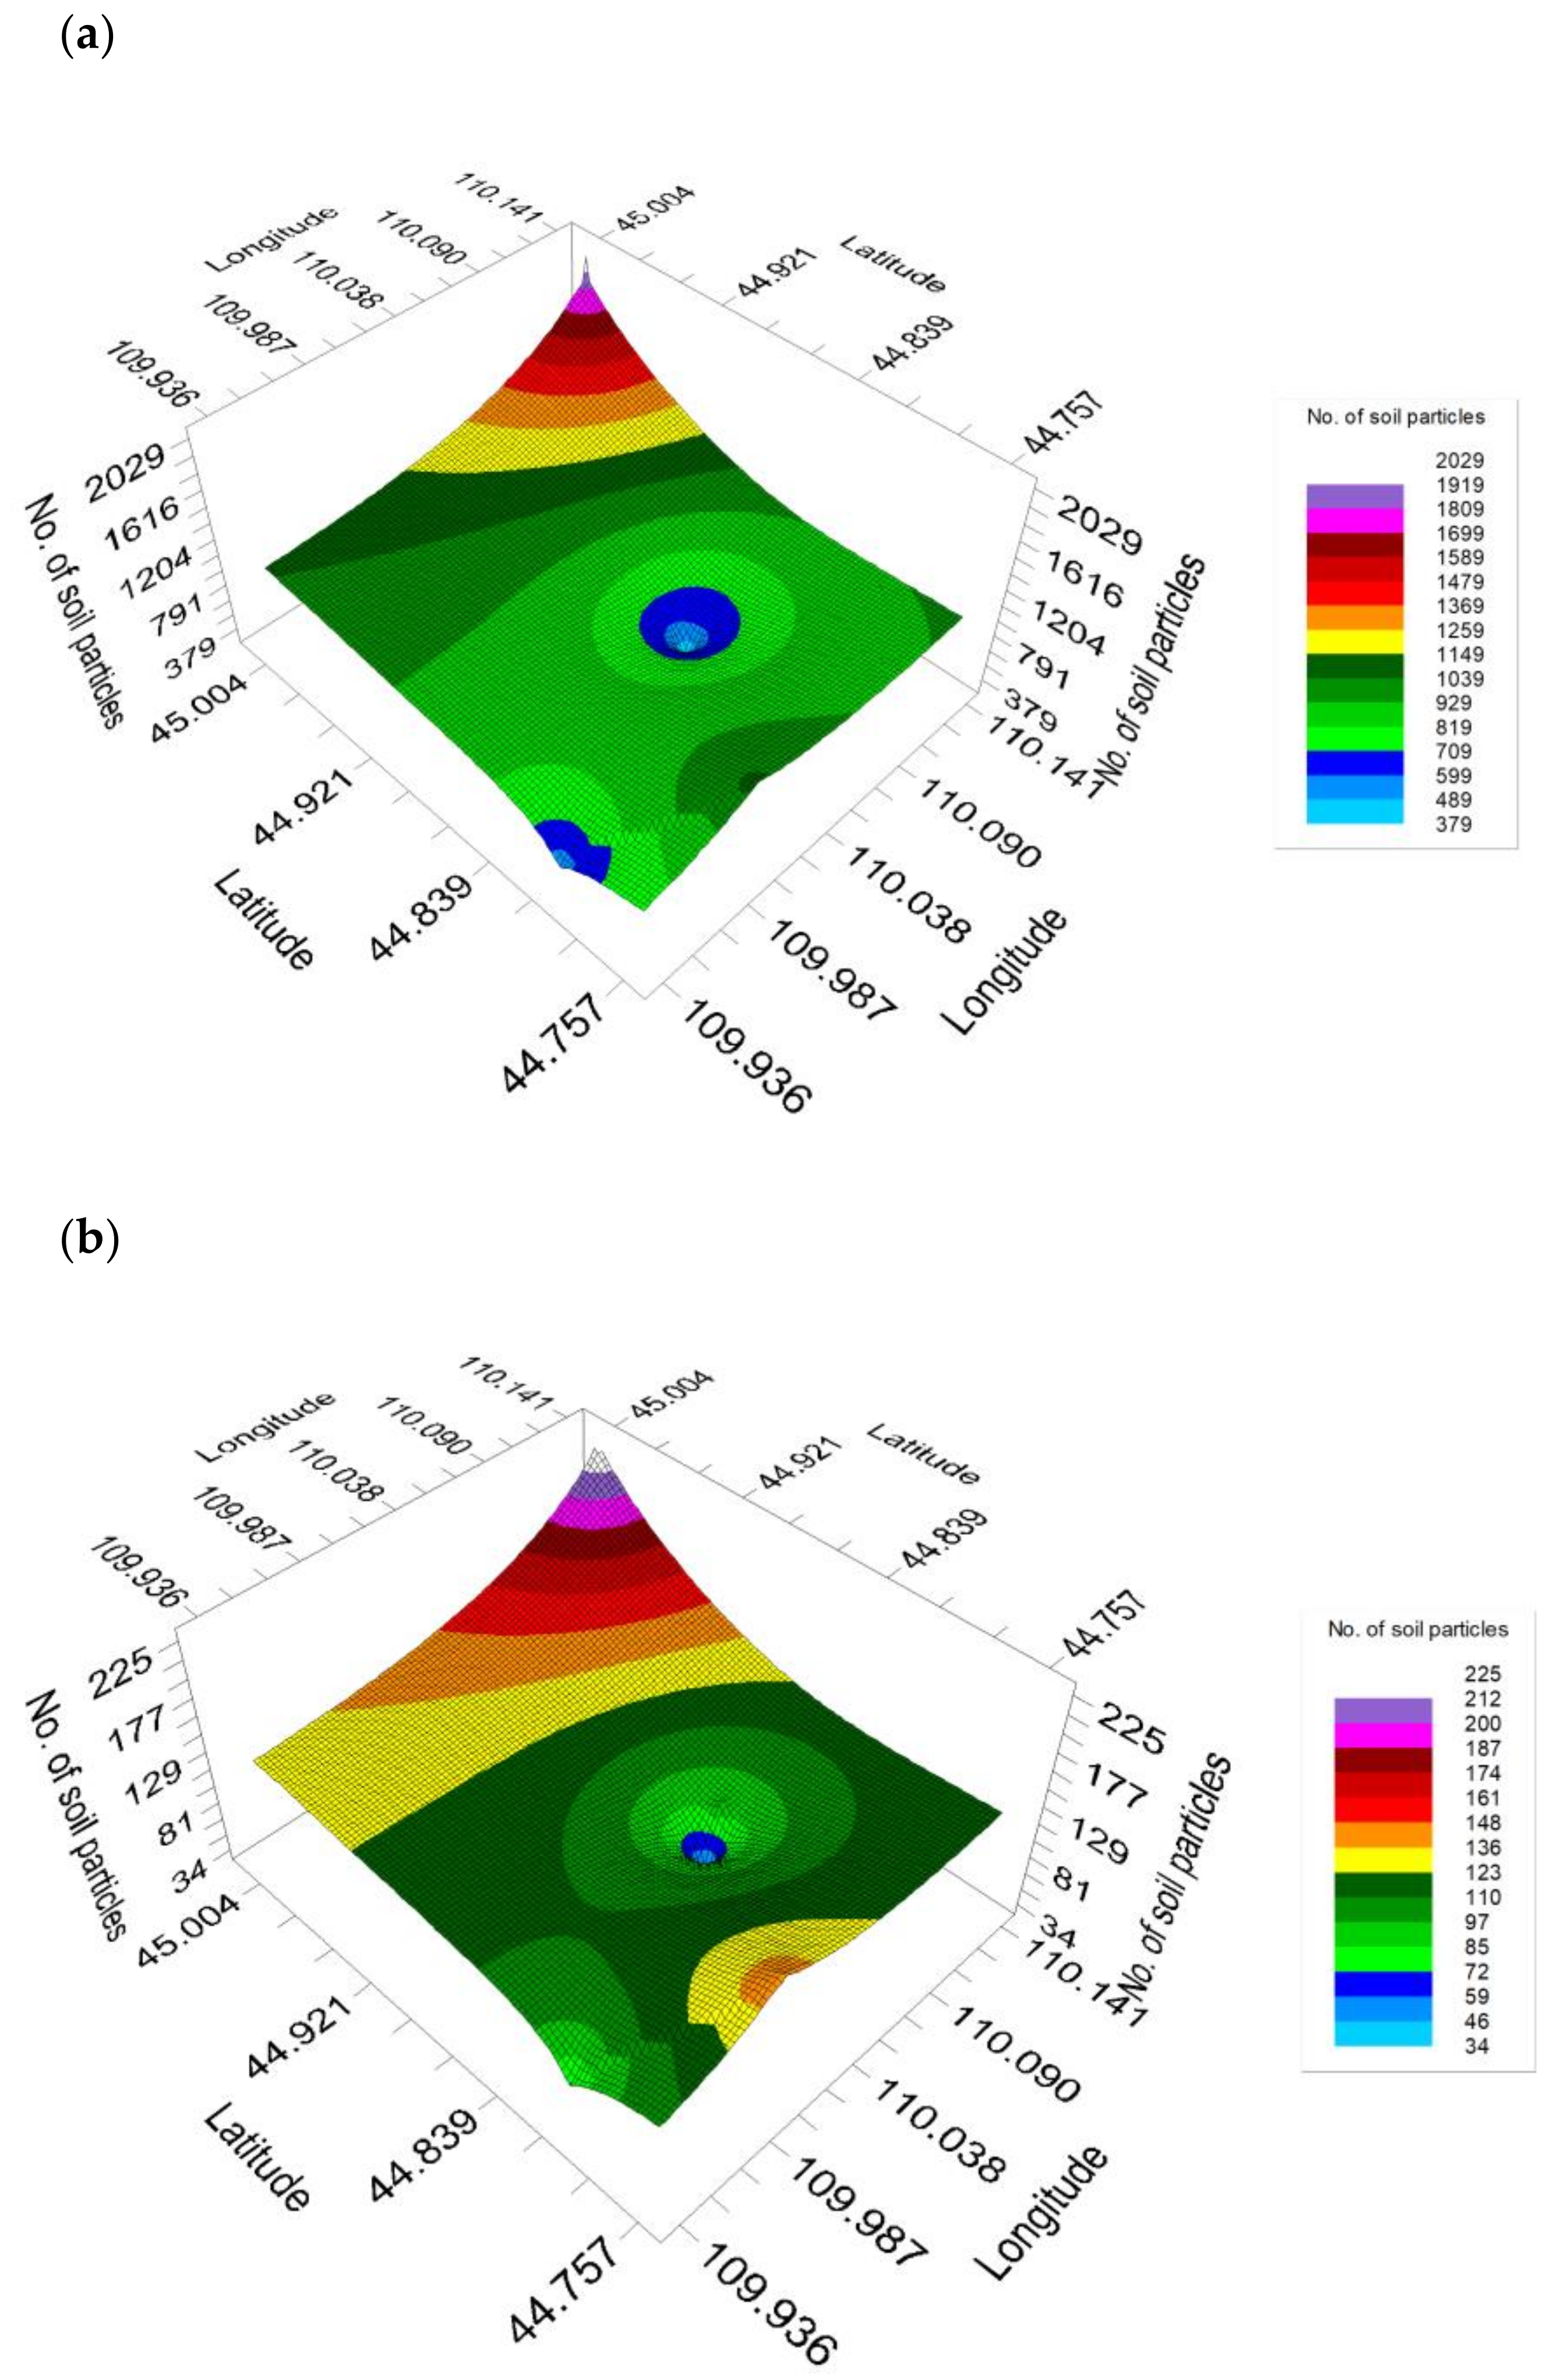
The relationship between topography and saltated particles was analyzed and drawn using GS + Geostatistics. Figure 4 shows the dust scattering concentration at a critical wind speed of 9 m/s along the latitude and longitude. The figure shows the number of saltated particles by the diameter together with latitude and longitude. The amount of saltated dust varies depending on the terrain. As shown in Figure 1, a large dry lake is distributed in the northeastern (high-latitude and high-longitude) part of this area, and a large amount of dust is present on the ground surface in the high-latitude and high-longitude directions.
The number of bacteria on the ground surface at the four locations was detected at the DL (107.0 CFU/g), the WA (106.5 CFU/g), the WE (107.3 CFU/g), and the DS (106.4 CFU/g), and the saltation experiment revealed that approximately 1/1000 of the number of live bacteria was saltated. Next, the total number of bacteria obtained from the culture of saltated bacteria in a container installed in the experiment tent was examined. In the examination of the number of saltated bacteria at four locations, 104–104.9 CFU/g was detected for 10 min blown by the fan. The WE had the largest number of bacteria (107.3 CFU/g) detected from the ground surface, and the number of saltated bacteria was 104.9 CFU/g (Table 2).
The bacteria detected in the saltation experiment belonged to six families at four sites. Supplementary Table S1 provides detailed information on the bacterial family determined by the 16s rDNA analysis detected at each location. It also shows the homology rate (%) with the sequences listed in the gene bank. In each region, the DL had the largest number of four families, followed by three families in the DS, and two families in the other two locations. The saltated bacterial families had similar results to those of bacterial species on previous surfaces. Bacillaceae was identified in the DL and WE, and Planococcaceae was identified in the DL and DS. Staphylococcaceae, generally detected in animals, was detected in the WA (104.6 CFU/g), suggesting that land use is related to animals. In the DL and WE, bacteria on the ground surface were easily saltated, and in the WA, animal-derived Staphylococcaceae were saltated. Micrococcaceae was detected at the DS and WE, and it is closely related to Arthrobacter through genetic analysis and is widely present in soil, suggesting that it may have been widely distributed in the layer directly below the ground surface and spread with scattering. In the WA, the dominant bacterial species, Staphylococcus, was detected following the saltation experiment (Figure 5).
4. Discussion
In this study, an artificial saltation experiment was conducted in the dust-generating area, and the conditions of the dispersed particles and the characteristics of the bacteria attached to them were compared with those on the ground surface. In the dust saltation experiment, a wind speed of 9 m/s was confirmed as a condition for dust scattering, and the saltated wind speed was found to be slightly different depending on the land use; however, the findings were almost identical. Dust particles were more likely to saltate near the WE due to overgrazing, and it could be seen that the WA was easily saltated in the wind, because the sand particle size was considerably small. This study revealed that the number of saltated particles differs depending on the geographical influence of dust saltation, and that the bacteria on the ground surface differ depending on the land use [34].
Bacterial diversity on the ground surface was similar to that previously reported [34,50,51]. When comparing the number of bacteria on the ground surface with the number of saltated bacteria, the number of bacteria was high in the DL and WE on the ground surface. However, the number of bacterial saltations was almost identical in each region. From this result, it was found that the numbers of saltated bacteria from the dust on the ground surface were similar with the same wind speed. Notably, the bacterial species differed depending on land use. Genetic analysis of each bacterial strain revealed that animal-derived bacteria Staphylococcaceae were detected in the WE and DL, which originated from animals. The genus Staphylococcus is associated with important health risks due to zoonotic diseases, including methicillin-resistant strains [52,53,54]. This finding assisted in characterizing the bacteria contained in the dust and reaffirmed the requirement for detailed public health research on dust and health [40,41,55].
Moreover, from the saltation experiment results, we found that the bacteria on the ground surface as indigenous bacteria did not always scatter with dust saltation. The sizes, structures, and components of dust particles to which these bacteria adhere would be influenced by bacterial binding to dust saltation. Soil moisture affects the critical friction rate; therefore, it shows that the effect of soil moisture on dust saltation is significant, as it is an important element of dust events [56]. Shao et al. reported that the dust particle size distribution depends on a surrogate for surface shear stress and a descriptor for saltation-bombardment intensity, which in turn is dependent on atmospheric boundary-layer stability [57]. In the DL and WE (soil moisture 3.0% and 6.5%, respectively), bacteria on the ground surface were easily lifted by artificial wind, and the WA (soil moisture 6.8%) was a land where dust with animal-derived bacteria blew relatively frequently. This indicates that bacterial saltation is observed at a soil humidity of 3.0–6.8% and a wind speed of >6.5 m/s. The DS has been shown to spread Micrococcaceae, which is detected from bacteria on the ground surface [34,58]. In addition, since the bacteria are closely related to Arthrobacter through genetic analysis and are widely presented in soil, they may have been widely distributed in the lower layers of the ground surface. In the saltation experiment, bacterial saltation of species other than those detected on the surface layer was observed by artificial wind. From this result, it was inferred that the dust layer on the ground surface was sequentially saltated by wind power and time. To understand this phenomenon, it is necessary to analyze the structure of sand on the ground surface and conduct multifaceted structural analysis, such as evaluating the molecular ionic strength of the dust surface and the degree of bonding between dust particles [59]. The number of bacteria was >104 CFU/g in the saltation experiment for 10 min. In an actual dust event, it is estimated that 100–1000 times this amount or more is present in the atmosphere. Therefore, it is easily presumed that humans and animals are exposed, and this could have a considerable effect on health [40,41,42,60,61]. These results support the relationship between the risk of various diseases and dust events.
In conclusion, the dust saltation occurred with live bacteria from the ground surface being released into the environment, and the bacterial species depended on land use and exhibited diversity. These findings indicate that the spatial movement of microorganisms occurs with dust saltation and maintains the diversity of the microbial layer in the environment. Furthermore, animal-derived bacteria can move spatially depending on their land use and weather conditions, thus requiring cross-border public health attention.
5. Patents
There is no patent matter in this manuscript.
Supplementary Materials
The following are available online at https://0-www-mdpi-com.brum.beds.ac.uk/article/10.3390/atmos12111456/s1, Table S1: Identification of bacteria family at research area (captions: location shows dry lake bed (DL), wadi (WA), well (WE), and desert steppe (DS); the sequence region is a variable region of 16s rDNA (V1-4); the homology rate (%) is shown as compared to the Genebank listed sequences; accession refers to the gene sequence accession number).
Author Contributions
Conceptualization, K.H. and B.H.; methodology, K.H. and B.H.; software, T.M., B.H. and P.T.; validation, B.H., T.M. and K.H.; formal analysis, T.M., K.B. and P.T.; investigation, T.M., P.T., K.B., K.H. and B.H.; resources, B.H., K.B. and K.H.; data curation, T.M., B.H. and K.H.; writing—original draft preparation, K.H. and T.M.; writing—review and editing, K.H. and B.H.; visualization, B.H.; supervision, K.H. and B.H.; project administration, K.H. and B.H.; funding acquisition, K.H., K.B. and B.H. All authors contributed equally. All authors have read and agreed to the published version of the manuscript.
Funding
This work was funded by JSPS KAKENHI, grant numbers: 25550079, JP16H02703, JP18H03608 and JP19H04362; this research also received research support from the joint research program of the Institute for Space-Earth Environmental Research, Nagoya University, in the form of external funding.
Institutional Review Board Statement
The study was conducted according to the guidelines of the Declaration of Helsinki, and approved by the Agriculture, Forestry, and Fisheries Plant Protection Station (29Y2490).
Informed Consent Statement
Not applicable.
Data Availability Statement
All the data are shown in the manuscript.
Acknowledgments
We would like to thank Kenji Kai (Ibaraki University) for providing valuable information and comments regarding the research. We would like to thank the Information and Research Institute of Meteorology, Hydrology and Environment, National Agency for Meteorology and Environmental Monitoring, Mongolia, for their cooperation. This work was supported by JSPS KAKENHI (grant numbers JP16H02703, JP18H03608, and JP19H04362), and part of the work was carried out by the joint research program of the Institute for Space-Earth Environmental Research, Nagoya University.
Conflicts of Interest
The authors declare no conflict of interest.
References
- Lelieveld, J.; Pöschl, U. Chemists Can Help to Solve the Air-Pollution Health Crisis. Nature 2017, 551, 291–293. [Google Scholar] [CrossRef] [PubMed]
- Cutler, S.J.; Fooks, A.R.; van der Poel, W.H. Public Health Threat of New, Reemerging, and Neglected Zoonoses in the Industrialized World. Emerg. Infect. Dis. 2010, 16, 1–7. [Google Scholar] [CrossRef]
- Otte, J.; Pica-Ciamarra, U. Emerging Infectious Zoonotic Diseases: The Neglected Role of Food Animals. One Health 2021, 13, 100323. [Google Scholar] [CrossRef]
- Magouras, I.; Brookes, V.J.; Jori, F.; Martin, A.; Pfeiffer, D.U.; Dürr, S. Emerging Zoonotic Diseases: Should We Rethink the Animal-Human Interface? Front. Vet. Sci. 2020, 7, 582743. [Google Scholar] [CrossRef] [PubMed]
- Miller, R.S.; Pepin, K.M. Board Invited Review: Prospects for Improving Management of Animal Disease Introductions Using Disease-Dynamic Models. J. Anim. Sci. 2019, 97, 2291–2307. [Google Scholar] [CrossRef] [Green Version]
- Tiwari, R.; Dhama, K.; Sharun, K.; Iqbal Yatoo, M.; Malik, Y.S.; Singh, R.; Michalak, I.; Sah, R.; Bonilla-Aldana, D.K.; Rodriguez-Morales, A.J. COVID-19: Animals, Veterinary and Zoonotic Links. Vet. Q. 2020, 40, 169–182. [Google Scholar] [CrossRef] [PubMed]
- Torres-Velez, F.; Havas, K.A.; Spiegel, K.; Brown, C. Transboundary Animal Diseases as Re-Emerging Threats—Impact on One Health. Semin. Diagn. Pathol. 2019, 36, 193–196. [Google Scholar] [CrossRef] [PubMed]
- Yadav, M.P.; Singh, R.K.; Malik, Y.S. Emerging and Transboundary Animal Viral Diseases: Perspectives and Preparedness. Livest. Dis. Manag. 2020, 1–25. [Google Scholar] [CrossRef] [Green Version]
- Jugder, D.; Shinoda, M.; Kimura, R.; Batbold, A.; Amarjargal, D. Quantitative Analysis on Windblown Dust Concentrations of PM10 (PM2.5) During Dust Events in Mongolia. Aeolian Res. 2014, 14, 3–13. [Google Scholar] [CrossRef]
- Shao, Y. Physics and Modelling of Wind Erosion; Springer Science and Business Media: New York, NY, USA, 2008. [Google Scholar]
- Hoshino, B.S.R.; Sofue, Y.; Demura, Y.; Purevsuren, T.; Hai, Y. Social Transition from Nomad to Settlement in the Mongolian Steppe and Its Impact on Japan; The Association for Kyosei Studies: Tokyo, Japan, 2015; Volume 9, pp. 1–27. [Google Scholar]
- Sugimoto, N.; Uno, I.; Nishikawa, M.; Shimizu, A.; Matsui, I.; Dong, X.; Chen, Y.; Quan, H. Record Heavy Asian Dust in Beijing in 2002: Observations and Model Analysis of Recent Events. Geophys. Res. Lett. 2003, 30, 1640. [Google Scholar] [CrossRef]
- Jugder, D.; Shinoda, M.; Sugimoto, N.; Matsui, I.; Nishikawa, M.; Park, S.-U.; Chun, Y.-S.; Park, M.-S. Spatial and Temporal Variations of Dust Concentrations in the Gobi Desert of Mongolia. Glob. Planet Chang. 2011, 78, 14–22. [Google Scholar] [CrossRef]
- Hoshino, B.; Sofue, Y.; Demura, Y.; Purevsuren, T.; Kuribayashi, M.; Baba, K.; Zoljargal, E.; Hagiwara, K.; Noda, J.; Kawano, K.; et al. Detection of Dry Lake Beds Formation and Estimate of Environmental Regime Shift in Semi-Arid Region. J. Arid Land Stud. 2018, 28, 109–113. [Google Scholar]
- Tsai, F.J.; Fang, Y.S.; Huang, S.J. Case Study of Asian Dust Event on March 19–25, 2010 and Its Impact on the Marginal Sea of China. J. Mar. Sci. Technol. 2013, 21, 353–360. [Google Scholar]
- Lin, C.Y.; Liu, S.C.; Chou, C.C.-K.; Liu, T.H.; Lee, C.-T.; Yuan, C.-S.; Shiu, C.-J.; Young, C.L. Long-Range Transport of Asian Dust and Air Pollutants to Taiwan. Terr. Atmos. Ocean. Sci. 2004, 15, 759–784. [Google Scholar] [CrossRef] [Green Version]
- Liu, G.R.; Lin, T.H. Application of Geostationary Satellite Observations for Monitoring Dust Storms of Asia. Terr. Atmos. Ocean. Sci. 2004, 15, 825–837. [Google Scholar] [CrossRef] [Green Version]
- Shaw, G.E. Transport of Asian Desert Aerosol to the Hawaiian Islands. J. Appl. Meteorol. 1980, 19, 1254–1259. [Google Scholar] [CrossRef] [Green Version]
- Parrington, J.R.; Zoller, W.H.; Aras, N.K. Asian Dust: Seasonal Transport to the Hawaiian Islands. Science 1983, 220, 195–197. [Google Scholar] [CrossRef]
- Uematsu, M.; Duce, R.A.; Prospero, J.M.; Chen, L.; Merrill, J.T.; McDonald, R.L. Transport of Mineral Aerosol from Asia Over the North Pacific Ocean. J. Geophys. Res. 1983, 88, 5343–5352. [Google Scholar] [CrossRef]
- Merrill, J.T.; Uematsu, M.; Bleck, R. Meteorological Analysis of Long Range Transport of Mineral Aerosols Over the North Pacific. J. Geophys. Res. 1989, 94, 8584–8598. [Google Scholar] [CrossRef]
- Ishizuka, M.; Mikami, M.; Yamada, Y.; Zeng, F. Threshold Friction Velocities of Saltation Sand Particles for Different Soil Moisture Conditions in the Taklimakan Desert. Sola 2009, 5, 184–187. [Google Scholar] [CrossRef] [Green Version]
- Shao, Y.; Dong, C.H. A review on East Asian Dust storm climate, modelling and monitoring. Glob. Planet. Chang. 2006, 52, 1–22. [Google Scholar] [CrossRef]
- Greeley, R.; White, B.R.; Pollack, J.B.; Iversen, J.D.; Leach, R.N. Dust Storms on Mars: Considerations and Simulations. NASA Technical Memorandum 78423. ID: 19780006043. 1977, pp. 1–30. Available online: https://research.engineering.ucdavis.edu/wind/wp-content/uploads/sites/17/2014/03/Greeley_1977_NASATM_Dust_Storms_on.pdf (accessed on 20 August 2020).
- Greeley, R.; White, B.R.; Pollack, J.B.; Iversen, J.D.; Leach, R.N. Dust storms on Mars: Considerations and simulations. In Desert Dust: Origin, Characteristics, and Effect on Man; Geological Society of America: Boulder, CO, USA, 1981; Volume 186, pp. 101–121. [Google Scholar]
- Greeley, R.; Iversen, J.D. Wind as a Geologic Process on Earth, Mars, Venus and Titan; Cambridge University Press: New York, NY, USA, 1985. [Google Scholar]
- Greeley, R. Toward an understanding of the Martian dust cycle, Dust on Mars ZZ. LPI Tech. Rept. 1986, 86-09, 29–31. [Google Scholar]
- Bagnold, R.A. The Physics of Blown Sand and Desert Dunes; Methuen: London, UK, 1941; p. 265. [Google Scholar]
- Greeley, R.; Lancaster, N.; Lee, S.; Thomas, P. Martian aeolian processes, sediments, and features. In Mars; Kieffer, H.H., Jakosky, B.M., Synder, C.W., Matthews, M.S., Eds.; University of Arizona Press: Tucson, AZ, USA, 1992; pp. 730–766. [Google Scholar]
- Greeley, R.; Kraft, M.; Sullivan, R.; Wilson, G.; Bridges, N.; Herkenhoff, K.; Kuzmin, O.; Malin, M.; Ward, W. Aeolian features and processes at the Mars Pathfinder landing site. J. Geophys. Res. Planets 1999, 104, 8573–8584. [Google Scholar] [CrossRef] [Green Version]
- NIES Research Booklet; Nishikawa, M. No. 8; National Institute for Environmental Studies: Tsukuba, Japan, 2003; p. 5. ISSN 1346-776X. (In Japanese)
- Greeley, R.; Bridges, N.T.; Kuzmin, R.O.; Laity, J.E. Terrestrial analogs to wind-related features at the Viking and Pathfinder landing sites on Mars. J. Geophys. Res. Planets 2002, 107, 5-1–5-22. [Google Scholar] [CrossRef] [Green Version]
- Greeley, R.; Balme, M.R.; Iversen, J.D.; Metzger, S.; Mickelson, R.; Phoreman, J.; White, B. Martian dust devils: Laboratory simulations of particle threshold. J. Geophys. Res. Planets 2003, 108. [Google Scholar] [CrossRef] [Green Version]
- Hagiwara, K.; Matsumoto, T.; Tsedendamba, P.; Baba, K.; Hoshino, B. Distribution of Viable Bacteria in the Dust-Generating Natural Source Area of the Gobi Region, Mongolia. Atmosphere 2020, 11, 893. [Google Scholar] [CrossRef]
- Fröhlich-Nowoisky, J.; Kampf, C.J.; Weber, B.; Huffman, J.A.; Pöhlker, C.; Andreae, M.O.; Lang-Yona, N.; Burrows, S.M.; Gunthe, S.S.; Elbert, W.; et al. Bioaerosols in the Earth system: Climate, health, and ecosystem interactions. Atmos. Res. 2016, 182, 346–376. [Google Scholar] [CrossRef] [Green Version]
- Ichinose, T.; Nishikawa, M.; Takano, H.; Sera, N.; Sadakane, K.; Mori, I.; Yanagisawa, R.; Oda, T.; Tamura, H.; Hiyoshi, K.; et al. Pulmonary Toxicity Induced by Intratracheal Instillation of Asian Yellow Dust (Kosa) in Mice. Environ. Toxicol. Pharmacol. 2005, 20, 48–56. [Google Scholar] [CrossRef] [PubMed]
- Yamaguchi, N.; Baba, T.; Ichijo, T.; Himezawa, Y.; Enoki, K.; Saraya, M.; Li, P.F.; Nasu, M. Abundance and Community Structure of Bacteria on Asian Dust Particles Collected in Beijing, China, During the Asian Dust Season. Biol. Pharm. Bull. 2016, 39, 68–77. [Google Scholar] [CrossRef] [PubMed] [Green Version]
- Takeuchi, S.; Kojima, H.; Saito, I.; Jin, K.; Kobayashi, S.; Tanaka-Kagawa, T.; Jinno, H. Detection of 34 Plasticizers and 25 Flame Retardants in Indoor Air from Houses in Sapporo, Japan. Sci. Total Environ. 2014, 491–492, 28–33. [Google Scholar] [CrossRef]
- Tang, K.; Huang, Z.; Huang, J.; Maki, T.; Zhang, S.; Shimizu, A.; Ma, X.; Shi, J.; Bi, J.; Zhou, T.; et al. Characterization of Atmospheric Bioaerosols Along the Transport Pathway of Asian Dust During the Dust-Bioaerosol 2016 Campaign. Atmos. Chem. Phys. 2018, 18, 7131–7148. [Google Scholar] [CrossRef] [Green Version]
- Martiny, J.B.; Bohannan, B.J.; Brown, J.H.; Colwell, R.K.; Fuhrman, J.A.; Green, J.L.; Horner-Devine, M.C.; Kane, M.; Krumins, J.A.; Kuske, C.R.; et al. Microbial Biogeography: Putting Microorganisms on the Map. Nat. Rev. Microbiol. 2006, 4, 102–112. [Google Scholar] [CrossRef] [PubMed]
- Griffin, D.W. Atmospheric Movement of Microorganisms in Clouds of Desert Dust and Implications for Human Health. Clin. Microbiol. Rev. 2007, 20, 459–477. [Google Scholar] [CrossRef] [Green Version]
- Higashi, T.; Kambayashi, Y.; Ohkura, N.; Fujimura, M.; Nakanishi, S.; Yoshizaki, T.; Saijoh, K.; Hayakawa, K.; Kobayashi, F.; Michigami, Y.; et al. Exacerbation of Daily Cough and Allergic Symptoms in Adult Patients with Chronic Cough by Asian Dust: A Hospital-Based Study in Kanazawa. Atmos. Environ. 2014, 97, 537–543. [Google Scholar] [CrossRef] [Green Version]
- Demura, Y.; Hoshino, B.; Baba, K.; McCarthy, C.; Sofue, Y.; Kai, K.; Purevsuren, T.; Hagiwara, K.; Noda, J. Determining the Frequency of Dry Lake Bed Formation in Semi-Arid Mongolia From Satellite Data. Land 2017, 6, 88. [Google Scholar] [CrossRef] [Green Version]
- Sofue, Y.; Hoshino, B.; Demura, Y.; Kai, K.; Baba, K.; Nduati, E.; Kondoh, A.; Sternberg, T. Satellite Monitoring of Vegetation Response to Precipitation and Dust Storm Outbreaks in Gobi Desert Regions. Land 2018, 7, 19. [Google Scholar] [CrossRef] [Green Version]
- Wieringa, J. Updating the Davenport Roughness Classification. J. Wind Eng. Ind. Aér. 1992, 41, 357–368. [Google Scholar] [CrossRef]
- Davenport, A.G. Rationale for Determining Design Wind Velocities. J. Struct. Div. 1960, 86, 39–68. [Google Scholar] [CrossRef]
- Garrity, G.M.; Bell, J.A.; Lilburn, T.G. Taxonomic Outline of the Prokaryotes. In Bergey’s Manual of Systematic Bacteriology; Springer: New York, NY, USA; Berlin/Heidelberg, Germany, 2004. [Google Scholar]
- Bio Edit (a Biological Sequence Alignment Editor, Version 7.0.9). Available online: https://bioedit.software.informer.com (accessed on 20 August 2020).
- Mega, X. (Molecular Evolutionary Genetics Analysis across Computing Platforms, Version 10). Available online: https://www.megasoftware.net (accessed on 20 August 2020).
- Kenzaka, T.; Sueyoshi, A.; Baba, T.; Li, P.; Tani, K.; Yamaguchi, N.; Nasu, M. Soil Microbial Community Structure in an Asian Dust Source Region (Loess Plateau). Microbes Environ. 2010, 25, 53–57. [Google Scholar] [CrossRef] [Green Version]
- Yang, Y.; Dou, Y.; An, S. Testing Association Between Soil Bacterial Diversity and Soil Carbon Storage on the Loess Plateau. Sci. Total Environ. 2018, 626, 48–58. [Google Scholar] [CrossRef]
- Becker, K.; Ballhausen, B.; Köck, R.; Kriegeskorte, A. Methicillin Resistance in Staphylococcus Isolates: The “mec Alphabet” with Specific Consideration of mecC, a mec Homolog Associated with Zoonotic S. aureus Lineages. Int. J. Med. Microbiol. 2014, 304, 794–804. [Google Scholar] [CrossRef] [PubMed]
- Vishnupriya, S.; Antony, P.X.; Mukhopadhyay, H.K.; Pillai, R.M.; Thanislass, J.; Vivek Srinivas, V.M.; Sumanth Kumar, R. Methicillin Resistant Staphylococci Associated with Bovine Mastitis and Their Zoonotic Importance. Vet. World 2014, 7, 422–427. [Google Scholar] [CrossRef] [Green Version]
- Becker, K. Methicillin-Resistant Staphylococci and Macrococci at the Interface of Human and Animal Health. Toxins 2021, 13, 61. [Google Scholar] [CrossRef]
- Clauß, M. Emission of Bioaerosols from Livestock Facilities: Methods and Results from Available Bioaerosol Investigations in and Around Agricultural Livestock Farming; Thünen Working Paper: Braunschweig, Germany, 2020; Volume 138a. [Google Scholar]
- Yang, X.; Yang, F.; Zhou, C.; Mamtimin, A.; Huo, W.; He, Q. Improved Parameterization for Effect of Soil Moisture on Threshold Friction Velocity for Saltation Activity Based on Observations in the Taklimakan Desert. Geoderma 2020, 369, 114322. [Google Scholar] [CrossRef]
- Shao, Y.; Zhang, J.; Ishizuka, M.; Mikami, M.; Leys, J.; Huang, N. Dependency of Particle Size Distribution at Dust Emission on Friction Velocity and Atmospheric Boundary-Layer Stability. Atmos. Chem. Phys. 2020, 20, 12939–12953. [Google Scholar] [CrossRef]
- Takahashi, Y. Exploitation of New Microbial Resources for Bioactive Compounds and Discovery of New Actinomycetes. Actinomycetologica 2004, 18, 54–61. [Google Scholar] [CrossRef]
- Zhang, H.; Zhou, Y.H. Reconstructing the Electrical Structure of Dust Storms from Locally Observed Electric Field Data. Nat. Commun. 2020, 11, 5072. [Google Scholar] [CrossRef]
- Goudarzi, G.; Daryanoosh, S.M.; Godini, H.; Hopke, P.K.; Sicard, P.; De Marco, A.; Rad, H.D.; Harbizadeh, A.; Jahedi, F.; Mohammadi, M.J.; et al. Health Risk Assessment of Exposure to the Middle-Eastern Dust Storms in the Iranian Megacity of Kermanshah. Public Health 2017, 148, 109–116. [Google Scholar] [CrossRef]
- Soleimani, Z.; Teymouri, P.; Darvishi Boloorani, A.D.; Mesdaghinia, A.; Middleton, N.; Griffin, D.W. An Overview of Bioaerosol Load and Health Impacts Associated with Dust Storms: A Focus on the Middle East. Atmos. Environ. 2020, 223, 117187. [Google Scholar] [CrossRef]
Figure 1.
The study points are shown on the map, where (a) indicates the location in Mongolia, and (b) indicates the four research survey points. The vertical axis shows latitude, the horizontal axis shows longitude, and the numbers show the altitude; (c) the study points in Sentinel 2 image.
Figure 1.
The study points are shown on the map, where (a) indicates the location in Mongolia, and (b) indicates the four research survey points. The vertical axis shows latitude, the horizontal axis shows longitude, and the numbers show the altitude; (c) the study points in Sentinel 2 image.

Figure 2.
Outline of the saltation experiment. The inlet and the fan installation box are connected to one side of the tent, and the air is blown by the fan. For saltated dust, a particle counter probe is installed on the opposite side of the tent. A sterilized Petri dish that captures dust particles is placed in the center (dot mark point). (a) top view, and (b) side view shown the mobile dust chamber for the measurement of particle concentrations.

Figure 3.
The particle data are analyzed by kernel density by saltation experiment. The figure shows the pattern of dust particle saltation at study sites according to the wind speed. Dust particles are more likely to saltate near the well due to overgrazing, and it can be seen that the wadi is easy to saltate in the wind because the size of the sand particles is considerably small. The measurement results at each location are shown in the particle size (3 μm, 5 μm), (A) well, (B) wadi, (C) dry lake, and (D) desert steppe.

Figure 4.
The relationship between topography and saltated particles was analyzed and drawn by GS + Geostatistics. The figure shows the dust scattering concentration at a critical wind speed of 9 m/s with latitude and longitude. (a) is 3 µm particles, and (b) is 5 µm particles.
Figure 4.
The relationship between topography and saltated particles was analyzed and drawn by GS + Geostatistics. The figure shows the dust scattering concentration at a critical wind speed of 9 m/s with latitude and longitude. (a) is 3 µm particles, and (b) is 5 µm particles.

Figure 5.
The bacterial species isolated from the dust saltation particles are shown in a pie chart. Each color chart shows the detection rate of each bacterial family at each research area, (a) dry lake bed, (b) well, (c) wadi, and (d) desert steppe.
Figure 5.
The bacterial species isolated from the dust saltation particles are shown in a pie chart. Each color chart shows the detection rate of each bacterial family at each research area, (a) dry lake bed, (b) well, (c) wadi, and (d) desert steppe.


Table 1.
Environmental information at the observation point.
| Location | Ground Surface Temperature (°C) | Soil Moisture (%) | Temperature (°C) | Humidity (%) |
|---|---|---|---|---|
| Well | 40.2 | 3.0 | 26 | 14 |
| Wadi | 37.8 | 6.8 | 19.7 | 19 |
| Dry lake bed | 41.4 | 6.5 | 22.5 | 20 |
| Desert Steppe | 37.8 | 6.8 | 19.7 | 19 |
Data show the average value of five measurements.
Table 2.
Comparison between the number of bacteria on the ground surface and saltation bacteria.
| Location | Surface Bacteria | Saltation Bacteria | ||
|---|---|---|---|---|
| Total (log CFU/g) | Total (log CFU/g) | Family | log CFU/g | |
| Dry lake bed | 7.0 | 4.1 | Bacillaceae | 3.7 |
| Planococcaceae | 3.7 | |||
| Micrococcaceae | 3.2 | |||
| Cellulomonadaceae | 3.2 | |||
| Wadi | 6.5 | 4.5 | Staphylococcaceae | 4.4 |
| Streptomycetaceae | 3.5 | |||
| Well | 7.3 | 4.9 | Bacillaceae | 4.7 |
| Micrococcaceae | 4.4 | |||
| Desert Steppe | 6.4 | 4.0 | Micrococcaceae | 3.7 |
| Planococcaceae | 3.5 | |||
| Streptomycetaceae | 3.2 | |||
Publisher’s Note: MDPI stays neutral with regard to jurisdictional claims in published maps and institutional affiliations. |
© 2021 by the authors. Licensee MDPI, Basel, Switzerland. This article is an open access article distributed under the terms and conditions of the Creative Commons Attribution (CC BY) license (https://creativecommons.org/licenses/by/4.0/).
Share and Cite
MDPI and ACS Style
Hagiwara, K.; Matsumoto, T.; Tsedendamba, P.; Baba, K.; Hoshino, B. Bacterial Characteristics of Dust Particle Saltation in Gobi Dust Sites, Mongolia. Atmosphere 2021, 12, 1456. https://0-doi-org.brum.beds.ac.uk/10.3390/atmos12111456
AMA Style
Hagiwara K, Matsumoto T, Tsedendamba P, Baba K, Hoshino B. Bacterial Characteristics of Dust Particle Saltation in Gobi Dust Sites, Mongolia. Atmosphere. 2021; 12(11):1456. https://0-doi-org.brum.beds.ac.uk/10.3390/atmos12111456
Chicago/Turabian StyleHagiwara, Katsuro, Tamaki Matsumoto, Purevsuren Tsedendamba, Kenji Baba, and Buho Hoshino. 2021. "Bacterial Characteristics of Dust Particle Saltation in Gobi Dust Sites, Mongolia" Atmosphere 12, no. 11: 1456. https://0-doi-org.brum.beds.ac.uk/10.3390/atmos12111456
Note that from the first issue of 2016, this journal uses article numbers instead of page numbers. See further details here.