
Observational Analysis of a Wind Gust Event during the Merging of a Bow Echo and Mini-Supercell in Southeastern China

 , ,
, , 
Abstract
:1. Introduction
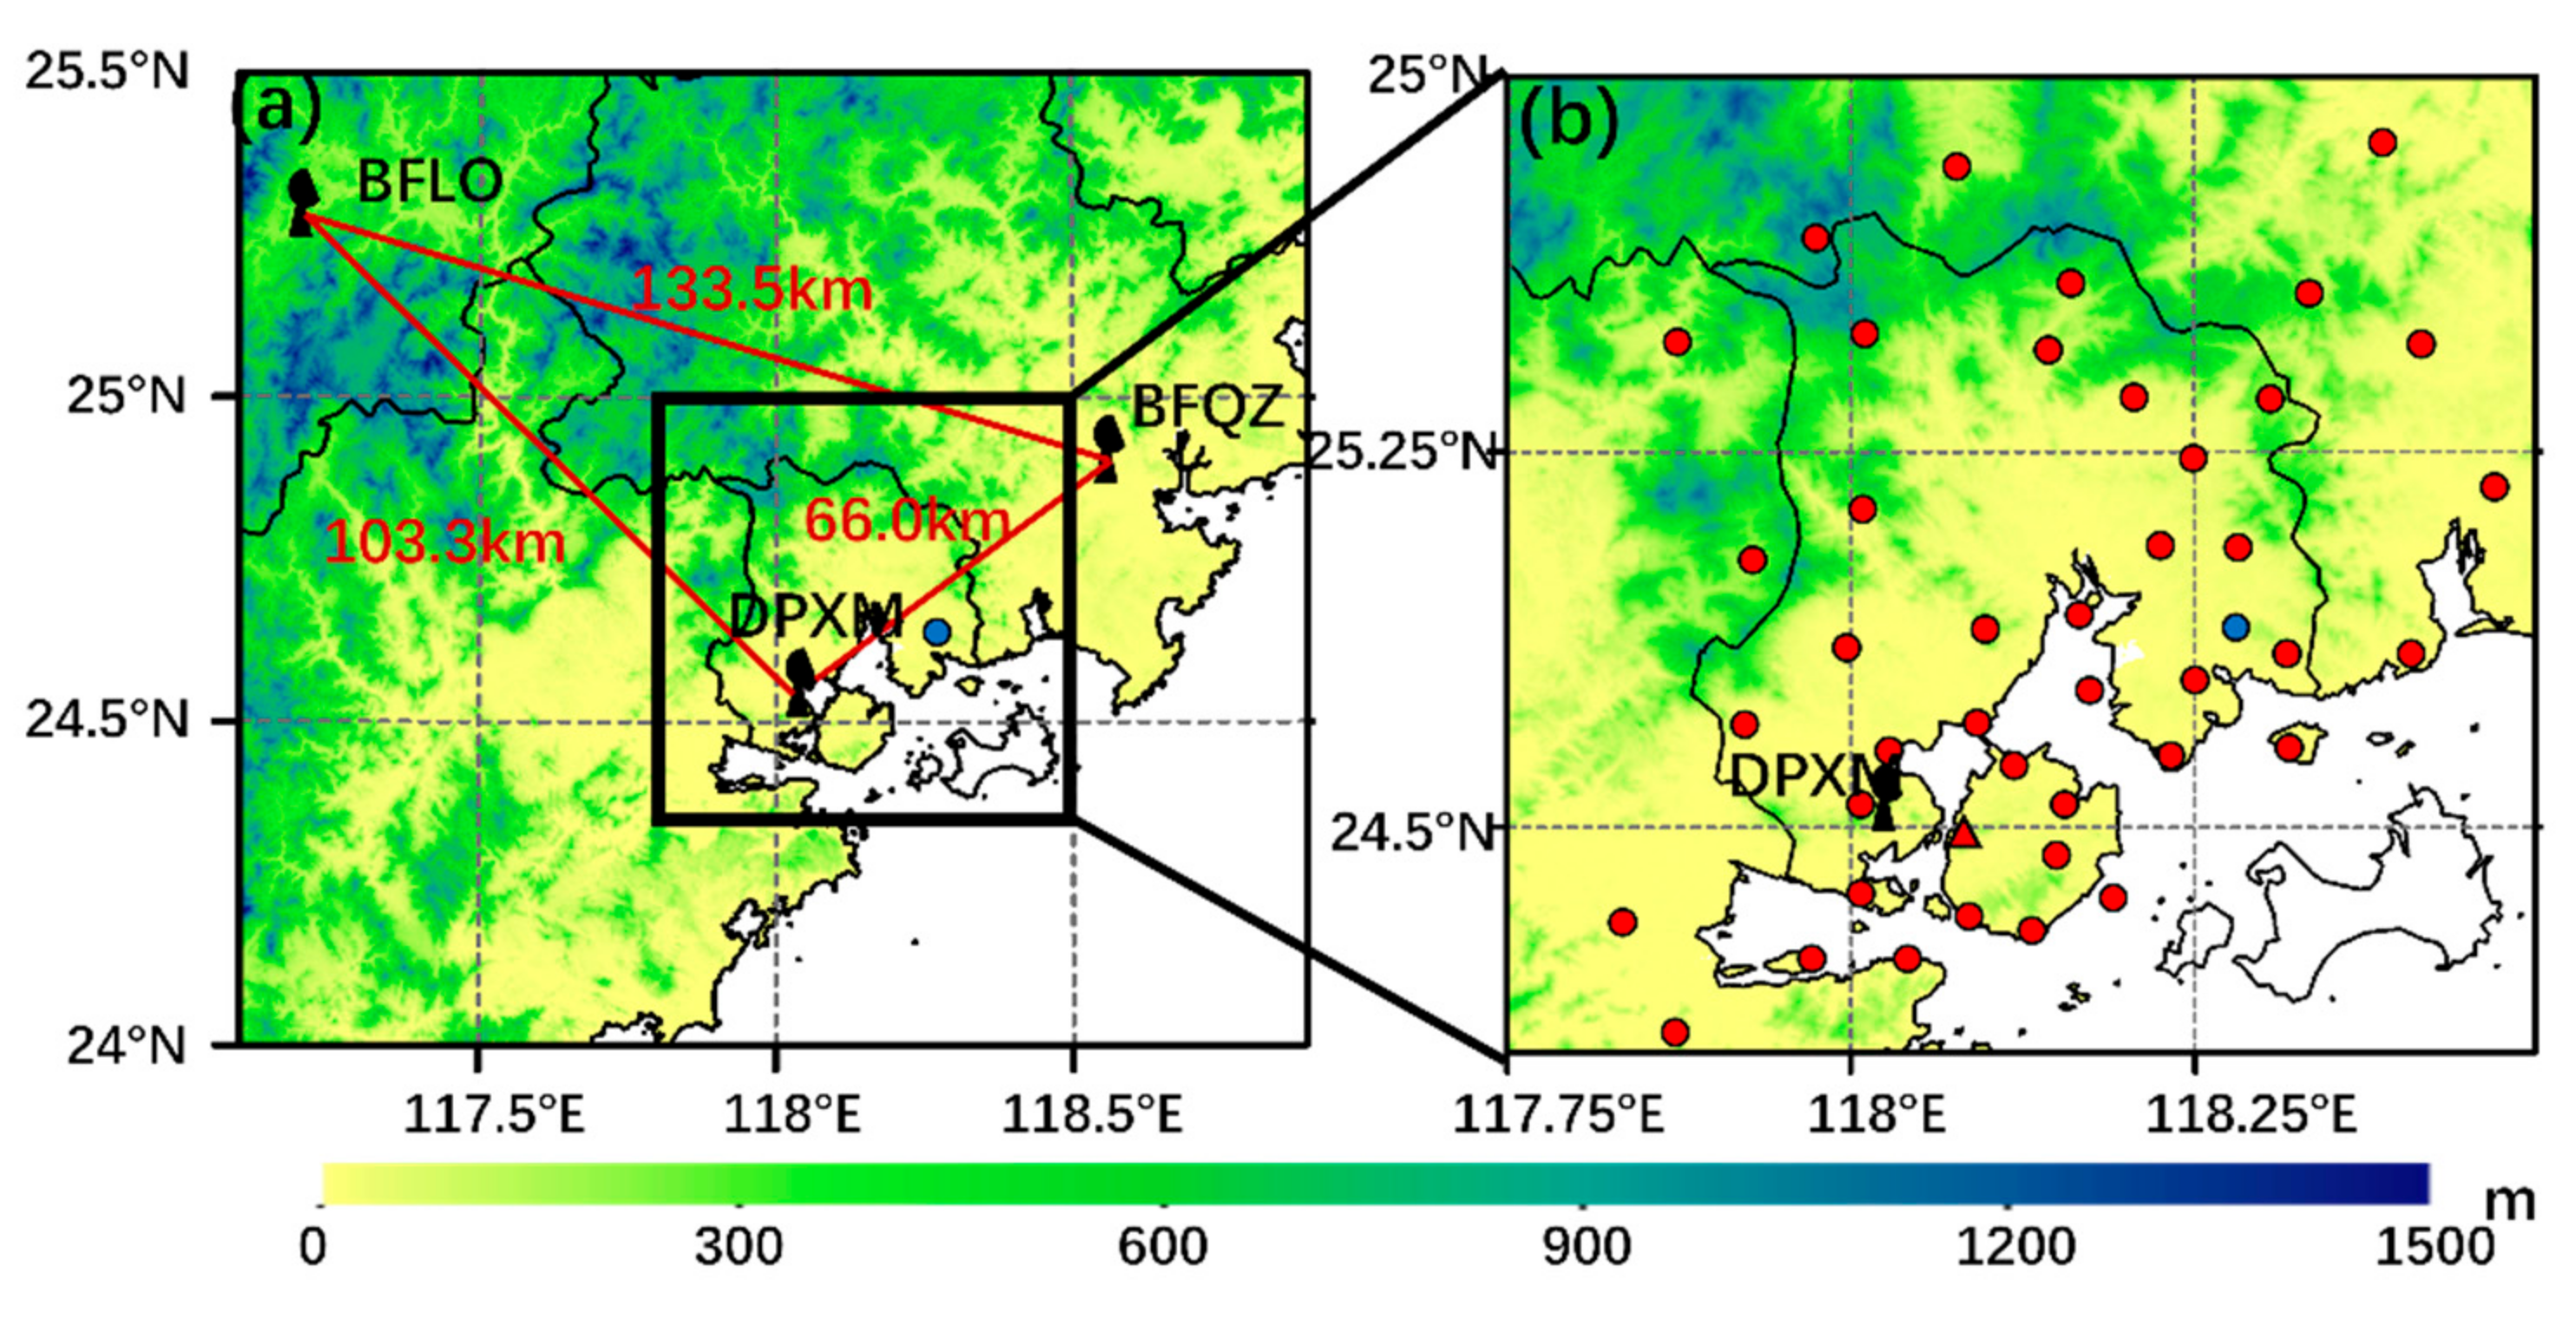
2. Data and Methods
2.1. Data
2.2. Processing of Radar Data
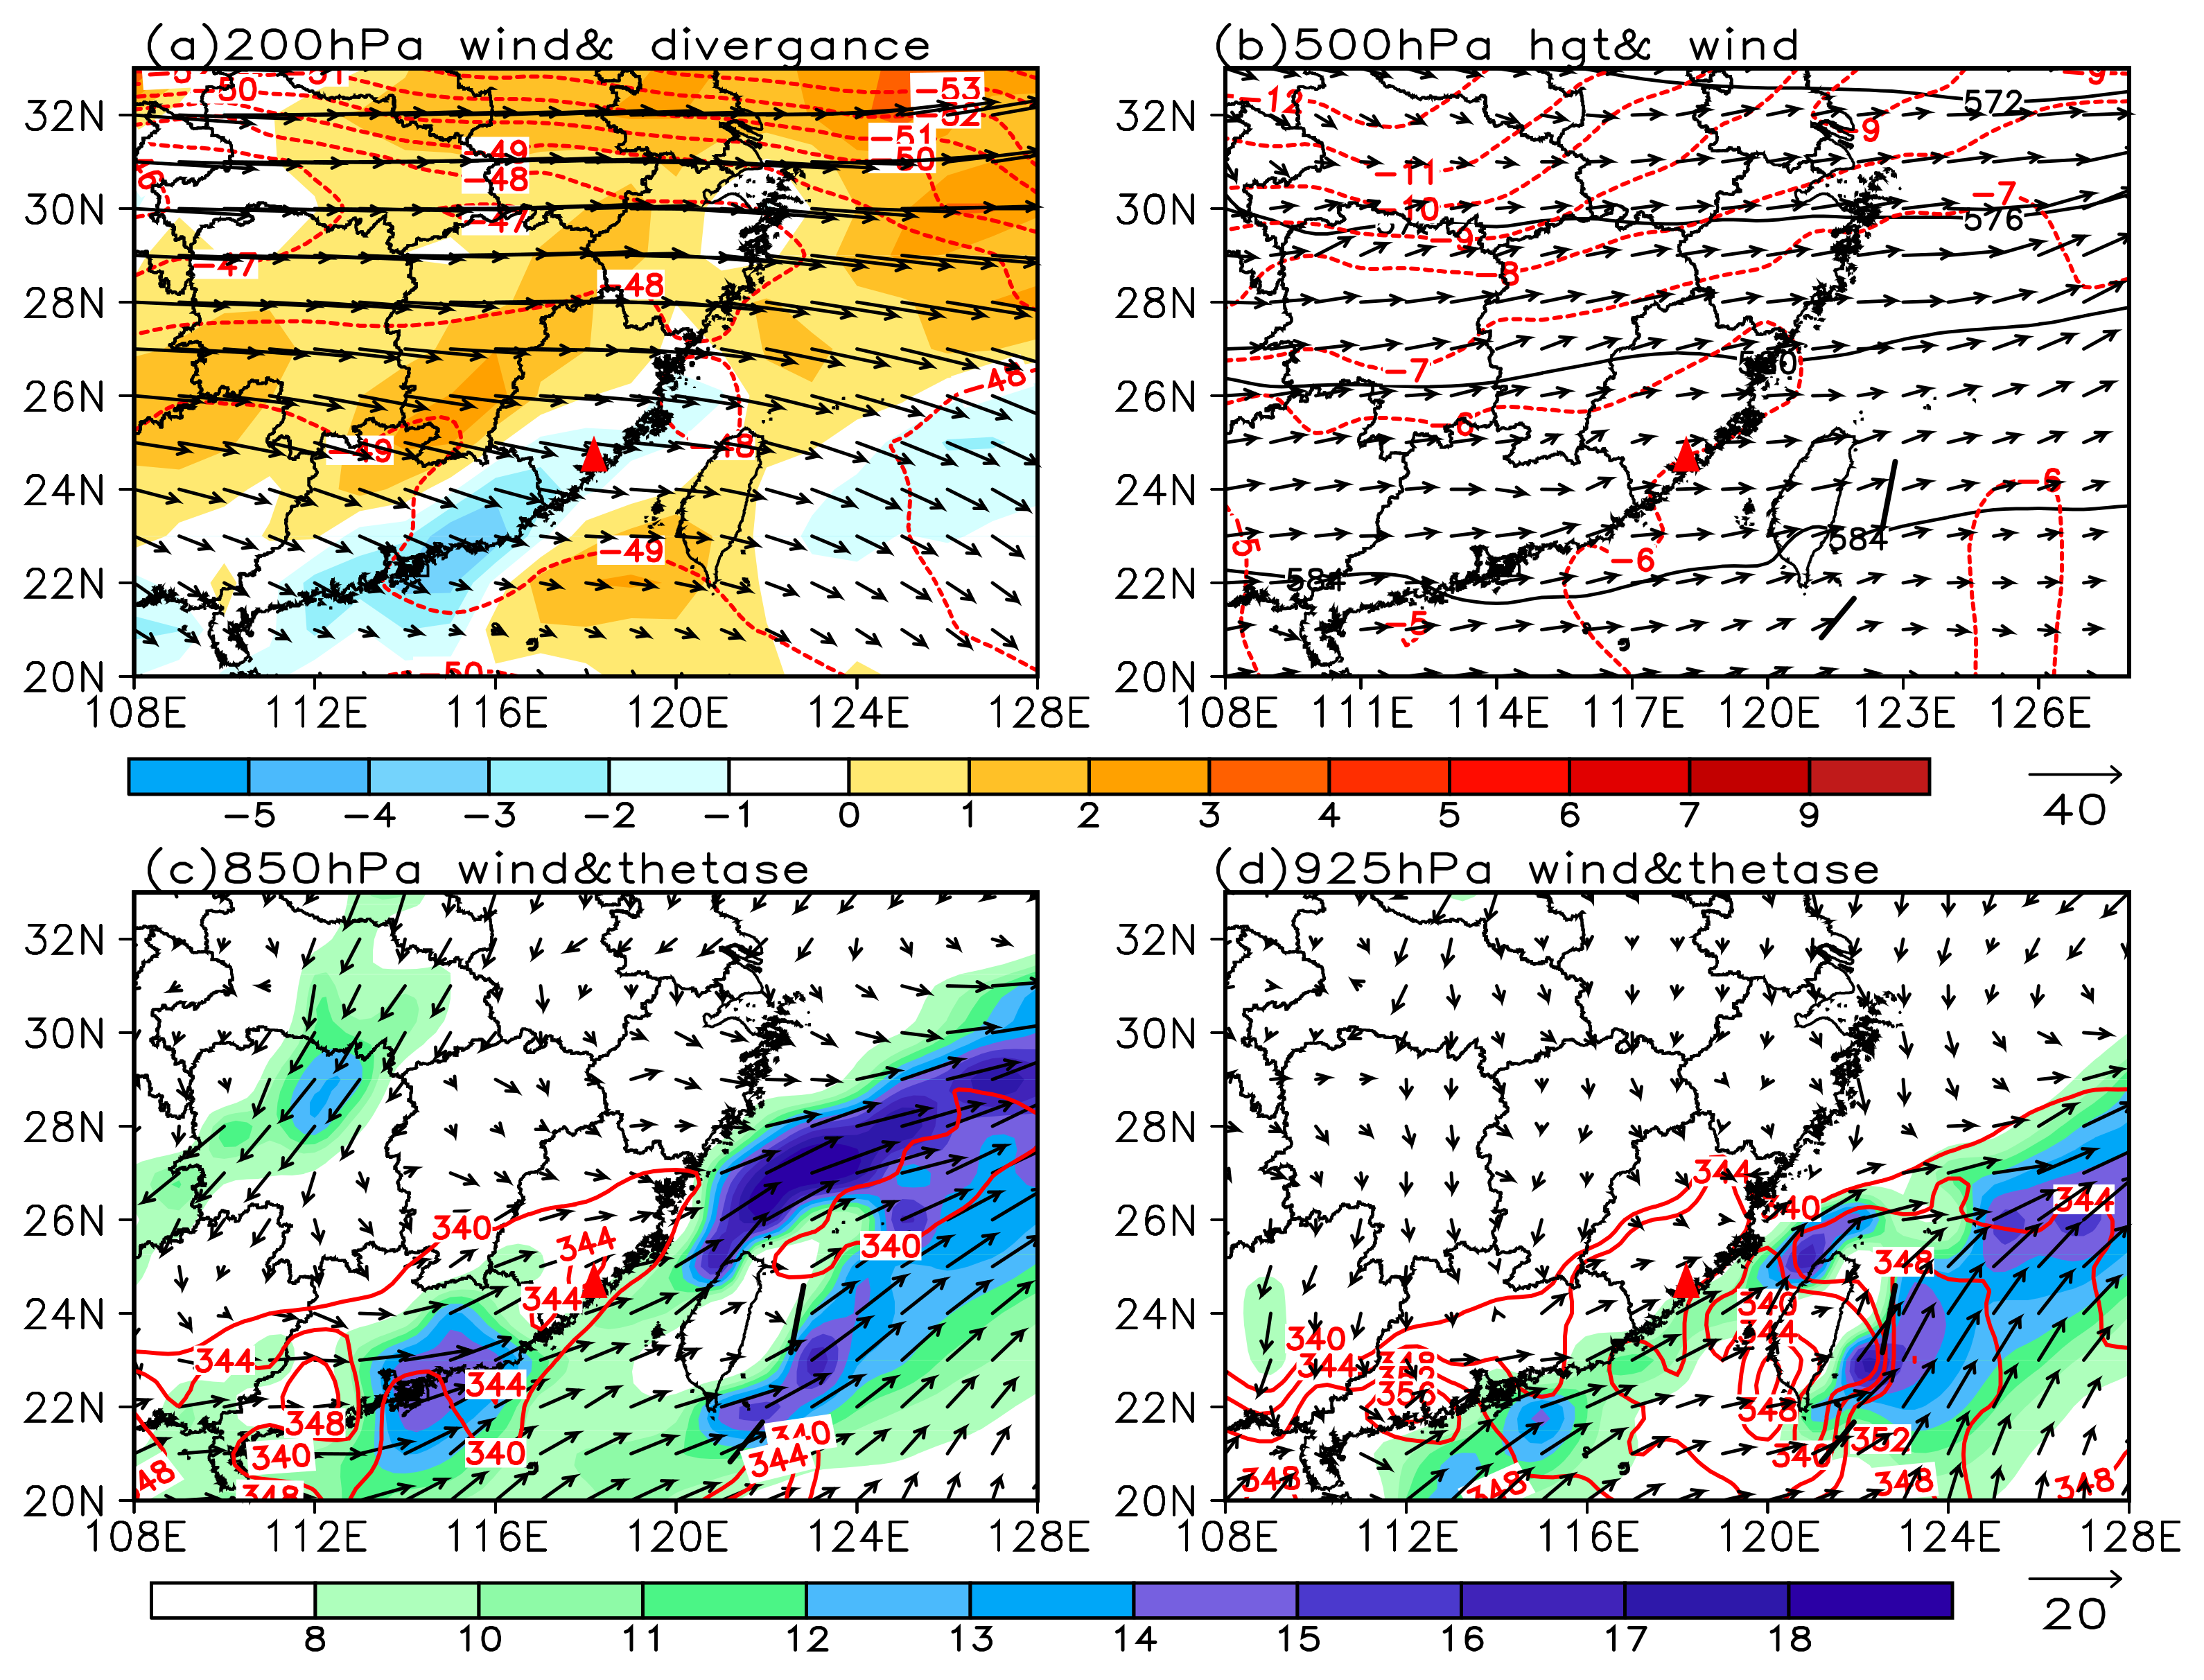
3. Synoptic Pattern and Convective Environment Overview
3.1. Synoptic Pattern
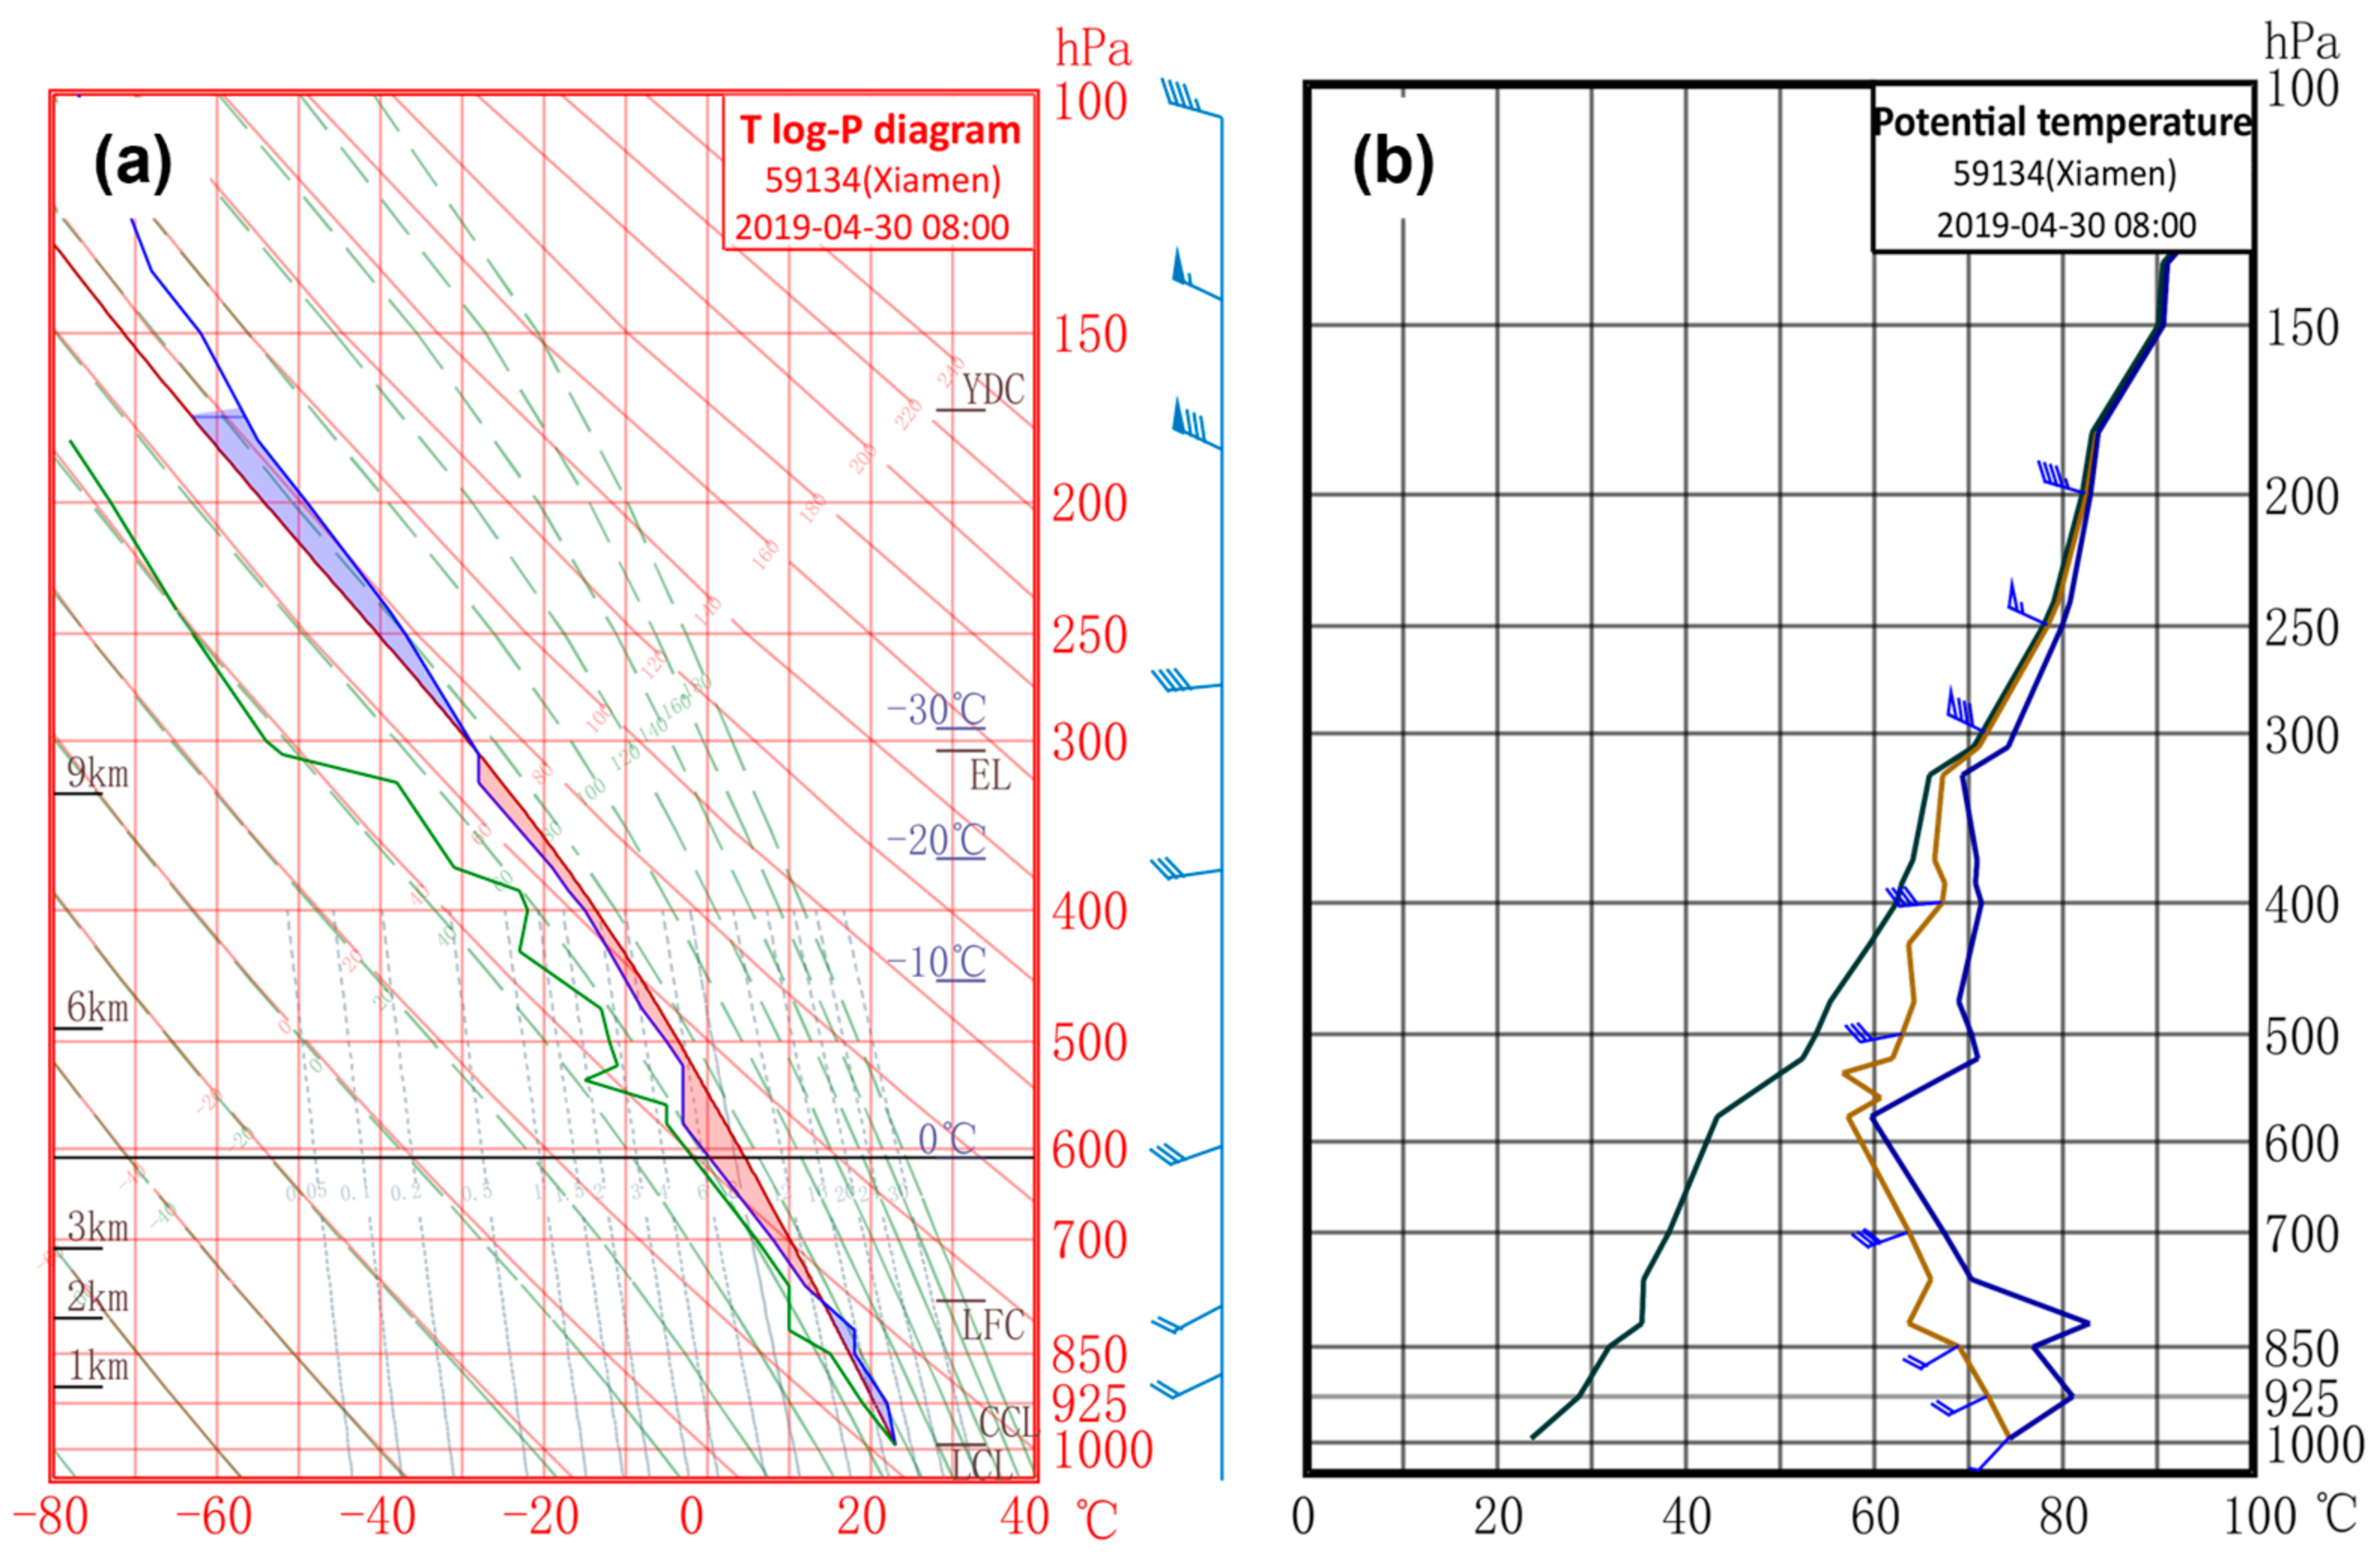
3.2. Convective Environment
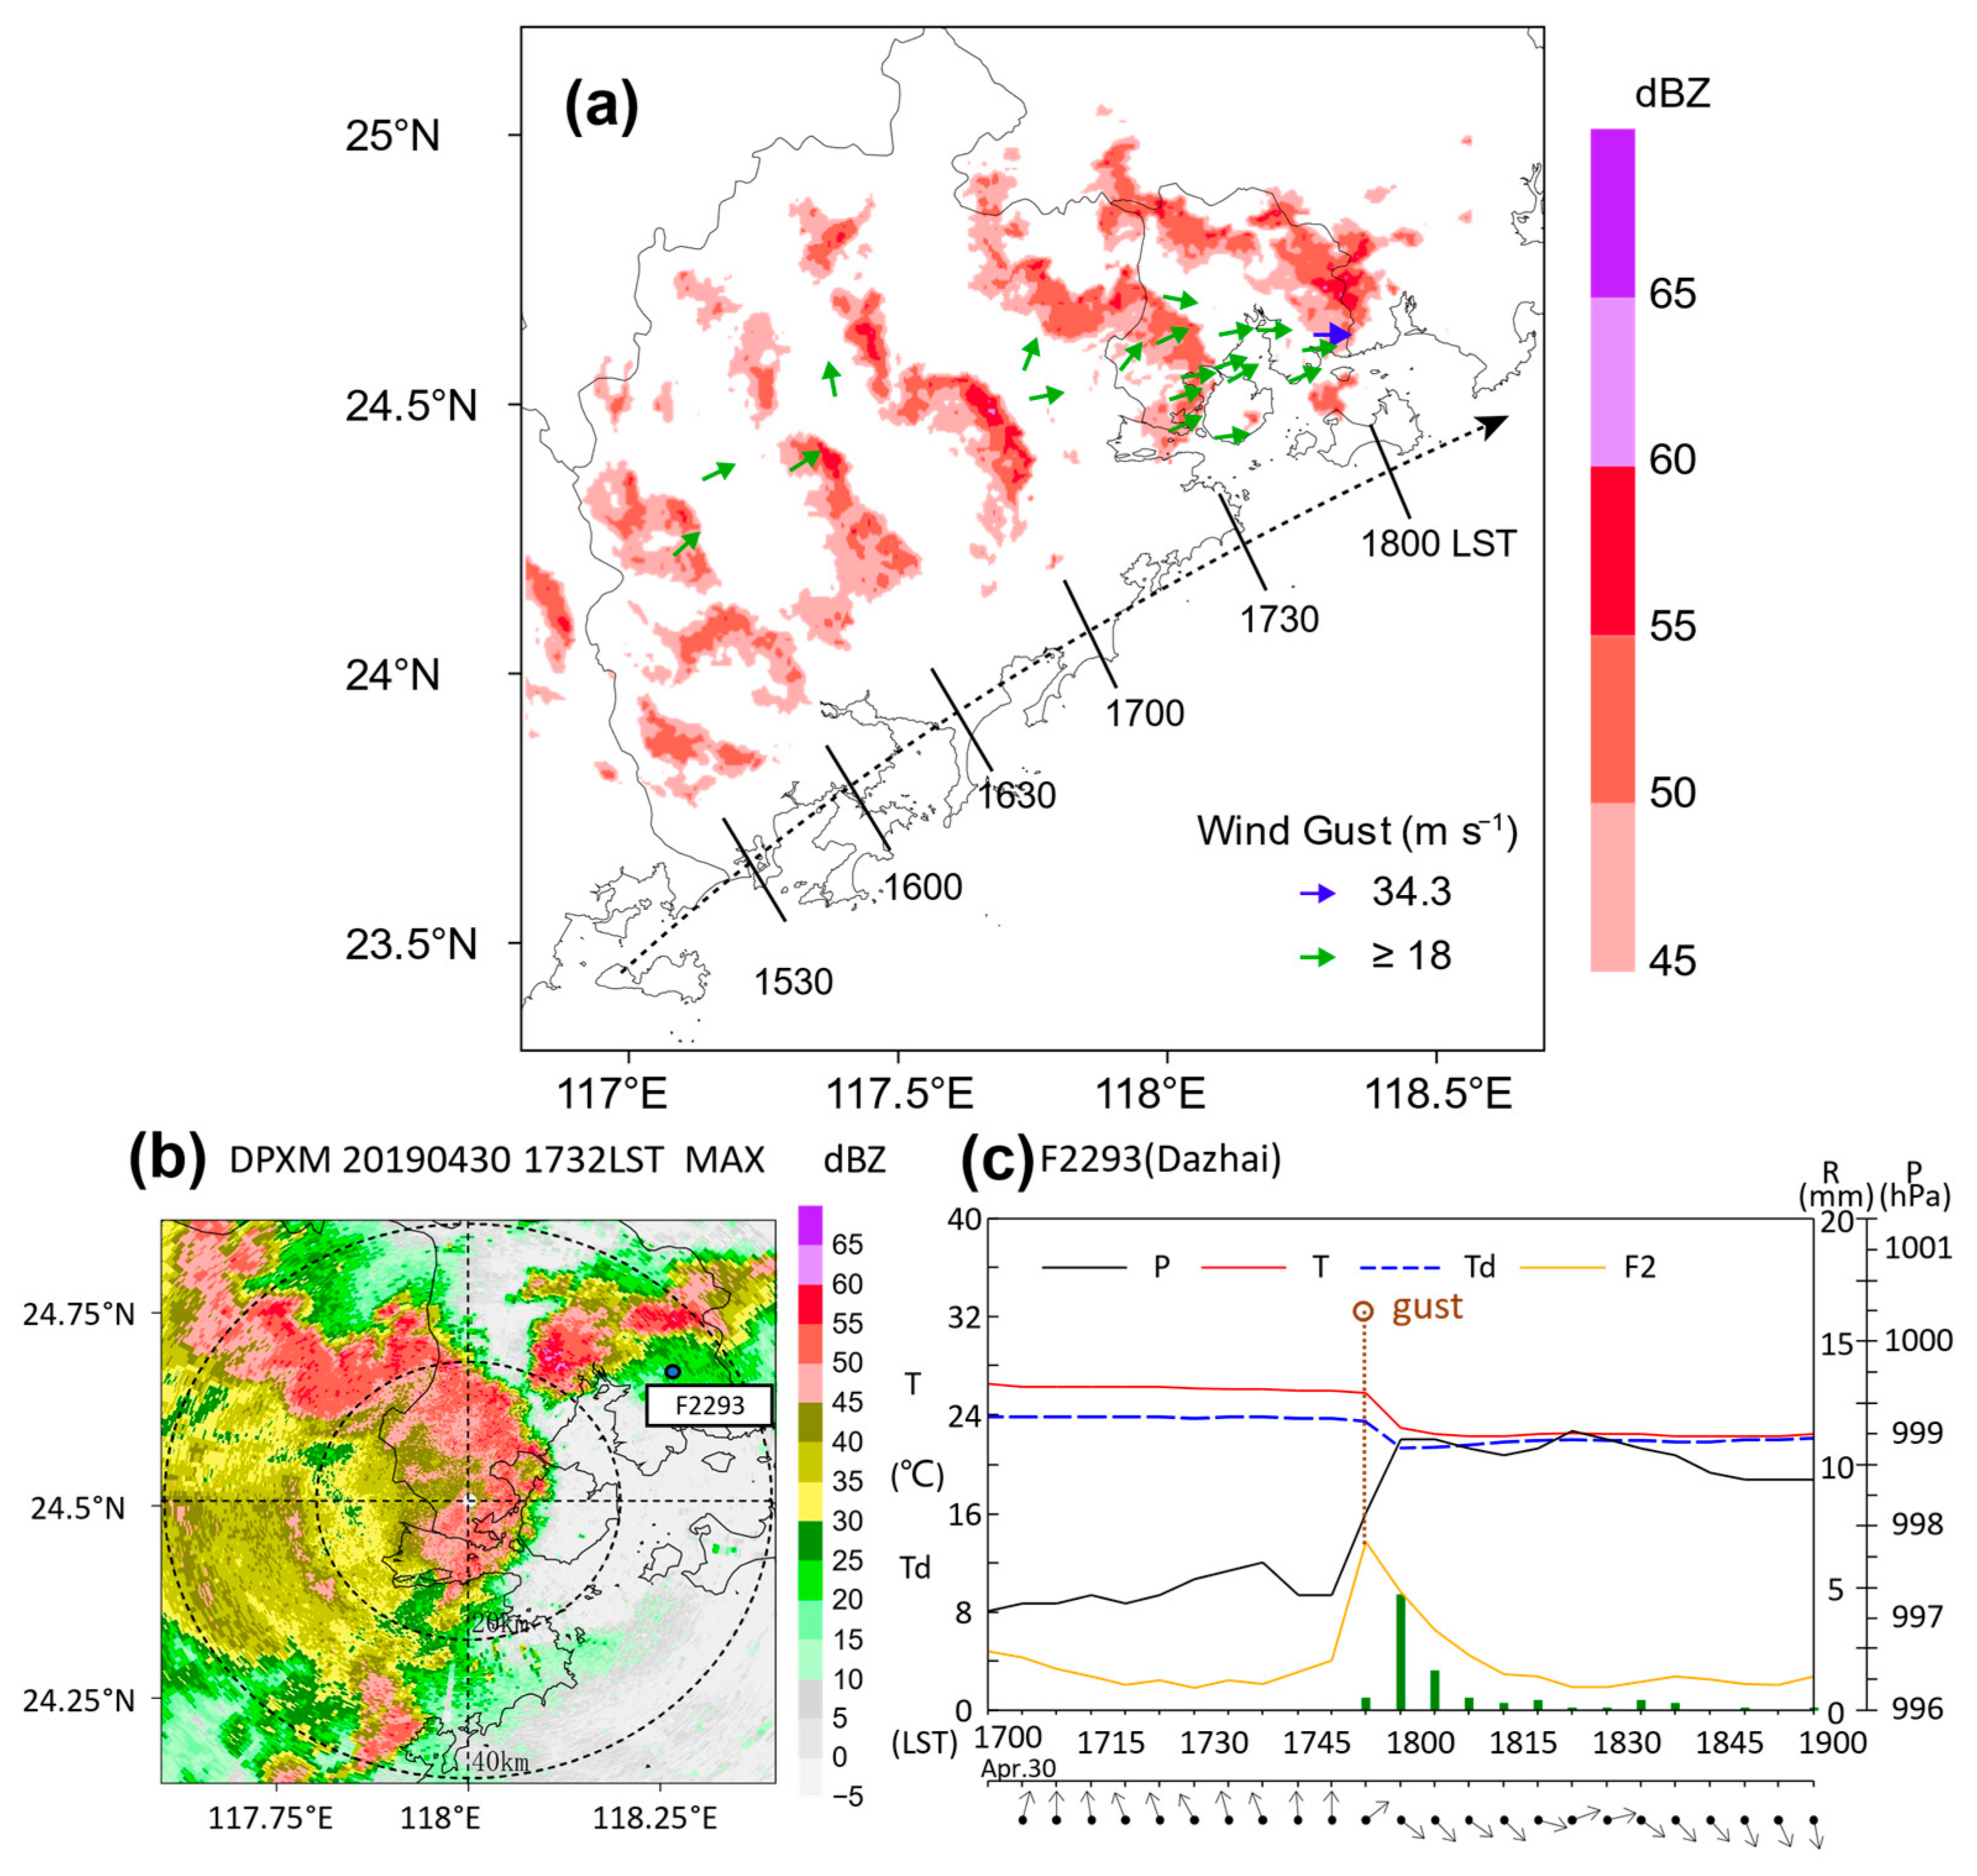
4. Observational Features of Convective Merging Processes
4.1. Overview on Merging Processes
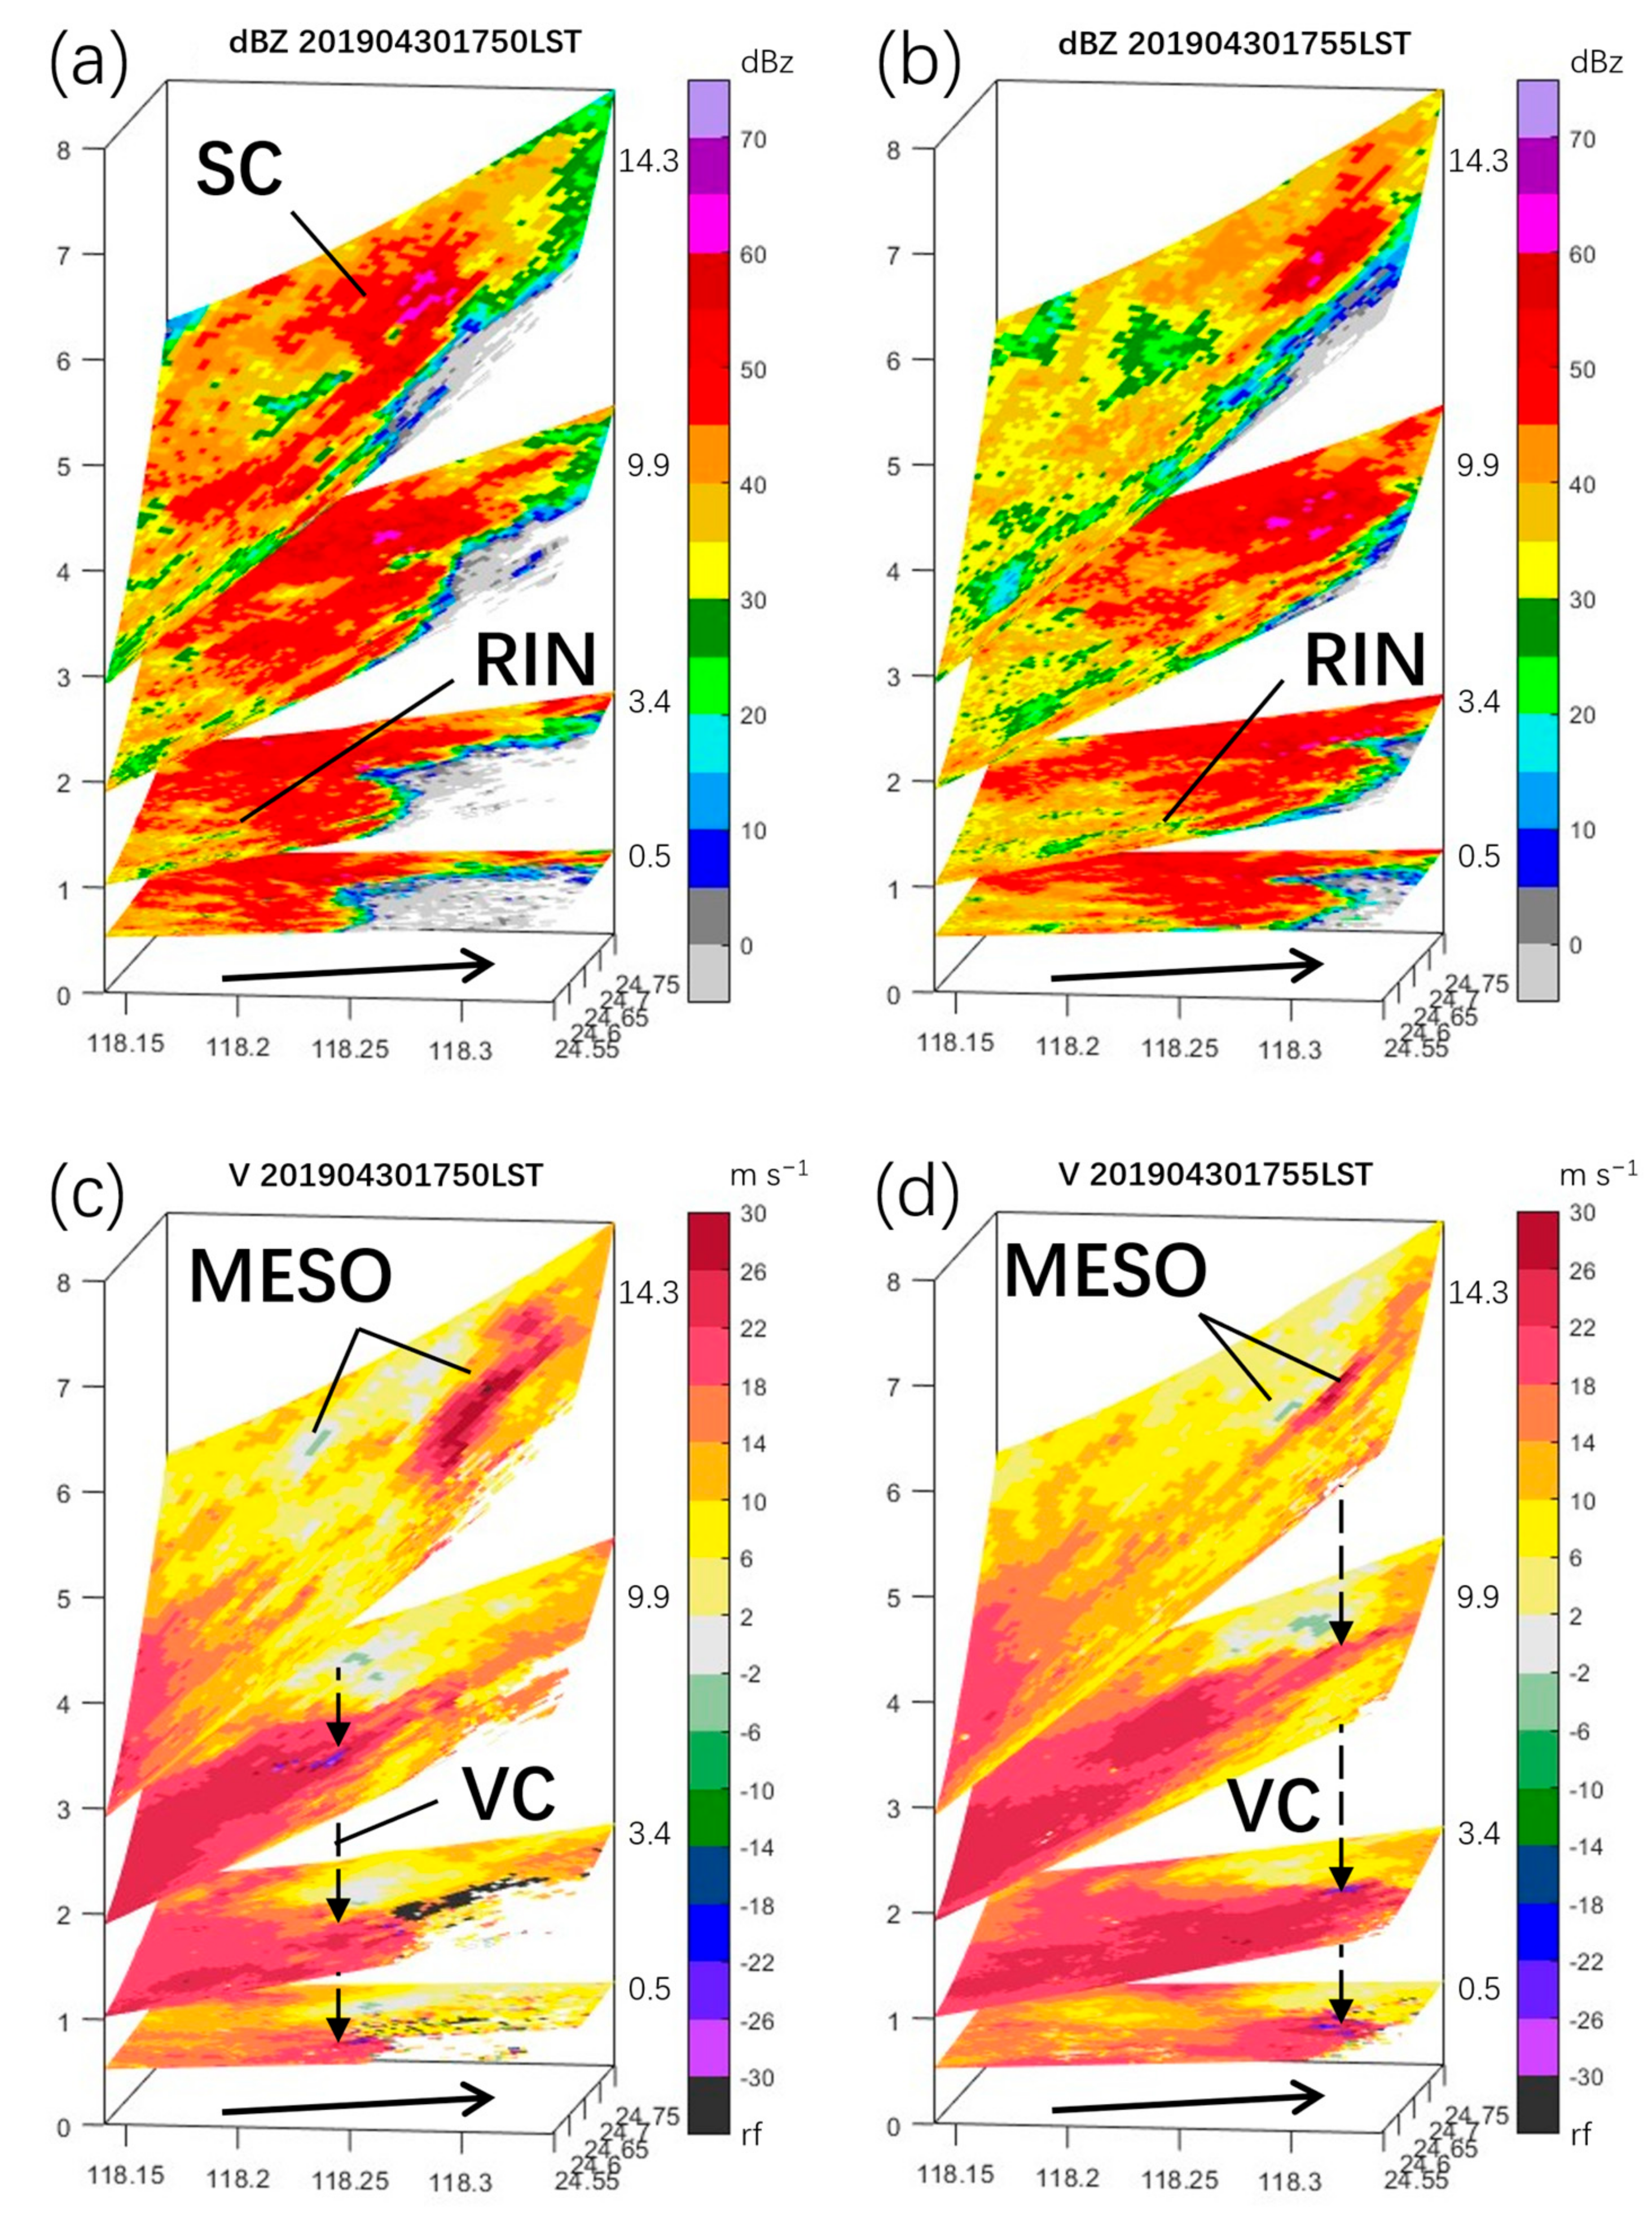
4.2. Development and Evolution of the Mini-Supercell
4.2.1. Development of the Mini-Supercell
4.2.2. Variation Features in the Mini-Supercell
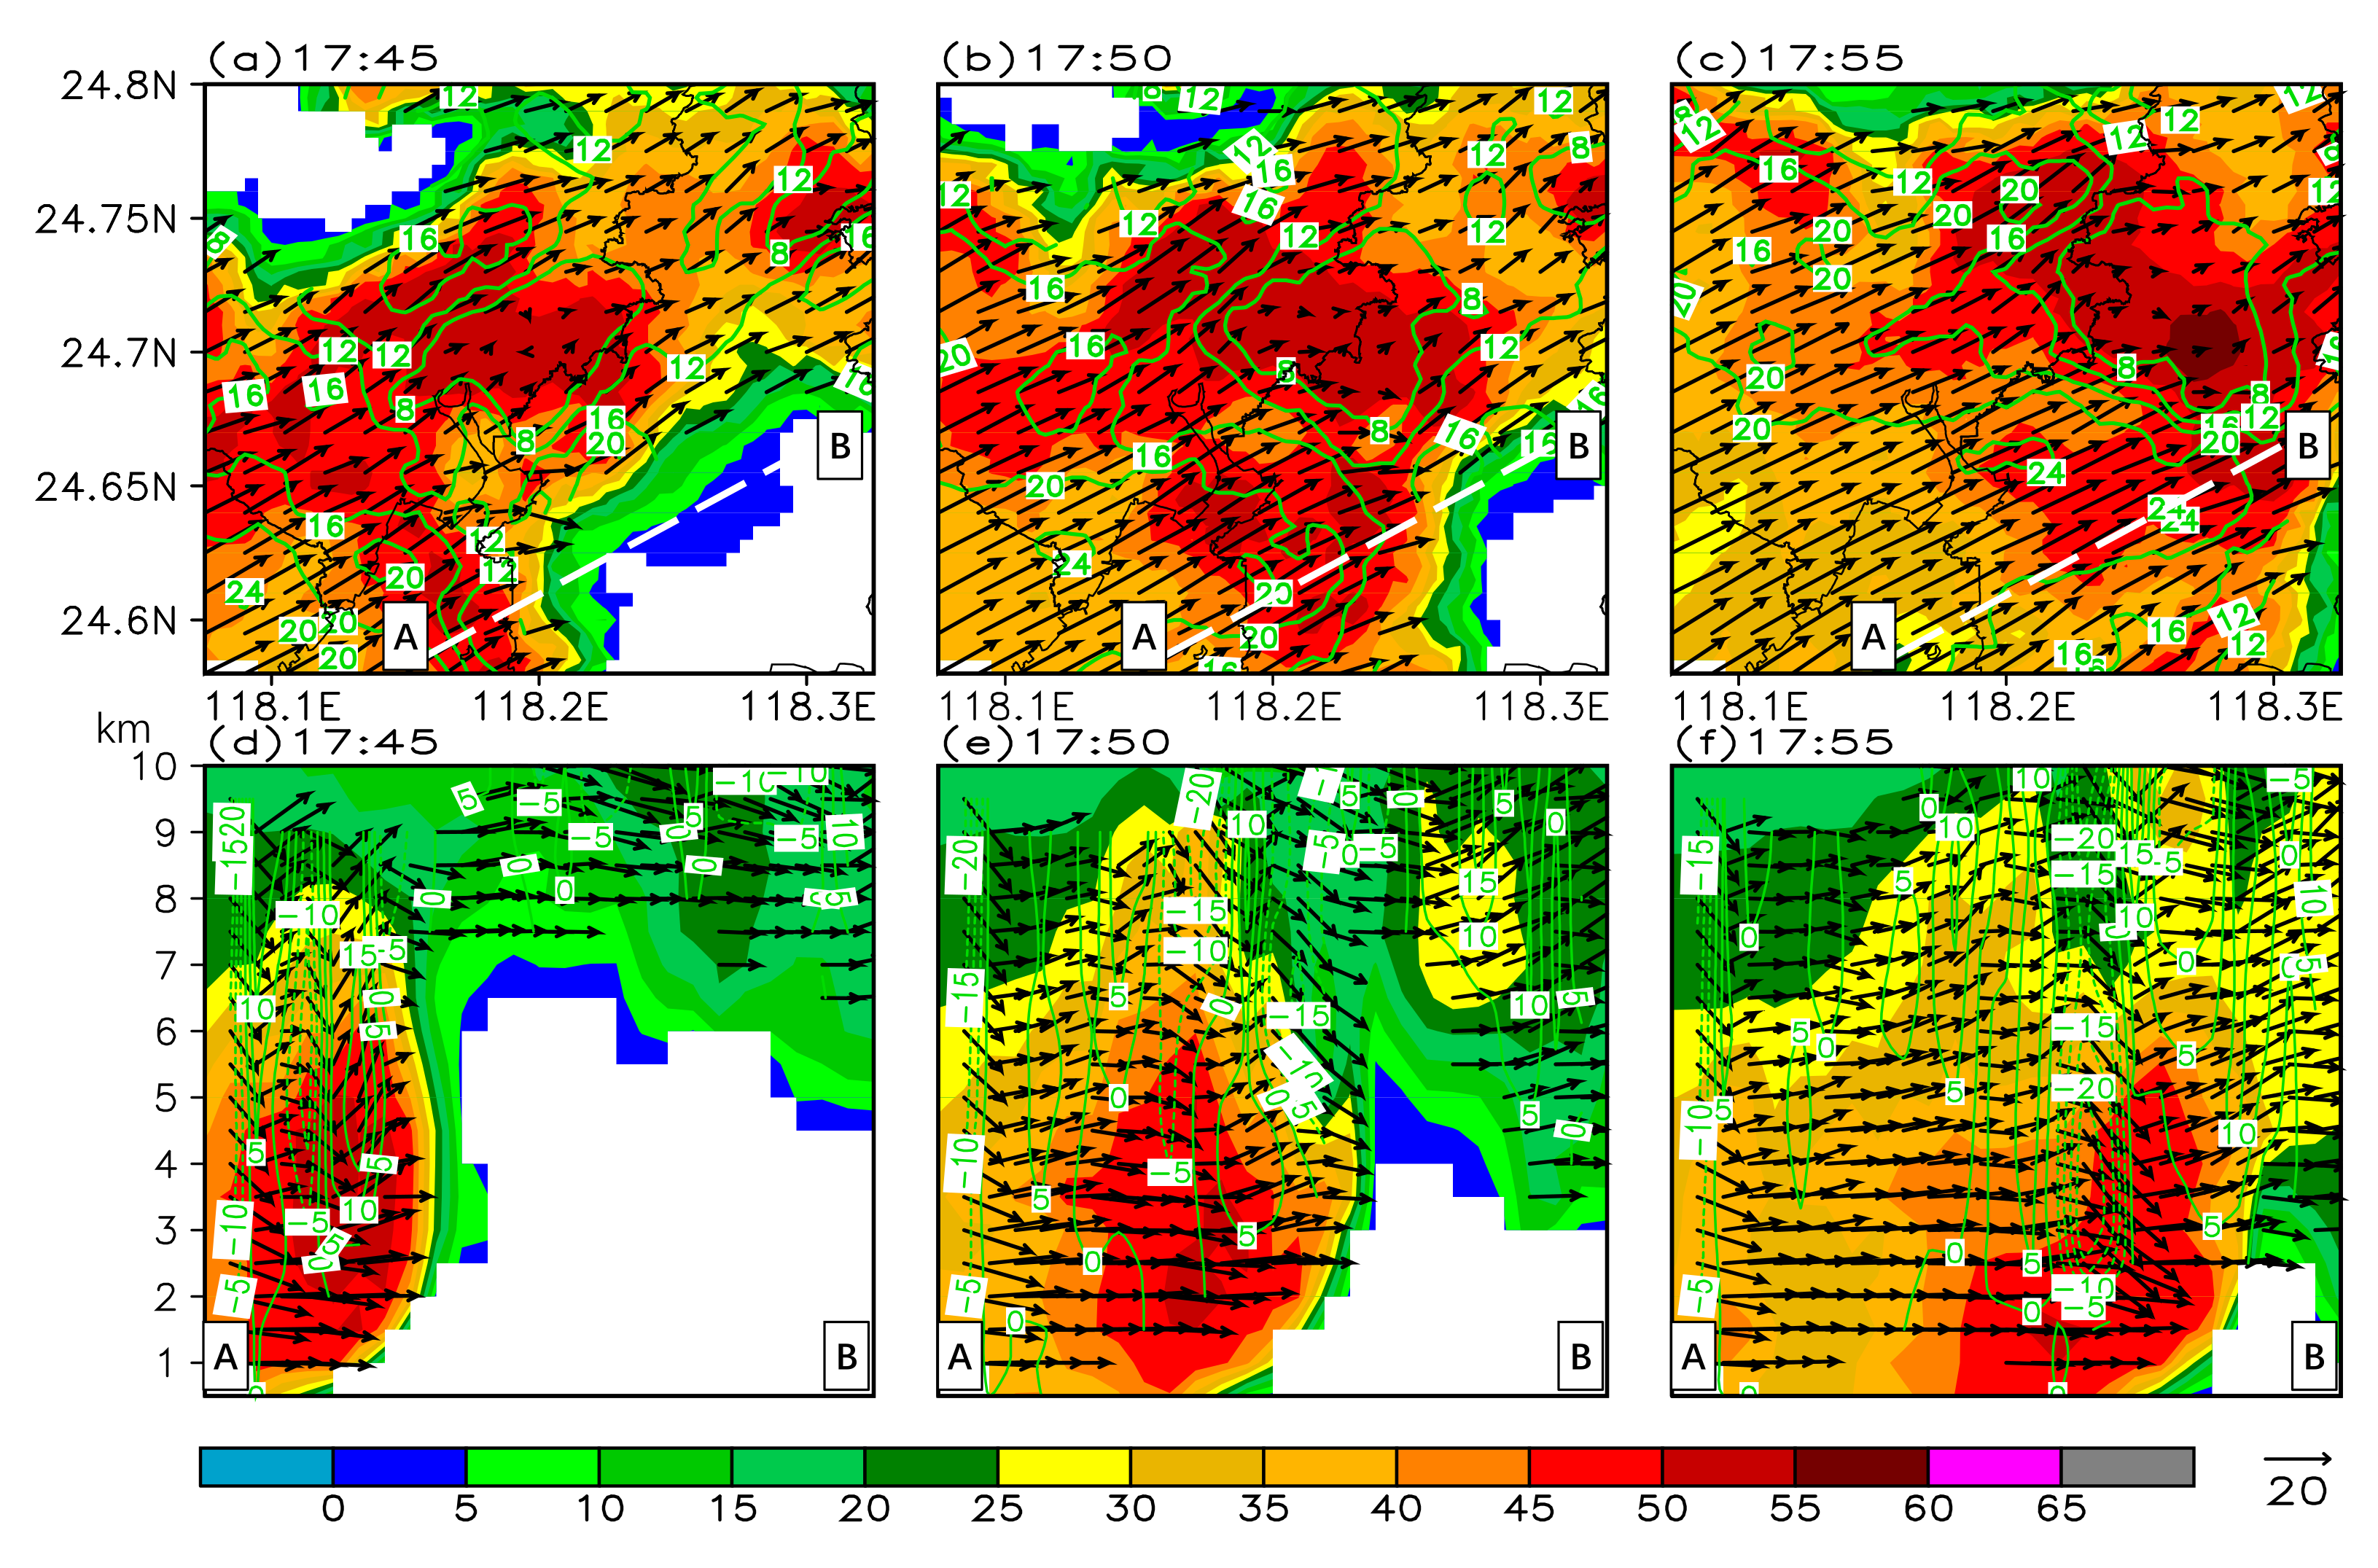
4.3. Evolution of the RIJ during the Merging
4.3.1. Features of the Bow Echo before the Merging
4.3.2. Evolution of the RIJ during the Merging
4.4. Kinematic Features during the Merging
5. Discussion
6. Conclusions
Author Contributions
Funding
Institutional Review Board Statement
Informed Consent Statement
Data Availability Statement
Conflicts of Interest
Appendix A

References
- Byers, H.R.; Braham, R.R. The Thunderstorm: Report of the Thunderstorm Project; U.S. Government Printing Office: Washington, DC, USA, 1949; p. 287. [Google Scholar]
- Malkus, J.S. SOME RESULTS OF A TRADE-CUMULUS CLOUD INVESTIGATION. J. Meteorol. 1954, 11, 220–237. [Google Scholar] [CrossRef]
- Dennis, A.S.; Schock, C.A.; Koscielski, A. Characteristics of hail storms of western South Dakota. J. Appl. Meteorol. 1970, 9, 127–135. [Google Scholar] [CrossRef]
- Browning, K.; Frankhauser, J.; Chalon, J.-P.; Eccles, P.; Strauch, R.; Merrem, F.; Musil, D.; May, E.; Sand, W. Structure of an Evolving Hailstorm Part V: Synthesis and implications for Hail Growth and Hail Suppression. Mon. Weather Rev. 1976, 104, 603–610. [Google Scholar] [CrossRef] [Green Version]
- Lemon, L.R. The Flanking Line, a Severe Thunderstorm Intensification Source. J. Atmos. Sci. 1976, 33, 686–694. [Google Scholar] [CrossRef] [Green Version]
- Barnes, S.L. Oklahoma Thunderstorms on 29–30 April 1970. Part II: Radar-Observed Merger of Twin Hook Echoes. Mon. Weather Rev. 1978, 106, 685–696. [Google Scholar] [CrossRef] [Green Version]
- Simpson, J.; Woodley, W.L. Seeding Cumulus in Florida: New 1970 Results. Science 1971, 172, 117–126. [Google Scholar] [CrossRef]
- Bennetts, D.A.; Bader, M.J.; Marles, R.H. Convective cloud merging and its effect on rainfall. Nat. Cell Biol. 1982, 300, 42–45. [Google Scholar] [CrossRef]
- Simpson, J. Downdrafts as Linkages in Dynamic Cumulus Seeding Effects. J. Appl. Meteorol. 1980, 19, 477–487. [Google Scholar] [CrossRef] [Green Version]
- Mladjen, C.; Dejan, J.; Vladan, V. The influence of merging and individual storm splitting on mesoscale convective system formation. Atmos. Res. 2009, 93, 21–29. [Google Scholar]
- Tian, S.C. Effect of merging of the convective cloud clusters on occurrence of heavy rainfall. Adv. Atmos. Sci. 1991, 8, 499–504. [Google Scholar]
- Bech, J.; Pineda, N.; Rigo, T.; Aran, M.; Amaro, J.; Gayà, M.; Arús, J.; Montanyà, J.; van der Velde, O. A Mediterranean noc-turnal heavy rainfall and tornadic event. Part I: Overview, damage survey and radar analysis. Atmos. Res. 2011, 100, 621–637. [Google Scholar] [CrossRef]
- Westcott, N.E.; Kennedy, P.C. Cell Development and Merger in an Illinois Thunderstorm Observed by Doppler Radar. J. Atmos. Sci. 1989, 46, 117–131. [Google Scholar] [CrossRef] [Green Version]
- Daniel, C.; Angelika, P. The occurrence of convective systems with a bow echo in warm season in Poland. Atmos. Res. 2017, 193, 26–35. [Google Scholar]
- French, A.J.; Parker, M.D. Observations of Mergers between Squall Lines and Isolated Supercell Thunderstorms. Weather Forecast. 2012, 27, 255–278. [Google Scholar] [CrossRef] [Green Version]
- Zhou, A.; Zhao, K.; Lee, W.-C.; Huang, H.; Hu, D.; Fu, P. VDRAS and polarimetric radar investigation of a bow echo for-mation after a squall line merged with a preline convective cell. J. Geophys. Res. Atmos. 2020, 125, e2019JD031719. [Google Scholar] [CrossRef]
- French, A.J.; Parker, M.D. Numerical Simulations of Bow Echo Formation Following a Squall Line–Supercell Merger. Mon. Weather Rev. 2014, 142, 4791–4822. [Google Scholar] [CrossRef]
- LaPenta, K.D.; Bosart, L.F.; Galarneau, T.J.; Dickinson, M.J. A Multiscale Examination of the 31 May 1998 Mechanicville, New York, Tornado. Weather Forecast. 2005, 20, 494–516. [Google Scholar] [CrossRef] [Green Version]
- Fujita, T.T. Manual of downburst identification for project NIMROD. Univ. Chic. SMRP Res. Pap. 1978, 156, 104. [Google Scholar]
- Atkins, N.T.; Laurent, M.S. Bow Echo Mesovortices. Part I: Processes That Influence Their Damaging Potential. Mon. Weather Rev. 2009, 137, 1497–1513. [Google Scholar] [CrossRef]
- Atkins, N.T.; Laurent, M.S. Bow Echo Mesovortices. Part II: Their Genesis. Mon. Weather Rev. 2009, 137, 1514–1532. [Google Scholar] [CrossRef] [Green Version]
- Trapp, R.J.; Weisman, M.L. Low-level mesovortices within squall lines and bow echoes. Part II: Their Genesis and Implications. Mon. Weather Rev. 2003, 131, 2804–2823. [Google Scholar] [CrossRef] [Green Version]
- Wakimoto, R.M.; Murphey, H.V.; Nester, A.; Jorgensen, D.P.; Atkins, N.T. High Winds Generated by Bow Echoes. Part I: Overview of the Omaha Bow Echo 5 July 2003 Storm during BAMEX. Mon. Weather Rev. 2006, 134, 2793–2812. [Google Scholar] [CrossRef] [Green Version]
- Wakimoto, R.M.; Murphey, H.V.; Davis, C.A.; Atkins, N.T. High Winds Generated by Bow Echoes. Part II: The Relationship between the Mesovortices and Damaging Straight-Line Winds. Mon. Weather Rev. 2006, 134, 2813–2829. [Google Scholar] [CrossRef] [Green Version]
- Weisman, M.L.; Trapp, R.J. Low-level mesovortices within squall lines and bow echoes. Part I: Overview and Dependence on Environmental Shear. Mon. Weather Rev. 2003, 131, 2779–2803. [Google Scholar] [CrossRef] [Green Version]
- Xu, X.; Xue, M.; Wang, Y. The Genesis of Mesovortices within a Real-Data Simulation of a Bow Echo System. J. Atmos. Sci. 2015, 72, 1963–1986. [Google Scholar] [CrossRef]
- Weisman, M.L. The Genesis of Severe, Long-Lived Bow Echoes. J. Atmos. Sci. 1993, 50, 645–670. [Google Scholar] [CrossRef]
- Grim, J.A.; Rauber, R.M.; McFarquhar, G.M.; Jewett, B.F.; Jorgensen, D.P. Development and Forcing of the Rear Inflow Jet in a Rapidly Developing and Decaying Squall Line during BAMEX. Mon. Weather Rev. 2009, 137, 1206–1229. [Google Scholar] [CrossRef]
- Peng, X.; Zhang, R.; Wang, H. Kinematic features of a bow echo in southern China observed with Doppler radar. Adv. Atmos. Sci. 2013, 30, 1535–1548. [Google Scholar] [CrossRef]
- Wolf, P.L.; Wolf, R.; Przybylinski, R.W.; Berg, P. Observations of a merging bowing segment and supercell. In 18th Conference on Severe Local Storms, San Francisco, CA, USA, 13–23 February 1996; American Meteorological Society: Boston, MA, USA; pp. 740–745.
- Wolf, P.L. WSR-88D radar depiction of supercell-bow echo interaction: Unexpected evolution of a large, tornadic, ‘com-ma-shaped’ supercell over Eastern Oklahoma. Weather Forecast. 1998, 13, 492–504. [Google Scholar] [CrossRef]
- Przybylinski, R.W. The Bow Echo: Observations, Numerical Simulations, and Severe Weather Detection Methods. Weather Forecast. 1995, 10, 203–218. [Google Scholar] [CrossRef]
- Spiridonov, V.; Ćurić, M. Examination of physical processes of convective cell evolved from a MCS—Using a different model initialization. Asia-Pac. J. Atmos. Sci. 2016, 52, 263–279. [Google Scholar] [CrossRef]
- Jou, B.J.-D.; Kao, Y.-C.; Hsiu, R.-G.R.; Jung, C.-J.U.; Lee, J.R.; Kuo, H.C. Observational Characteristics and Forecast Challenge of Taipei Flash Flood Afternoon Thunderstorm: Case Study of 14 June 2015. Atmos. Sci. 2016, 44, 57–82. [Google Scholar]
- del Moral, A.; Weckwerth, T.M.; Rigo, T.; Bell, M.M.; Llasat, M.C. C-Band Dual-Doppler Retrievals in Complex Terrain: Improving the Knowledge of Severe Storm Dynamics in Catalonia. Remote Sens. 2020, 12, 2930. [Google Scholar] [CrossRef]
- Snyder, J.C. Observations and Simulations of Polarimetric, X-Band Radar Signatures in Supercells. Ph.D. Thesis, University of Oklahoma, Norman, OK, USA, 2013. [Google Scholar]
- Snyder, J.C.; Ryzhkov, A.V.; Kumjian, M.R.; Khain, A.P.; Picca, J. A ZDR Column Detection Algorithm to Examine Convective Storm Updrafts. Weather Forecast. 2015, 30, 1819–1844. [Google Scholar] [CrossRef]
- Bringi, V.N.; Burrows, D.A.; Menon, S.M. Multiparameter Radar and Aircraft Study of Raindrop Spectral Evolution in Warm-based Clouds. J. Appl. Meteorol. 1991, 30, 853–880. [Google Scholar] [CrossRef] [Green Version]
- Bringi, V.N.; Liu, L.; Kennedy, P.C.; Chandrasekar, V.; Rutledge, S.A. Dual multiparameter radar observations of intense convective storms: The 24 June 1992 case study. Theor. Appl. Clim. 1996, 59, 3–31. [Google Scholar] [CrossRef]
- Brandes, E.A.; Vivekanandan, J.; Tuttle, J.D.; Kessinger, C.J. A study of thunderstorm microphysics with multiparameter ra-dar and aircraft observations. Mon. Weather Rev. 1995, 123, 3129–3143. [Google Scholar] [CrossRef] [Green Version]
- Smith, P.L.; Musil, D.J.; Detwiler, A.G.; Ramachandran, R. Observations of mixed-phase precipitation within a CaPE thun-derstorm. J. Appl. Meteorol. 1999, 38, 145–155. [Google Scholar] [CrossRef]
- Loney, M.L.; Zrnic, D.S.; Straka, J.M.; Ryzhkov, A.V. Enhanced polarimetric radar signatures above the melting level in a supercell storm. J. Appl. Meteorol. 2002, 41, 1179–1194. [Google Scholar] [CrossRef]
- Kennedy, P.C.; Rutledge, S.A.; Petersen, W.A.; Bringi, V.N. Polarimetric Radar Observations of Hail Formation. J. Appl. Meteorol. 2001, 40, 1347–1366. [Google Scholar] [CrossRef] [Green Version]
- Kumjian, M.R.; Ganson, S.M.; Ryzhkov, A.V. Freezing of Raindrops in Deep Convective Updrafts: A Microphysical and Polarimetric Model. J. Atmos. Sci. 2012, 69, 3471–3490. [Google Scholar] [CrossRef]
- Kumjian, M.R.; Khain, A.P.; Benmoshe, N.; Ilotoviz, E.; Ryzhkov, A.V.; Phillips, V. The Anatomy and Physics of ZDR Columns: Investigating a Polarimetric Radar Signature with a Spectral Bin Microphysical Model. J. Appl. Meteorol. Clim. 2014, 53, 1820–1843. [Google Scholar] [CrossRef]
- Chisolm, A.J.; Renick, J.H. The Kinematics of Multicell and Supercell Alberta Hailstorms, Alberta Hail Studies, 1972, Research Council of Alberta Hail Studies Rep. No. 72-2; Research Council of Alberta: Calgary, AB, Canada, 1972. [Google Scholar]
- Kevin, R.K.; James, R.S.; Eugene, W.M. An observational and numerical study of a mini-supercell storm. Atmos. Res. 1998, 49, 35–63. [Google Scholar]
- Sun, J.; Crook, N.A. Real-Time Low-Level Wind and Temperature Analysis Using Single WSR-88D Data. Weather Forecast. 2001, 16, 117–132. [Google Scholar] [CrossRef] [Green Version]
- Ray, P.S.; Ziegler, C.L.; Bumgarner, W.; Serafin, R.J. Single- and Multiple-Doppler Radar Observations of Tornadic Storms. Mon. Weather Rev. 1980, 108, 1607–1625. [Google Scholar] [CrossRef] [Green Version]
- Luo, C.G.; Chi, Y.Z.; Zhou, H.G. Charateristics of 3-D wind structure of typhoon outer intensive banded echo using du-al-Doppler weather radar data. Chin. J. Atmos. Sci. 2012, 36, 247–258. (In Chinese) [Google Scholar]
- Ouyang, S.C.; Chen, G.Y.; Lin, Y. Information Digitization and Prediction; China Meteorological Press: Beijing, China, 2009; pp. 154–196. (In Chinese) [Google Scholar]
- Xu, C.Y.; Lin, Y.H.; Guan, Z.Y. The boundary layer characteristics of two types of mesoscale convective systems along a Meiyu front. Trans. Atmos. Sci. 2012, 35, 51–63. [Google Scholar]
- Doviak, R.J.; Ray, P.S.; Strauch, R.G.; Miller, L.J. Error Estimation in Wind Fields Derived from Dual-Doppler Radar Measurement. J. Appl. Meteorol. 1976, 15, 868–878. [Google Scholar] [CrossRef]
- Kong, F.Y.; Mao, J.T. A model study of three-dimensional wind field analysis from dual-Doppler radar data. Adv. Atmos. Sci. 1994, 11, 162–174. [Google Scholar]


Publisher’s Note: MDPI stays neutral with regard to jurisdictional claims in published maps and institutional affiliations. |
© 2021 by the authors. Licensee MDPI, Basel, Switzerland. This article is an open access article distributed under the terms and conditions of the Creative Commons Attribution (CC BY) license (https://creativecommons.org/licenses/by/4.0/).
Share and Cite
Zheng, H.; Zhao, Y.; Huang, Y.; Zhang, W.; Luo, C.; Wei, M.; Qiu, X. Observational Analysis of a Wind Gust Event during the Merging of a Bow Echo and Mini-Supercell in Southeastern China. Atmosphere 2021, 12, 1511. https://0-doi-org.brum.beds.ac.uk/10.3390/atmos12111511
Zheng H, Zhao Y, Huang Y, Zhang W, Luo C, Wei M, Qiu X. Observational Analysis of a Wind Gust Event during the Merging of a Bow Echo and Mini-Supercell in Southeastern China. Atmosphere. 2021; 12(11):1511. https://0-doi-org.brum.beds.ac.uk/10.3390/atmos12111511
Chicago/Turabian StyleZheng, Hui, Yuchun Zhao, Yipeng Huang, Wei Zhang, Changrong Luo, Ming Wei, and Xinfa Qiu. 2021. "Observational Analysis of a Wind Gust Event during the Merging of a Bow Echo and Mini-Supercell in Southeastern China" Atmosphere 12, no. 11: 1511. https://0-doi-org.brum.beds.ac.uk/10.3390/atmos12111511