
Regional Air Pollutant Characteristics and Health Risk Assessment of Large Cities in Northeast China

College of New Energy and Environment, Jilin University, Changchun 130012, China
*
Author to whom correspondence should be addressed.
Atmosphere 2021, 12(11), 1519; https://0-doi-org.brum.beds.ac.uk/10.3390/atmos12111519
Submission received: 14 October 2021
/
Revised: 12 November 2021
/
Accepted: 16 November 2021
/
Published: 18 November 2021
(This article belongs to the Special Issue Air Pollution in China)
Abstract
:This study systematically investigated the pollution characteristics of atmospheric O3 and PM2.5, regional transport, and their health risks in three provincial capitals in northeast China during 2016–2020. The results show that O3 concentrations showed a trend of high summer and low winter, while PM2.5 concentrations showed a trend of high winter and low summer during these five years. The results of the correlation analysis indicate that external sources contribute more O3, while PM2.5 is more from local sources. The backward trajectory clustering analysis results showed that Changchun had the highest share of northwest trajectory with a five-year average value of 67.89%, and the city with the highest percentage of southwest trajectory was Shenyang with a five-year average value of 23.95%. The backward trajectory clustering analysis results showed that the share of the northwest trajectory decreased and the share of the southwest trajectory increased for all three cities in 2020 compared to 2016. The results of the potential source contribution function (PSCF) and concentration weighting trajectory (CWT) analysis showed that the main potential source areas and high concentration contribution areas for PM2.5 in the northeast were concentrated in Mongolia, Inner Mongolia, Shandong Province, and the northeast, and for O3 were mainly located in Shandong, Anhui, and Jiangsu Provinces, and the Yellow Sea and Bohai Sea. The non-carcinogenic risk of PM2.5 in Harbin was high with a HQ of 2.04, while the other cities were at acceptable levels (HQ < 0.69) and the non-carcinogenic risk of O3 was acceptable in all three cities (HQ < 0.22). However, PM2.5 had a high carcinogenic risk (4 × 10⁻⁴ < CR < 0.44) and further treatment is needed to reduce the risk.
1. Introduction
With the rapid economic growth and urbanization in China and the world, there is a growing concern in the international community and in China about the relationship between air pollution and public health [1]. Long-term exposure to PM2.5 and O3 can lead to cardiovascular disease [2], ophthalmic disease [3], and premature birth [4]. The combination of chronic and acute exposures leads to a high global and regional burden of mortality and morbidity [5,6,7]. The research by Edlund et al. [8] showed that air pollution is the biggest environmental contributor to disease, with a disproportionate impact on low and middle income countries. Furthermore, high levels of PM2.5 in the outdoor environment can also be exposure to indoors, affecting the health of people who are exposed to indoor rest and work for long periods of time [9]. Thus, both PM2.5 and O3 have attracted widespread public and scientific attention.
To improve air quality in China, in 2013, the Chinese State Council issued the Air Pollution Prevention and Control Action Plan (APPCAP) to reduce the number of PM2.5 and associated haze days. Through the implementation of the APPCAP measures, PM2.5 concentrations have decreased significantly across the country since 2013. The improvement in air quality was reported by Yue et al. [10] and was mainly associated with strengthening industrial emission standards, upgrading industrial boilers, phasing out obsolete industrial capacity, and promoting cleaner fuels in the residential sector. A decrease in NOx and SO2 accompanied the reduction in PM2.5. However, O3 concentrations showed an increasing trend. Fan et al. [11] found that the daily average maximum concentration of O3 (MDA8-O3) in summer increased from 91.6 μg/m3 in 2015 to 103.1 μg/m3 in 2018, with an annual growth rate of 4.4 μg/m3. The annual average PM2.5 concentrations in 2017 in key city groups such as Beijing–Tianjin–Hebei, Yangtze River Delta, and Pearl River Delta compared to 2013 decreased by 39.6%, 34.3%, and 27.7%, respectively, but the 90% quantile of the maximum ozone 8-h sliding average (MDA8-O3) instead increased by 19.1%, 10.4%, and 5.8%, respectively, compared to 2013 [12,13,14,15]. The increase in ozone has triggered a discussion among scholars about the synergistic management of O3 and PM2.5, and it is necessary and correct to study O3 and PM2.5 under the same perspective. In this study, for the 2016–2020 O3 and PM2.5 pollution phenomena in three provincial capitals in northeast China, we used time series, meteorological factor analysis, and correlation analysis to characterize the pollutants’ pollution characteristics. Various methods based on backward trajectories including trajectory clustering, potential source contribution functions (PSCF), and concentration weight trajectories (CWT) were used to analyze the regional transport trends of pollutants. Health risks were assessed using methods recommended by the United States Environmental Protection Agency (USEPA).
2. Materials and Methods
2.1. Study Area and Data Selection
Northeast China spans the middle temperate and cold temperate zones from south to north, and has a temperate monsoon climate with four distinct seasons, warm and rainy in summer and cold and dry in winter. From the southeast to the northwest, the annual precipitation drops from 1000 mm to less than 300 mm, transitioning from the humid and semi-humid zones to the semi-arid zone.
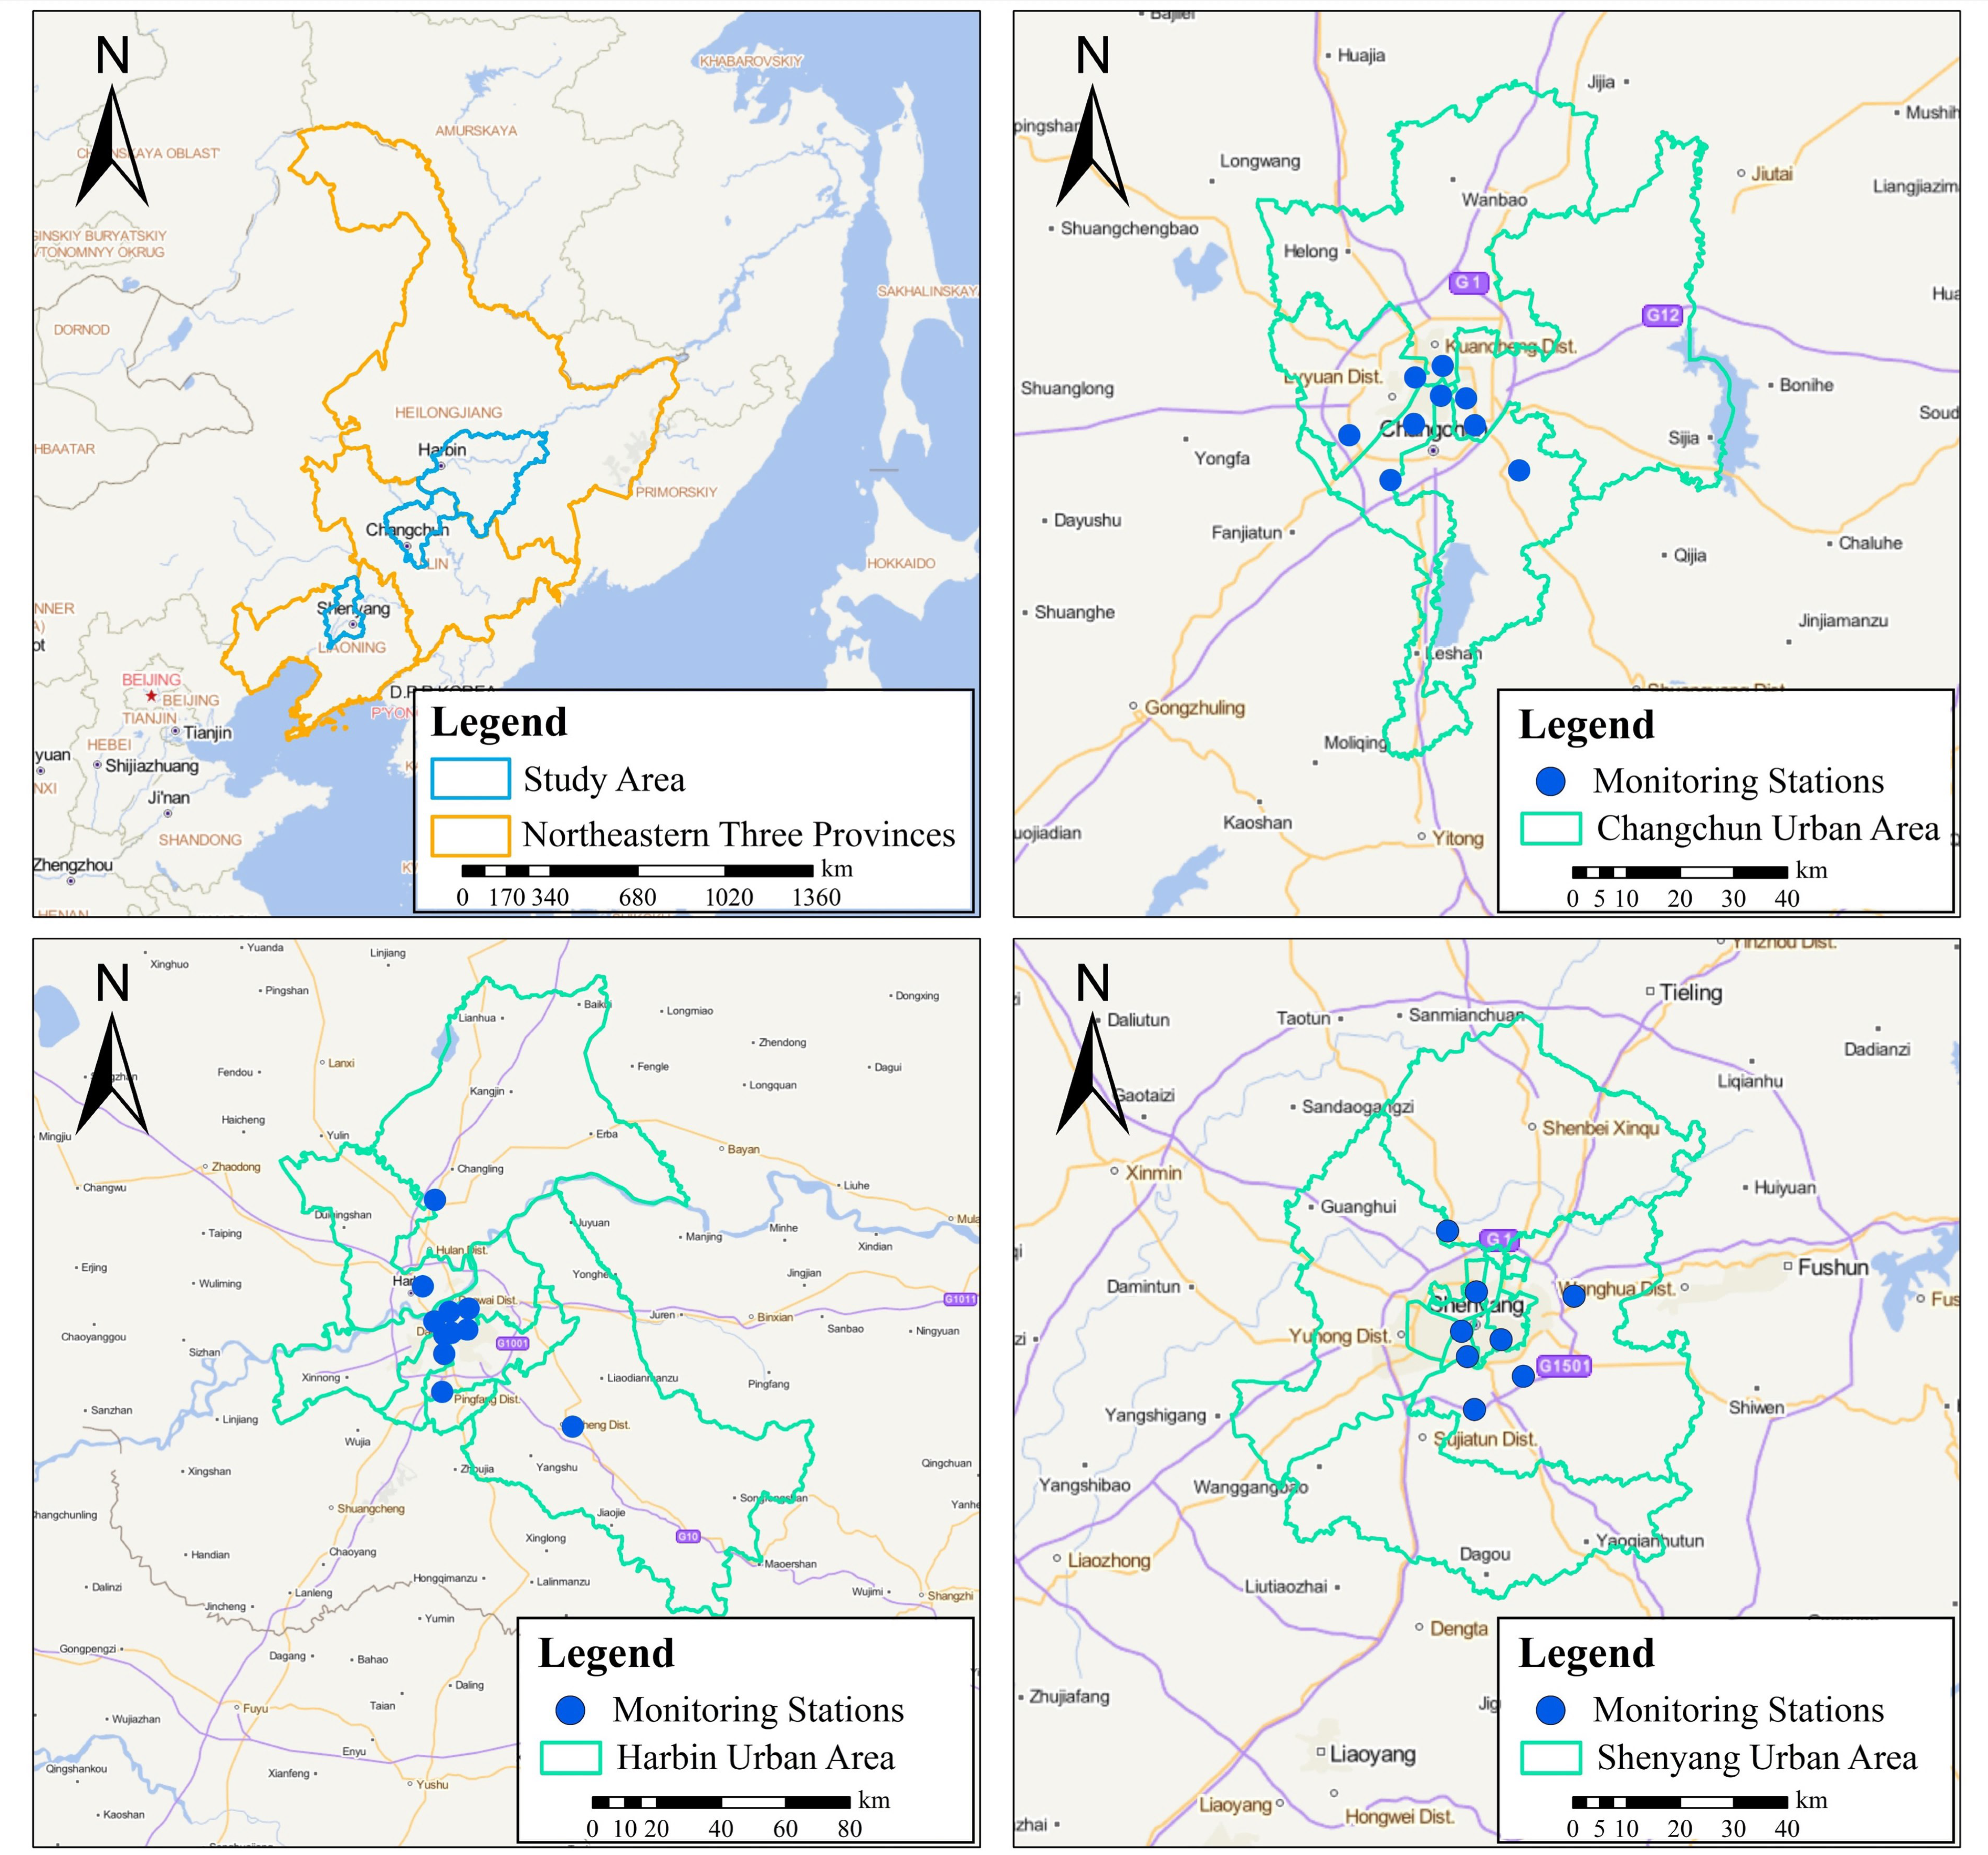
Considering the meteorological conditions and the current urban development situation in northeast China, three typical large cities in northeast China were selected as the subjects of this study. A total of 27 automatic air quality monitoring stations in the above three cities were selected for this study, as shown in Figure 1, and the hourly PM2.5 and O3 concentration data for 2016–2020 were obtained from the China Environmental Quality Monitoring Platform, with 10 stations selected in Harbin, nine in Changchun, and eight in Shenyang (https://www.aqistudy.cn/historydata/) (accessed on 25 June 2021) The meteorological data were obtained from city stations in each city and are available on the China Meteorological Data Network (http://data.cma.cn/) (accessed on 16 June 2021).
2.2. Backward Trajectory Clustering Analysis
This study used the HYSPLIT (Hybrid Single Particle Lagrangian Integrated Trajectory) model developed by the National Oceanic Atmospheric Center (NOAA) and the Australian Bureau of Meteorology (BOM) (http://ready.arl.noaa.gov/HYSPLIT.php) (accessed on 21 June 2021) simulates the 72 h backward trajectory at 500 m height in the central city of three provincial capitals to analyze the atmospheric pollutant transport and dispersion trajectory, and other scholars have also conducted similar studies using this model in different areas [16,17,18].
To facilitate the analysis of pollutant migration paths, we used the stepwise cluster analysis (SCA) algorithm to cluster the backward trajectories with some optimization [19,20]. The clustering analysis process is shown by Equations (1)–(3):
In the above equation, i is the number of trajectories; j is the number of passing points; t is the movement time of airflow; dj is the distance between the jth point of two trajectories; X is the number of trajectories in the cluster; D is the distance between trajectories, so Dij indicates the distance from the jth passing point in the ith trajectory to the corresponding point on the average trajectory; SPVAR is the spatial variation of each group of trajectories; and TSV is the total spatial variation. The stepwise cluster analysis method can group the adjacent points into one category in a large number of statistical samples, and then select the trajectories with higher similarity for classification. The more classifications, the closer the situation is to the real situation, and the smaller the error of the results.
Cluster analysis was performed on 8760 or 8784 trajectories for each year throughout the study period to identify the transport pathways of pollutants in different periods. In this study, the clustering was set to result in eight trajectories.
2.3. Potential Source Contribution Function (PSCF) and Concentration Weighting Trajectory (CWT) Analysis
2.3.1. PSCF Analysis
In this study, PSCF analysis was used to locate the pollution sources. The weighting factor Wij used in this study reduced the uncertainty of the PSCF results, called WPSCF, and analyzed the potential source contribution areas of PM2.5 and O3 in the capital cities of northeast China for the years 2016–2020 overall and for single years 2016 and 2020 [21]. In order to calculate the PSCF, the area through which the trajectory passes should first be gridded, and the grid resolution was set to 0.5 × 0.5 in this study [22,23].
For the PSCF analysis of trajectories, we combined the pollution of PM2.5 and O3 in northeast China to mark trajectories with O3 concentrations more significant than the 75th percentile and PM2.5 concentrations greater than 75 μg/m3 as exceedance trajectories, where the PM2.5 limit value was the limit value of the secondary standard of the National Ambient Air Quality Standard (NAAQS) set by the Ministry of Ecology and Environment of China. A weighting factor Wij was introduced. Its value will depend on the relationship between the sum of the transmission time of all trajectories in a particular grid and the average residence time of each grid. In this study, Wij is expressed by Equation (4):
2.3.2. CWT Analysis
The CWT method can quantify the concentration contribution level of external transport by taking the average value of the concentration of samples corresponding to all trajectories passing through a single grid during the study period [24]. The CWT analysis method can obtain the difference in the pollution level of contaminated trajectories by calculating the weighted degree. In the CWT analysis method, each grid point is assigned a degree of weight. By introducing the same numerical correction from Wij in the PSCF method, the weighted average concentration value (WCWT value) can be used to distinguish the source intensity of potential sources [25,26].
A higher WCWT value in the grid indicates that the air mass passing through the grid results in a high receiving point concentration, and the area corresponding to this grid can be considered as a potential area of high concentration contribution to the external transport of pollutants from the receiving area.
2.4. Health Risk Assessment
In this study, health risks associated with O3 and PM2.5 via the inhalation route were calculated according to the recommended methods of the U.S. EPA and previously reported studies [27,28]. Exposure concentrations (EC) of O3 and PM2.5 were calculated according to Equation (5).
In this expression, CA is the concentration of O3 and PM2.5; ET is the exposure time (3 h/day); EF is the exposure frequency (300 d/year); ED is the exposure duration (25 years); and AT is the average time (non-carcinogenic risk: ED × 365 d/year × 24 h/day, carcinogenic risk: 70 years × 365 d/year × 24 h/day). The hazard quotient (HQ) method was used to estimate the non-carcinogenic risk. The carcinogenic risk CR was calculated from the Inhalation Unit Risk (IUR). The HQ and CRs are expressed by Equations (6) and (7).
In the above equation, REL is the reference exposure level. According to the NAAQS, the second upper limit standards for O3 and PM2.5 were 160 μg/m3 and 75 μg/m3, respectively. The IUR value per μg/m3 of PM2.5 was 0.008 [29]. The non-carcinogenic and carcinogenic risks of PM2.5 were calculated. In contrast, due to the lack of available data on exposure parameters, only non-carcinogenic risks were determined for O3 exposure. An HQ value less than 1 indicates no significant risk. A CR value less than 1 × 10⁻⁶ indicates a negligible cancer risk, a CR value between 1 × 10⁻⁶ and 1 × 10⁻⁴ indicates a potential cancer risk, and a CR value greater than 1 × 10⁻⁴ indicates a high potential cancer risk.
3. Results and Discussion
3.1. Pollution Characteristics of Major Cities in the Three Eastern Provinces
3.1.1. Annual Variation of PM2.5 and O3 Concentrations
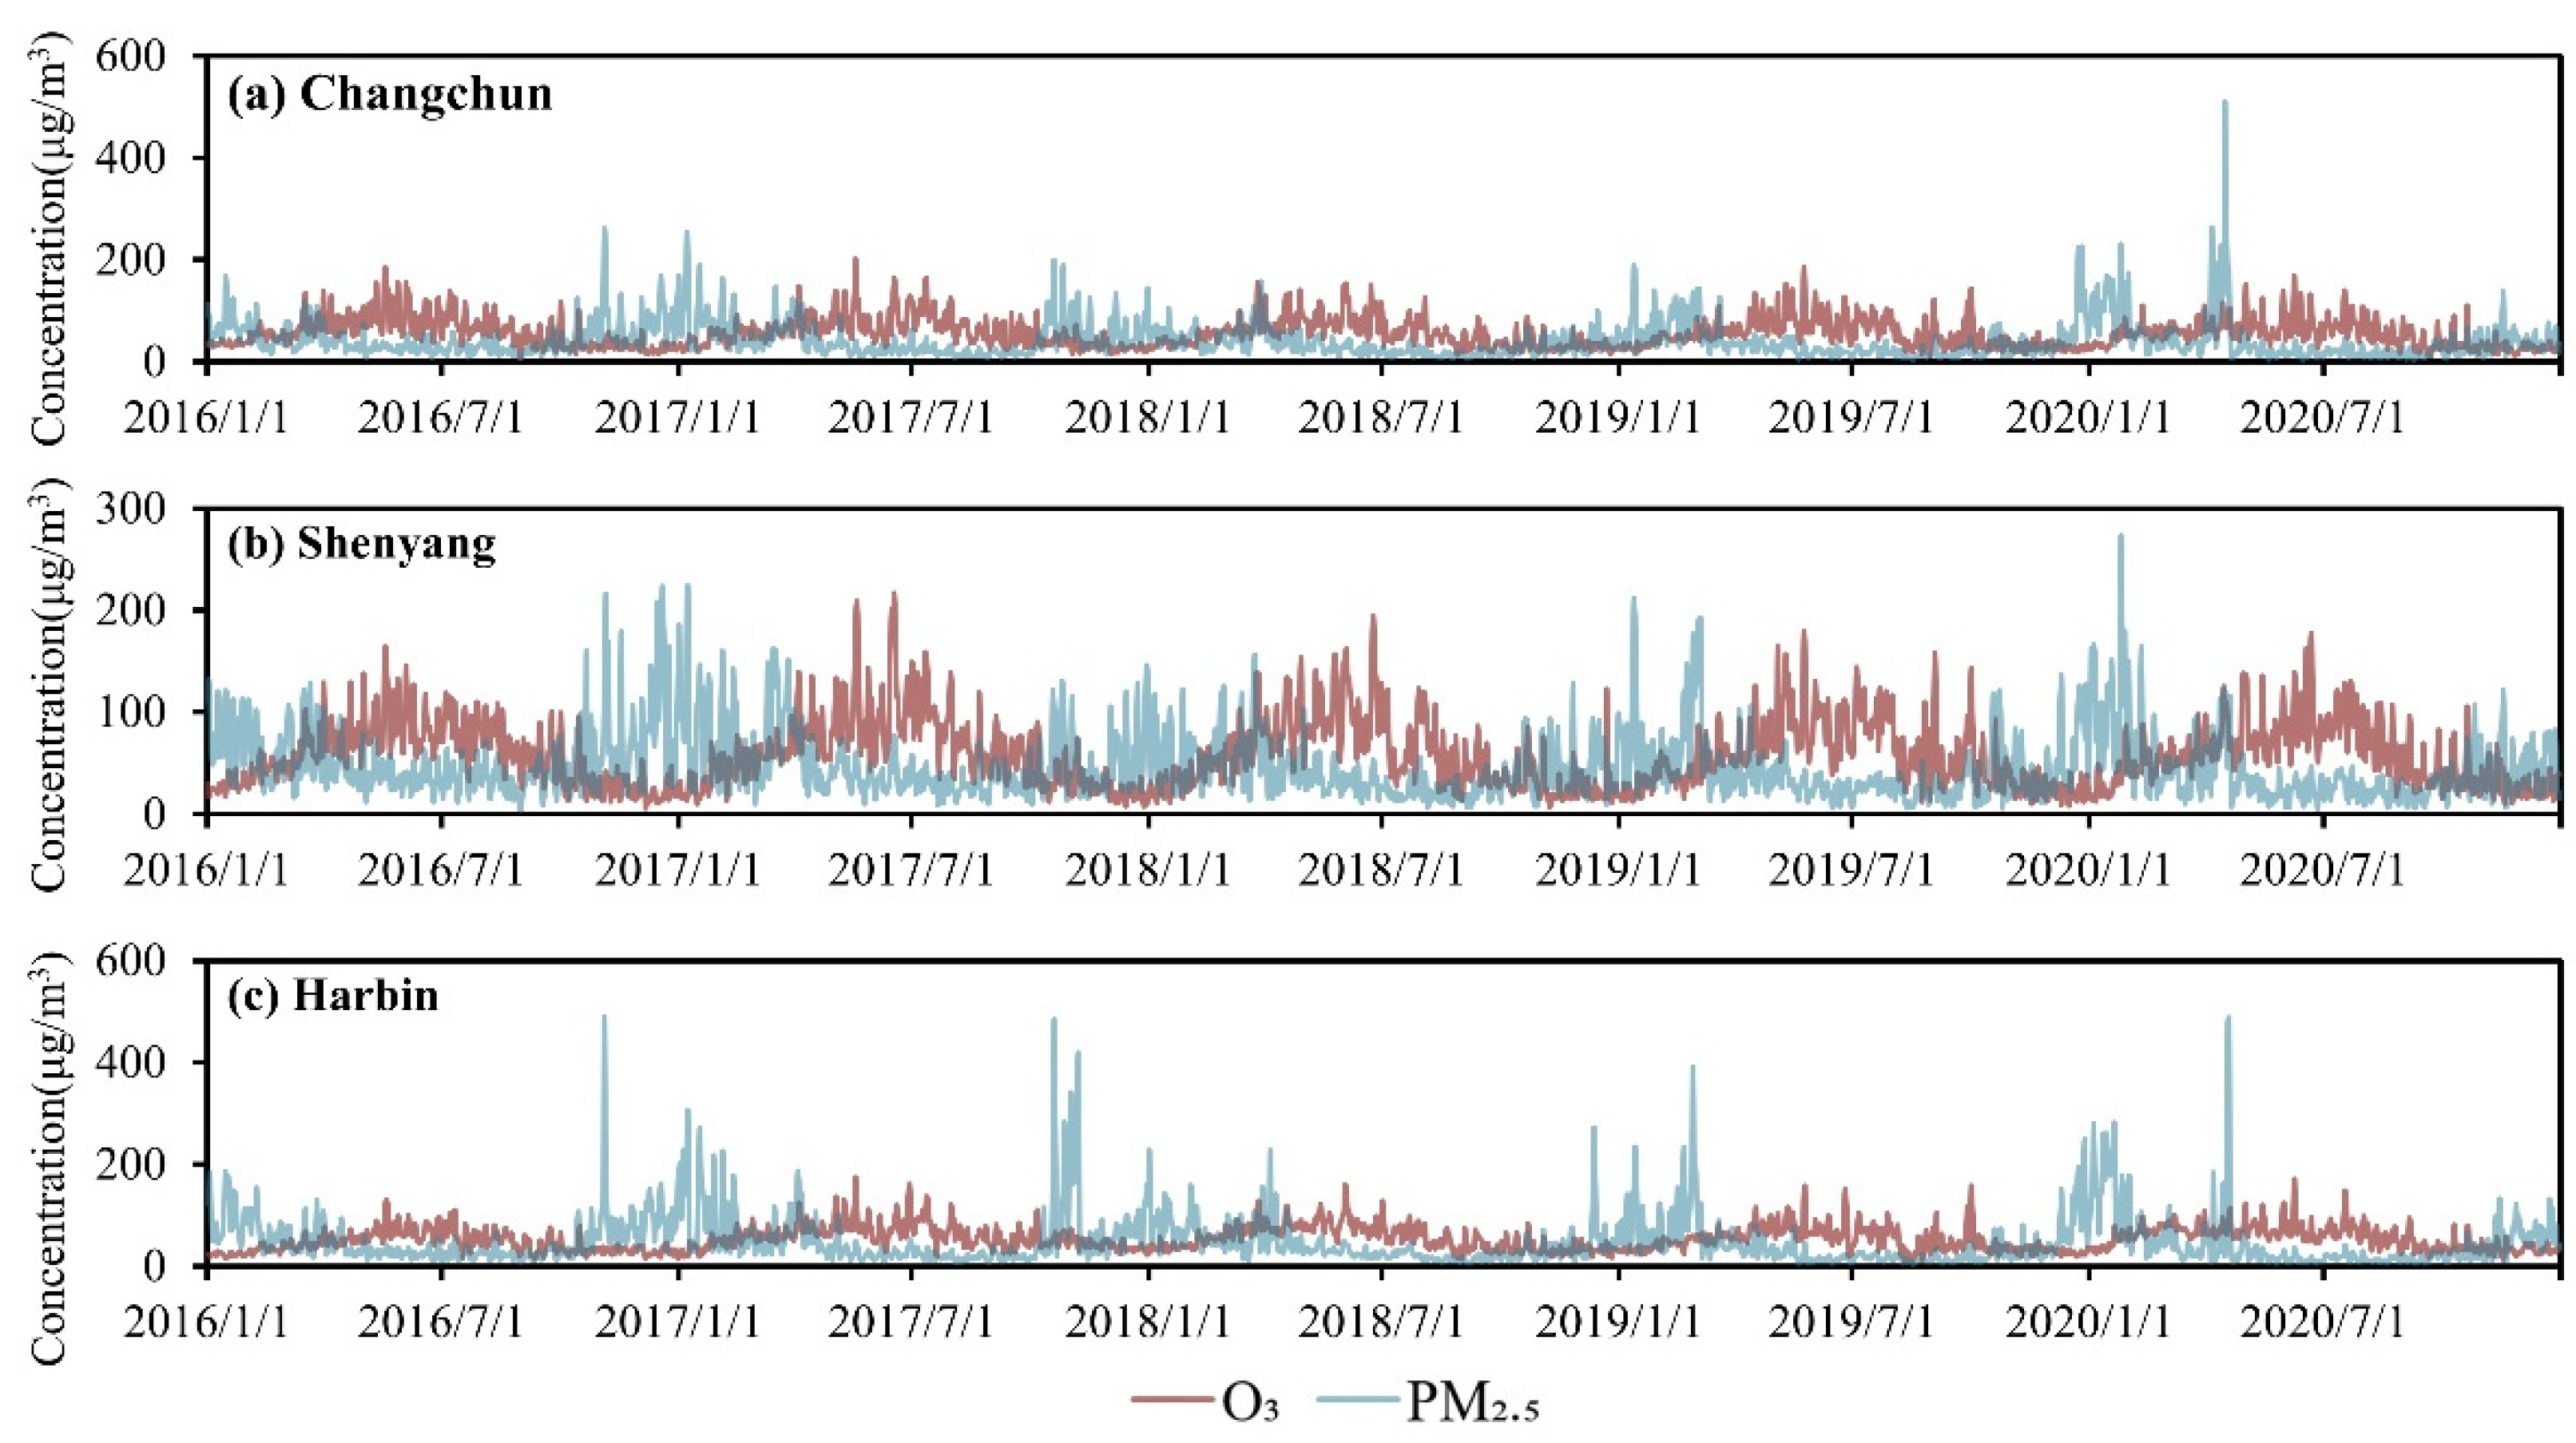
As shown in Figure 2, the five–year time series of O3 and PM2.5 shows that, in general, PM2.5 shows a high concentration in winter and a low concentration in summer in these five years, which is basically consistent with the results of other studies [30], mainly because there is a heating period in northeast China, which generally reaches about five months, so it shows a trend of high PM2.5 in roughly late October–early April [31,32]. The overall trend of PM2.5 is high. For O3, concentrations are higher in the late spring, throughout the summer, and early autumn in the three major cities in the northeast than in the winter, that is, they are higher in May–September, mainly because of the high temperature in summer and low temperature in winter, and O3 has a certain sensitivity to temperature [33]. It is also noteworthy that in winter, all three cities experience pollution events with different degrees of high concentrations, with Harbin having the highest frequency, with varying degrees of high PM2.5 concentration days (>300 μg/m3) in each of the years 2016–2020, Changchun in 2020, and Shenyang without, with Harbin reaching a maximum daily average concentration of 487.8 μg/m3, while Changchun reached a maximum of 508.4 μg/m3, which was the highest value among the three cities, and Shenyang was 266.9 μg/m3.
3.1.2. Relationship between Meteorological Factors and PM2.5 and O3
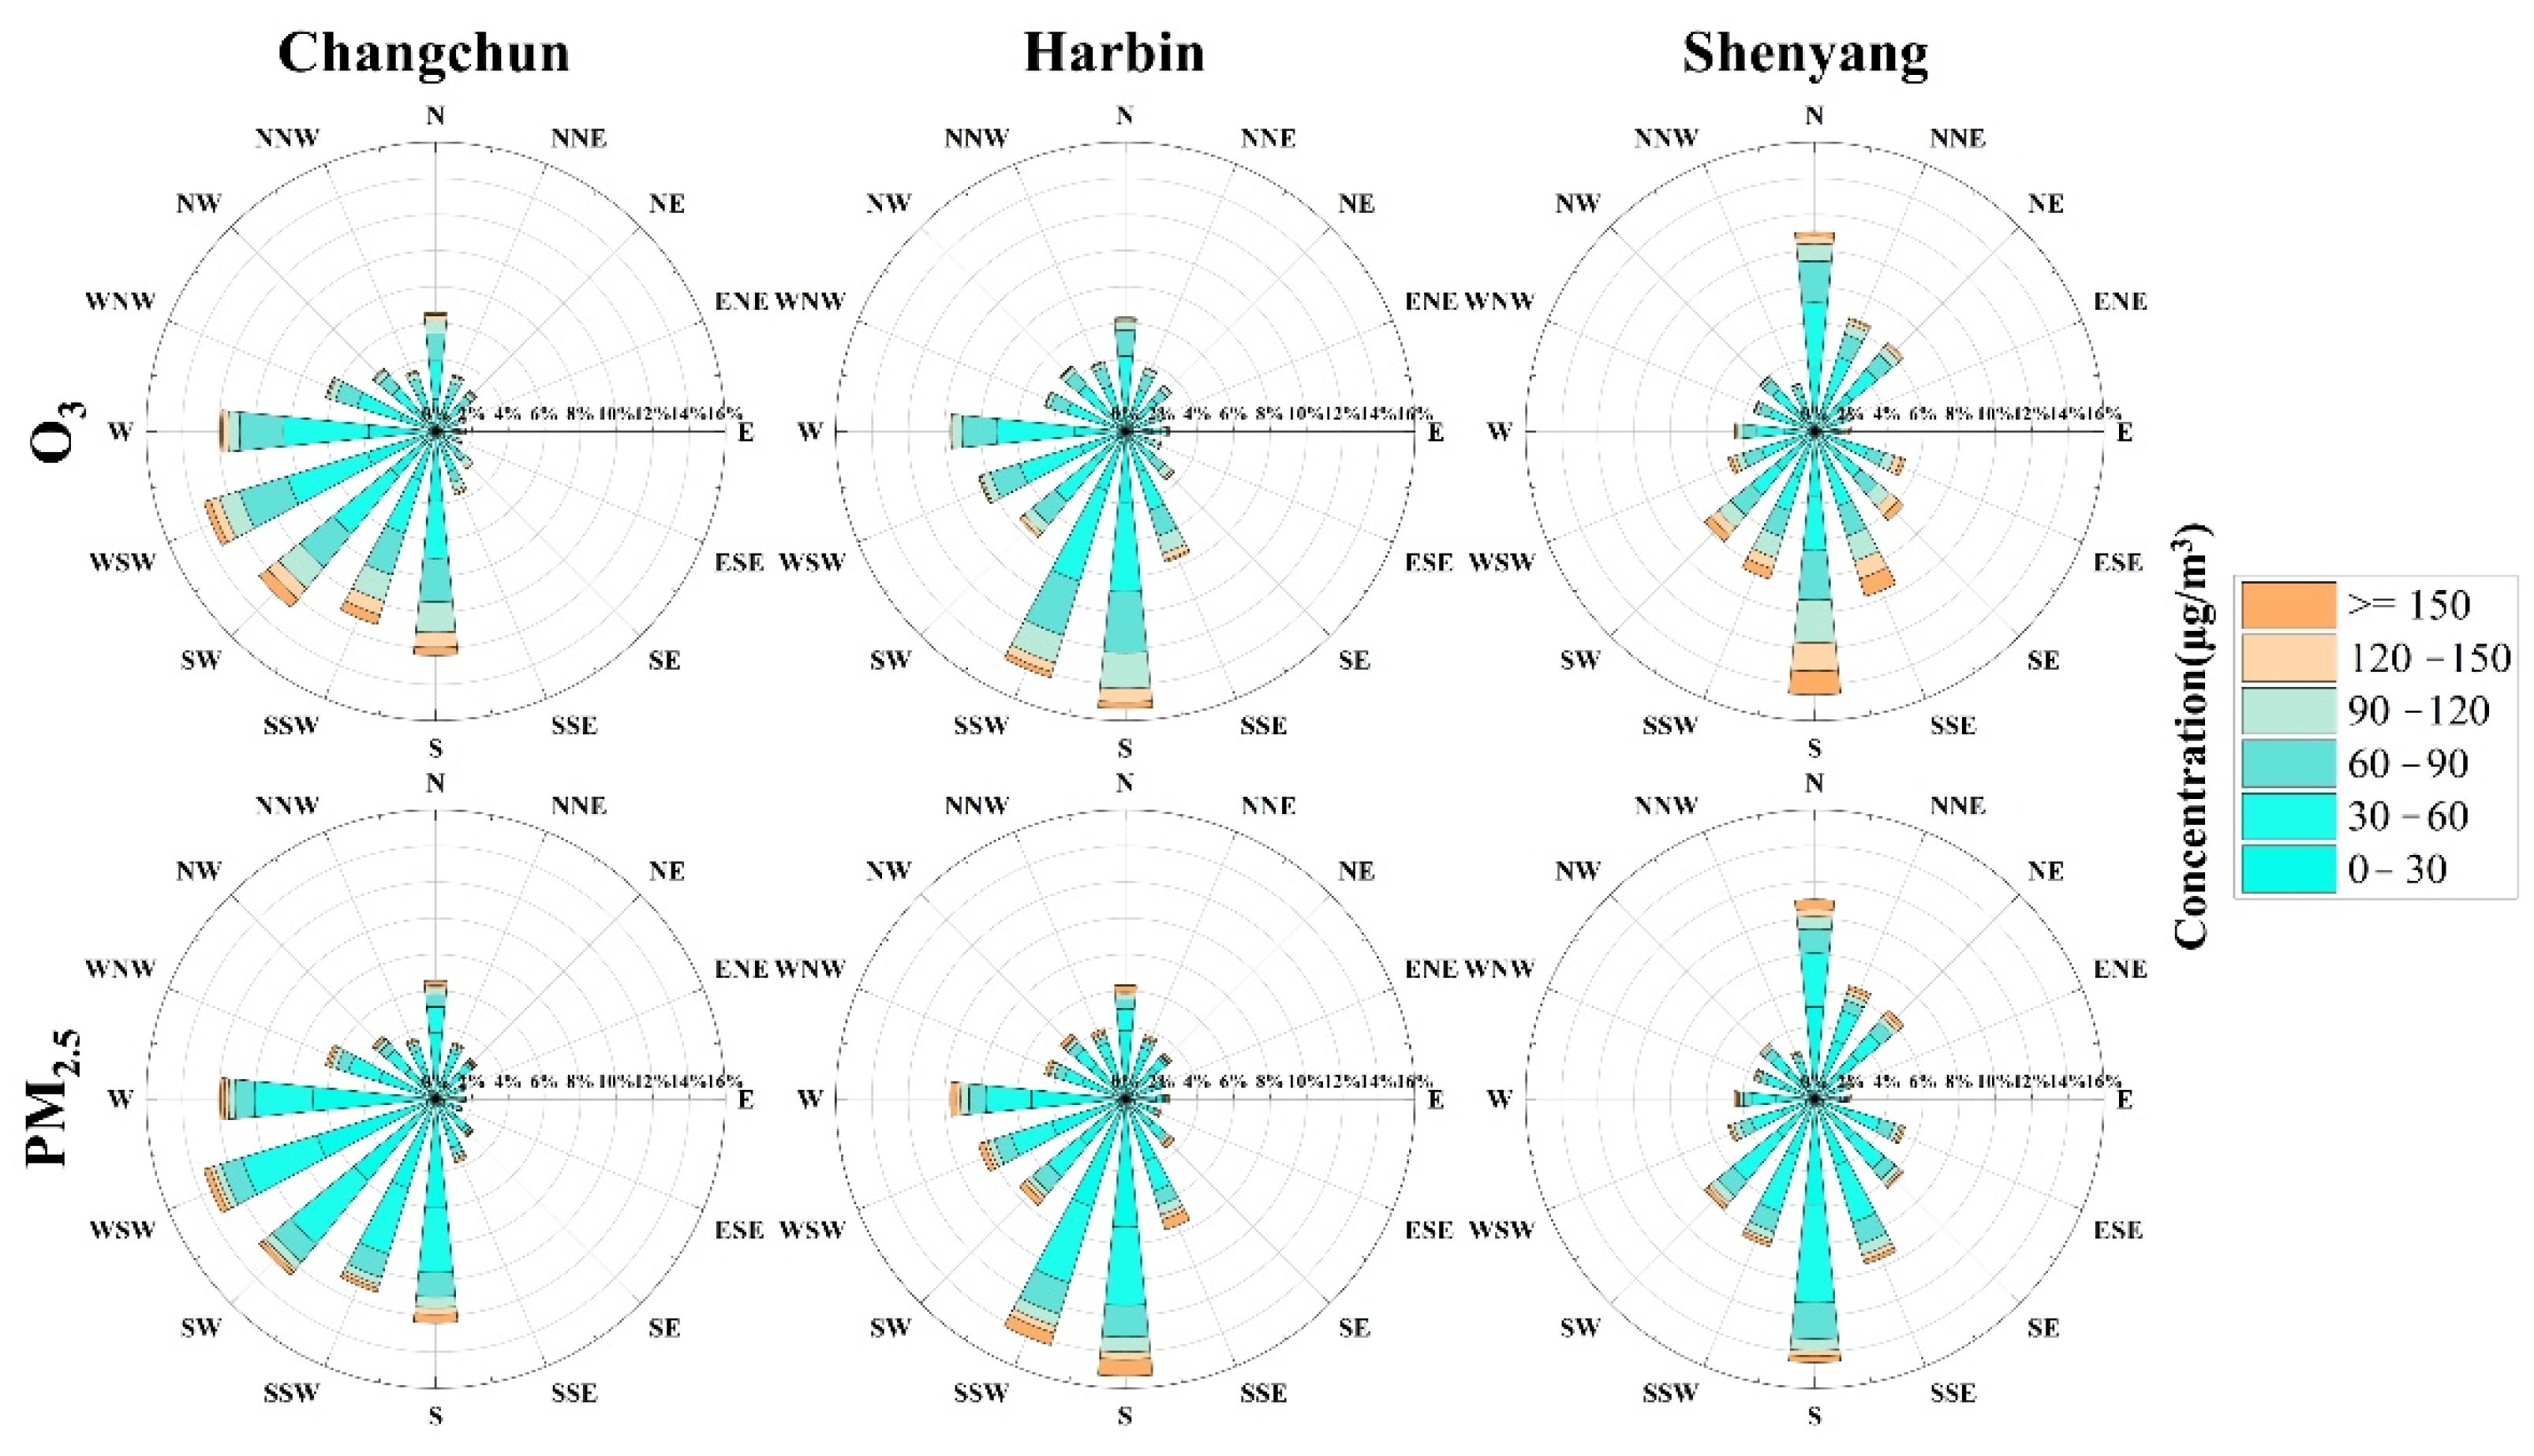
The distribution of PM2.5 and O3 in 2016–2020 in the three provincial capitals in each wind direction is shown in Figure 3. The dominant wind direction in Changchun and Harbin is southwest followed by northwest, and the dominant wind direction in Shenyang is southward followed by northeast. The results show that one of the influential factors causing pollution in the northeast region may be the transfer of pollutants from other surrounding areas to the downwind region due to atmospheric flow, while higher wind speeds on clean days may also serve to disperse pollutants, which may also reduce pollutant concentrations in the northeast region [20].
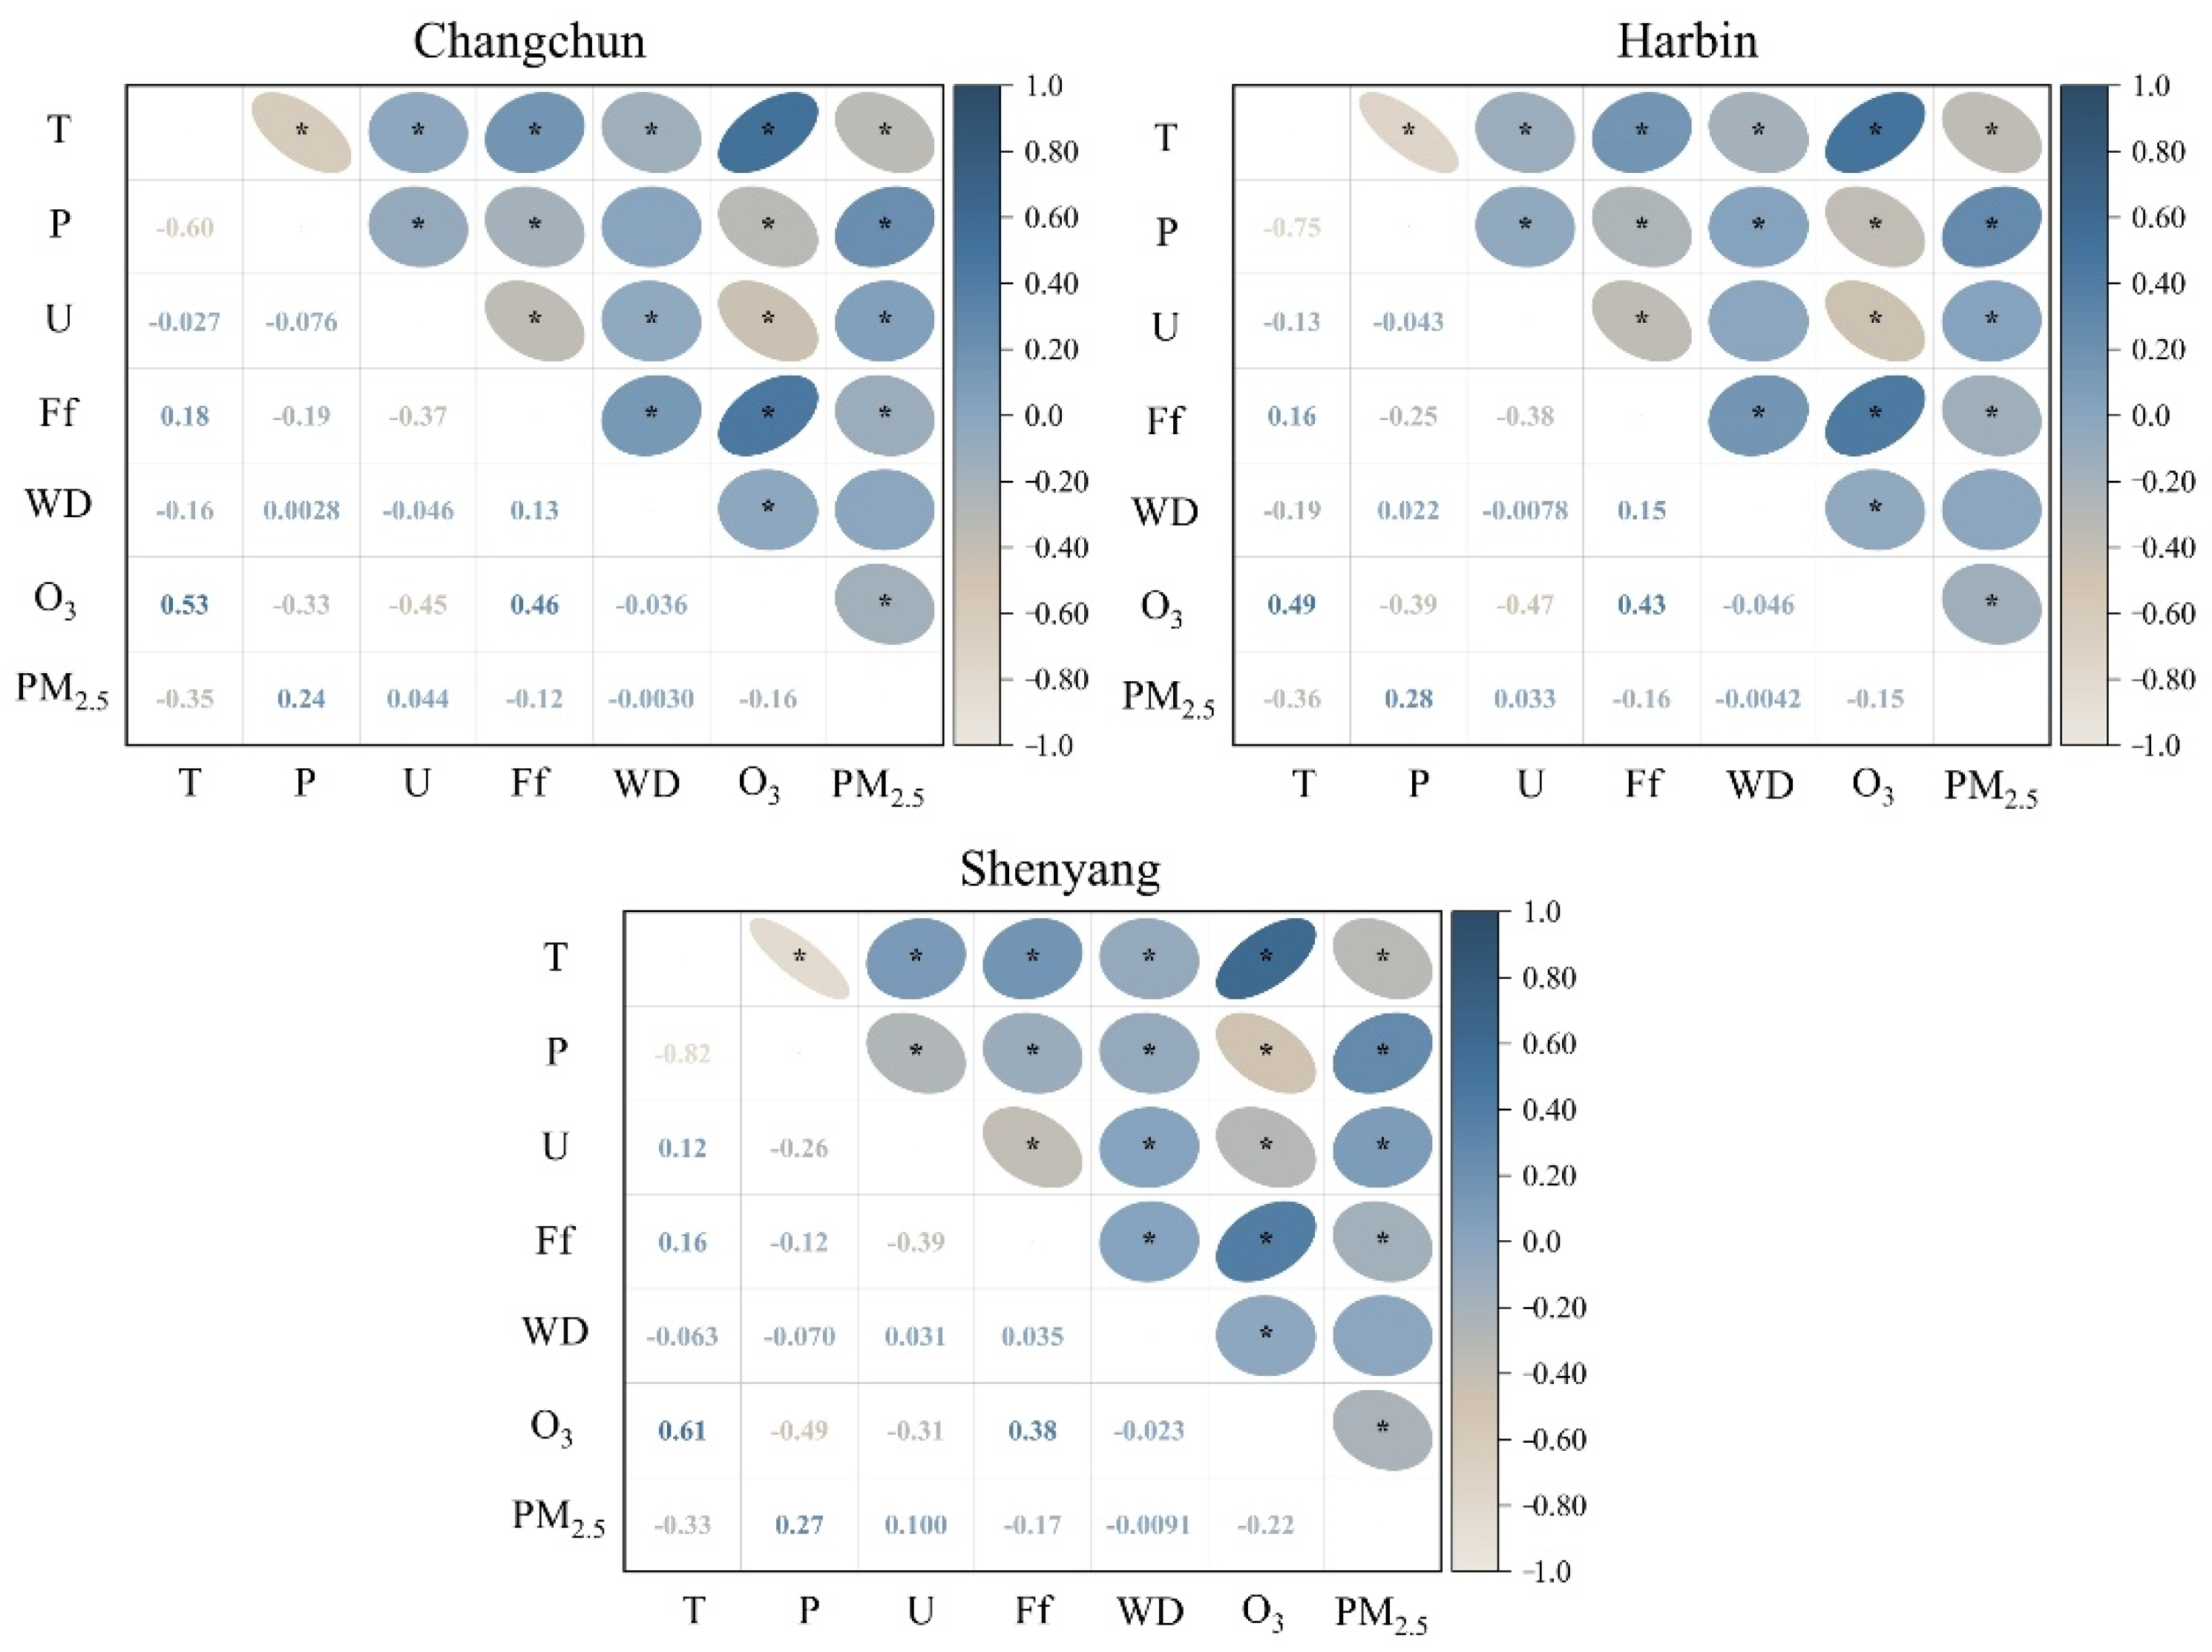
As shown in Figure 4, the correlations between PM2.5 and O3 and other meteorological factors were most significant in the studied cities. PM2.5 was positively correlated with atmospheric pressure and relative humidity and negatively correlated with temperature and wind speed in all cities. The highest correlation coefficients of PM2.5 with atmospheric pressure and temperature were in Harbin, −0.36 and 0.28, respectively, and the highest correlation coefficients with relative humidity and wind speed were in Shenyang, 0.1 and −0.17, respectively. It is worth noting that PM2.5 was not significantly correlated with wind direction, but O3 was negatively correlated with wind direction; this result indicates that in the large cities in the northeast region, PM2.5 from regional transmission PM2.5 concentrations do not account for a high proportion, mostly from local sources, while O3 is influenced by regional transport, which leads to an increase in local O3 concentrations.
O3 is positively correlated with temperature and wind speed in each city and negatively correlated with atmospheric pressure and relative humidity. The highest correlation coefficients with temperature and atmospheric pressure were in Shenyang with 0.61 and −0.49, respectively; relative humidity and wind direction in Harbin with −0.47 and −0.046, respectively; and wind speed in Changchun with 0.46. Notably, the correlation results of O3 and PM2.5 with each meteorological factor were the opposite, especially with wind direction and wind speed. This indicates that external sources contribute more O3, while PM2.5 is more from local sources.
3.2. Backward Trajectory-Based PSCF and CWT Analysis
3.2.1. Backward Trajectory Clustering Analysis
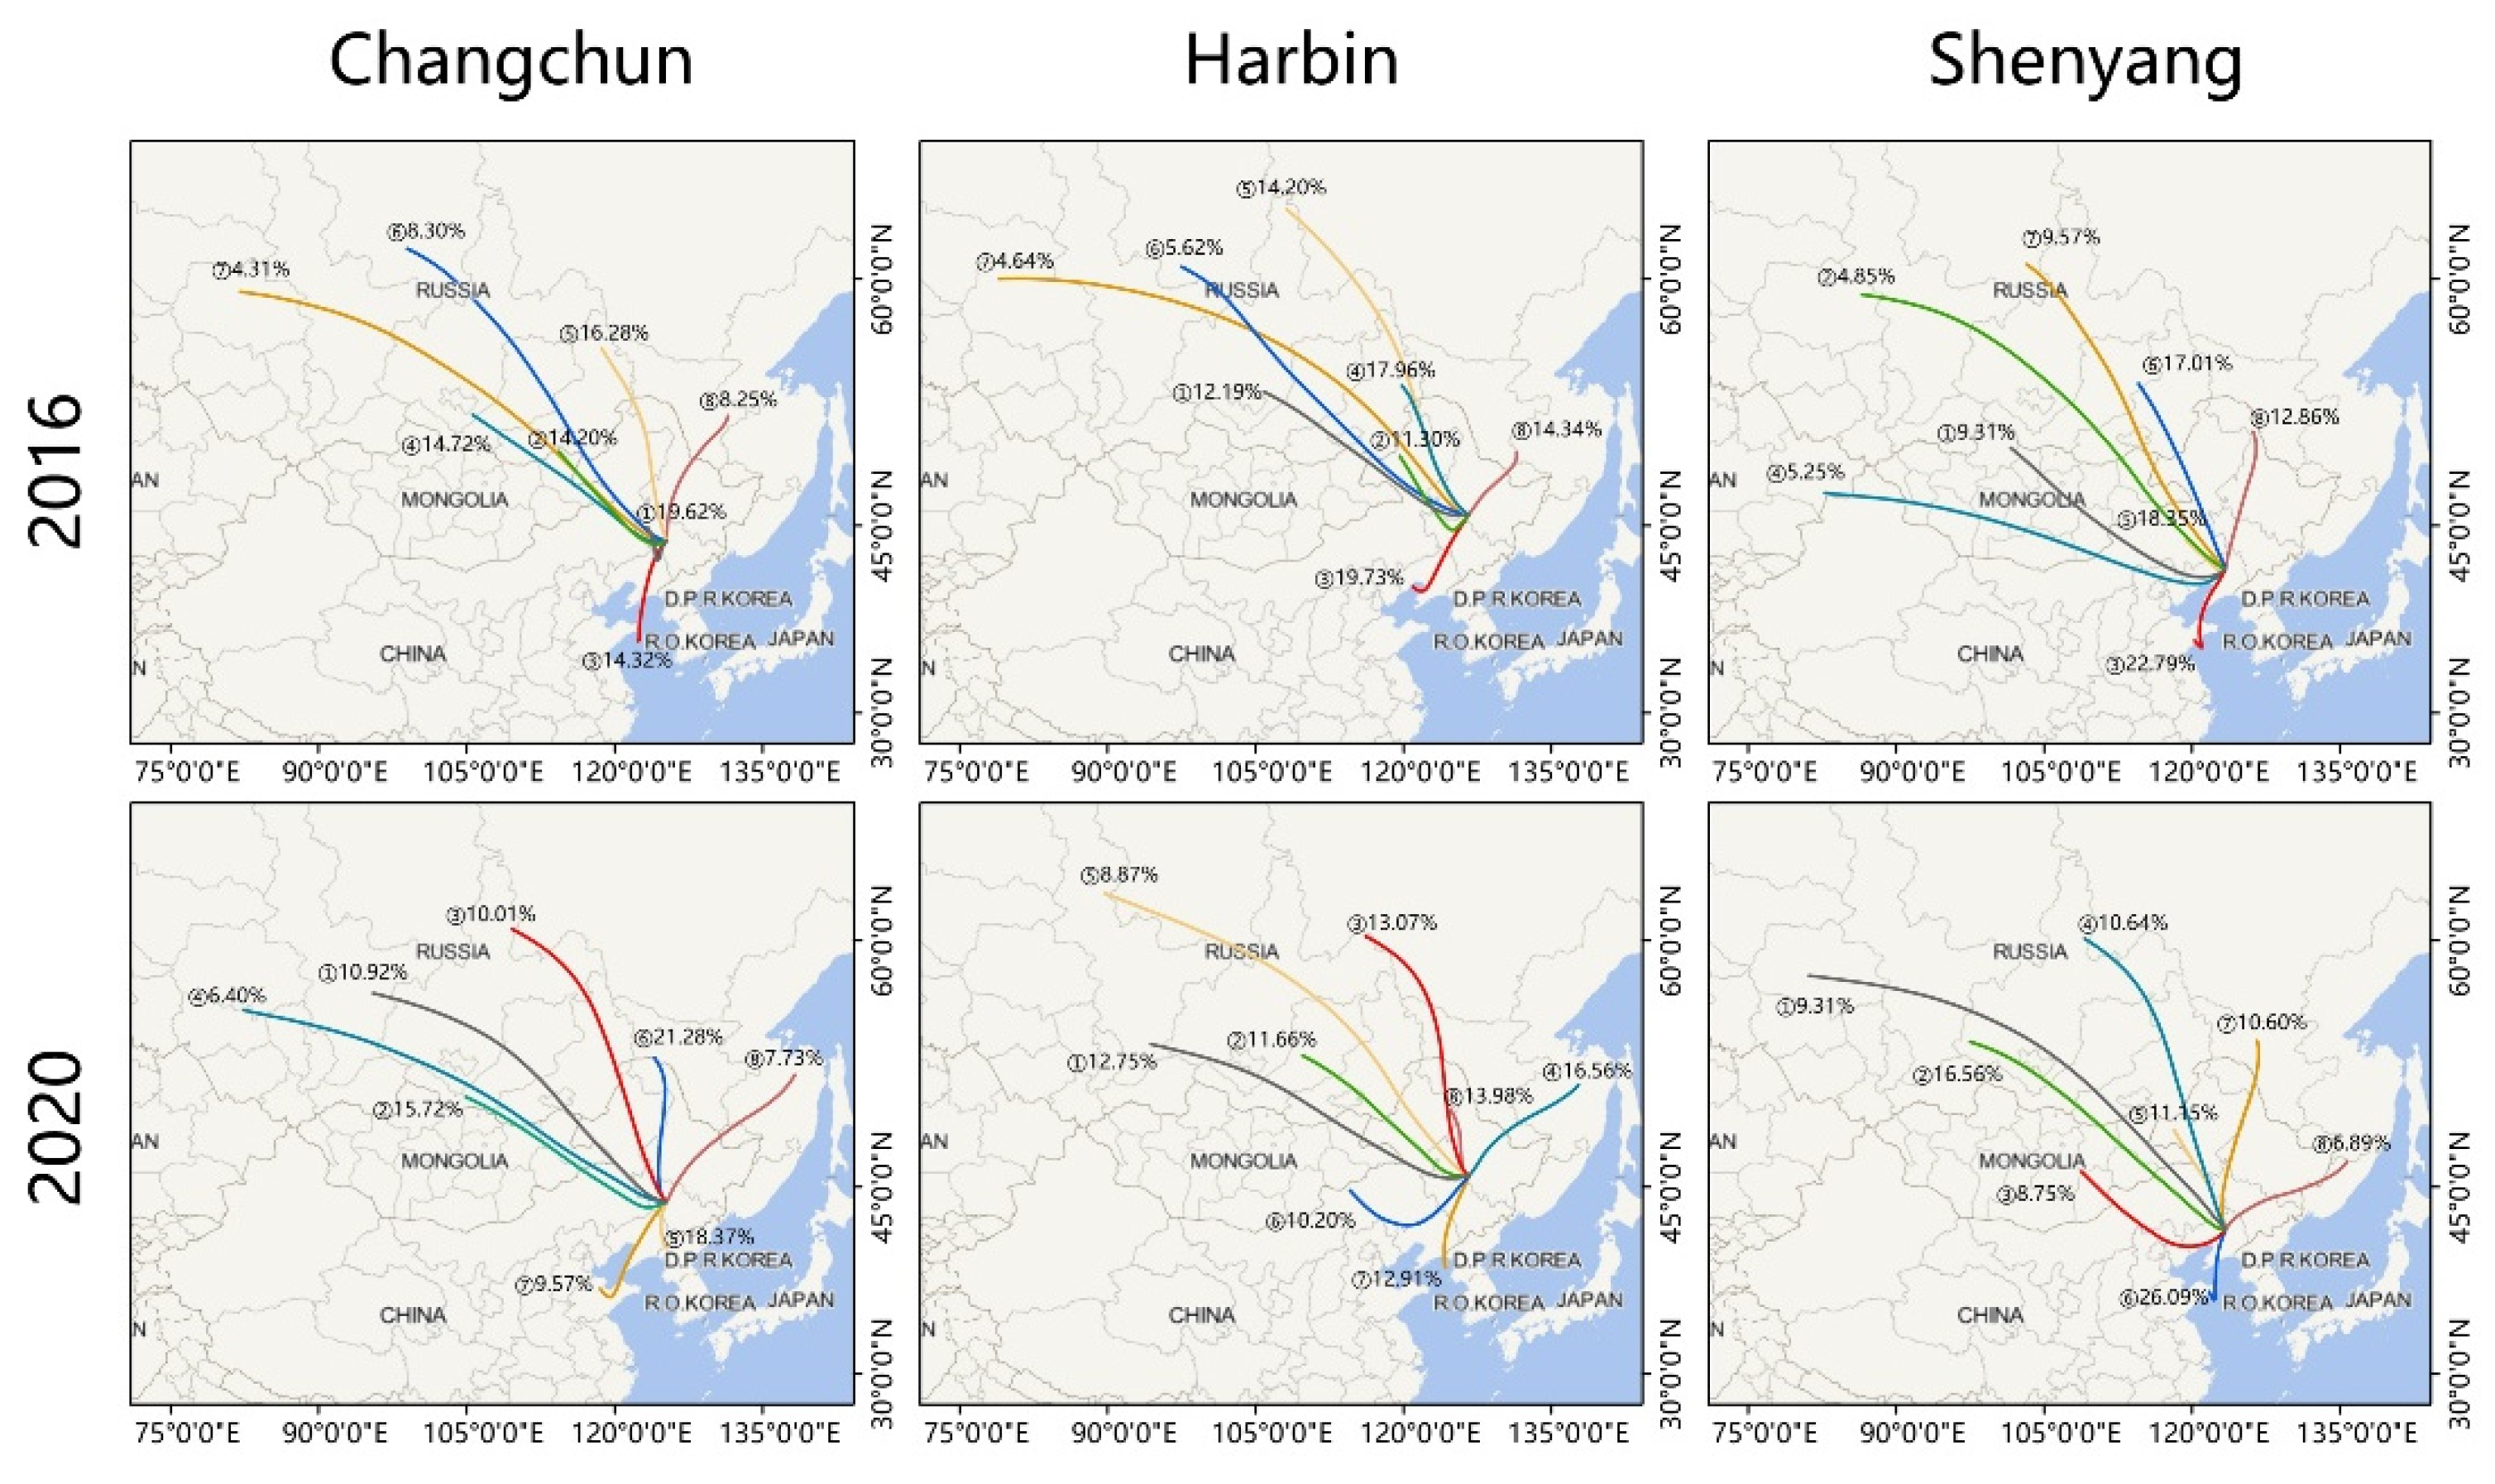
As shown in Figure 5, Changchun, Harbin, and Shenyang are all dominated by the northwest direction trajectory, followed by the southwest direction, and the trajectory with the longest transmission distance also tends to appear in the northwest direction. For Changchun, the proportion of northwest trajectories was 77.43% in 2016, while it decreased to 64.33% in 2020, while the proportion of southwest trajectories increased from 14.32% in 2016 to 27.94% in 2020. For Harbin, the northwest trajectory accounted for 64.34% in 2016, while it decreased to 56.41% in 2020, and the southwest trajectory increased from 19.73% in 2016 to 23.11% in 2020. For Shenyang, the percentage of northwest trajectory was 65.91% in 2016, while it dropped to 60.33% in 2020, and the percentage of southwest trajectory increased from 22.79% in 2016 to 26.09% in 2020.
Overall, the city with the most northwest-oriented trajectory was Changchun, which is located in the central part of the northeast region, with the Changbai Mountains in the west, so the air masses transmitted from Russia and Japan in the east are small, while too many mountains do not block Harbin and Shenyang, so the air masses transmitted in the east share part of the percentage. The city with the most southwestern trajectories was Shenyang, which is due to the different altitudes of the three cities. Shenyang, which has the lowest latitude, was most strongly influenced by the southward Bohai anticyclone, so the total percentage of trajectories was the highest, while Harbin, which has the highest latitude, was the least influenced by the Bohai anticyclone, so the percentage of trajectories was the lowest. It can also be found that compared with 2016, the trajectory share of the southwest direction in all three cities increased in 2020, while the trajectory share of the northwest direction decreased, which was related to the annual meteorological conditions in the year.
3.2.2. PSCF Analysis
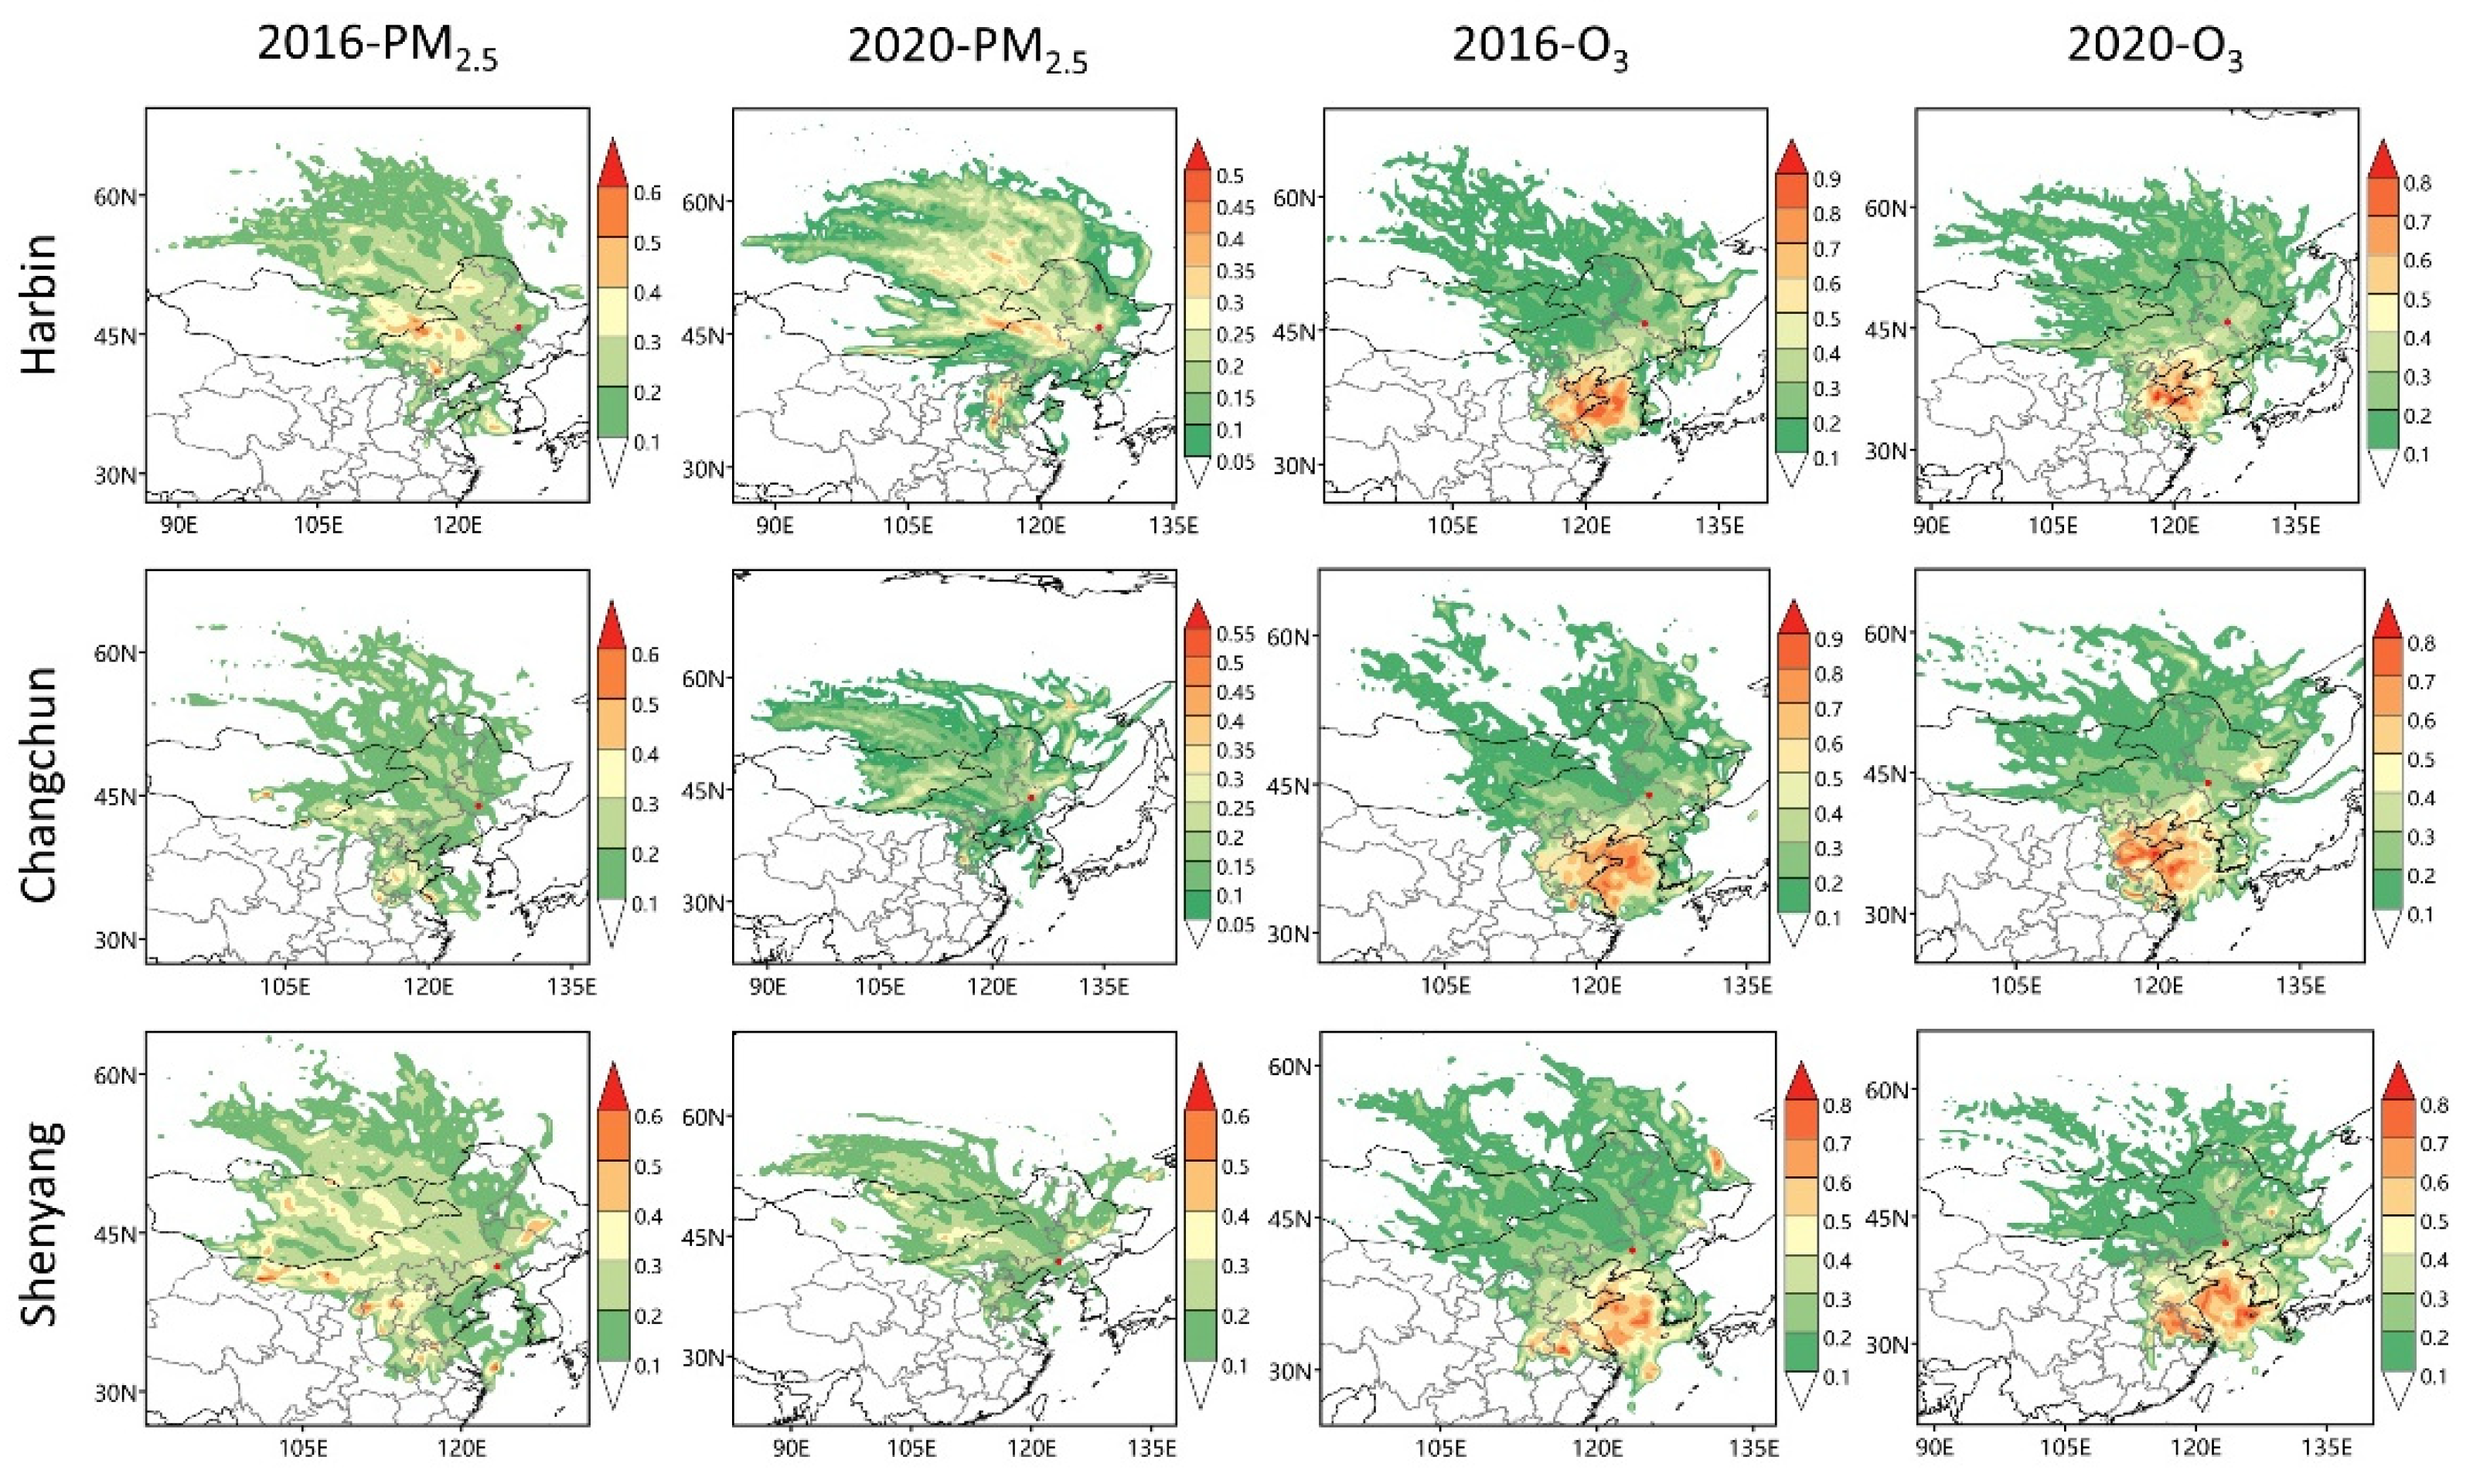
As shown in Figure 6, the potential source areas for PM2.5 in Harbin were mainly in Mongolia, Inner Mongolia, and Hebei in 2016, with the addition of Henan in 2020, and the potential source areas in Changchun were mainly in Mongolia, Shandong, and Jiangsu in 2016, with Shandong and eastern Russia in 2020. The potential source areas of PM2.5 in Shenyang were mainly located in Mongolia, Inner Mongolia, and Shanxi as well as the border between Heilongjiang and Jilin and the East China Sea, which will be reduced to Mongolia, Jilin Province and Heilongjiang Province in 2020. The above results show that the northwestern countries and provinces are the main contributors to the external sources of PM2.5 in these three large cities. The reason is that the dust aerosols from Mongolia, Russia, and Inner Mongolia and the anthropogenic particulate emissions from the passing areas arrive in northeastern China along with the northwestern winds, thus contributing to a certain PM2.5 concentration, indicating that the long-distance transmission of particulate matter is noteworthy.
The potential source areas of O3 in Harbin in 2016 were mainly distributed in Shandong Province, Jiangsu Province, and the Yellow Sea and Bohai Sea, and remain unchanged in 2020. The potential source areas of O3 in Changchun in 2016 were mainly distributed in the same way as Harbin in 2016, and some areas in Anhui Province were added in 2020. The potential source areas of O3 in Shenyang in 2016 were mainly distributed in Anhui, Jiangsu, and the Yellow Sea and Bohai Sea, and remain unchanged in 2020. The distribution of potential source areas for O3 in Shenyang in 2016 was mainly in Anhui, Jiangsu, and the Yellow Sea and Bohai Sea, and remained the same in 2020. In summary, the potential source areas of O3 in these three cities were generally concentrated in Shandong, Anhui, Jiangsu, and the Yellow Sea and Bohai Sea, among which the WPSCF values were generally higher in the Yangtze River Delta region, which emits NOx and VOC plus photochemical pollution due to the developed shipbuilding industry, petrochemical industry, and industry, which play an obvious role in promoting the generation of O3 and will further influence the atmospheric oxidation through regional transmission. This affects the atmospheric oxidation in the northeast, resulting in high WPSCF values in these areas. The O3 generated from the refraction of sunlight by marine droplets in the Yellow Sea and Bohai Sea reaches the northeast region through regional transport, which is also the reason for the high WPSCF values in the Yellow Sea and Bohai Sea region.
3.2.3. CWT Analysis
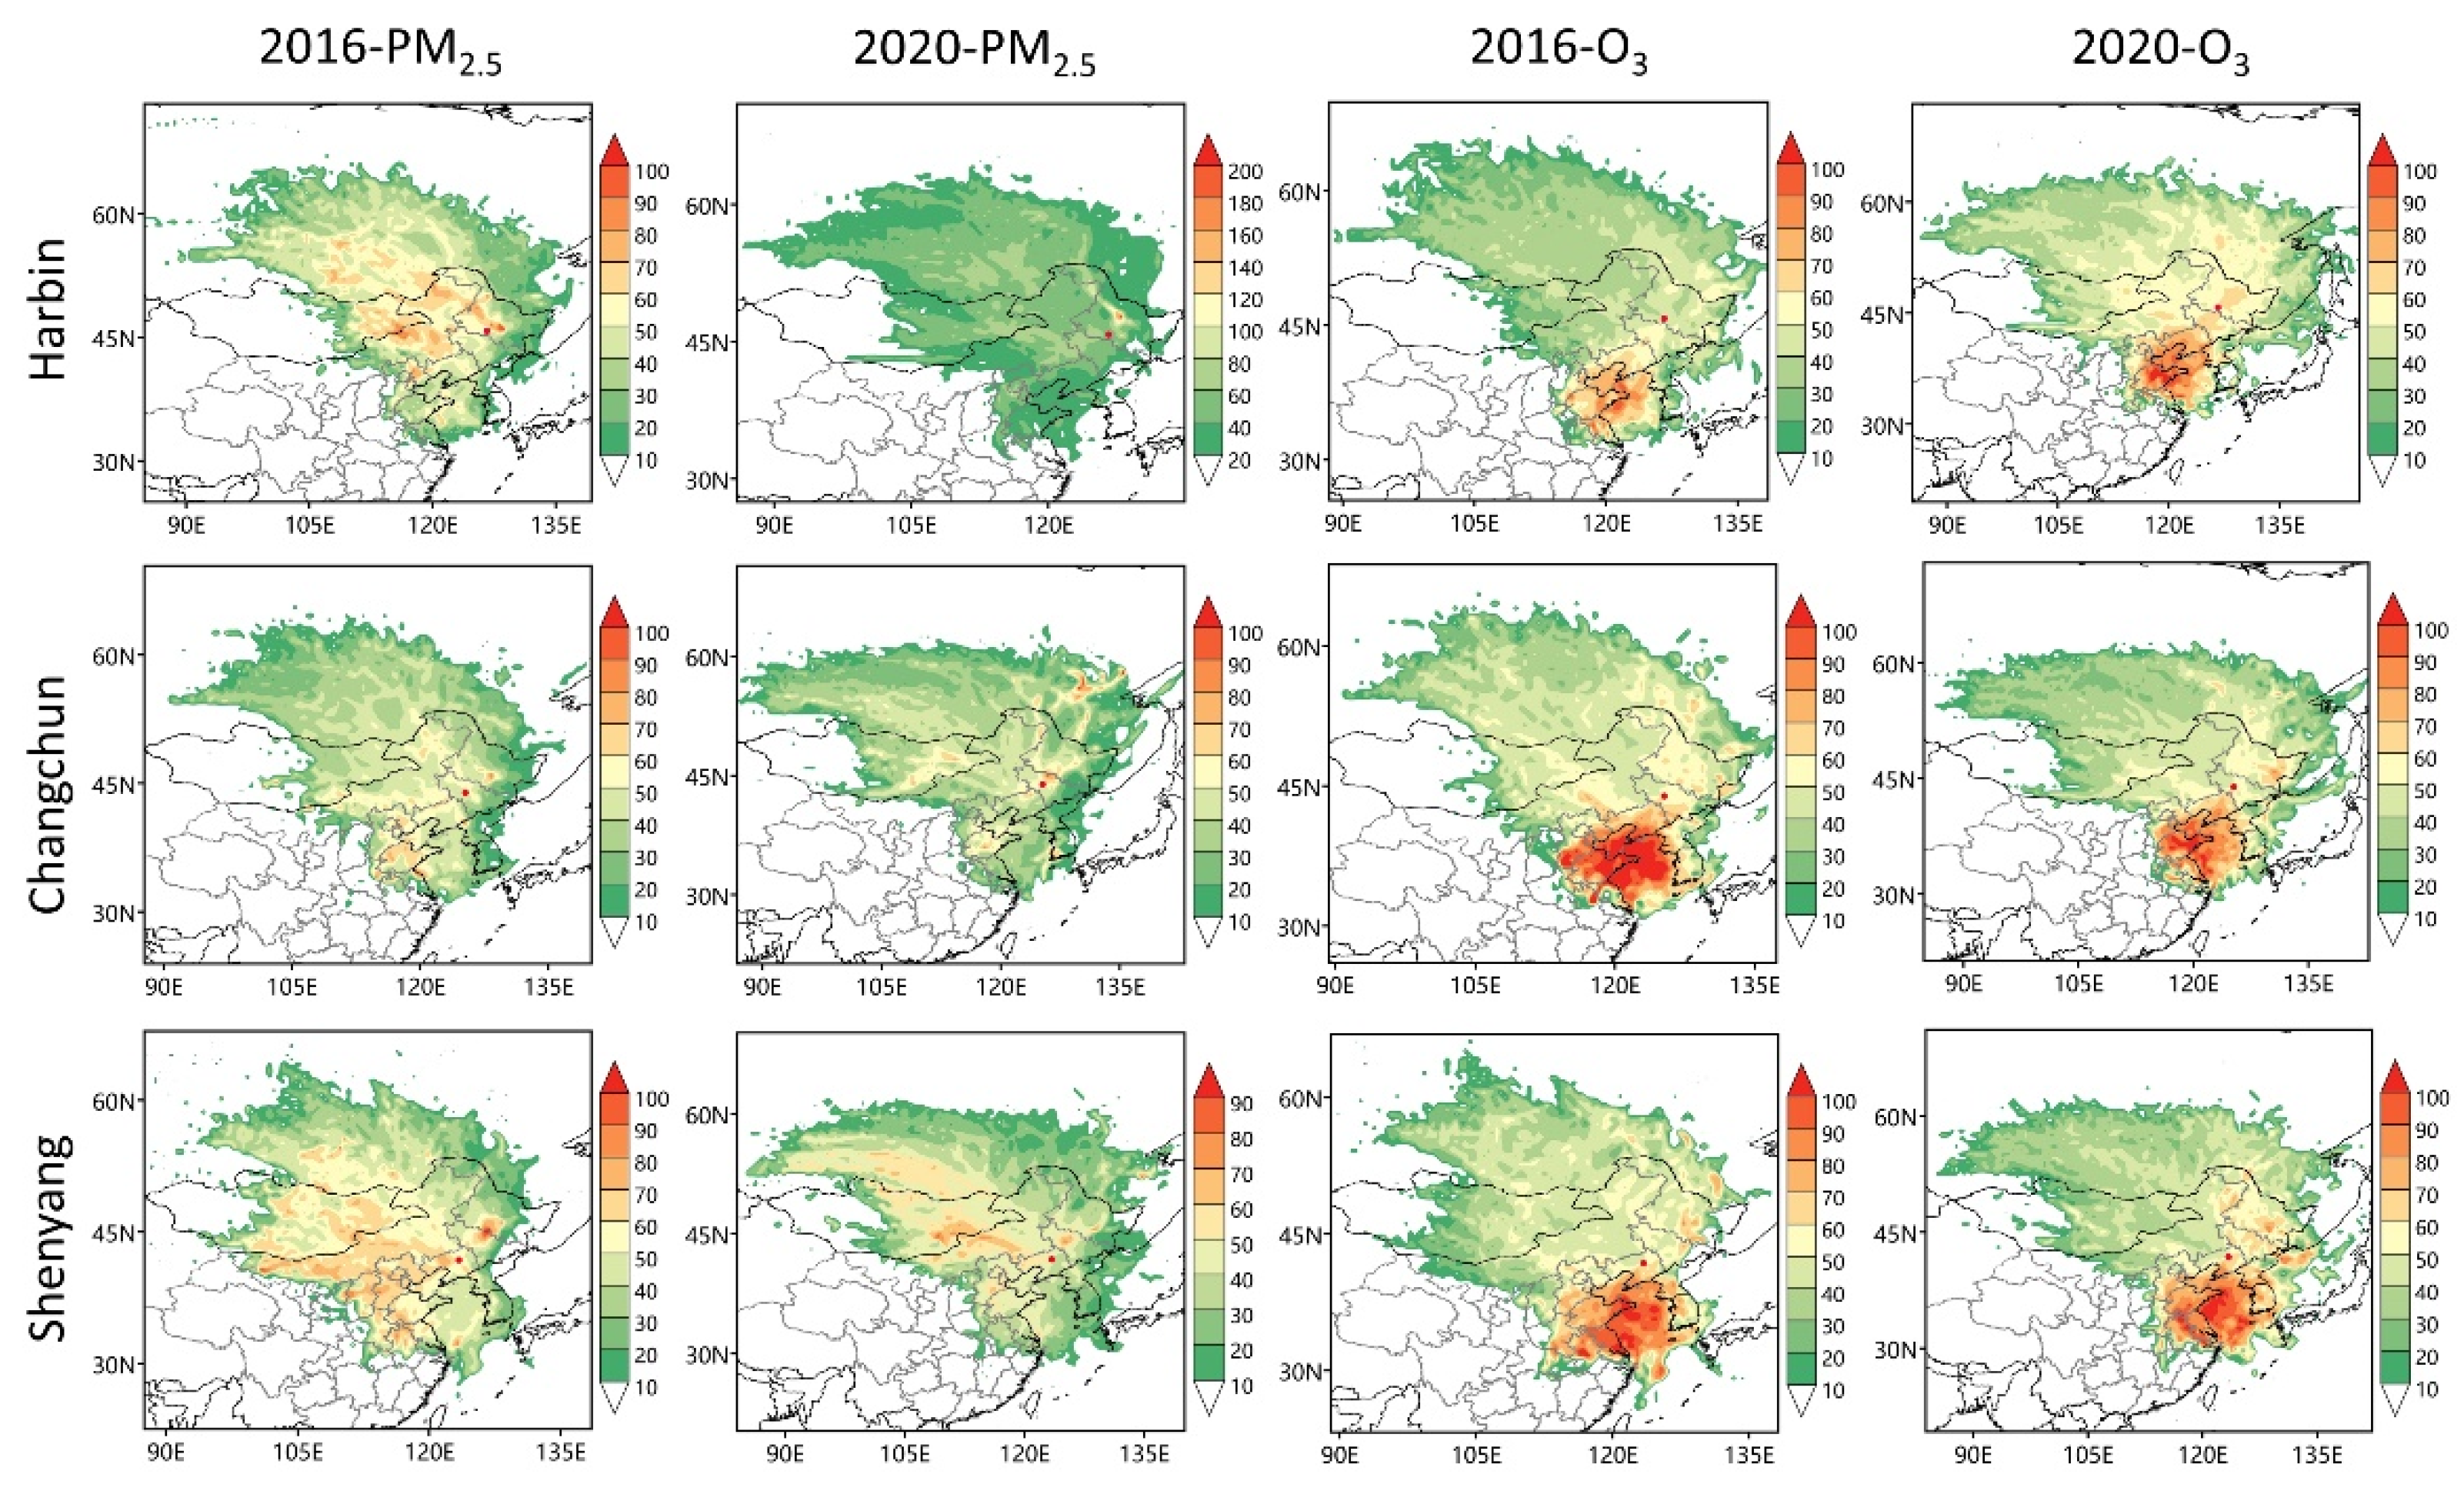
The CWT distribution characteristics of PM2.5 and O3 in the capital cities of northeast China in 2016–2020 are shown in Figure 7. For PM2.5, in the results for Harbin, the high contributing regions are mainly concentrated in Mongolia, Russia, and Inner Mongolia in 2016 and 2020. In Changchun’s results, the high contributing regions were concentrated in Heilongjiang, Inner Mongolia, Shandong, and Hebei Provinces in 2016, and changed to Russia, Mongolia, Jilin, and Shandong Provinces in 2020. For Shenyang, the high contributing regions were concentrated in Russia, Mongolia, Inner Mongolia, Shanxi, Hebei, and northeast China in 2016 and reduced to Shanxi and Hebei in 2020. For O3, in the results for Harbin, the high contributing regions in 2016 were mainly in Shandong, Jiangsu, and the Yellow and Bohai Seas, with the addition of Liaoning in 2020. For Changchun, the high contributing regions were mainly located in Hebei, Shandong, and the Yellow and Bohai Seas in 2016, with the addition of Jiangsu and Liaoning in 2020. In the results for Shenyang, the high contributing areas were mainly located in Shandong, Jiangsu, Anhui, and the Yellow Sea and Bohai Sea in 2016, and remain unchanged in 2020.
In summary, it can be concluded that the PM2.5 concentrations contributed by neighboring cities are essentially the contribution of local emissions in northeast China, while long-range transport also contributes a high PM2.5 concentration. Compared with O3, the concentration contribution of PM2.5 through regional transport comes more from the northwest, which is consistent with the cluster analysis results. In contrast, O3 is more influenced by air masses transmitted from the south, which also confirms that O3 pollution south of northeastern China is serious and even affects the air quality in the north, as pointed out by other studies [34].
3.3. Health Risk Assessment
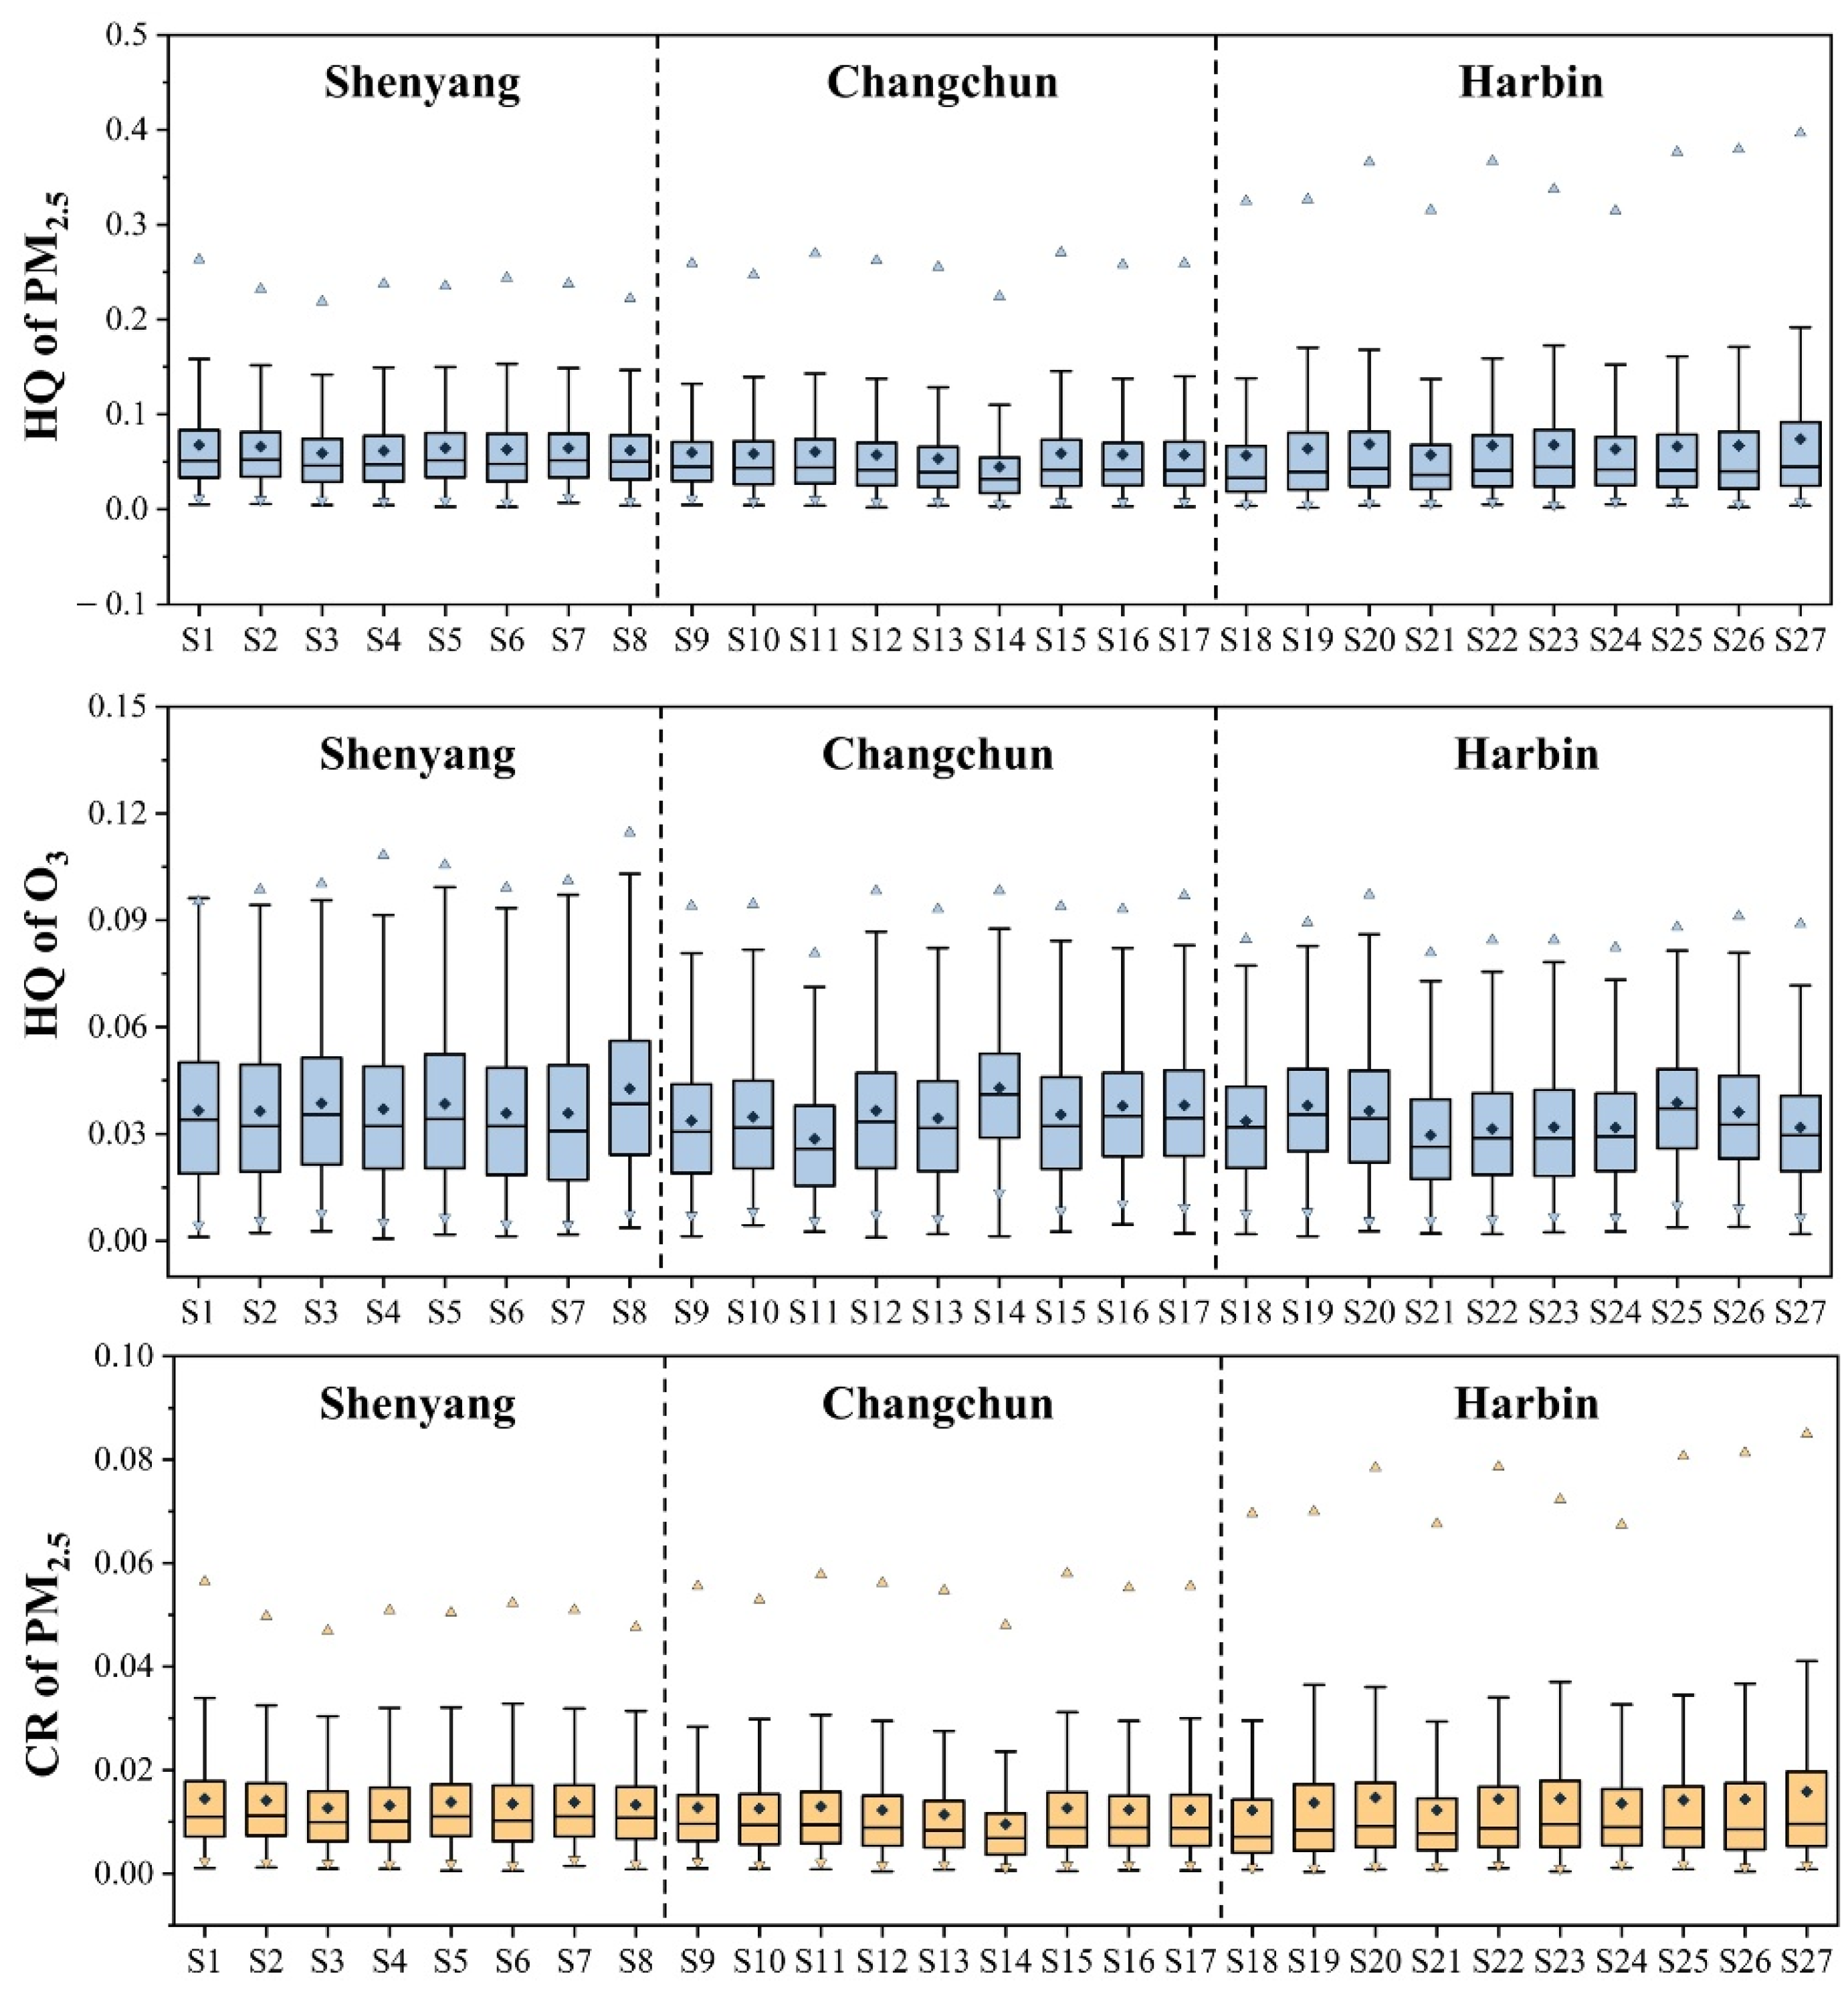
The characteristics of potential non-carcinogenic risk hazard quotient (HQ) and carcinogenic risk (CR) for O3 and PM2.5 in Harbin, Shenyang, and Changchun are shown in Figure 8 and Table 1, Table 2 and Table 3. At all sites, the HQ values of PM2.5 and O3 and the sum of both were below the acceptable limit of 1.0 most of the time, indicating an acceptable risk. However, at most stations in Harbin, the maximum value of HQ for PM2.5 was more significant than 1, reaching a maximum of 2.044, indicating some non-carcinogenic risk on a few heavy pollution days. However, the CR values of PM2.5 were all greater than 1.0 × 10⁻⁴, which had a high carcinogenic risk. In other countries, the same results were obtained by Othman et al. [26] in Selangor, Peninsular Malaysia, and in China, similar results were obtained by Wang et al. [25] in Yancheng, Jiangsu, China.
In Shenyang, the site with the highest HQ mean for O3 was S8, reaching 0.0427; the site with the highest HQ mean for PM2.5 was S1, reaching 0.0675; the site with the highest CR mean for PM2.5 was S1, reaching 0.0145. In Changchun, the site with the highest HQ mean for O3 was S14, reaching 0.0429, and the site with the highest HQ mean for PM2.5. In Harbin, the highest HQ mean for O3 was S25, reaching 0.0387, the highest HQ mean for PM2.5 was S27, reaching 0.0739, and the highest CR mean for PM2.5 was S27 at 0.0158.
In summary, among the three cities, the highest non-carcinogenic risk for O3 was Changchun and the lowest was Harbin. The highest non-carcinogenic risk for PM2.5 was Harbin and the lowest was Changchun, and the results for the carcinogenic risk for PM2.5 were the same as those for the non-carcinogenic risk, and the carcinogenic risk for PM2.5 was high in all three eastern provinces, with the highest Harbin urgently needing to control the pollution of PM2.5, while for O3, even though the HQ values of all three cities were exceeded, Changchun, which had the highest HQ, needed to be prevented.
4. Conclusions
Despite the implementation of boiler renovation projects and straw burning bans in China as well as policies and laws that have effectively reduced the concentrations of various air pollutants, there is still a gap in the cleanliness of the atmosphere in the northeast compared to other developed regions and developed countries. In 2016–2020, three provincial capitals in northeast China also experienced more severe pollution (>300 μg/m3) due to high PM2.5 concentrations caused by coal-fired heating in winter, with Harbin experiencing the highest frequency of severe pollution. The correlation between meteorological factors and PM2.5 and O3 corroborates that the external sources of O3 contribute more and the local sources contribute more of PM2.5.
The cluster analysis results show that the highest proportion of northwest-oriented trajectories was in Changchun and the lowest was in Shenyang, influenced by the surrounding topography. The city with the highest percentage of southwest trajectories was Shenyang and the lowest was Harbin, which is influenced by the Bohai Sea anticyclone and its latitude. The results of the PSCF analysis showed that the main potential source areas of PM2.5 in northeast China were concentrated in Mongolia and Inner Mongolia, and the main potential source areas of O3 were concentrated in Shandong, Jiangsu, Anhui, and the Yellow Sea and Bohai Sea. The results of the CWT analysis showed that the high concentration of PM2.5 in the northeast China contribution areas were mainly concentrated in Russia, Mongolia, Inner Mongolia, Hebei, and northeast China, and the high concentration contribution areas of O3 were mainly concentrated in Shandong Province, Jiangsu Province, and the Yellow Sea and Bohai Sea.
The results of the health risk evaluation showed that the mean HQ values of O3 and PM2.5 in all cities were below the limit values, which indicated that the non-carcinogenic risk of both air pollutants was at an acceptable level. However, the carcinogenic risk of exposure to PM2.5 was relatively high, especially in Harbin, where the highest CR value reached 0.438, indicating that PM2.5 pollution in the northeast still needs further in-depth treatment. Implementing a more stringent regional control of PM2.5 pollution in the northeast and other regions to obtain better air quality is required to implement stricter regional control of pollutants. This study can also provide some basis for future studies of atmospheric pollution characteristics, and in the future, coupled analysis can also be performed using computer techniques based on time decomposition [35], neural-based ensembles [36], nonlinear combinations method [37], and phase adjustment [38] to obtain more accurate, diverse, and informative conclusions.
Author Contributions
Data curation and validation, Z.L.; Methodology and directors, C.F.; Supervision, J.W.; Conceptualization, original draft writing, review and editing, H.G. All authors have read and agreed to the published version of the manuscript.
Funding
This research was funded by the Ecology and Environment Department of Jilin Province. The project numbers are 2018-19 and 2019-08.
Institutional Review Board Statement
Not applicable.
Informed Consent Statement
Not applicable.
Data Availability Statement
Publicly available datasets were analyzed in this study. This data can be found here: [http://www.cnemc.cn/] accessed on 17 November 2021.
Acknowledgments
The authors would like to thank the Ecological Environment Monitoring Center of Changchun, Jilin Province, for providing the data on pollutants. Additionally, the authors would like to thank the group members of Laboratories 537 and 142 of Jilin University.
Conflicts of Interest
The authors declare no conflict of interest.
References
- Zhang, Q.; Jiang, X.; Tong, D.; Davis, S.J.; Zhao, H.; Geng, G.; Feng, T.; Zheng, B.; Lu, Z.; Streets, D.G.; et al. Transboundary health impacts of transported global air pollution and international trade. Nature 2017, 543, 705–709. [Google Scholar] [CrossRef] [Green Version]
- Lelieveld, J.; Pozzer, A.; Poschl, U.; Fnais, M.; Haines, A.; Munzel, T. Loss of life expectancy from air pollution compared to other risk factors: A worldwide perspective. Cardiovasc. Res. 2020, 116, 1910–1917. [Google Scholar] [CrossRef]
- Kim, Y.; Choi, Y.H.; Kim, M.K.; Paik, H.J.; Kim, D.H. Different adverse effects of air pollutants on dry eye disease: Ozone, PM2.5, and PM10. Environ. Pollut. 2020, 265, 115039. [Google Scholar] [CrossRef]
- Smith, R.B.; Beevers, S.D.; Gulliver, J.; Dajnak, D.; Fecht, D.; Blangiardo, M.; Douglass, M.; Hansell, A.L.; Anderson, H.R.; Kelly, F.J.; et al. Impacts of air pollution and noise on risk of preterm birth and stillbirth in London. Environ. Int. 2020, 134, 105290. [Google Scholar] [CrossRef]
- Dedoussi, I.C.; Eastham, S.D.; Monier, E.; Barrett, S.R.H. Premature mortality related to United States cross-state air pollution. Nature 2020, 578, 261–265. [Google Scholar] [CrossRef]
- Pope, C.A., III; Coleman, N.; Pond, Z.A.; Burnett, R.T. Fine particulate air pollution and human mortality: 25+ years of cohort studies. Environ. Res. 2020, 183, 108924. [Google Scholar] [CrossRef]
- Zhu, Y.; Wang, Y.; Xu, H.; Luo, B.; Zhang, W.; Guo, B.; Chen, S.; Zhao, X.; Li, W. Joint effect of multiple air pollutants on daily emergency department visits in Chengdu, China. Environ. Pollut. 2020, 257, 113548. [Google Scholar] [CrossRef]
- Edlund, K.K.; Killman, F.; Molnár, P.; Boman, J.; Stockfelt, L.; Wichmann, J. Health Risk Assessment of PM2.5 and PM2.5-Bound Trace Elements in Thohoyandou, South Africa. Int. J. Environ. Res. Public Health 2021, 18, 1359. [Google Scholar] [CrossRef]
- Jones, E.R.; Cedeño Laurent, J.G.; Young, A.S.; MacNaughton, P.; Coull, B.A.; Spengler, J.D.; Allen, J.G. The effects of ventilation and filtration on indoor PM2.5 in office buildings in four countries. Build. Environ. 2021, 200, 107975. [Google Scholar] [CrossRef]
- Yue, H.; He, C.; Huang, Q.; Yin, D.; Bryan, B.A. Stronger policy required to substantially reduce deaths from PM2.5 pollution in China. Nat. Commun. 2020, 11, 1462. [Google Scholar] [CrossRef] [Green Version]
- Fan, H.; Zhao, C.; Yang, Y. A comprehensive analysis of the spatio-temporal variation of urban air pollution in China during 2014–2018. Atmos. Environ. 2020, 220. [Google Scholar] [CrossRef]
- Li, K.; Jacob, D.J.; Liao, H.; Shen, L.; Zhang, Q.; Bates, K.H. Anthropogenic drivers of 2013–2017 trends in summer surface ozone in China. Proc. Natl. Acad. Sci. USA 2019, 116, 422. [Google Scholar] [CrossRef] [PubMed] [Green Version]
- Sicard, P.; De Marco, A.; Agathokleous, E.; Feng, Z.; Xu, X.; Paoletti, E.; Rodriguez, J.J.D.; Calatayud, V. Amplified ozone pollution in cities during the COVID-19 lockdown. Sci. Total Environ. 2020, 735, 139542. [Google Scholar] [CrossRef]
- Wang, Y.; Liao, H. Effect of emission control measures on ozone concentrations in Hangzhou during G20 meeting in 2016. Chemosphere 2020, 261, 127729. [Google Scholar] [CrossRef] [PubMed]
- Wang, Z.; Li, Y.; Chen, T.; Li, L.; Liu, B.; Zhang, D.; Sun, F.; Wei, Q.; Jiang, L.; Pan, L. Changes in atmospheric composition during the 2014 APEC conference in Beijing. J. Geophys. Res. 2015, 120, 12695–12707. [Google Scholar] [CrossRef] [Green Version]
- Park, E.H.; Heo, J.; Kim, H.; Yi, S.-M. The major chemical constituents of PM2.5 and airborne bacterial community phyla in Beijing, Seoul, and Nagasaki. Chemosphere 2020, 254, 126870. [Google Scholar] [CrossRef]
- Salmabadi, H.; Khalidy, R.; Saeedi, M. Transport routes and potential source regions of the Middle Eastern dust over Ahvaz during 2005–2017. Atmos. Res. 2020, 241, 104947. [Google Scholar] [CrossRef]
- Xia, L.; Zhang, G.; Zhan, M.; Li, B.; Kong, P. Seasonal variations of atmospheric CH4 at Jingdezhen station in Central China: Understanding the regional transport and its correlation with CO2 and CO. Atmos. Res. 2020, 241, 104982. [Google Scholar] [CrossRef]
- Fang, C.; Gao, J.; Wang, D.; Wang, D.; Wang, J. Optimization of stepwise clustering algorithm in backward trajectory analysis. Neural Comput. Appl. 2020, 32, 109–115. [Google Scholar] [CrossRef]
- Wang, L.; Wang, J.; Fang, C. Assessing the Impact of Lockdown on Atmospheric Ozone Pollution Amid the First Half of 2020 in Shenyang, China. Int. J. Environ. Res. Public Health 2020, 17, 9004. [Google Scholar] [CrossRef]
- Polissar, A.V.; Hopke, P.K.; Paatero, P.; Kaufmann, Y.J.; Hall, D.K.; Bodhaine, B.A.; Dutton, E.G. The aerosol at Barrow, Alaska: Long-term trends and source locations. Atmos. Environ. 1999, 33, 18. [Google Scholar] [CrossRef]
- Dimitriou, K.; Kassomenos, P. Combining AOT, Angstrom Exponent and PM concentration data, with PSCF model, to distinguish fine and coarse aerosol intrusions in Southern France. Atmos. Res. 2016, 172, 74–82. [Google Scholar] [CrossRef]
- Dimitriou, K.; Kassomenos, P. Indicators reflecting local and transboundary sources of PM2.5 and PMCOARSE in Rome—Impacts in air quality. Atmos. Environ. 2014, 96, 154–162. [Google Scholar] [CrossRef]
- Stohl, A. Trajectory statistics-A new method to establish source-receptor relationships of air pollutants and its application to the transport of particulate sulfate in Europe. Atmos. Environ. 1996, 30, 579–587. [Google Scholar] [CrossRef]
- Li, L.; Yan, D.; Xu, S.; Huang, M.; Wang, X.; Xie, S. Characteristics and source distribution of air pollution in winter in Qingdao, eastern China. Environ. Pollut. 2017, 224, 44–53. [Google Scholar] [CrossRef]
- Zhao, Q.; He, Q.; Jin, L.; Wang, J.; Donateo, A. Potential Source Regions and Transportation Pathways of Reactive Gases at a Regional Background Site in Northwestern China. Adv. Meteorol. 2021, 2021, 1–20. [Google Scholar] [CrossRef]
- Wang, L.; Xing, L.; Wu, X.; Sun, J.; Kong, M. Spatiotemporal variations and risk assessment of ambient air O3, PM10 and PM2.5 in a coastal city of China. Ecotoxicology 2021, 30, 1333–1342. [Google Scholar] [CrossRef] [PubMed]
- Othman, M.; Latif, M.T.; Yee, C.Z.; Norshariffudin, L.K.; Azhari, A.; Halim, N.D.A.; Alias, A.; Sofwan, N.M.; Hamid, H.H.A.; Matsumi, Y. PM2.5 and ozone in office environments and their potential impact on human health. Ecotox. Environ. Saf. 2020, 194, 110432. [Google Scholar] [CrossRef]
- Othman, M.; Latif, M.T. Air pollution impacts from COVID-19 pandemic control strategies in Malaysia. J. Clean. Prod. 2021, 291, 125992. [Google Scholar] [CrossRef]
- Li, B.; Shi, X.; Liu, Y.; Lu, L.; Wang, G.; Thapa, S.; Sun, X.; Fu, D.; Wang, K.; Qi, H. Long-term characteristics of criteria air pollutants in megacities of Harbin-Changchun megalopolis, Northeast China: Spatiotemporal variations, source analysis, and meteorological effects. Environ. Pollut. 2020, 267, 115441. [Google Scholar] [CrossRef]
- Li, W.; Duan, F.; Zhao, Q.; Song, W.; Cheng, Y.; Wang, X.; Li, L.; He, K. Investigating the effect of sources and meteorological conditions on wintertime haze formation in Northeast China: A case study in Harbin. Sci. Total Environ. 2021, 801, 149631. [Google Scholar] [CrossRef] [PubMed]
- Ma, Y.; Wang, M.; Wang, S.; Wang, Y.; Feng, L.; Wu, K. Air pollutant emission characteristics and HYSPLIT model analysis during heating period in Shenyang, China. Environ. Monit. Assess. 2020, 193, 9. [Google Scholar] [CrossRef] [PubMed]
- Raoufi, S.S.; Goharnejad, H.; Niri, M.Z. Air Pollution Effects on Climate and Air Temperature of Tehran City Using Remote Sensing Data. Asian J. Water Environ. Pollut. 2018, 15, 79–87. [Google Scholar] [CrossRef]
- Liu, N.; Lin, W.; Ma, J.; Xu, W.; Xu, X. Seasonal variation in surface ozone and its regional characteristics at global atmosphere watch stations in China. J. Environ. Sci. 2019, 77, 291–302. [Google Scholar] [CrossRef] [PubMed]
- Neto, P.S.G.D.M.; Marinho, M.H.N.; Siqueira, H.; de Souza Tadano, Y.; Machado, V.; Antonini Alves, T.; de Oliveira, J.F.L.; Madeiro, F. A Methodology to Increase the Accuracy of Particulate Matter Predictors Based on Time Decomposition. Sustainability 2020, 12, 7310. [Google Scholar] [CrossRef]
- Neto, P.S.G.D.M.; Firmino, P.R.A.; Siqueira, H.; Tadano, Y.D.S.; Alves, T.A.; Oliveira, J.F.L.D.; Marinho, M.H.D.N.; Madeiro, F. Neural-Based Ensembles for Particulate Matter Forecasting. IEEE Access 2021, 9, 14470–14490. [Google Scholar] [CrossRef]
- Neto, P.S.G.D.M.; Cavalcanti, G.D.C.; Madeiro, F. Nonlinear combination method of forecasters applied to PM time series. Pattern Recogn. Lett. 2017, 95, 65–72. [Google Scholar] [CrossRef]
- Neto, P.S.G.D.M.; Madeiro, F.; Ferreira, T.A.E.; Cavalcanti, G.D.C. Hybrid intelligent system for air quality forecasting using phase adjustment. Eng. Appl. Artif. Intell. 2014, 32, 185–191. [Google Scholar] [CrossRef]
Figure 1.
Geographical location and site distribution in the study area.

Figure 2.
Five-year time series of PM2.5 and O3 concentrations in the capital cities of northeast China ((a) Changchun; (b) Shenyang; (c) Harbin. Red and blue lines are O3 and PM2.5 concentrations, respectively).
Figure 2.
Five-year time series of PM2.5 and O3 concentrations in the capital cities of northeast China ((a) Changchun; (b) Shenyang; (c) Harbin. Red and blue lines are O3 and PM2.5 concentrations, respectively).

Figure 3.
Distribution of PM2.5 and O3 concentrations in Changchun, Shenyang, and Harbin in each wind direction.
Figure 3.
Distribution of PM2.5 and O3 concentrations in Changchun, Shenyang, and Harbin in each wind direction.

Figure 4.
Correlation between PM2.5 and O3 and each meteorological factor in the capital cities of northeast China (p < 0.05).
Figure 4.
Correlation between PM2.5 and O3 and each meteorological factor in the capital cities of northeast China (p < 0.05).

Figure 5.
Backward trajectory clustering results for the northeast provincial capitals, 2016 and 2020 (trajectory simulation time interval was 1 h, simulation time was 72 h).
Figure 5.
Backward trajectory clustering results for the northeast provincial capitals, 2016 and 2020 (trajectory simulation time interval was 1 h, simulation time was 72 h).

Figure 6.
Potential source areas of PM2.5 and O3 in the capital cities of northeast China.

Figure 7.
Results of CWT analysis of PM2.5 and O3 in the capital cities of northeast China.

Figure 8.
Distribution of hazard quotient (HQ) values of PM2.5 and O3 with carcinogenic risk (CR) values of PM2.5 at each monitoring station (S1–S27 are the numbers of automatic air quality monitoring stations).
Figure 8.
Distribution of hazard quotient (HQ) values of PM2.5 and O3 with carcinogenic risk (CR) values of PM2.5 at each monitoring station (S1–S27 are the numbers of automatic air quality monitoring stations).


Table 1.
Non-carcinogenic risks, estimated as HQ, and the carcinogenic risks, estimated as CR, from exposure to O3 and PM2.5 in Shenyang.
Table 1.
Non-carcinogenic risks, estimated as HQ, and the carcinogenic risks, estimated as CR, from exposure to O3 and PM2.5 in Shenyang.
| Pollutants | S1 | S2 | S3 | S4 | S5 | S6 | S7 | S8 | |
|---|---|---|---|---|---|---|---|---|---|
| Non-carcinogenic risks | |||||||||
| O3 | Min | 0.0011 | 0.0023 | 0.0027 | 0.0006 | 0.0018 | 0.0013 | 0.0018 | 0.0037 |
| Max | 0.1388 | 0.1391 | 0.1511 | 0.1493 | 0.1304 | 0.1392 | 0.1391 | 0.1535 | |
| Median | 0.0340 | 0.0322 | 0.0354 | 0.0322 | 0.0342 | 0.0321 | 0.0308 | 0.0384 | |
| Mean | 0.0365 | 0.0364 | 0.0386 | 0.0370 | 0.0384 | 0.0358 | 0.0358 | 0.0427 | |
| PM2.5 | Min | 0.0051 | 0.0056 | 0.0046 | 0.0043 | 0.0027 | 0.0026 | 0.0068 | 0.0041 |
| Max | 0.4353 | 0.4114 | 0.3349 | 0.3148 | 0.3755 | 0.4594 | 0.4357 | 0.3101 | |
| Median | 0.0513 | 0.0521 | 0.0462 | 0.0472 | 0.0515 | 0.0478 | 0.0515 | 0.0504 | |
| Mean | 0.0675 | 0.0659 | 0.0591 | 0.0614 | 0.0645 | 0.0629 | 0.0644 | 0.0621 | |
| Carcinogenic risks | |||||||||
| PM2.5 | Min | 0.0011 | 0.0012 | 0.0010 | 0.0009 | 0.0006 | 0.0006 | 0.0015 | 0.0009 |
| Max | 0.0933 | 0.0882 | 0.0718 | 0.0675 | 0.0805 | 0.0984 | 0.0934 | 0.0665 | |
| Median | 0.0110 | 0.0112 | 0.0099 | 0.0101 | 0.0110 | 0.0102 | 0.0110 | 0.0108 | |
| Mean | 0.0145 | 0.0141 | 0.0127 | 0.0132 | 0.0138 | 0.0135 | 0.0138 | 0.0133 | |
Table 2.
Non-carcinogenic risks, estimated as HQ, and the carcinogenic risks, estimated as CR, from exposure to O3 and PM2.5 in Changchun.
Table 2.
Non-carcinogenic risks, estimated as HQ, and the carcinogenic risks, estimated as CR, from exposure to O3 and PM2.5 in Changchun.
| Pollutants | S9 | S10 | S11 | S12 | S13 | S14 | S15 | S16 | S17 | |
|---|---|---|---|---|---|---|---|---|---|---|
| Non-carcinogenic risks | ||||||||||
| O3 | Min | 0.0013 | 0.0044 | 0.0026 | 0.0010 | 0.0019 | 0.0013 | 0.0026 | 0.0046 | 0.0021 |
| Max | 0.1164 | 0.1156 | 0.1054 | 0.1277 | 0.1193 | 0.1312 | 0.1200 | 0.1235 | 0.1311 | |
| Median | 0.0306 | 0.0317 | 0.0259 | 0.0334 | 0.0316 | 0.0411 | 0.0322 | 0.0350 | 0.0344 | |
| Mean | 0.0337 | 0.0348 | 0.0286 | 0.0365 | 0.0344 | 0.0429 | 0.0354 | 0.0378 | 0.0380 | |
| PM2.5 | Min | 0.0048 | 0.0043 | 0.0040 | 0.0021 | 0.0038 | 0.0030 | 0.0024 | 0.0032 | 0.0028 |
| Max | 0.6070 | 0.4541 | 0.4771 | 0.5710 | 0.5801 | 0.6858 | 0.6086 | 0.5257 | 0.4754 | |
| Median | 0.0450 | 0.0436 | 0.0440 | 0.0416 | 0.0390 | 0.0320 | 0.0416 | 0.0415 | 0.0412 | |
| Mean | 0.0596 | 0.0586 | 0.0605 | 0.0573 | 0.0533 | 0.0446 | 0.0590 | 0.0577 | 0.0575 | |
| Carcinogenic risks | ||||||||||
| PM2.5 | Min | 0.0010 | 0.0009 | 0.0009 | 0.0004 | 0.0008 | 0.0007 | 0.0005 | 0.0007 | 0.0006 |
| Max | 0.1301 | 0.0973 | 0.1022 | 0.1224 | 0.1243 | 0.1470 | 0.1304 | 0.1126 | 0.1019 | |
| Median | 0.0096 | 0.0094 | 0.0094 | 0.0089 | 0.0084 | 0.0068 | 0.0089 | 0.0089 | 0.0088 | |
| Mean | 0.0128 | 0.0126 | 0.0130 | 0.0123 | 0.0114 | 0.0096 | 0.0126 | 0.0124 | 0.0123 | |
Table 3.
Non-carcinogenic risks, estimated as HQ, and the carcinogenic risks, estimated as CR, from exposure to O3 and PM2.5 in Harbin.
Table 3.
Non-carcinogenic risks, estimated as HQ, and the carcinogenic risks, estimated as CR, from exposure to O3 and PM2.5 in Harbin.
| Pollutants | S18 | S19 | S20 | S21 | S22 | S23 | S24 | S25 | S26 | S27 | |
|---|---|---|---|---|---|---|---|---|---|---|---|
| Non-carcinogenic risks | |||||||||||
| O3 | Min | 0.0019 | 0.0013 | 0.0028 | 0.0021 | 0.0019 | 0.0024 | 0.0026 | 0.0039 | 0.0039 | 0.0019 |
| Max | 0.1092 | 0.1209 | 0.1320 | 0.1059 | 0.1294 | 0.2202 | 0.1131 | 0.1223 | 0.1285 | 0.1170 | |
| Median | 0.0319 | 0.0354 | 0.0343 | 0.0264 | 0.0289 | 0.0288 | 0.0293 | 0.0372 | 0.0326 | 0.0296 | |
| Mean | 0.0335 | 0.0380 | 0.0365 | 0.0296 | 0.0314 | 0.0319 | 0.0318 | 0.0387 | 0.0361 | 0.0318 | |
| PM2.5 | Min | 0.0037 | 0.0018 | 0.0039 | 0.0037 | 0.0050 | 0.0020 | 0.0052 | 0.0041 | 0.0021 | 0.0040 |
| Max | 0.9925 | 1.4299 | 1.4414 | 1.1773 | 2.0438 | 1.2372 | 0.8054 | 1.2463 | 1.5295 | 0.9394 | |
| Median | 0.0332 | 0.0394 | 0.0429 | 0.0363 | 0.0410 | 0.0446 | 0.0418 | 0.0413 | 0.0400 | 0.0448 | |
| Mean | 0.0569 | 0.0639 | 0.0687 | 0.0573 | 0.0672 | 0.0678 | 0.0633 | 0.0662 | 0.0670 | 0.0739 | |
| Carcinogenic risks | |||||||||||
| PM2.5 | Min | 0.0008 | 0.0004 | 0.0008 | 0.0008 | 0.0011 | 0.0004 | 0.0011 | 0.0009 | 0.0005 | 0.0009 |
| Max | 0.2127 | 0.3064 | 0.3089 | 0.2523 | 0.4380 | 0.2651 | 0.1726 | 0.2671 | 0.3278 | 0.2013 | |
| Median | 0.0071 | 0.0085 | 0.0092 | 0.0078 | 0.0088 | 0.0096 | 0.0090 | 0.0088 | 0.0086 | 0.0096 | |
| Mean | 0.0122 | 0.0137 | 0.0147 | 0.0123 | 0.0144 | 0.0145 | 0.0136 | 0.0142 | 0.0144 | 0.0158 | |
Publisher’s Note: MDPI stays neutral with regard to jurisdictional claims in published maps and institutional affiliations. |
© 2021 by the authors. Licensee MDPI, Basel, Switzerland. This article is an open access article distributed under the terms and conditions of the Creative Commons Attribution (CC BY) license (https://creativecommons.org/licenses/by/4.0/).
Share and Cite
MDPI and ACS Style
Fang, C.; Gao, H.; Li, Z.; Wang, J. Regional Air Pollutant Characteristics and Health Risk Assessment of Large Cities in Northeast China. Atmosphere 2021, 12, 1519. https://0-doi-org.brum.beds.ac.uk/10.3390/atmos12111519
AMA Style
Fang C, Gao H, Li Z, Wang J. Regional Air Pollutant Characteristics and Health Risk Assessment of Large Cities in Northeast China. Atmosphere. 2021; 12(11):1519. https://0-doi-org.brum.beds.ac.uk/10.3390/atmos12111519
Chicago/Turabian StyleFang, Chunsheng, Hanbo Gao, Zhuoqiong Li, and Ju Wang. 2021. "Regional Air Pollutant Characteristics and Health Risk Assessment of Large Cities in Northeast China" Atmosphere 12, no. 11: 1519. https://0-doi-org.brum.beds.ac.uk/10.3390/atmos12111519
Note that from the first issue of 2016, this journal uses article numbers instead of page numbers. See further details here.