
Assessment of Smoke Pollution Caused by Wildfires in the Baikal Region (Russia)


East-Siberian Institute of Medical and Ecological Research, 665826 Angarsk, Russia
*
Author to whom correspondence should be addressed.
Atmosphere 2021, 12(12), 1542; https://0-doi-org.brum.beds.ac.uk/10.3390/atmos12121542
Submission received: 15 October 2021
/
Revised: 17 November 2021
/
Accepted: 20 November 2021
/
Published: 23 November 2021
(This article belongs to the Section Air Quality)
Abstract
:Climate change has increased the prevalence of wildfires, resulting in longer fire seasons and larger geographic area burned. The aim of this work was to assess the air pollution and health risk to the population caused during exposure to smoke in fire season. The study design included: an analysis of long-term air pollution to determine background levels; an analysis of short-term (<24 h) and subchronic (10–14 days) concentrations during wildfires; and an assessment of the health risk in the industrial center of the Baikal region (Russia). In Irkutsk, at a distance of 2000 km from the fire focal points, the maximum short-term concentrations of pollution were noted during the smoke period, when the average CO level increased 2.4 times, and PM1 increased 1.4 times relative to the background levels in August 2021. In Bratsk, located near the fires, the increases in short-term concentrations were: CO—21.0; SO2—13.0; formaldehyde—12.0; TPM—4.4 times. The hazard indices of respiratory and coronary diseases in the burning period exceeded the acceptable level. Acute reactions to smoke can be expected in 30% of the exposed population near fires and 11% in remote areas (Bratsk). The results obtained from the remote sensing of atmospheric smoke can be used to urgently resolve the issue of organizing medical assistance or evacuating the population groups most sensitive to the effects of smoke in fire season.
1. Introduction
The number of large-scale wildfires has increased significantly in recent years in various regions: the USA [1,2,3], Australia [4,5], EU countries [6,7], Russia [8,9,10], and Canada [11,12]. Experts have identified several reasons for the increase in the number of fires, such as climate accompanied by an increase in temperature and a decrease in precipitation [13,14,15]. These phenomena can lead to an increase in the duration of the fire season [16] and an increase in the number of areas with potential fire hazard risk [17,18]. Another important reason is the increased anthropogenic pressure on the territory, resulting in the greater accessibility of forests for various groups of the population [10,19,20].
Smoke from wildfires contains many air pollutants that can affect public health, including carbon monoxide (CO), nitrogen dioxide (NO2), ozone, particulate matter (PM), polycyclic aromatic hydrocarbons (PAHs), and volatile organic compounds (VOCs) [3]. Although smoke from forest fires is a complex mixture of gases and particles, the concentrations of fine particulate matter in the environment (PM2.5) are the most indicative [21,22]. PM is used as an indicator of air pollution during forest fires for several reasons: first, due to the constant increase in PM concentrations during smoke generation in places both near and far from fires; second, the dose–response relationship with various health effects is well established; and third, continuous PM measurements are available in many locations in order to regulate air quality. At the same time, in the forested regions of Canada, the USA, and Russia, in settlements remote from densely populated areas, there is no system of chemical monitoring of the quality of the atmosphere. At the meteorological stations of sparsely populated areas, only visual characteristics are recorded, reflecting a decrease in the transparency of the lower layers of the atmosphere: the presence of “smoke”, “haze”, and “slight haze”.
Smoke from forest fires can affect large populations, even those far from the fire, by degrading local, regional, and global air quality [16]. A significant amount of research has been devoted to assessing the estimated annual global premature mortality associated with smoke from wildfires [23,24,25]. Exposure to wildfires can result in a wide range of acute cardiopulmonary morbidity for the elderly [22], and impaired respiratory function in children [26,27,28].
The lack of reliable methods for quantifying the exposure to pollutants complicates the task of studying the health effects of smoke in sparsely populated areas. Some studies use the results of air quality observations at posts located in more densely populated areas, but it is not always correct to extrapolate these data. Some characteristics may differ from area to area, including air pollution associated with industry and vehicles, health status, and the susceptibility of the population to chemical exposure [1,29]. In addition, calculated models of chemical transport were used for the estimates [11,30,31,32,33]. Mathematical models of the transport and dispersion of impurities give an idea of the spatial and temporal distribution of pollutants, which is especially important for regions where there is no constant observation. However, when choosing a mathematical model, the researcher must take into account the limitations for the use of some models, and the features of the available data in order to avoid incorrect conclusions [22,31].
Despite the large number of works on the problem under consideration, the overall impact on the health of the population, manifested by respiratory, cardiovascular, and other effects in the form of acute reactions and conspicuous clinical diseases, still remains not fully known.
The algorithm for collecting and analyzing information about wildfires was presented by us in the report “Services for analysis of the influence of air quality on population health during mass forest fires on the example of the Irkutsk region” within the XXVII International Symposium “Atmospheric and Ocean Optics. Atmospheric Physics” (5–9 July 2021, Moscow) [34]. In the present article, we present in more detail the results of using the proposed approaches, using the example of assessing the danger of forest fires for the population in the Baikal region (BR). The proposed algorithm will allow the accumulation of large amounts of data on environmental pollution and public health over a long period in different geographic areas and the better determination of the risk of adverse health effects, and to identify sensitive groups within the population. The aim of the work was to assess the air pollution and health risk of the population during exposure to smoke from wildfires.
2. Materials and Methods
2.1. Study Area and Study Period
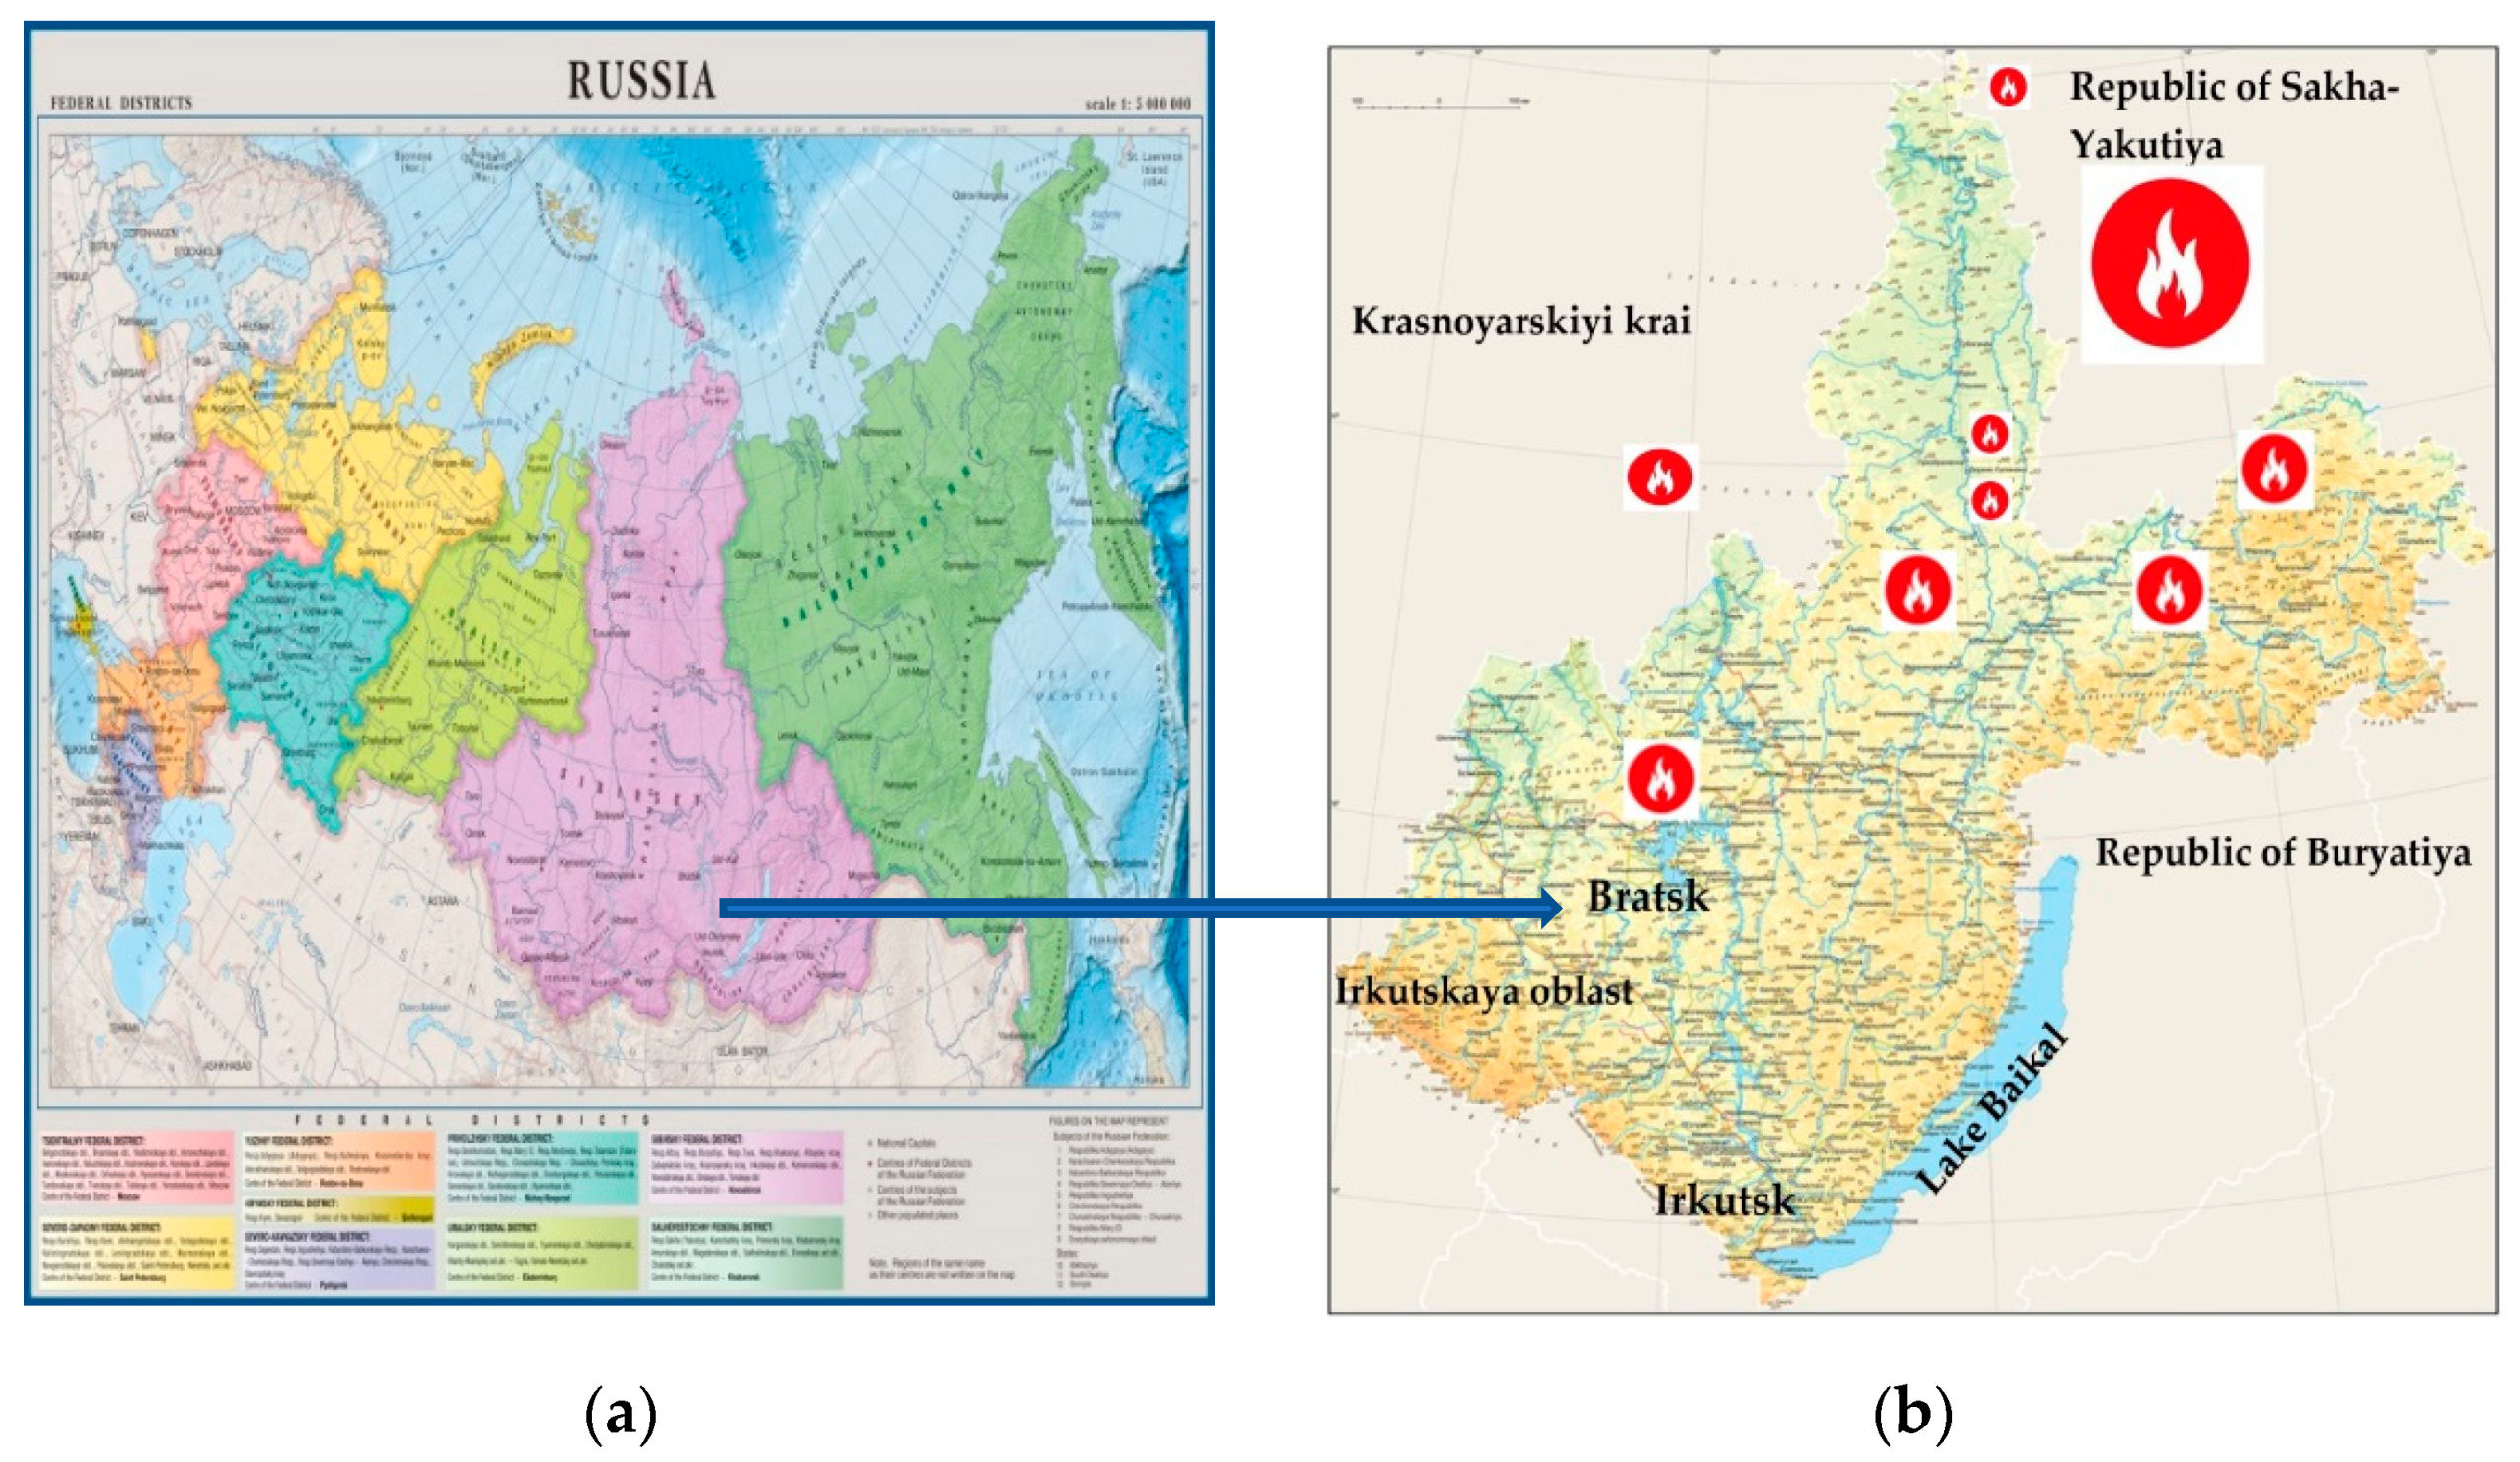
The proposed algorithm was tested on an example model—the Baikal region (BR). The BR is the central territory of Siberia (Russia), including the Irkutsk oblast (region), with a total population of about 2.5 million people in 2021 (Figure 1).
The largest settlements are: Irkutsk (Pop. 617,500), Bratsk (Pop. 225,000), and Angarsk (Pop. 225,800). Since more than 75% of the territory of the BR is covered with forests, the region is prone to seasonal forest fires, and fire hazard periods last from April to September. Two time periods were considered. First: long term, 2011–2020, to assess annual and monthly air pollution. Second: July–August 2021, when massive forest fires were registered for 3 months in adjacent territories, namely in the Republic of Sakha-Yakutia and in the north of the Irkutsk region.
2.2. Materials
The assessment of pollution was given on the basis of the information fund, which combines the results of observations at the stations of the Office for Hydrometeorology and Environmental Monitoring of the Irkutsk Oblast. To determine the background pollution, observation posts were selected, that were remote from industrial sources of pollution and major highways. Control over the concentration of chemicals in the surface layer of the atmosphere was carried out four times (at 7:00 h, 13:00 h, 19:00 h, 1:00 h). The content of substances was assessed in relation to the maximum permissible concentration (MPC), legally approved in the Russian Federation and presented in the sanitary standards SanPiN 1.2.3685-21 “Hygienic standards and requirements for ensuring the safety and (or) harmlessness of environmental factors for humans” [35].
2.3. Study Design
The general algorithm for assessing medical and social losses during short-term high air pollution includes several successive stages. Stage 1 includes an analysis of long-term annual and monthly dynamics of air pollution in order to determine the background levels of atmospheric air pollution in certain areas. Stage 2 involves an analysis of atmospheric air pollution during the critical period for short-term (less than 24 h) and subchronic (10–14 days in a row) levels of chemical substances. Stage 3 is an approximate assessment of the potential health risk for the population in smoky areas.
At the first stage, a retrospective analysis of atmospheric air pollution in the settlement was carried out according to the control data of the Committee for Hydrometeorology and Environmental Monitoring for the content of substances in relation to the maximum permissible concentration (MPC), legally approved in the Russian Federation and presented in the sanitary norms of SanPiN 1.2.3685-21 “Hygienic standards and requirements for ensuring the safety and (or) harmlessness to humans of environmental factors” [35].
In addition, we considered the dynamics of the total (complex) indicator of air pollution (KAZ). The average annual data on the content of impurities in the air were considered over a period of 10 years. In areas with a harsh, sharply continental climate, characteristic of the BR, there was a significant variability in the content of impurities in the air by seasons. In this regard, it was necessary to consider the monthly average pollution levels depending on the season of the year. To assess the average monthly air pollution, we analyzed the data for the last 2 years.
A visual analysis of the results presented in a graphical form made it possible to identify critical periods—periods with the highest content of impurities in the air, which differed from the average seasonal and average annual pollution.
The analysis of air pollution during the critical period, carried out on the basis of data on one-off samples from the Committee for Hydrometeorology and Environmental Monitoring, at the Center for Hygiene and Epidemiology in the region, made it possible to assess the level of impact, its direction, and areas of risk. For the hygienic assessment of air pollution, the calculation of the multiplicity of the excess of MPCacute (Ki) was performed. The following Ki values were taken as critical levels of pollution: for substances of the 1st hazard class (which included, in particular, O3), the Ki value was 3; for substances of the 3rd class (total PM, SO2, NO2), the Ki value was 7; and for those of the 4th hazard class (CO), the Ki value was 12. The assessment of the potential risk of developing nonspecific effects during short-term inhalation exposure was carried out in two directions: the assessment of general toxic effects in comparison with the reference doses (concentrations) and the assessment of reflex action. The calculation of the potential risk of general toxic effects was performed using the coefficients (HQ).
where Ci is the pollutant content in the air, and RfCi is the reference concentrations for i, which is the ingredient, and the hazard indices (HI) for impurities that have a unidirectional effect on target organs, and we calculated the hazard index thus:
HQ = Ci/RfCi,
HI = ∑HQ,
The reference concentrations for acute (ARfC) and chronic (RfCh) exposure were used for the calculation. The potential risk of developing nonspecific toxic effects in the case of short-term exposure to toxicants that have a reflex effect, depending on the hazard class of the ingredient, should be calculated in accordance with Equations (3) and (4).
where Prob is a value associated with the risk according to the law of normal probability distribution, C is the pollutant content in the air, and MPCacute is the maximum permissible maximum one-time concentration of ingredients. Prob and Risk are related by the tabular integral:
where Risk is the probability of developing reflex effects during short-term exposure under specified conditions.
3rd class Prob = −2.35 + 3.73 × lg(C/MPCacute),
4th class Prob = −1.41 + 2.33 × lg (C/MPCacute),
The substances considered in the work were of the 3rd (total particulate matter (TPM), SO2, NO2) and 4th (CO) hazard classes.
3. Results
3.1. Determination of the Background Content of Pollutants in the Air and Selection of Risk Zones during Wild Fires
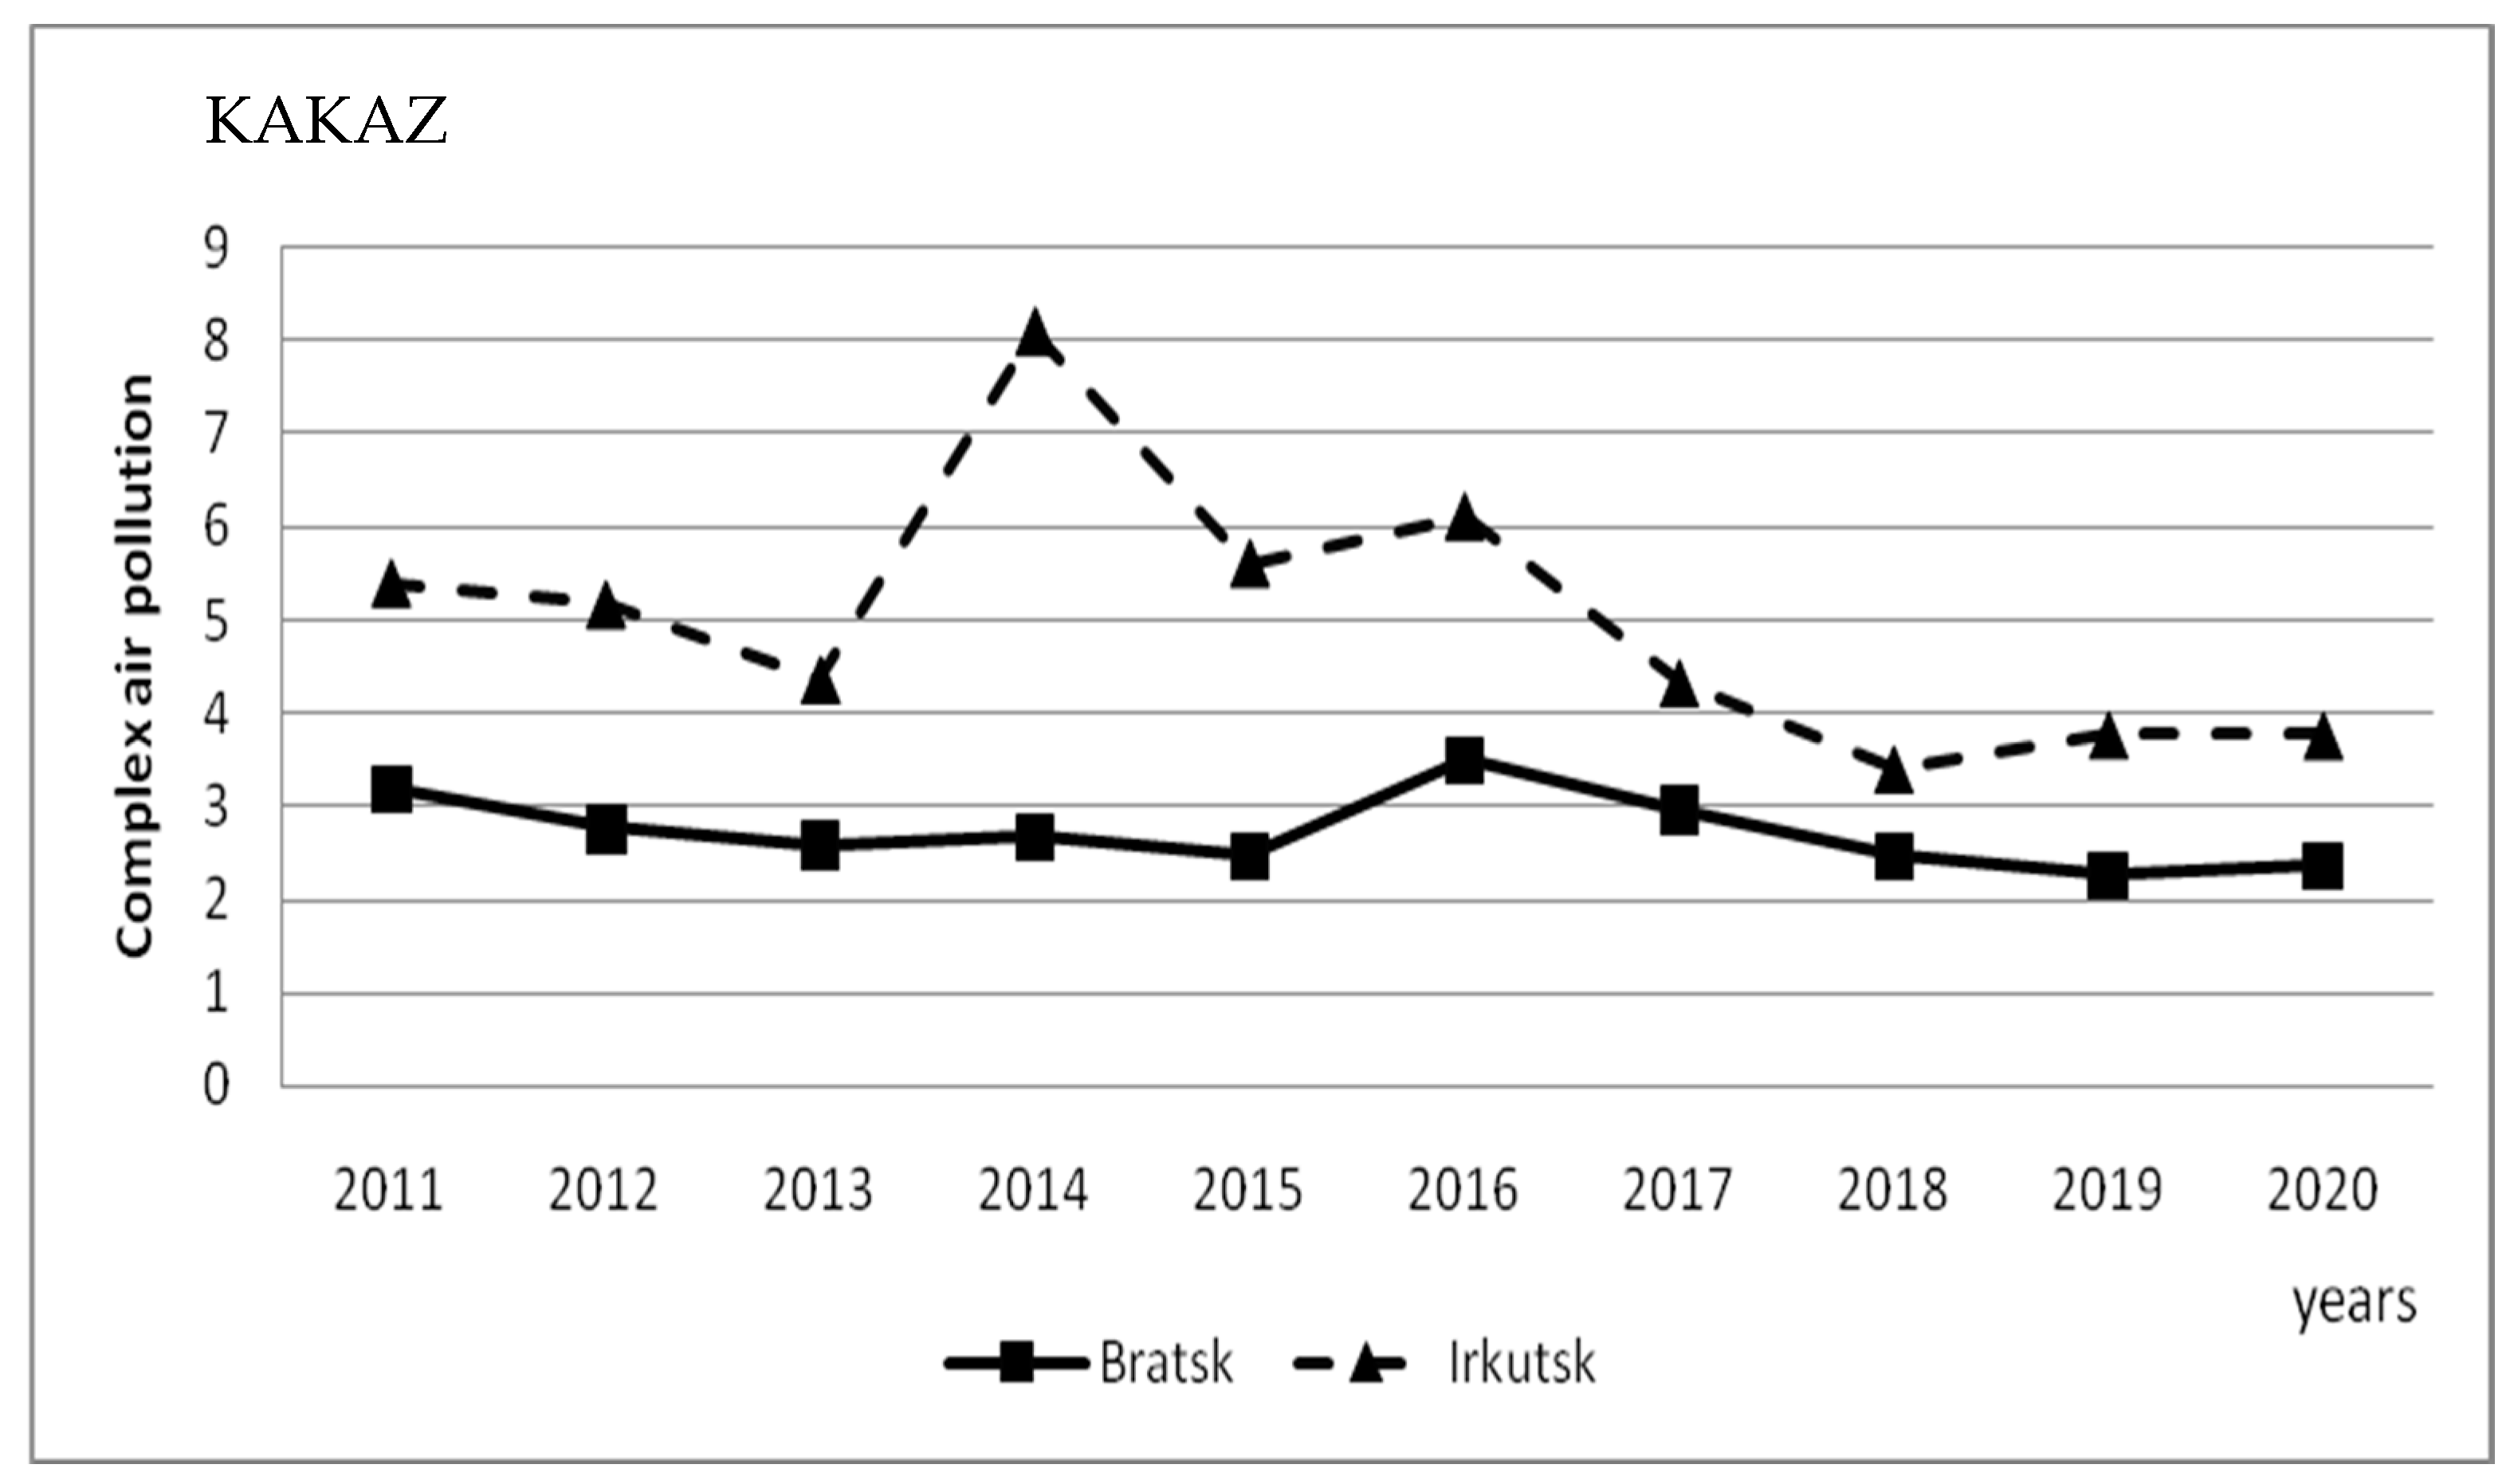
The period of the highest air pollution for four main substances was revealed in the city of Irkutsk (2014–2016); in addition, in Bratsk, a slight rise was observed in 2016 (Figure 2). Moreover, only in Irkutsk was the level of integral pollution assessed as high (7 ≤ KAZ < 14).
Table 1 presents data on the average annual content of the main chemical substances in the atmosphere over the period.
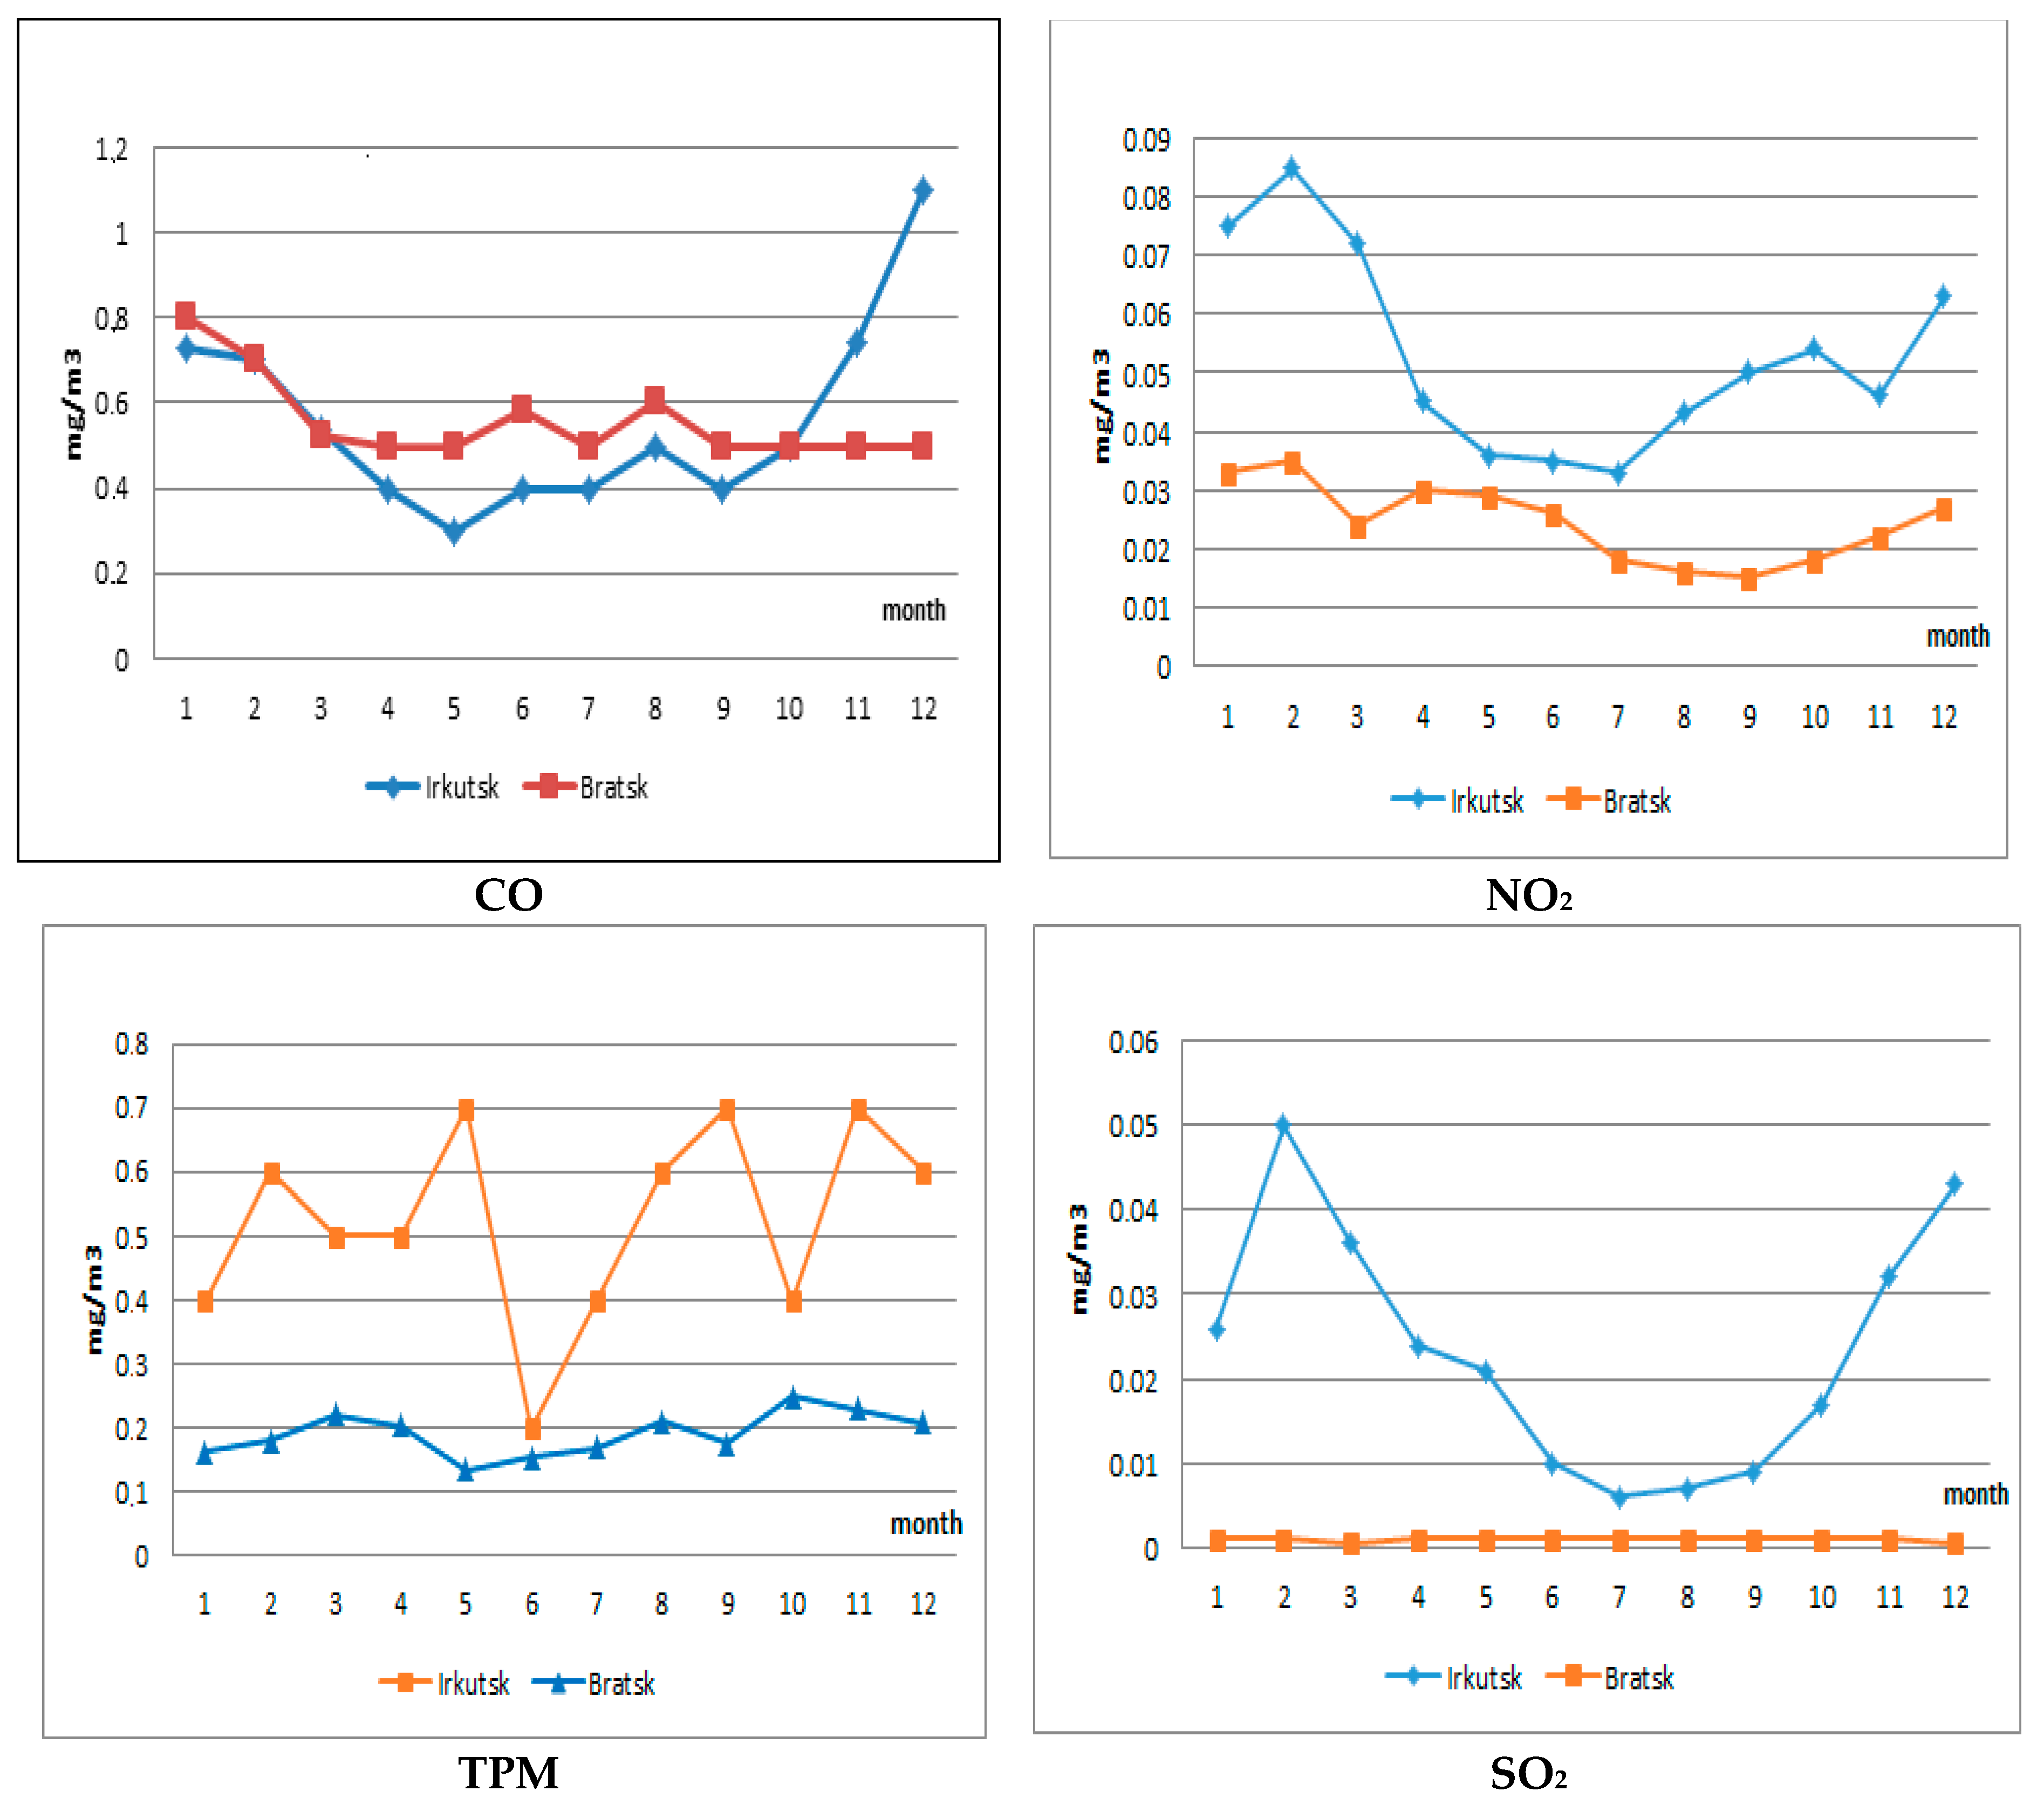
Having the highest frequencies of exceeding the hygienic standards of the Russian Federation is typical for TPM and NO2. TPM concentrations varied from 0.124 to 0.318 mg/m3 in Irkutsk and from 0.115 to 0.175 mg/m3 in Bratsk. The NO2 content ranged from 0.012 to 0.070 mg/m3 in Irkutsk and from 0.007 to 0.039 mg/m3 in Bratsk. Concentrations of carbon monoxide and sulfur dioxide did not exceed the standards. For further analysis, we chose 2017–2020, the period with the lowest API levels, for the analysis of monthly average concentrations, from which the background levels of impurities were calculated (Figure 3).
The use of background concentrations made it possible to eliminate the contribution of other sources to the amount of air pollution in a given area, for example, vehicles and industry. The background levels for the summer season (July–August) for Bratsk and Irkutsk turned out to be different: the concentration of TPM in Irkutsk was 0.040 mg/m3, and the concentration in Bratsk was 0.018 mg/m3; the SO2 concentrations were 0.007 mg/m3 and 0.001 mg/m3, respectively; the CO concentrations were 0.43 mg/m3 and 0.56 mg/m3, respectively; and the NO2 concentrations were 0.037 mg/m3 and 0.020 mg/m3, respectively.
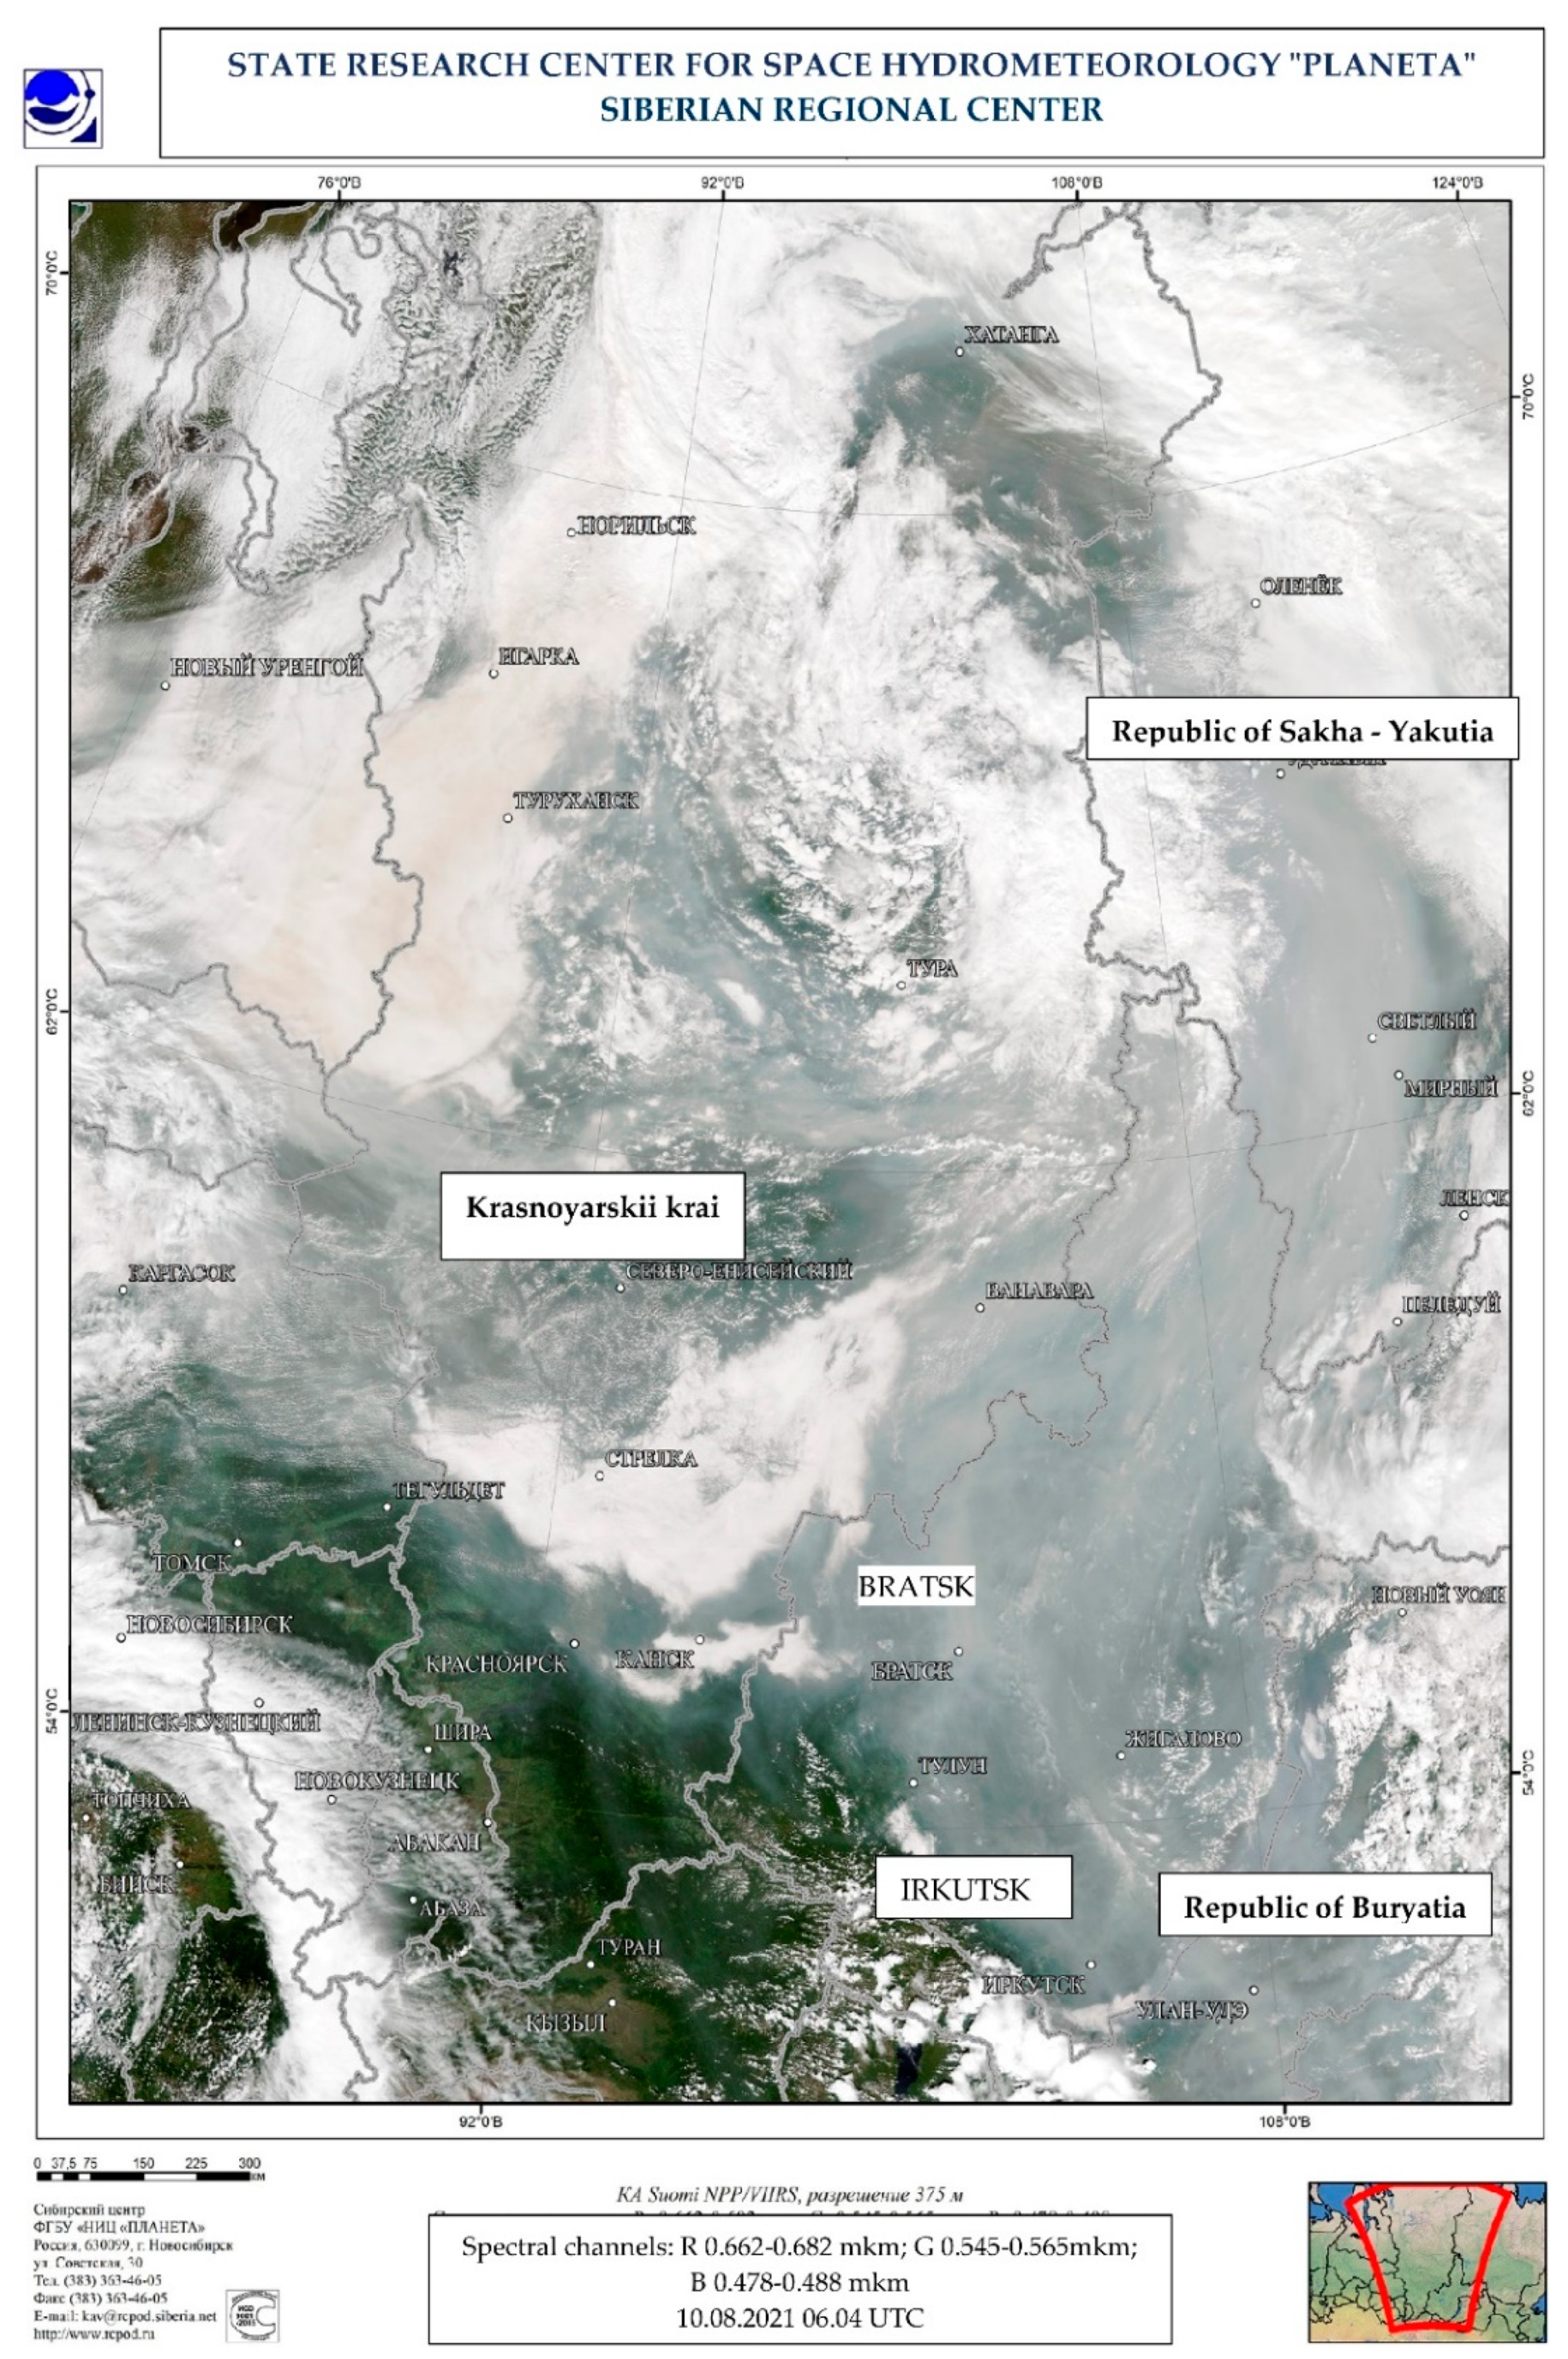
At the third stage, we identified the days of maximum risk in 2021 in the territory of the BR. The intensity of smoke pollution in the region is shown in the images (Figure 4).
The scale of emissions from fires, the centers of which are located far from large settlements of the BR, are visually presented. However, at the beginning of the second period of August, the intensity of smoke was assessed in Irkutsk as “smoke”. The average daily concentrations of the main chemical impurities in this period are presented in Table 2.
The highest concentrations were noted in the period of 9–15 August, when the average CO level increased by 2.4 times relative to the background level, and PM10 increased by 1.4 times. The NO2 concentrations were at the background level. In other periods of the summer of 2021, no statistically significant differences in the content of impurities were found in the territory of Irkutsk. In Bratsk, the ratios to the background levels were: CO = 21.0 times, SO2 = 13.0 times, formaldehyde = 12.0 times, and TPM = 4.4 times.
3.2. The Dependence of the Level of Atmospheric Phenomena on the Concentration of Chemicals
“Atmospheric phenomena” are considered to be integral sources of air pollution during the period of mass wildfires, which are ranked from the least pronounced to the most pronounced in three groups: “slight haze”, “haze”, and “smoke”. To study the dependence, we assigned the studied phenomena points from 0.3 to 1. The level of atmospheric phenomena during wildfires was estimated as “haze” in 43.0% of observations, and as “smoke” in 24%. The contents of chemicals in the surface layer of the atmosphere, grouped by the level of severity of atmospheric phenomena, are presented in Table 3.
The highest concentrations of constituents, both by average and maximum values, are recorded during “smoke”. When comparing average concentrations, it was noted that statistically significant differences were observed only for TPM, sulfur dioxide, and soot between the “smoke”–“slight haze” and “haze” of the “smoke” groups (Table 4).
Differences between the “haze” and the “slight haze” groups were revealed only in the contents of solid particles (TPM and soot). An assessment was made of the ratio of large (PM10) and small (PM2.5) fractions in the total amount of PM during wildfires close to populated areas (burning urban and suburban forests), and smoke from remote fires more than 2000 km away. Bratsk, located in the north of the region, and Irkutsk, located in the southeastern part of the BR, were considered as models in the July–August 2021 period. During the background period, the average daily concentrations of PM2.5 in BR were as follows: PM2.5—0.013 mg/m3; PM10—0.033 mg/m3. The content of PM2.5 increased by 6.8 times and the PM10 content increased by 1.3 times on the days of registration of “smoke” in Irkutsk, and corresponding increases of 15.4 and 2.1 times occurred, respectively, in Bratsk.
The hazard indices of respiratory and coronary diseases in the critical period exceeded the acceptable level, the 25–75% interval was in the range of 2.5–5.7, and in the background period, was in the range of 0.7–2.6. Since among the studied constituents, there are substances of reflex action, the next step was to calculate the potential risk of developing nonspecific effects (Table 5).
In the territory of the BR, the maximum risk levels for the development of acute respiratory and coronary effects were due to the presence of TPM, and in Bratsk, were due to nitrogen dioxide. The risk of acute reactions in Bratsk under the influence of CO was 0.309, and under the influence of TPM, was 0.055, which indicates the possibility of such reactions in 30.9% and 5.5%, respectively, of the exposed population. In Irkutsk, a risk of more than 5% was found to be associated only with exposure to TPM (risk = 0.115 or 11.5% of the population).
Subchronic smoke pollution in Bratsk was accompanied by an increased risk of effects caused by TPM (HQ = 8.0), SO2 (HQ = 6.4), NO2 (HQ = 2.1), and CO (HQ = 1.5). In Irkutsk, only the concentration of suspended solids in the ambient air determined an increased level of HQ = 4.0, which indicated the possibility of the development of reflex symptoms of the upper respiratory tract of the population living in this area.
4. Discussion
Analysis of air pollution in areas remote from fire centers showed qualitative and quantitative differences in the composition of pollutants. At a distance of 2000 km from the fire centers, short-term concentrations increased during the smoke period: CO increased by 2.4 times and PM10 increased by 1.4 times relative to the background level. In the area located close to the fires, an increase in short-term concentrations was noted regarding not only CO (21.0 times) and TPM, but also SO2 (13.0 times) and formaldehyde (12.0 times). Large areas of the BR are sparsely populated and do not have permanent air pollution monitoring posts. The lack of stationary observation posts in the vast territories makes it especially relevant to search for opportunities to assess atmospheric air pollution and its danger for the population of small settlements, remote from large centers, with a developed infrastructure for monitoring the quality of the environment and providing emergency medical care in emergency situations [37]. Krstic and Henderson, after analyzing data on smoke and clouds from the Canadian Terra-MODIS 2000–2007, suggested that the average daily measurements of the optical thickness of aerosols can be used to represent the smoke levels in the area and make urgent decisions about the evacuation of the population [11]. The authors concluded that the systematic use of objective and readily available remote sensing data could be useful for promising real-time applications based on a retrospective analysis of the smoke situation. At the same time, the question of the adequacy of data on pollution from space images and stationary observation points of the Service of Hydrometeorology and Environmental Monitoring remains open [31]. However, in our opinion, space images must be used to promptly resolve the issue of sending additional medical assistance to remote areas.
Comparison of the intensity of smog, visually recorded in settlements and satellite sensing data in different territories, makes it possible to conditionally extrapolate the results to other territories. Based on the calculated levels of risk of exposure to smoke for the Bratsk population (see Table 5), it can be expected that about 30% of the exposed population near the outbreak of massive fires may have acute reactions of the cardiovascular system and deviations in the development of the organism when exposed in the early stages of ontogenesis; in more than 5% of the population, there were respiratory system reactions. Under this influence, judging by the satellite images (see Figure 4), in August 2021, residents were not only of the larger territory of the Republic Sakha (Yakutia) with a population of 981.9 thousand people, but also the population of the northern regions of the Irkutsk region and the Republic of Buryatia (Pop. 500,000), as well as Krasnoyarsk (Pop. 1,092,800). In Irkutsk, 11.5% of the population are at increased risk, mainly related to PM exposure during the smoke period. Such levels of visual impact were observed in the central and southern parts of the BR, which includes the cities of Irkutsk, Shelekhov, Baikalsk, Ulan-Ude, and Selenginsk, and a number of small settlements with a total population (Pop.) of about 1.5 million. It is interesting to note that the priority pollutants, which determined the risk levels for Bratsk, located near the fires, and for Irkutsk, located far from the fires, differed.
Studies in the western United States showed that the composition of fire plumes differs depending on the origin [38]. Expanding on this finding, a pilot study showed that combustion of wood species near industrial pollution sources results in more chemical emissions [39]. It was found that PM from different fuels and combustion phases (e.g., combustion or smoldering) have significant differences in lung toxicity and mutagenic activity [40].
In addition, the toxicity of the particles was found to be age dependent. Differences in the composition of fresh smoke and old smoke were observed in the Western Wildfire experiment on cloud chemistry, aerosol absorption, and nitrogen [41]. In highly concentrated fresh plumes that were only 20 minutes old, hazardous air pollutants (HAPs), such as formaldehyde, acrolein, and benzene, exceeded the California EPA exposure control levels without any side effects. However, among middle- and old-age smoke, toxicants were not found to exceed the acute exposure limits [41].
Thus, the relative impact of forest fire smoke composition on public health remains an area of significant uncertainty. A third explanation for the difference in outcomes may be misclassification of the impact. According to Magzamen et al., local fires have thinner plumes than long-range transport plumes. In this regard, in local fire loops, especially in rarely monitored areas, PM2.5 levels may not be detected [15].
Our assessment results have significant limitations due to several factors. As we have already noted, a change in the nature of wildfires and their impact on public health was previously established [14]. In addition, the susceptibility of the population to the effects of chemical toxicants during the COVID-19 pandemic has significantly changed [37,42]. The change in the adaptive capabilities of the perceiving population in the context of a pandemic, a significant part of which was exposed to viral exposure, both clinically expressed and “latent”, was shown. In our opinion, this requires targeted multidisciplinary studies to assess the dependence of the frequency of acute reactions on the level of short-term exposure, presented in particular in equations 3 and 4. The second limiting factor is the uncertainty in exposure assessments in the absence of ongoing monitoring of chemical concentrations. All this determines the need to continue monitoring changes in the quality of the surface layers of the atmosphere and responses to inhalation exposure to smoke during wildfires.
5. Conclusions
The assessment of air pollution in the BR in wildfire made it possible to identify an increase in the content of impurities in the atmospheric air. When exposed to smoke from distant foci of combustion, large deviations of concentrations in the surface layer of the atmosphere are typical for fine PM fractions. In connection with the identified dependencies, it is advisable to include in the monitoring system, during a fire-hazardous period, the registration of the content of soot, CO, PM, and sulfur dioxide in the surface layer of the atmosphere when burning forests near populated areas. The maximum levels of risk for the development of acute effects of the respiratory and circulatory organs are due to the presence of suspended solids and CO. The results of remote sensing of atmospheric smoke can be used to urgently resolve the issue of organizing medical assistance or evacuating the population groups most sensitive to the effects of smoke (e.g., pregnant women, children, and people with chronic diseases) in case of massive wildfires, especially nearby settlements that are remote from densely populated areas.
Author Contributions
Conceptualization, V.S.R. and N.V.E.; methodology, N.V.E. and V.S.R.; validation, V.S.R. and N.V.E.; formal analysis, N.V.E.; writing—original draft preparation, N.V.E.; writing—review and editing, V.S.R. and N.V.E.; visualization, N.V.E.; supervision, V.S.R. and N.V.E. All authors have read and agreed to the published version of the manuscript.
Funding
The work was supported by the grant №075-15-2020-787 in the form of a subsidy for a Major scientific project from the Ministry of Science and Higher Education of Russia (project “Fundamentals, methods and technologies for digital monitoring and forecasting of the environmental situation on the Baikal natural territory”).
Institutional Review Board Statement
Not applicable.
Informed Consent Statement
Not applicable.
Data Availability Statement
Data on air pollution in the Irkutsk region are presented on https://www.irmeteo.ru/index.php?id=5 (accessed on 30 August 2021); satellite images are presented on http://planet.rssi.ru/index.php?lang=ru&page_type=oper_prod&page=product&prod=342 (accessed on 5 September 2021).
Acknowledgments
The authors are grateful to the staff of the State Research Center for Space Hydrometeorology «Planeta» Siberian center for the provided satellite images of the territory of Siberia and Irkutsk, and to the department Committee for Hydrometeorology and Environmental Monitoring for the provided data on the Baikal region.
Conflicts of Interest
The authors declare no conflict of interest.
Abbreviations
BR—Baikal region; MPC—maximum permissible concentration; C—concentration; KAZ—complex indicator of air pollution; RfC—reference concentration; HI—hazard indices; HQ—hazard coefficients; SanPiN—sanitary norms and rules.
References
- Liu, J.C.; Mickley, L.J.; Sulprizio, M.P.; Dominici, F.; Yue, X.; Ebisu, K.; Anderson, G.B.; Khan, R.F.; Bravo, M.A.; Bell, M.L. Particulate air pollution from wildfires in the Western US under climate change. Clim. Chang. 2016, 138, 655–666. [Google Scholar] [CrossRef] [Green Version]
- Abdo, M.; Ward, I.; O’Dell, K.; Ford, B.; Pierce, J.R.; Fischer, E.V.; Crooks, J.L. Impact of wildfire smoke on adverse pregnancy outcomes in Colorado, 2007–2015. Int. J. Environ. Res. Public Health 2019, 16, 3720. [Google Scholar] [CrossRef] [PubMed] [Green Version]
- Meo, S.A.; Abukhalaf, A.A.; Alomar, A.; Alessa, O.M.; Sami, W.; Klonoff, D.C. Effect of environmental pollutants PM-2.5, carbon monoxide, and ozone on the incidence and mortality of SARS-COV-2 infection in ten wildfire affected counties in California. Sci. Total Environ. 2021, 757, 143948. [Google Scholar] [CrossRef] [PubMed]
- Johnston, F.; Hanigan, I.; Henderson, S.; Morgan, G.; Bowman, D. Extreme air pollution events from bushfires and dust storms and their association with mortality in Sydney, Australia 1994–2007. Environ. Res. 2011, 111, 811–816. [Google Scholar] [CrossRef]
- Salimi, F.; Henderson, S.; Morgan, G.; Jalaludin, B.; Johnston, F. Ambient particulate matter, landscape fire smoke, and emergency ambulance dispatches in Sydney, Australia. Environ. Int. 2017, 99, 208–212. [Google Scholar] [CrossRef]
- Linares, C.; Carmona, R.; Salvador, P.; Díaz, J. Impact on mortality of biomass combustion from wildfires in Spain: A regional analysis. Sci. Total Environ. 2018, 622–623, 547–555. [Google Scholar] [CrossRef]
- Kollanus, V.; Tiittanen, P.; Niemi, J.; Lanki, T. Effects of long-range transported air pollution from vegetation fires on daily mortality and hospital admissions in the Helsinki metropolitan area, Finland. Environ. Res. 2016, 151, 351–358. [Google Scholar] [CrossRef]
- Shaposhnikov, D.; Revich, B.; Bellander, T.; Bedada, G.B.; Bottai, M.; Lind, T.; Pershagen, G.; Kharkova, T.; Kvasha, E. Long-term impact of Moscow heat wave and wildfires on mortality. Epidemiology 2015, 26, e21–e22. [Google Scholar] [CrossRef] [PubMed]
- Rukavishniko, V.S.; Efimova, N.V.; Elfimova, T.A. Study of health risks in case of short-term inhalation exposure under forest fire conditions. Hyg. Sanit. 2013, 92, 50–52. (In Russian) [Google Scholar]
- Aleinikov, A.A. The fire history in pine forests of the plain area in the pechora-llych nature biosphere reserve (Russia) before 1942: Possible anthropogenic causes and long-term effects. Nat. Conserv. Res. 2019, 4, 21–34. [Google Scholar] [CrossRef] [Green Version]
- Krstic, N.; Henderson, S.B. Use of MODIS data to assess atmospheric aerosol before, during, and after community evacuations related to wildfire smoke. Remote. Sens. Environ. 2015, 166, 1–7. [Google Scholar] [CrossRef]
- Landis, M.; Edgerton, E.; White, E.; Wentworth, G.; Sullivan, A.; Dillner, A. The impact of the 2016 Fort McMurray Horse River Wildfire on ambient air pollution levels in the Athabasca Oil Sands Region, Alberta, Canada. Sci. Total Environ. 2018, 618, 1665–1676. [Google Scholar] [CrossRef]
- Spracklen, D.V.; Mickley, L.J.; Logan, J.A.; Hudman, R.C.; Yevich, R.; Flannigan, M.D.; Westerling, A.L. Impacts of climate change from 2000 to 2050 on wildfire activity and carbonaceous aerosol concentrations in the western United States. J. Geophys. Res. 2009, 114, D20301. [Google Scholar] [CrossRef]
- Balmes, J.R. The Changing Nature of Wildfires: Impacts on the Health of the Public. Clin. Chest Med. 2020, 41, 771–776. [Google Scholar] [CrossRef] [PubMed]
- Magzamen, S.; Gan, R.W.; Liu, J.; O’Dell, K.; Ford, B.; Berg, K.; Bol, K.; Wilson, A.; Fischer, E.V.; Pierce, J.R. Differential cardiopulmonary health impacts of local and long-range transport of wildfire smoke. GeoHealth 2021, 5, e2020GH000330. [Google Scholar] [CrossRef]
- Flannigan, M.; Cantin, A.S.; De Groot, W.J.; Wotton, M.; Newbery, A.; Gowman, L.M. Global wildland fire season severity in the 21st century. For. Ecol. Manag. 2013, 294, 54–61. [Google Scholar] [CrossRef]
- Reid, C.E.; Brauer, M.; Johnston, F.H.; Jerrett, M.; Balmes, J.R.; Elliott, C.T. Critical Review of Health Impacts of Wildfire Smoke Exposure. Environ. Health Perspect. 2016, 124, 1334–1343. [Google Scholar] [CrossRef] [PubMed] [Green Version]
- Yao, J.; Brauer, M.; Wei, J.; McGrail, K.M.; Johnston, F.H.; Henderson, S.B. Sub-Daily Exposure to Fine Particulate Matter and Ambulance Dispatches during Wildfire Seasons: A Case-Crossover Study in British Columbia, Canada. Environ. Health Perspect. 2020, 128, 067006. [Google Scholar] [CrossRef]
- Hörnberg, G.; Josefsson, T.; DeLuca, T.H.; Higuera, P.E.; Liedgren, L.; Östlund, L.; Bergman, I. Anthropogenic use of fire led to degraded scots pine-lichen forest in northern Sweden. Anthropocene 2018, 24, 14–29. [Google Scholar] [CrossRef]
- Kuosmanen, N.; Marquer, L.; Tallavaara, M.; Molinari, C.; Zhang, Y.; Alenius, T.; Edinborough, K.; Pesonen, P.; Reitalu, T.; Renssen, H.; et al. The role of climate, forest fires and human population size in Holocene vegetation dynamics in Fennoscandia. J. Veg. Sci. 2018, 29, 382–392. [Google Scholar] [CrossRef]
- Lelieveld, J.; Evans, J.; Fnais, M.; Giannadaki, D.; Pozze, A. The contribution of outdoor air pollution sources to premature mortality on a global scale. Nature 2015, 525, 367–371. [Google Scholar] [CrossRef] [PubMed]
- DeFlorio-Barker, S.; Crooks, J.; Reyes, J.; Rappold, A. Cardiopulmonary Effects of Fine Particulate Matter Exposure among Older Adults, during Wildfire and Non-Wildfire Periods, in the United States 2008–2010. Environ. Health. Perspect. 2019, 127, 037006. [Google Scholar] [CrossRef] [PubMed]
- Fann, N.; Alman, B.; Broome, R.A.; Morgan, G.G.; Johnston, F.H.; Pouliot, G.; Rappold, A.G. The health impacts and economic value of wildland fire episodes in the U.S. 2008–2012. Sci. Total Environ. 2018, 610–611, 802–809. [Google Scholar] [CrossRef] [PubMed]
- Ford, B.; Val Martin, M.; Zelasky, S.E.; Fischer, E.V.; Anenberg, S.C.; Heald, C.L.; Pierce, J.R. Future fire impacts on smoke concentrations, visibility, and health in the contiguous United States. GeoHealth 2018, 2, 229–247. [Google Scholar] [CrossRef] [PubMed] [Green Version]
- Matz, C.J.; Egyed, M.; Xi, G.; Racine, J.; Pavlovic, R.; Rittmaster, R.; Henderson, S.B.; Stieb, D.M. Health impact analysis of PM2.5 from wildfire smoke in Canada (2013–2015, 2017–2018). Sci. Total Environ. 2020, 725, 138506. [Google Scholar] [CrossRef] [PubMed]
- Aguilera, R.; Corringham, T.; Gershunov, A.; Leibel, S.; Benmarhnia, T. Fine Particles in Wildfire Smoke and Pediatric Respiratory Health in California. Pediatrics 2021, 147, e2020027128. [Google Scholar] [CrossRef] [PubMed]
- Reid, C.E.; Considine, E.M.; Watson, G.L.; Telesca, D.; Pfister, G.G.; Jerrett, M. Associations between respiratory health and ozone and fine particulate matter during a wildfire event. Environ. Int. 2019, 129, 291–298. [Google Scholar] [CrossRef]
- Garcia, E.; Rice, M.B.; Gold, D.R. Air pollution and lung function in children. J. Allergy Clin. Immunol. 2021, 148, 1–14. [Google Scholar] [CrossRef]
- Landis, J.; Pancra, P.; Graney, J.R.; White, E.M.; Edgerton, E.S.; Legge, A.; Percy, K.E. Source apportionment of ambient fine and coarse particulate matter at the Fort McKay community site, in the Athabasca Oil Sands Region, Alberta, Canada. Sci. Total Environ. 2017, 584–585, 105–117. [Google Scholar] [CrossRef]
- Black, C.; Tesfaigzi, Y.; Bassein, J.A.; Miller, L.A. Wildfire smoke exposure and human health: Significant gaps in research for a growing public health issue. Environ. Toxicol. Pharmacol. 2017, 55, 186–195. [Google Scholar] [CrossRef]
- Gan, R.W.; Ford, B.; Lassman, W.; Pfister, G.; Vaidyanathan, A.; Fischer, E.; Volckens, J.; Pierce, J.R.; Magzamen, S. Comparison of wildfire smoke estimation methods and associations with cardiopulmonary-related hospital admissions. Geohealth 2017, 1, 122–136. [Google Scholar] [CrossRef]
- Fadadu, R.P.; Balmes, J.R.; Holm, S.M. Differences in the estimation of wildfire-associated air pollution by satellite mapping of smoke plumes and ground-level monitoring. Int. J. Environ. Res. Public Health 2020, 17, 8164. [Google Scholar] [CrossRef]
- Efimova, N.V.; Rukavishnikov, V.S.; Zabuga, G.A.; Elfimova, T.A. Landscape fire in East Siberia: Medical, ecological and economic aspects. IOP Conf. Ser. Earth Environ. Sci. 2018, 107, 012099. [Google Scholar] [CrossRef]
- Rukavishnikov, V.S.; Efimova, N.V.; Paramonov, V.V.; Fedorov, R.K. Services for analysis of the influence of air quality on population health during mass forest fires on the example of the Irkutsk region. In Proceedings of the XXVII International Symposium “Atmospheric and Ocean Optics. Atmospheric Physics”, Moscow, Russia, 5–9 July 2021; pp. F114–F119. (In Russian). Available online: https://symp.iao.ru/ru/aoo/27/proceedings (accessed on 1 October 2021).
- SanPiN 1.2.3685-21 “Hygienic standards and requirements for ensuring the safety and (or) harmlessness to humans of environmental factors”. Available online: https://docs.cntd.ru/document/573500115 (accessed on 14 September 2021).
- Available online: http://planet.rssi.ru/index.php?lang=ru&page_type=oper_prod&page=product&prod=342 (accessed on 5 September 2021).
- Liu, Y.; Austin, E.; Xiang, J.; Gould, T.; Larson, T.; Seto, E. Health impact assessment of the 2020 Washington State wildfire smoke episode: Excess health burden attributable to increased PM 2.5 exposures and potential exposure reductions. Geohealth 2021, 5, e2020GH000359. [Google Scholar] [CrossRef] [PubMed]
- Liu, J.C.; Peng, R.D. The impact of wildfire smoke on compositions of fine particulate matter by ecoregion in the Western US. J. Expo. Sci. Environ. Epidemiol. 2018, 29, 765–776. [Google Scholar] [CrossRef] [PubMed]
- Timofeeva, S.; Garmyshev, V.; Dubrovin, D. Assessment of the Contribution to the Pollution of the Atmosphere of Technogenic and Natural Fires in the Irkutsk Oblast. Ecol. Ind. Russ. 2018, 22, 67–71. [Google Scholar] [CrossRef]
- Kim, Y.H.; Warren, S.H.; Krantz, Q.T.; King, C.; Jaskot, R.; Preston, W.T.; George, B.J.; Hays, M.D.; Landis, M.S.; Higuchi, M.; et al. Mutagenicity and lung toxicity of smoldering vs. flaming emissions from various biomass fuels: Implications for health effects from wildland fires. Environ. Health Perspect. 2018, 126, 017011. [Google Scholar] [CrossRef] [PubMed] [Green Version]
- O’Dell, K.; Ford, B.; Fischer, E.V.; Pierce, J.R. Contribution of wildland-fire smoke to US PM2.5 and its influence on recent trends. Environ. Sci. Technol. 2019, 53, 1797–1804. [Google Scholar] [CrossRef] [PubMed]
- Henderson, S.B. The COVID-19 Pandemic and wildfire smoke: Potentially concomitant disasters. Am. J. Public Health 2020, 110, 1140–1142. [Google Scholar] [CrossRef]
Figure 1.
Russia map (a) and schematic map of the study area of the Baikal Region (b) with the main foci of wildfires (July–August 2021). Legend: ![Atmosphere 12 01542 i001]() —focus of wildfires.
—focus of wildfires.
 —focus of wildfires.
Figure 1.
Russia map (a) and schematic map of the study area of the Baikal Region (b) with the main foci of wildfires (July–August 2021). Legend: ![Atmosphere 12 01542 i001]() —focus of wildfires.
—focus of wildfires.
—focus of wildfires.
Figure 2.
Dynamics of the integrated indicator of air pollution, 2011–2020.

Figure 3.
Average daily concentrations by month (mg/m3).

Figure 4.
Intensity of smoke from wildfire in Siberia on 10 August 2021. SUOMI NPP satellite data (State Research Center for Space Hydrometeorology «Planeta» Siberian center) [36].
Figure 4.
Intensity of smoke from wildfire in Siberia on 10 August 2021. SUOMI NPP satellite data (State Research Center for Space Hydrometeorology «Planeta» Siberian center) [36].


Table 1.
Dynamics of the average annual level of air pollution for 2011–2020.
| Year | Pollutants | ||||||||
|---|---|---|---|---|---|---|---|---|---|
| Irkutsk | Bratsk | ||||||||
| TPM | SO2 | CO | NO2 | TPM | SO2 | CO | NO2 | ||
| 2011 | C, mg/m3 | 0.212 | 0.023 | 1.7 | 0.062 | 0.122 | 0.004 | 1.100 | 0.039 |
| C/MPC | 2.8 | 0.5 | 0.6 | 1.5 | 1.6 | 0.1 | 0.4 | 1.0 | |
| 2012 | C, mg/m3 | 0.192 | 0.026 | 1.1 | 0.07 | 0.137 | 0.002 | 1.100 | 0.021 |
| C/MPC | 2.56 | 0.52 | 0.4 | 1.7 | 1.8 | 0.04 | 0.4 | 0.5 | |
| 2013 | C, mg/m3 | 0.192 | 0.026 | 1.1 | 0.069 | 0.120 | 0.002 | 1.100 | 0.023 |
| C/MPC | 2.6 | 0.5 | 0.4 | 1.7 | 1.6 | 0.04 | 0.4 | 0.6 | |
| 2014 | C, mg/m3 | 0.17 | 0.015 | 1.1 | 0.057 | 0.127 | 0.000 | 1.000 | 0.025 |
| C/MPC | 2.3 | 0.3 | 0.4 | 1.4 | 1.7 | 0.00 | 0.3 | 0.6 | |
| 2015 | C, mg/m3 | 0.262 | 0.054 | 0.5 | 0.035 | 0.115 | 0.001 | 1.000 | 0.023 |
| C/MPC | 3.5 | 1.1 | 0.2 | 0.9 | 1.5 | 0.02 | 0.3 | 0.6 | |
| 2016 | C, mg/m3 | 0.318 | 0.035 | 0.4 | 0.042 | 0.184 | 0.001 | 0.900 | 0.029 |
| C/MPC | 4.2 | 0.7 | 0.1 | 1.1 | 2.4 | 0.01 | 0.3 | 0.7 | |
| 2017 | C, mg/m3 | 0.217 | 0.011 | 0.4 | 0.043 | 0.178 | 0.001 | 0.500 | 0.016 |
| C/MPC | 2.9 | 0.2 | 0.1 | 1.1 | 2.4 | 0.02 | 0.2 | 0.4 | |
| 2018 | C, mg/m3 | 0.2 | 0.018 | 0.2 | 0.012 | 0.147 | 0.001 | 0.500 | 0.013 |
| C/MPC | 2.7 | 0.4 | 0.1 | 0.3 | 2.0 | 0.01 | 0.2 | 0.3 | |
| 2019 | C, mg/m3 | 0.148 | 0.017 | 0.6 | 0.05 | 0.145 | 0.001 | 0.400 | 0.007 |
| C/MPC | 2.0 | 0.3 | 0.2 | 1.3 | 1.92 | 0.022 | 0.12 | 0.2 | |
| 2020 | C, mg/m3 | 0.124 | 0.024 | 0.6 | 0.057 | 0.150 | 0.001 | 0.400 | 0.008 |
| C/MPC | 1.7 | 0.5 | 0.2 | 1.4 | 2.0 | 0.02 | 0.1 | 0.2 | |
| Period averages with 95% confidence interval | 0.203 (0.197–0.210) | 0.025 (0.023–0.026) | 0.77 (0.713–0.826) | 0.049 (0.048–0.052) | 0.142 (0.139–0.145) | 0.0013 (0.001–0.0014) | 0.8 (0.76–0.84) | 0.020 (0.019–0.021) | |
| Standard deviation | 0.055 | 0.012 | 0.462 | 0.018 | 0.903 | 0.0195 | 0.345 | 0.295 | |
| KAZ (average multiplicity MPC) | 2.7 | 0.5 | 0.3 | 1.2 | 1.9 | 0.0 | 0.3 | 0.5 | |
Notes: C—Concentration; MPC—maximum permissible concentration.
Table 2.
Average daily concentrations of priority chemicals in the air of Irkutsk during a fire hazard period (August 2021).
Table 2.
Average daily concentrations of priority chemicals in the air of Irkutsk during a fire hazard period (August 2021).
| Periods | Pollutants, mg/m3 | |||||
|---|---|---|---|---|---|---|
| CO | NO | NO2 | SO2 | O3 | PM10 | |
| background level | 0.40 | 0.023 | 0.037 | 0.007 | 0.018 | 0.033 |
| 9–15 August | 0.975 | 0.021 | 0.035 | 0.004 | 0.008 | 0.046 |
| 16–22 August | 0.483 | 0.019 | 0.033 | 0.005 | 0.012 | 0.042 |
| 23–29 August | 0.236 | 0.022 | 0.031 | 0.012 | 0.02 | 0.032 |
| 30 August–5 September | 0.191 | 0.015 | 0.031 | 0.009 | 0.019 | 0.030 |
Table 3.
Average characteristics of pollution of the air for various levels of atmospheric phenomena in fire season.
Table 3.
Average characteristics of pollution of the air for various levels of atmospheric phenomena in fire season.
| Atmospheric Phenomena | Pollutants | n | Average (CI), mg/m3 | Standard Deviation |
|---|---|---|---|---|
| Slight Haze | TPM | 221 | 0.339 (0.292–0.386) | 0.35 |
| SO2 | 221 | 0.021 (0.019–0.023) | 0.02 | |
| soot | 221 | 0.014 (0.013–0.015) | 0.01 | |
| NO2 | 221 | 0.056 (0.051–0.060) | 0.03 | |
| CO | 138 | 2.638 (2.116–3.160) | 3.10 | |
| Formaldehyde | 136 | 0.014 (0.013–0.016) | 0.01 | |
| Smoke | TPM | 57 | 0.619 (0.507–0.731) | 0.42 |
| SO2 | 57 | 0.030 (0.026–0.035) | 0.02 | |
| soot | 57 | 0.034 (0.023–0.046) | 0.04 | |
| NO2 | 57 | 0.064 (0.057–0.072) | 0.03 | |
| CO | 17 | 3.471 (2.097–4.844) | 2.67 | |
| Formaldehyde | 10 | 0.018 (0.011–0.025) | 0.01 | |
| Haze | TPM | 250 | 0.422 (0.378–0.466) | 0.36 |
| SO2 | 250 | 0.020 (0.019–0.022) | 0.01 | |
| soot | 250 | 0.016 (0.015–0.017) | 0.01 | |
| NO2 | 250 | 0.058 (0.054–0.062) | 0.03 | |
| CO | 196 | 2.393 (2.044–2.742) | 2.48 | |
| Formaldehyde | 169 | 0.014 (0.013–0.016) | 0.01 |
Notes: n—number of observations.
Table 4.
Comparative assessment of average concentrations in the surface layer of air during wildfires.
Table 4.
Comparative assessment of average concentrations in the surface layer of air during wildfires.
| Constituents | Average Concentrations | Comparing 1–3 | Comparing 1–2 | Comparing 3–2 | |||||
|---|---|---|---|---|---|---|---|---|---|
| 1 (Slight Haze) | 3 (Smoke) | 2(Haze) | t-Test | p | t-Test | p | t-Test | p | |
| TPM | 0.339 | 0.619 | 0.422 | −5.12 | 0.0000 | −2.53 | 0.0116 | 3.64 | 0.0003 |
| SO2 | 0.021 | 0.030 | 0.020 | −3.90 | 0.0001 | 0.61 | 0.5443 | 4.70 | 0.0000 |
| Soot | 0.014 | 0.034 | 0.016 | −6.33 | 0.0000 | −2.04 | 0.0424 | 5.98 | 0.0000 |
| NO2 | 0.056 | 0.064 | 0.058 | −1.69 | 0.0926 | −0.57 | 0.5676 | 1.35 | 0.1781 |
| CO | 2.638 | 3.471 | 2.393 | −1.06 | 0.2912 | 0.80 | 0.4242 | 1.71 | 0.0890 |
| Formaldehyde | 0.014 | 0.018 | 0.014 | −1.45 | 0.1498 | −0.09 | 0.9300 | 1.27 | 0.2043 |
Table 5.
Assessment of the potential risk of nonspecific effects for the population of the Baikal region (August 2021).
Table 5.
Assessment of the potential risk of nonspecific effects for the population of the Baikal region (August 2021).
| Irkutsk | Bratsk | |||||||
|---|---|---|---|---|---|---|---|---|
| TPM | SO2 | CO | NO2 | TPM | SO2 | CO | NO2 | |
| Maximum concentration * | 0.975 | 0.059 | 1.64 | 0.046 | 0.8 | 0.013 | 11.8 | 0.195 |
| ARfC | 0.3 | 0.069 | 27 | 0.13 | 0.3 | 0.069 | 27 | 0.13 |
| HQ | 3.3 | 0.9 | 0.1 | 0.4 | 2.7 | 0.2 | 0.4 | 1.5 |
| MPCacute | 0.5 | 0.5 | 5 | 0.2 | 0.5 | 0.5 | 5 | 0.2 |
| prob | −1.3 | −5.9 | −2.5 | −4.7 | −1.6 | −8.2 | −0.5 | −2.4 |
| risk | 0.115 | <0.001 | 0.006 | <0.001 | 0.055 | <0.001 | 0.309 | 0.006 |
| Average concentration during 2 weeks ** | 0.30 | 0.004 | 1.97 | 0.035 | 0.60 | 0.32 | 4.6 | 0.085 |
| RfCch | 0.075 | 0.05 | 3 | 0.04 | 0.075 | 0.05 | 3 | 0.04 |
| HQ | 4 | 0.1 | 0.7 | 0.9 | 8.0 | 6.4 | 1.5 | 2.1 |
Notes: concentrations are presented according to the registered data *—per day with the highest KAZ and the recorded phenomenon of “smoke”; **—during the period of the highest smoke frequency during 6–19 August.
Publisher’s Note: MDPI stays neutral with regard to jurisdictional claims in published maps and institutional affiliations. |
© 2021 by the authors. Licensee MDPI, Basel, Switzerland. This article is an open access article distributed under the terms and conditions of the Creative Commons Attribution (CC BY) license (https://creativecommons.org/licenses/by/4.0/).
Share and Cite
MDPI and ACS Style
Efimova, N.V.; Rukavishnikov, V.S. Assessment of Smoke Pollution Caused by Wildfires in the Baikal Region (Russia). Atmosphere 2021, 12, 1542. https://0-doi-org.brum.beds.ac.uk/10.3390/atmos12121542
AMA Style
Efimova NV, Rukavishnikov VS. Assessment of Smoke Pollution Caused by Wildfires in the Baikal Region (Russia). Atmosphere. 2021; 12(12):1542. https://0-doi-org.brum.beds.ac.uk/10.3390/atmos12121542
Chicago/Turabian StyleEfimova, Natalia V., and Viktor S. Rukavishnikov. 2021. "Assessment of Smoke Pollution Caused by Wildfires in the Baikal Region (Russia)" Atmosphere 12, no. 12: 1542. https://0-doi-org.brum.beds.ac.uk/10.3390/atmos12121542
Note that from the first issue of 2016, this journal uses article numbers instead of page numbers. See further details here.