
Analysis and Sources Identification of Atmospheric PM10 and Its Cation and Anion Contents in Makkah, Saudi Arabia


Abstract
:1. Introduction
2. Materials and Methods
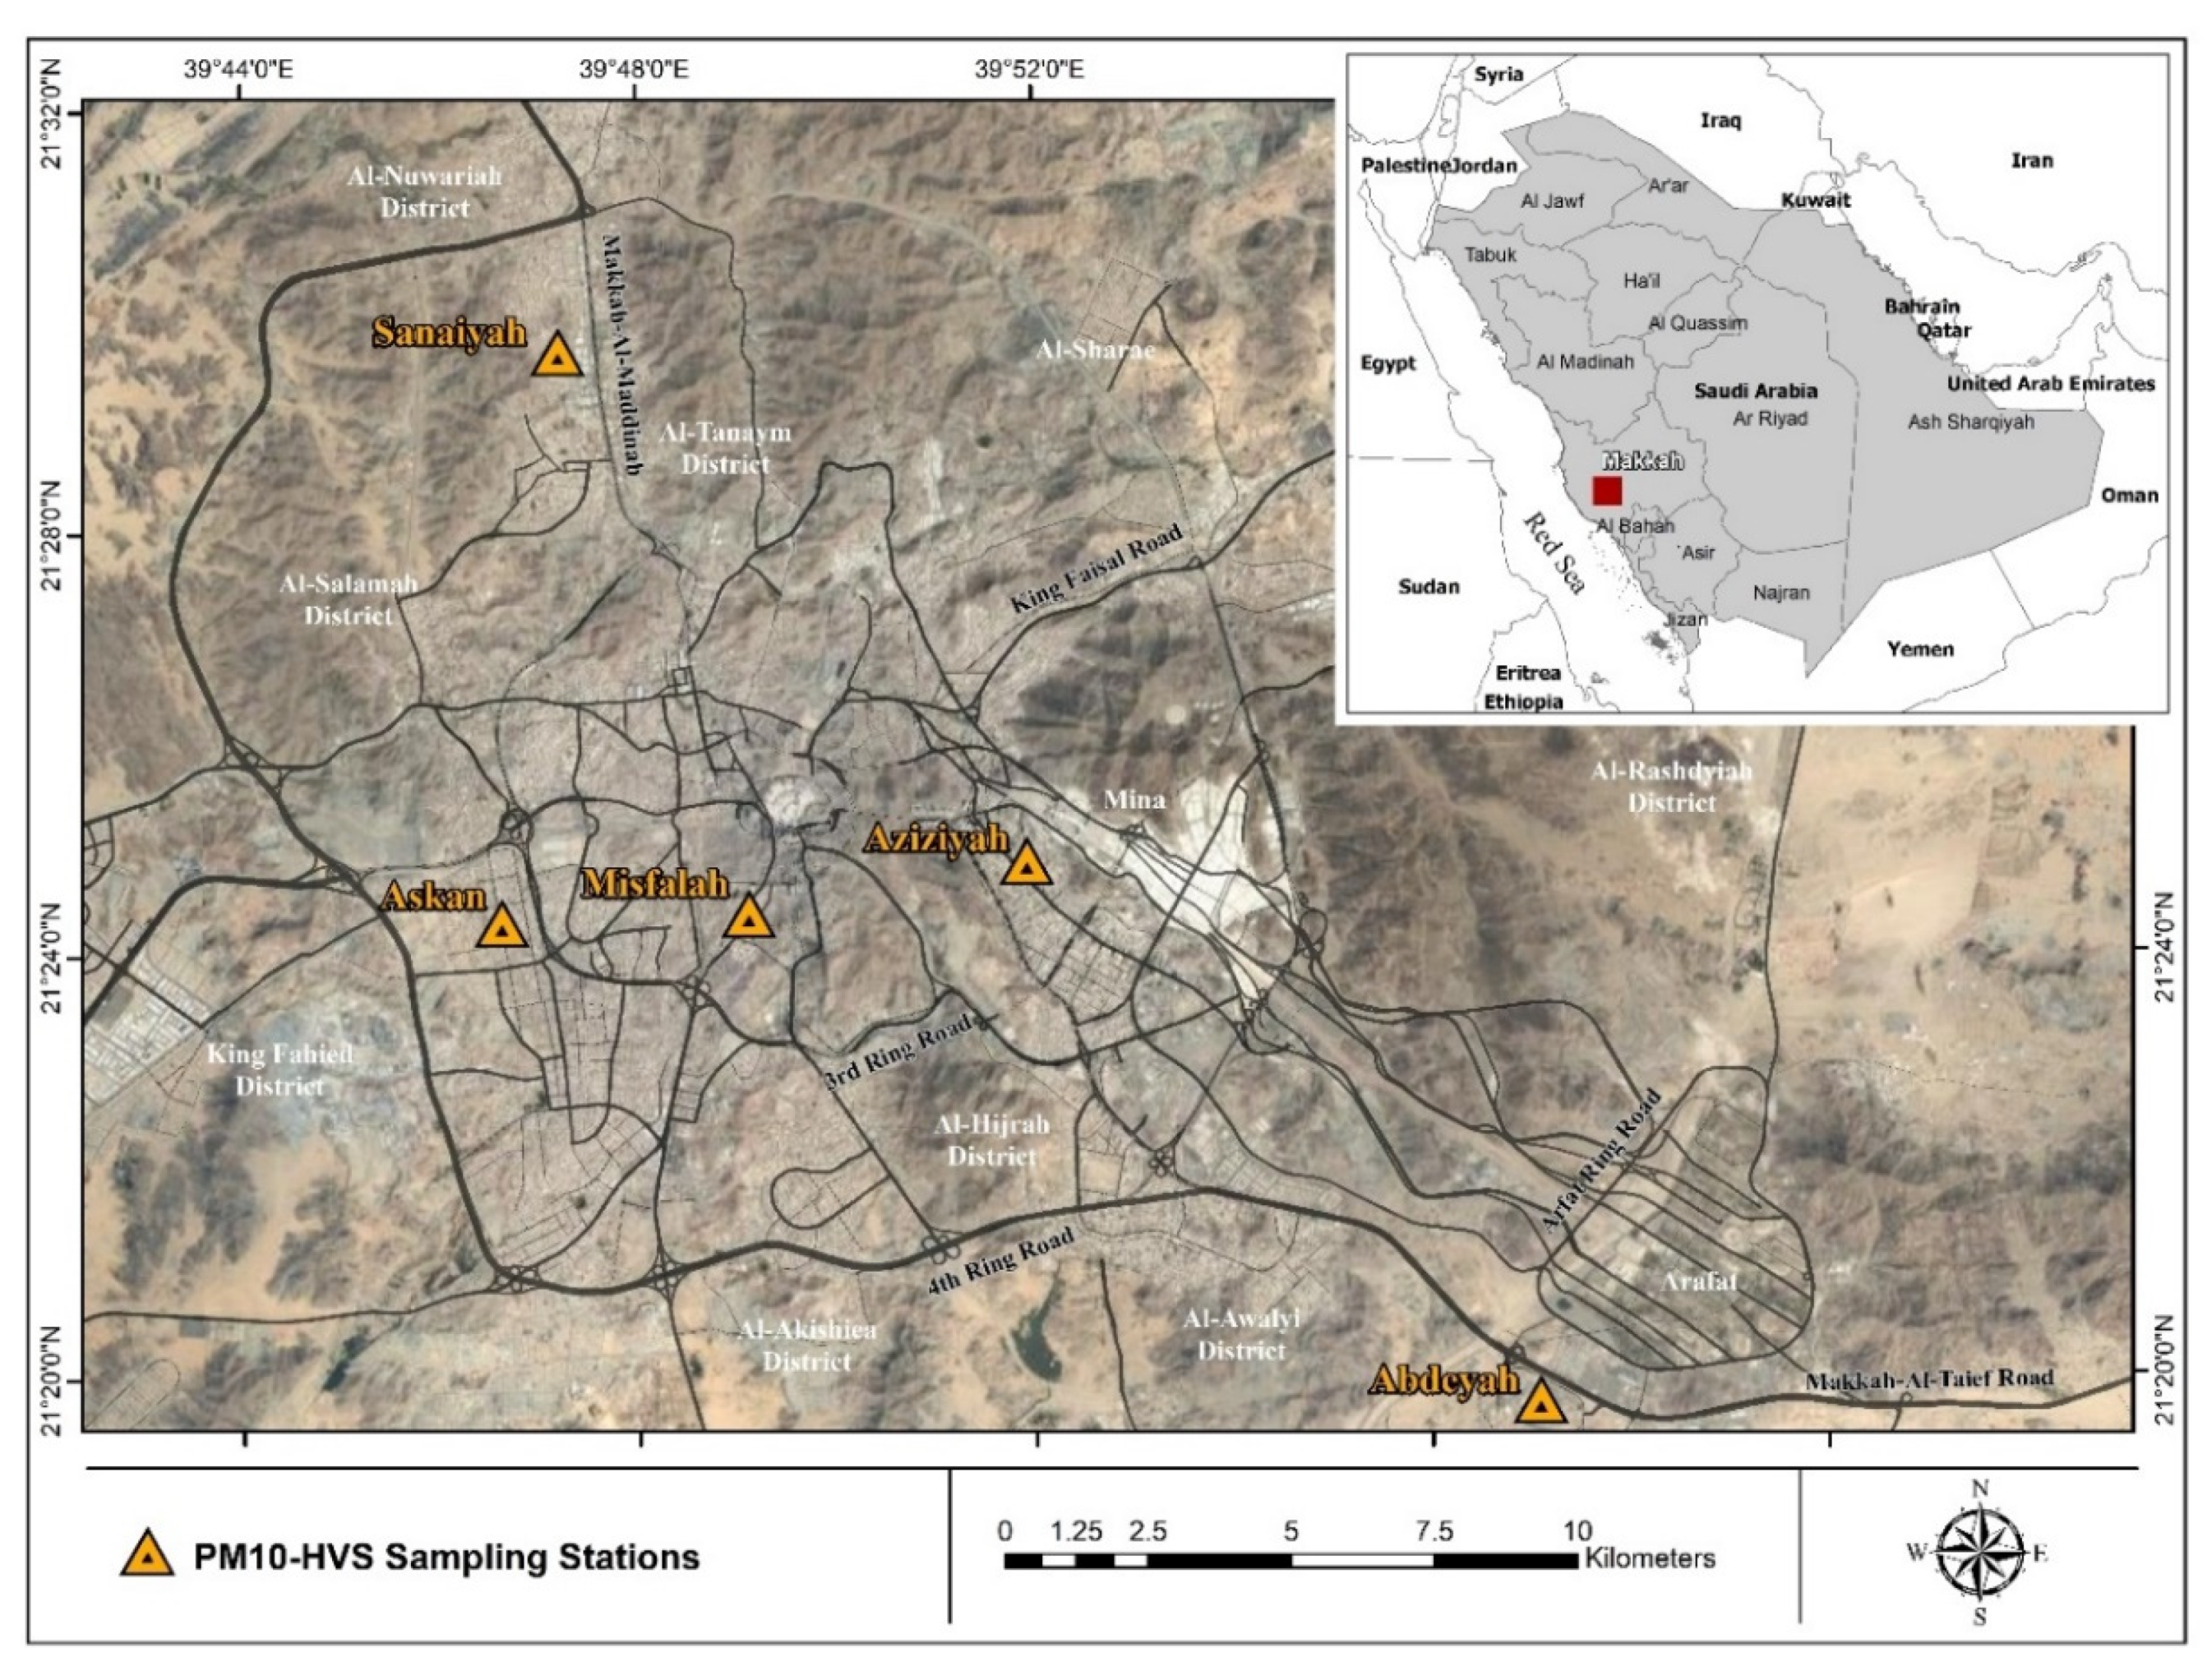
2.1. Description of the Monitoring Sites
2.2. Sample Collection
2.3. Analysis of PM10 Samples
2.3.1. Gravimetric Analysis
2.3.2. Analysis of Water-Soluble Ions
2.4. Statistical Analysis
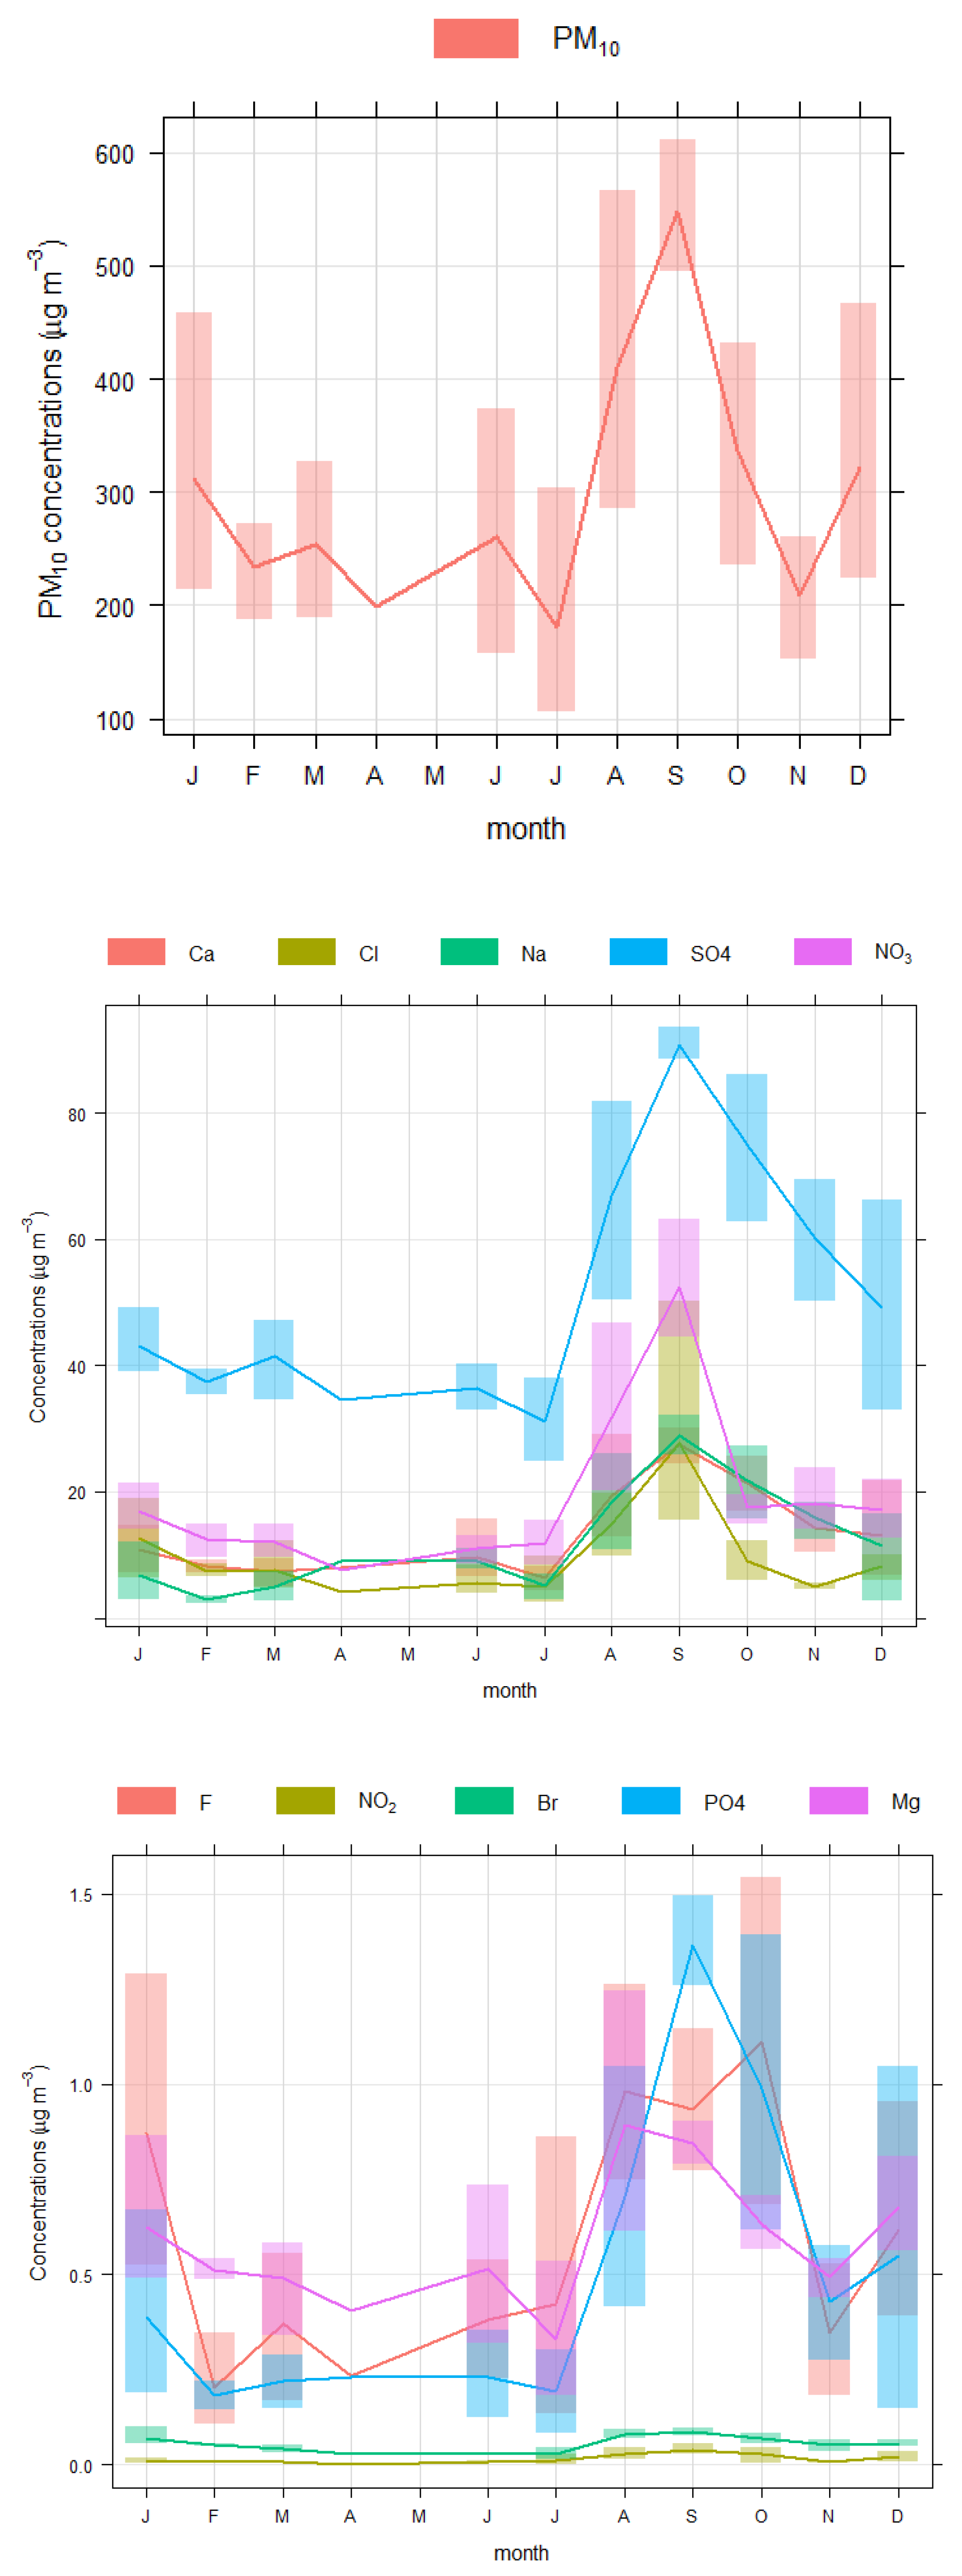
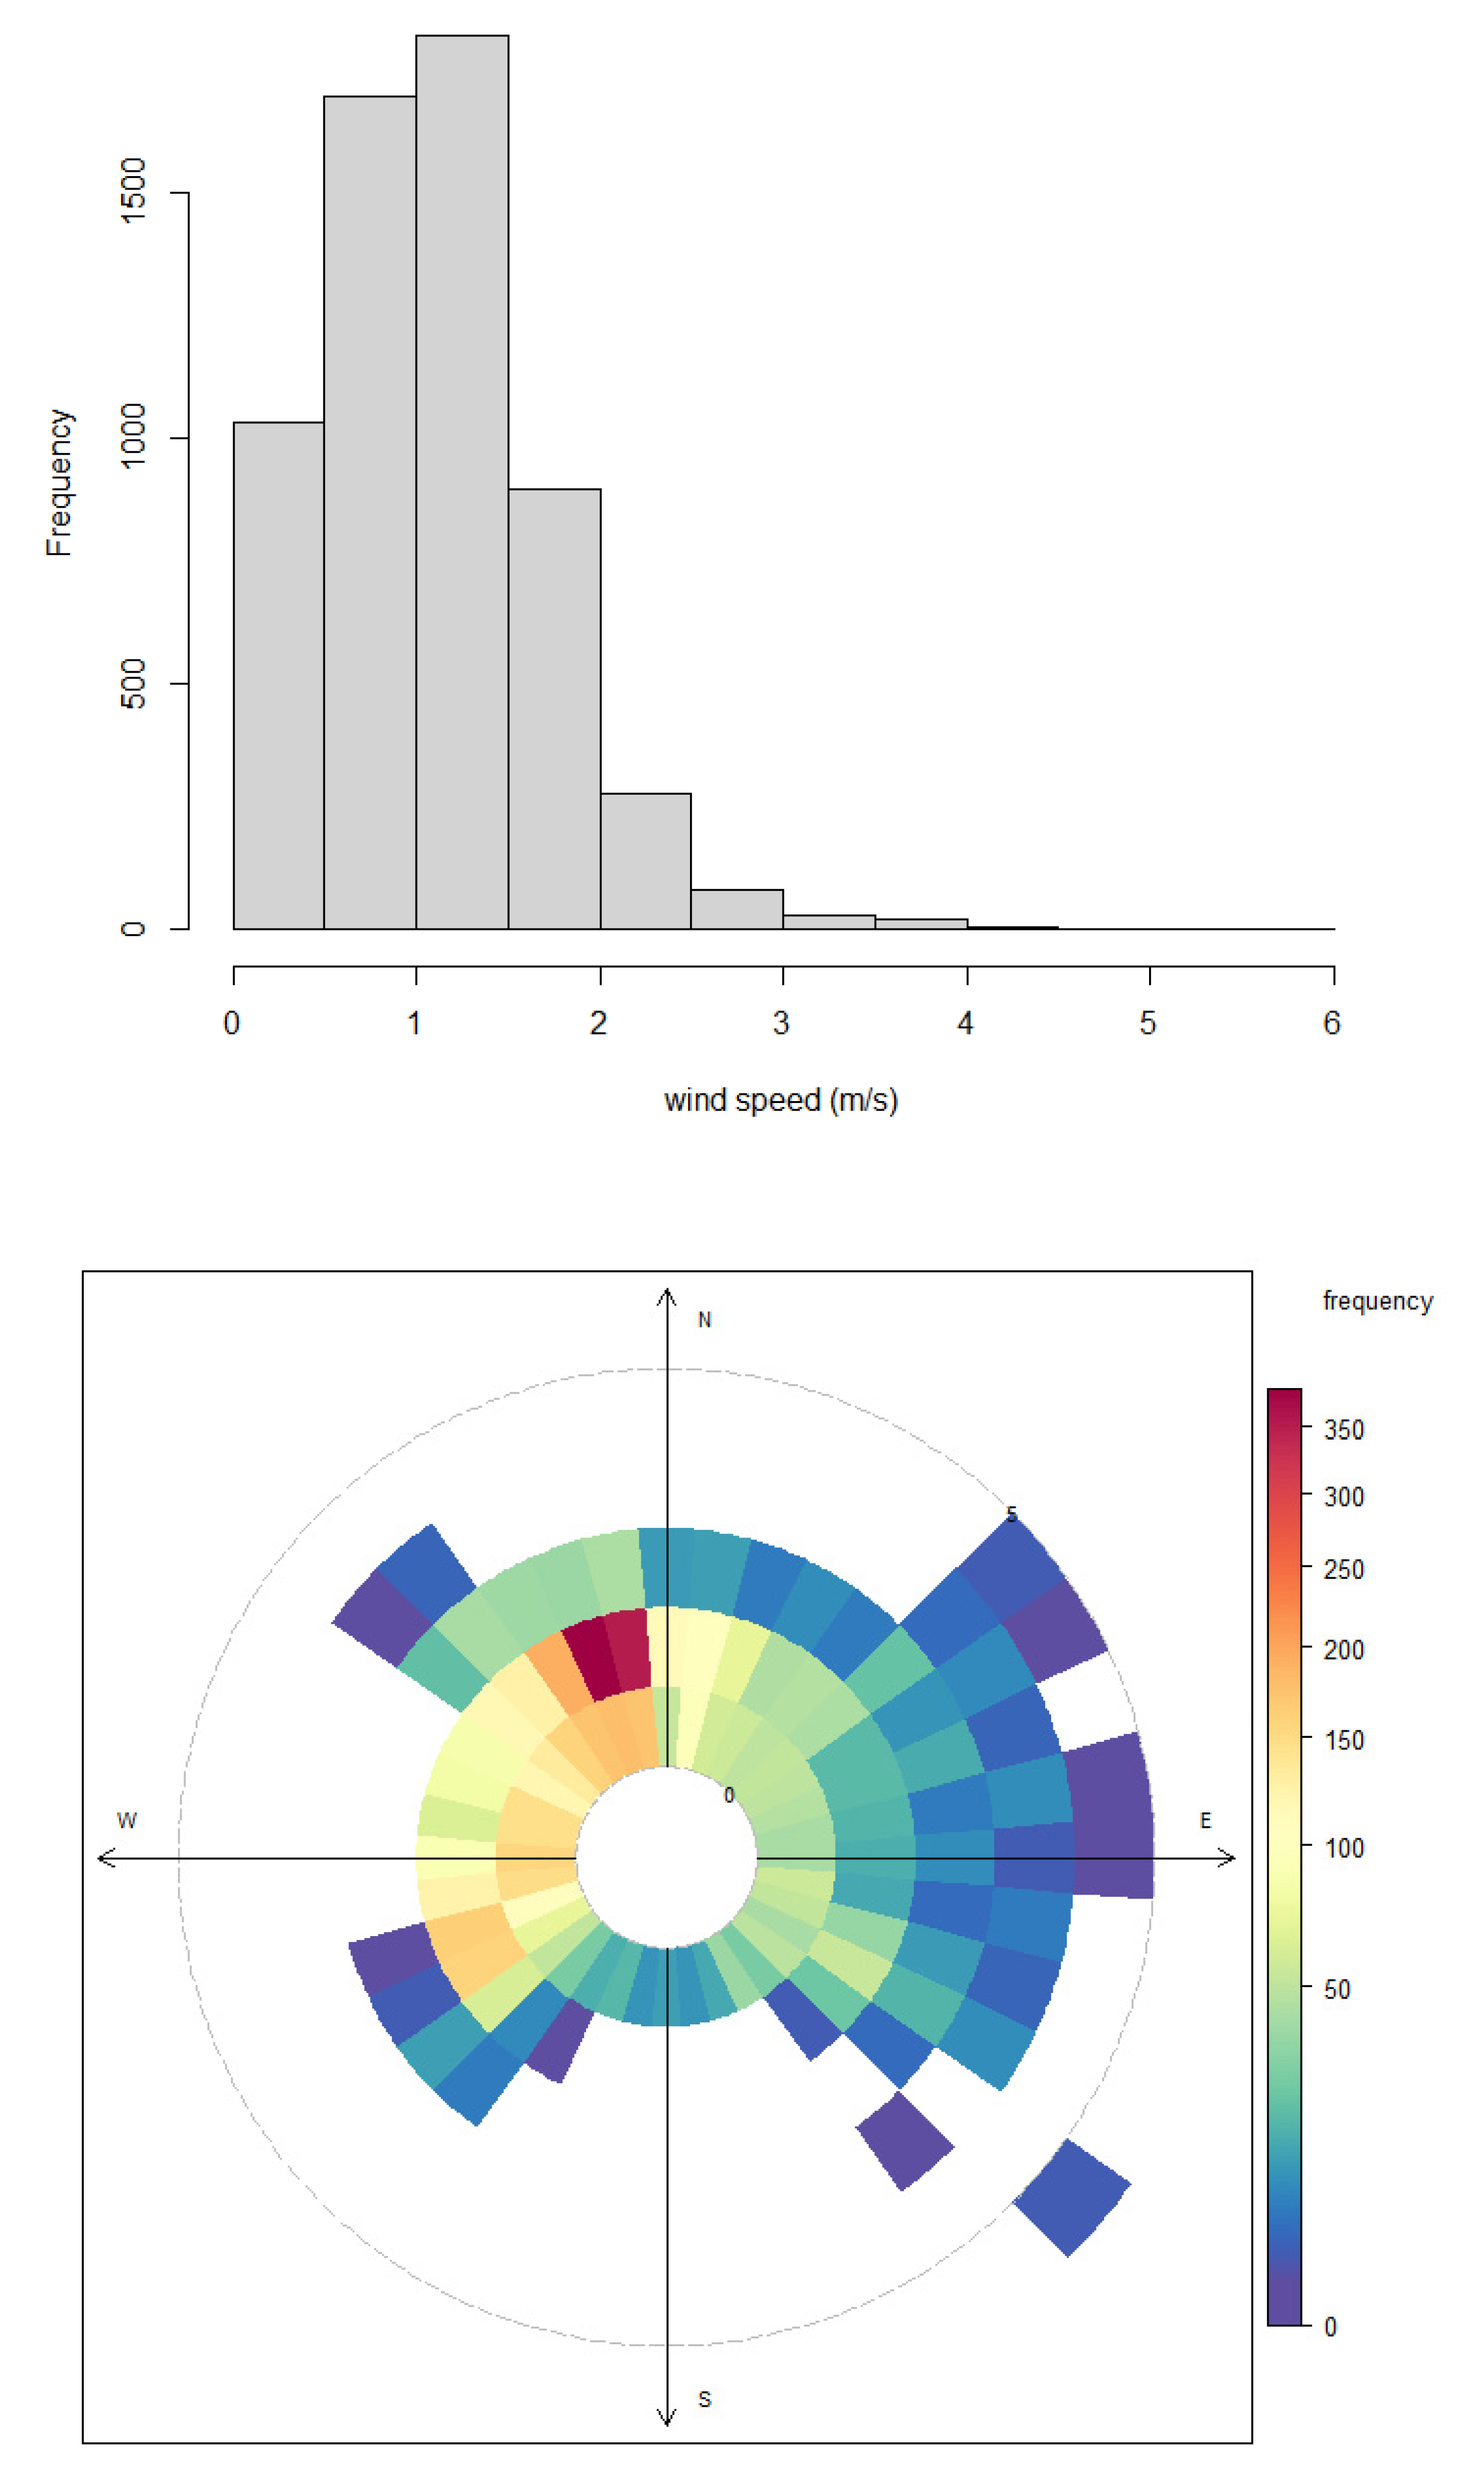
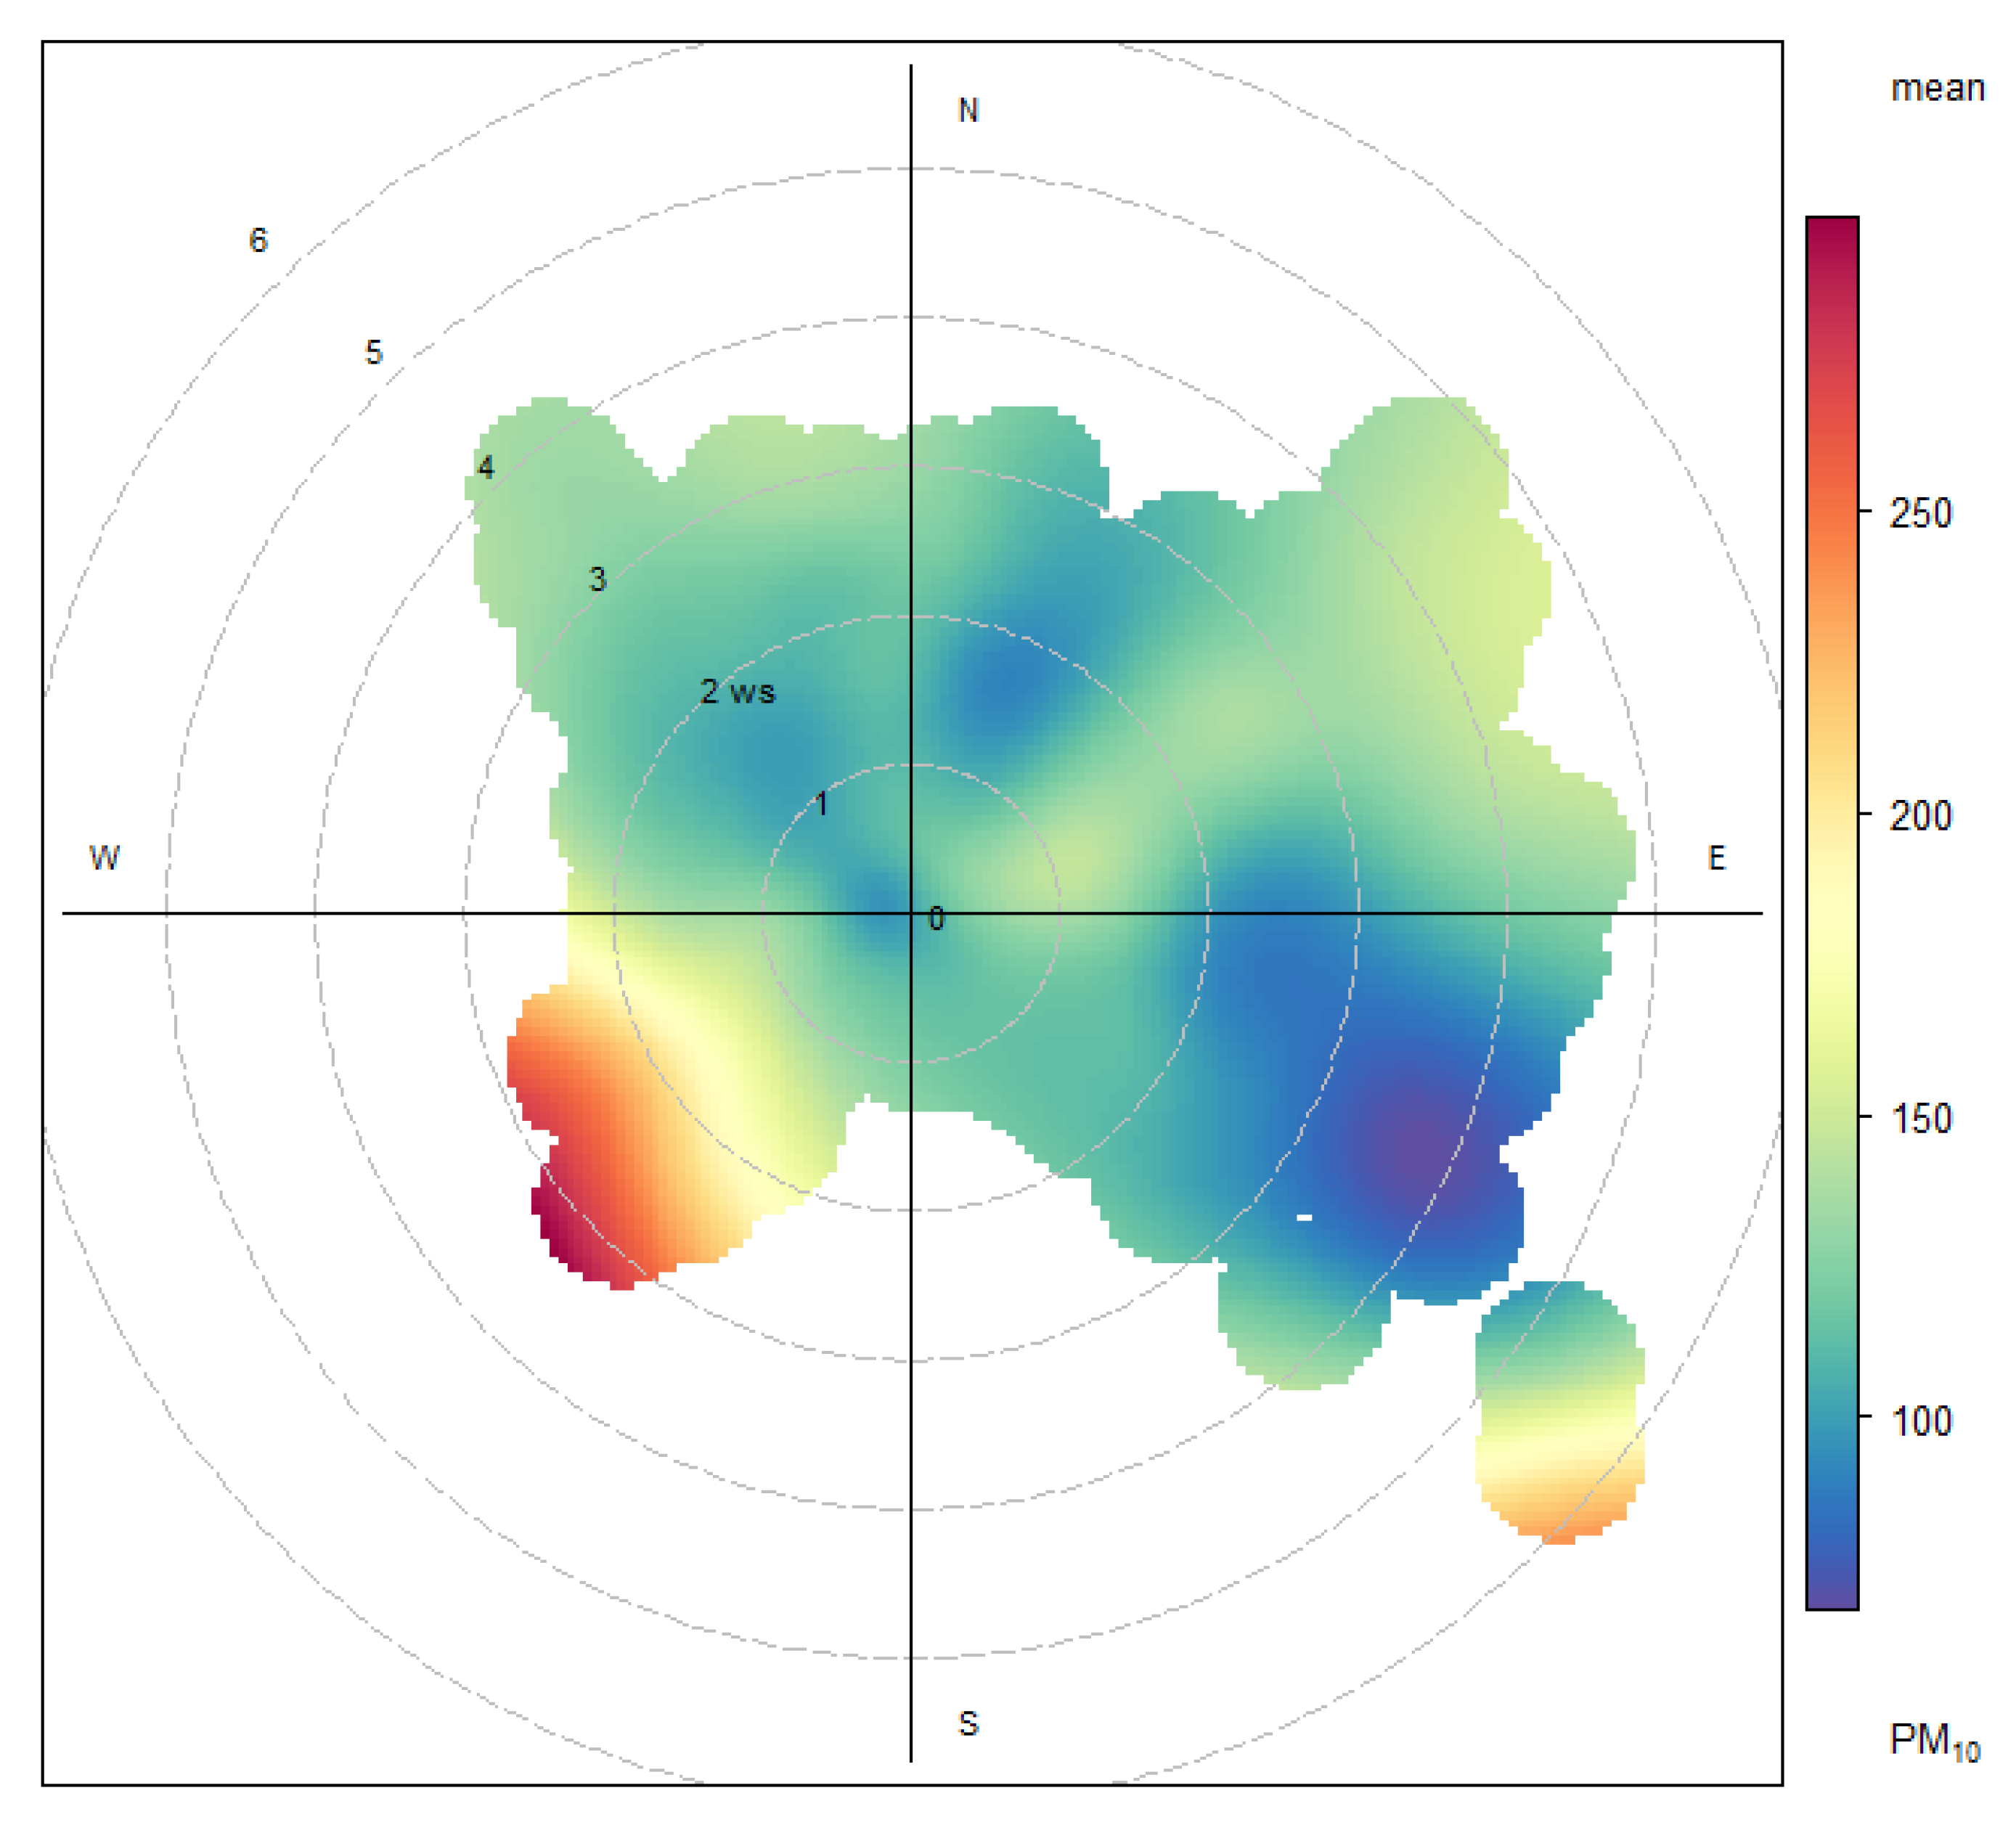
3. Results and Discussion
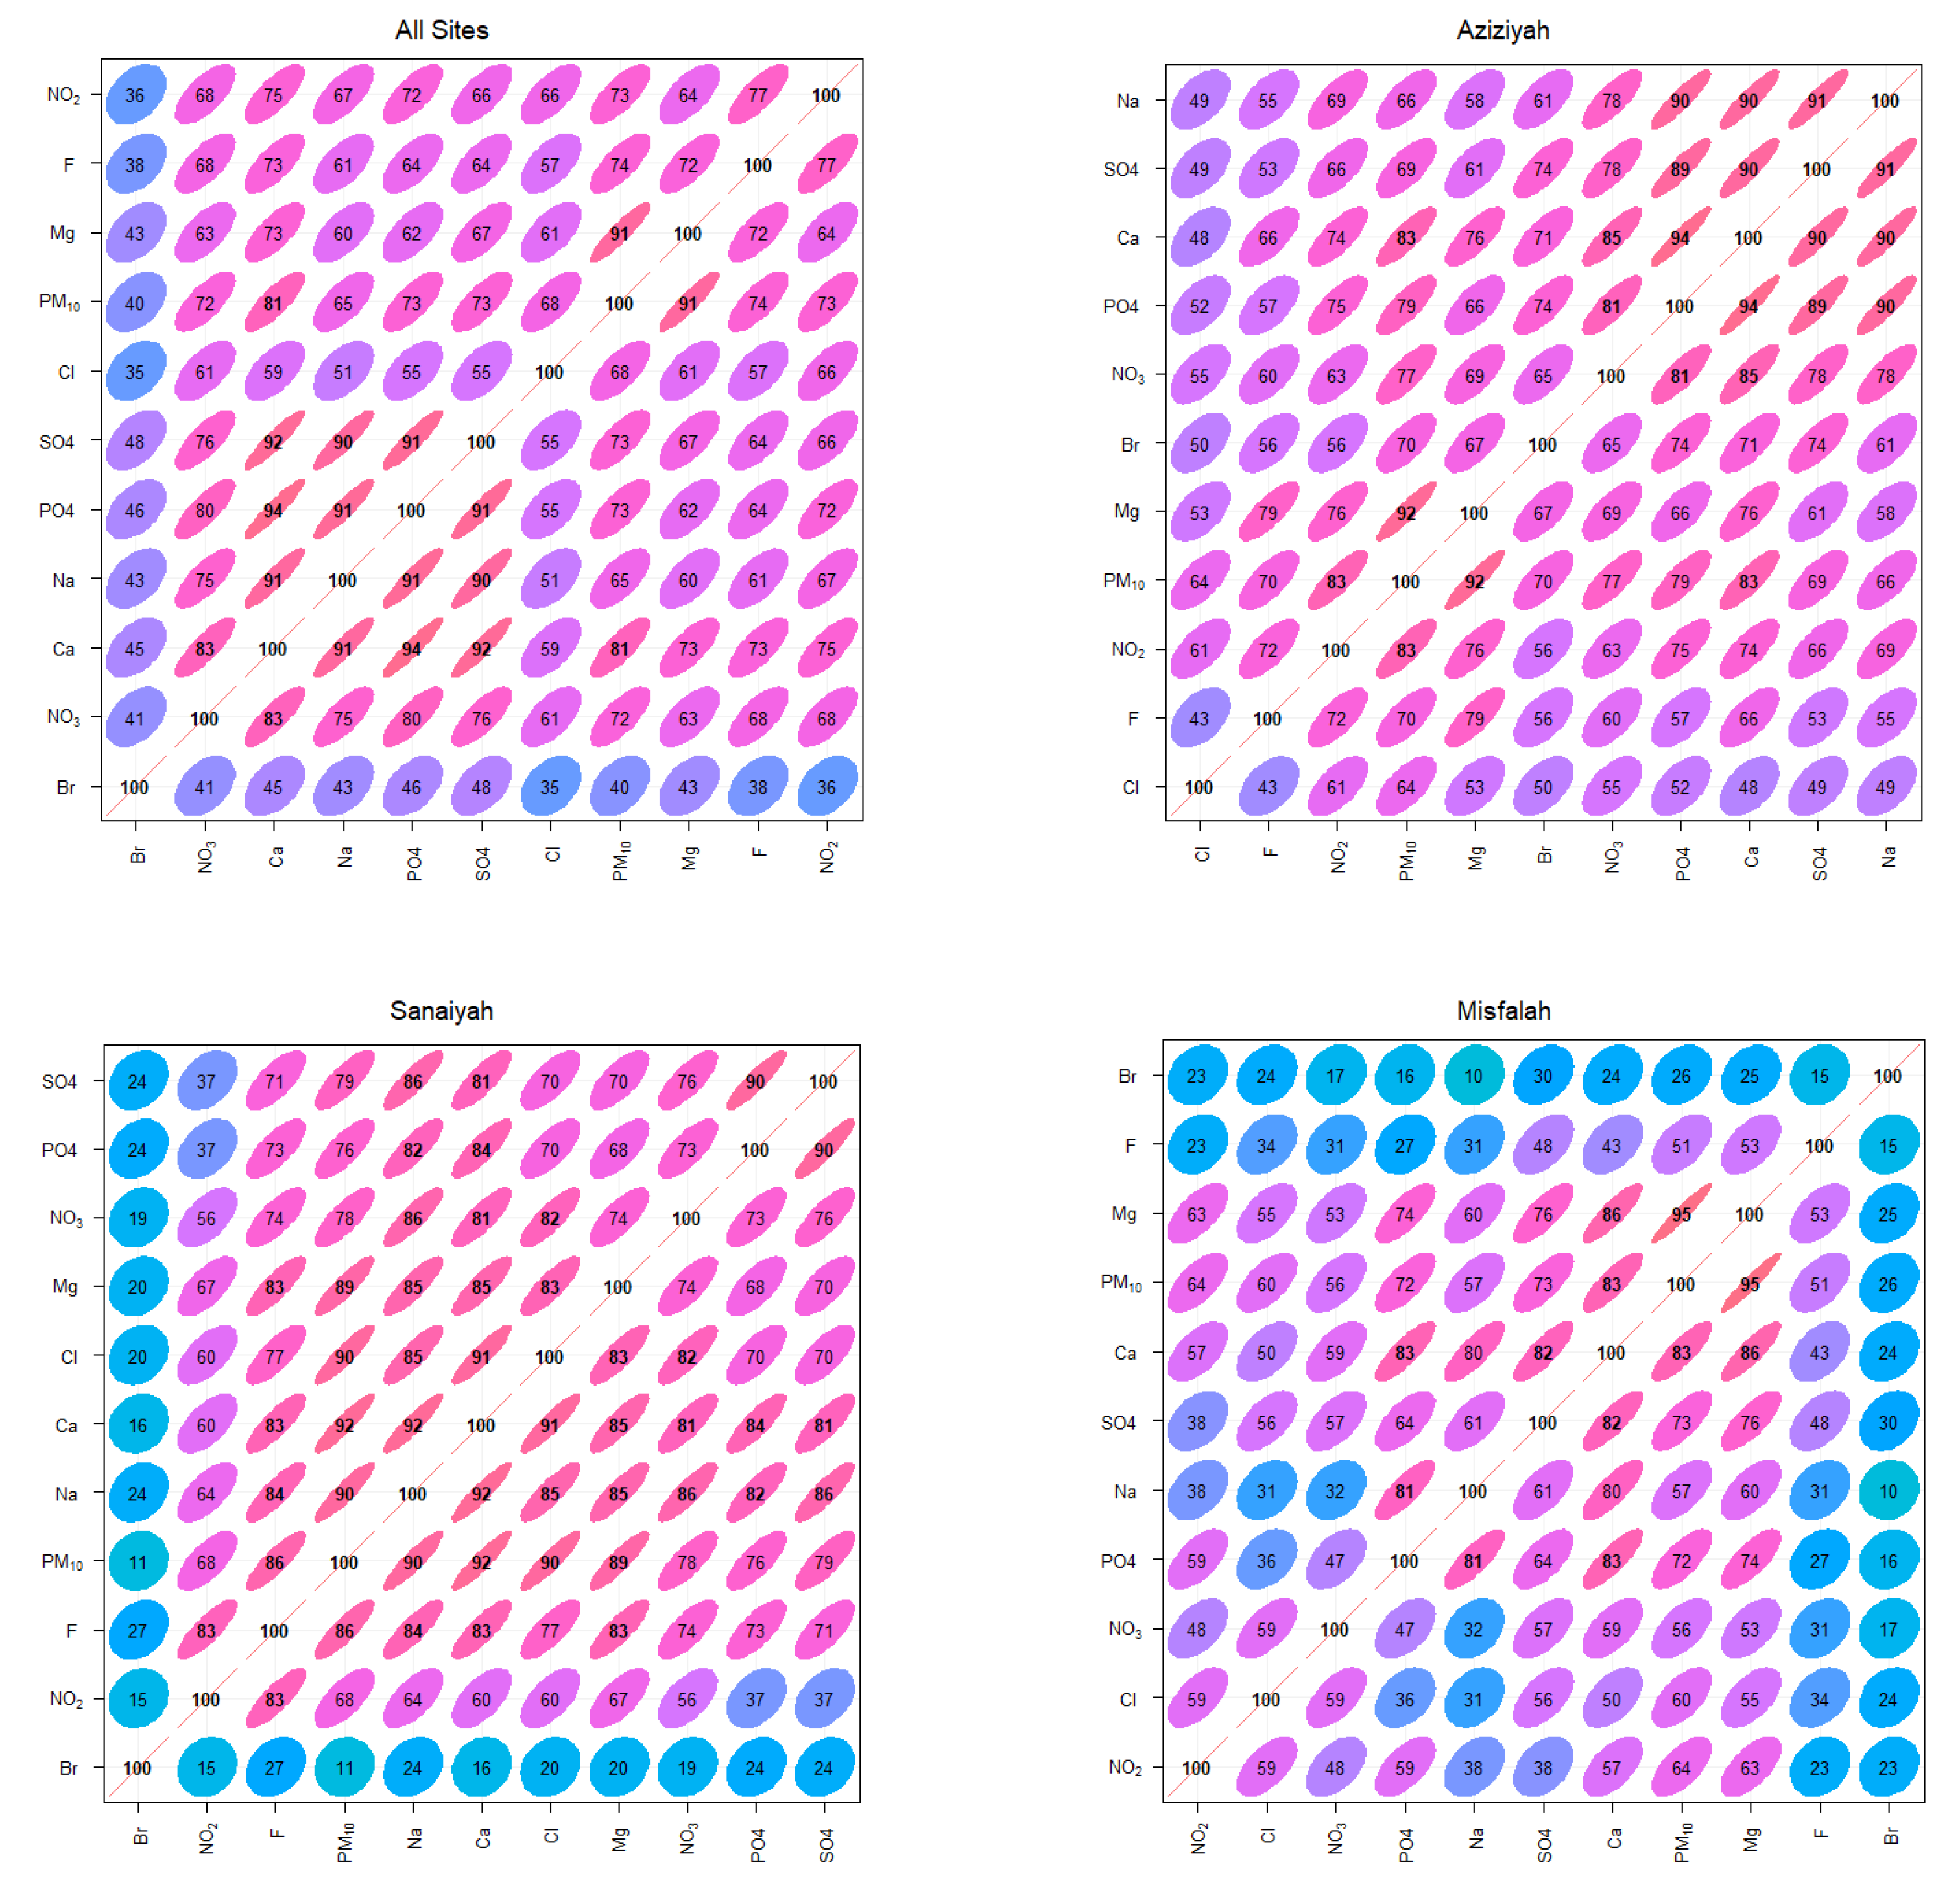
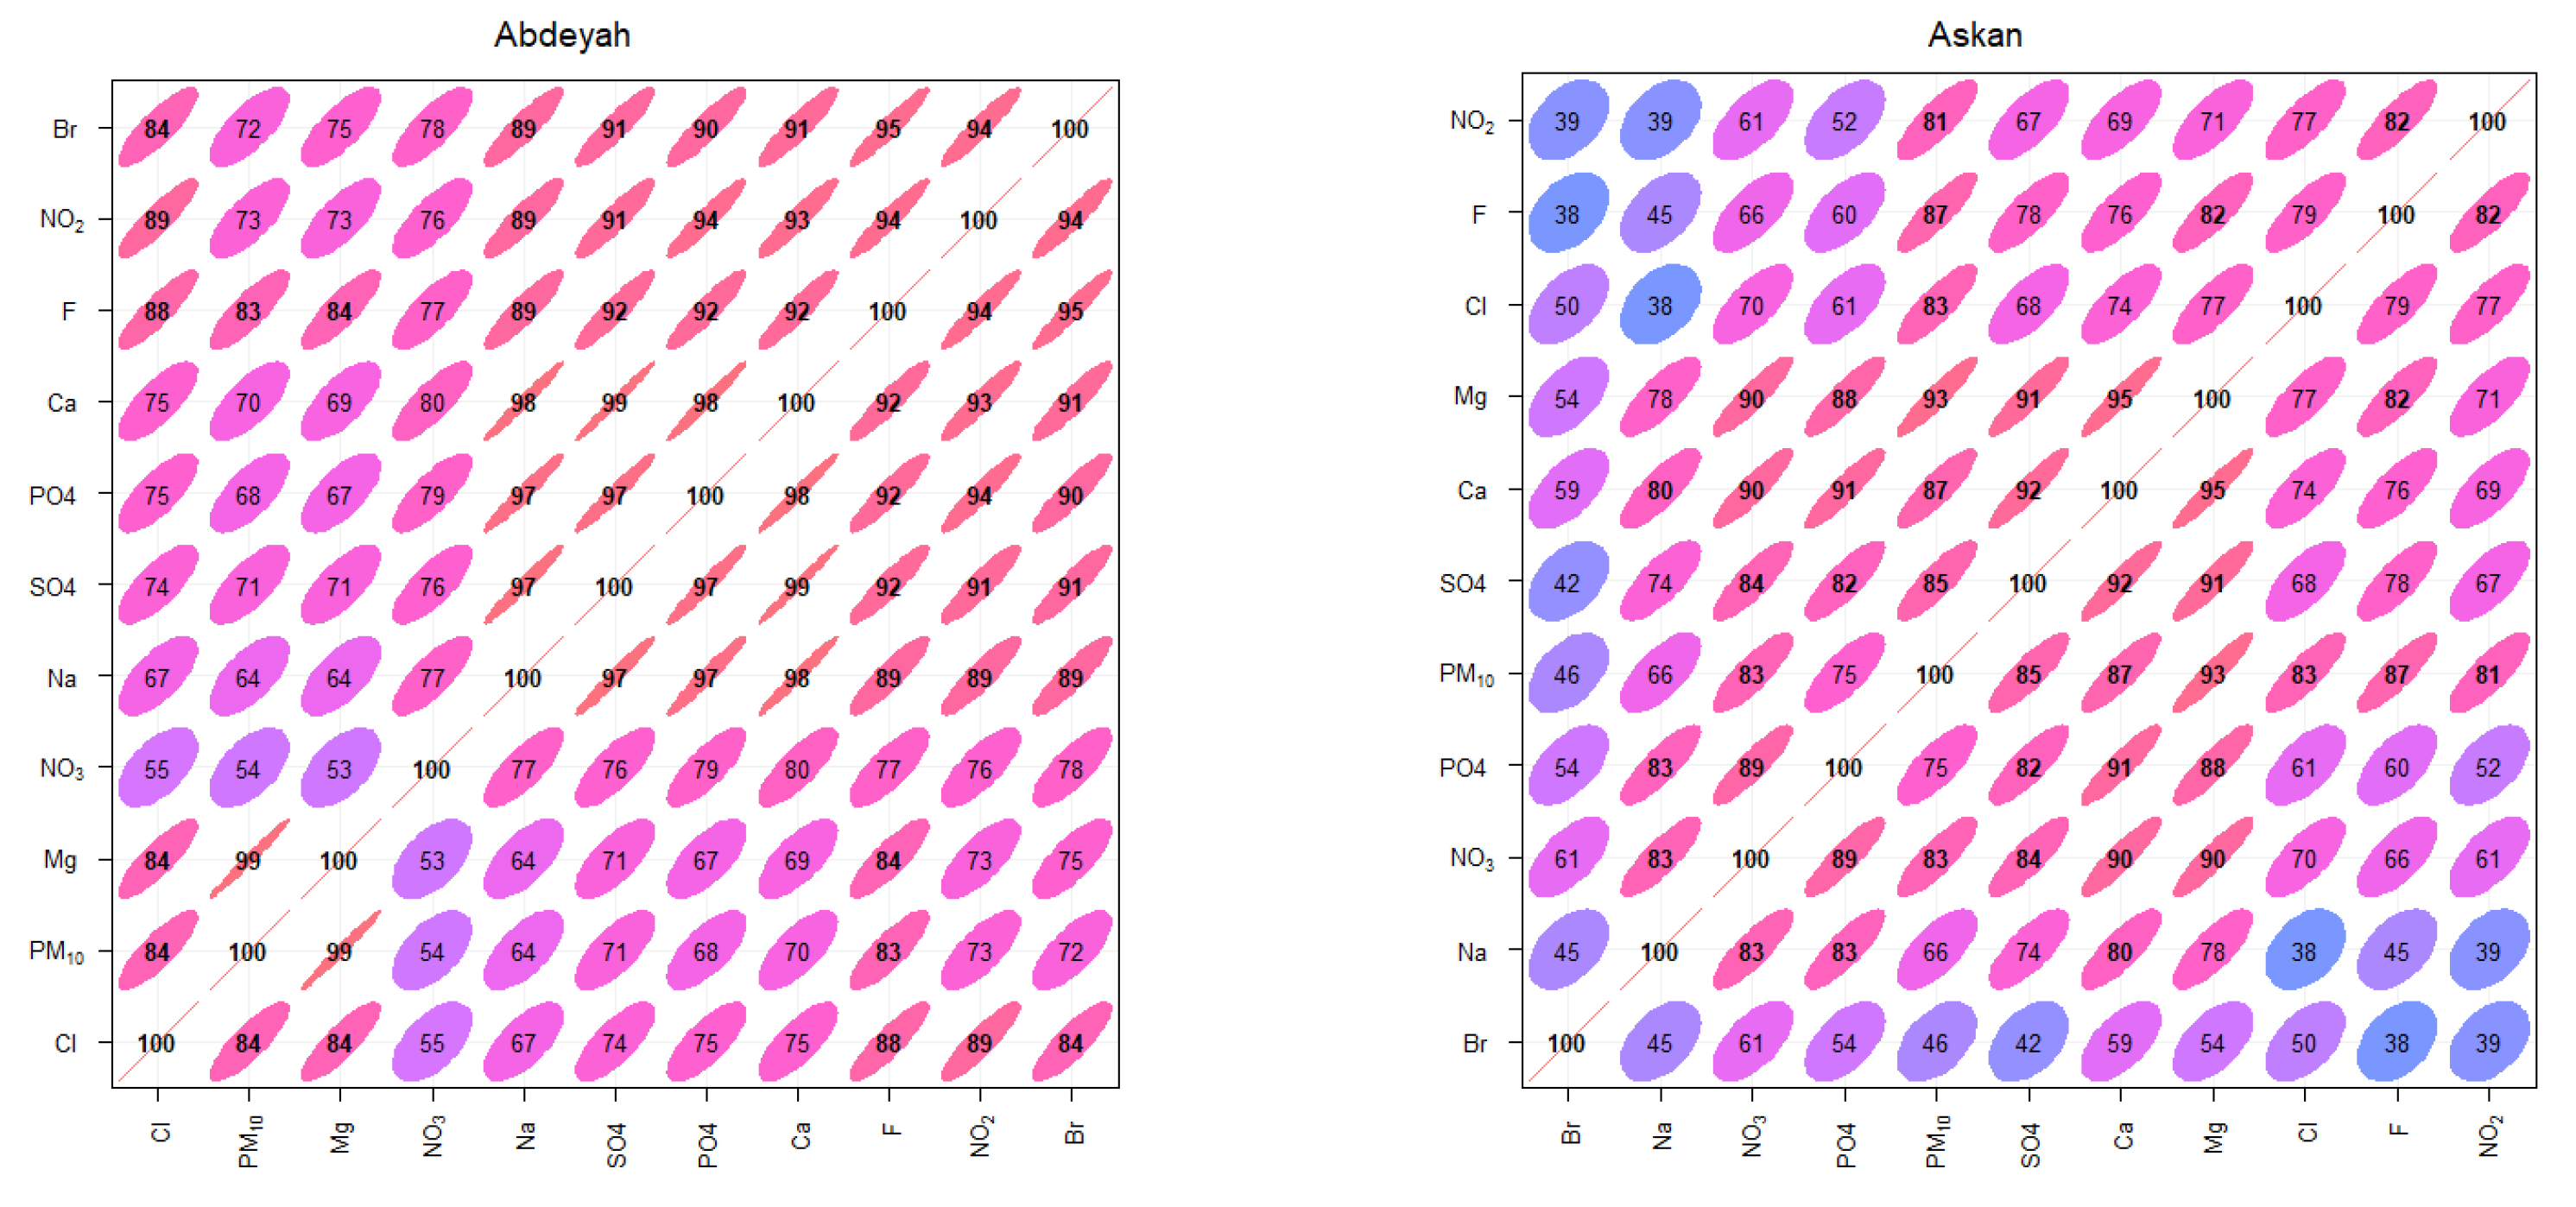
3.1. Correlation Analysis
3.2. Principal Component Analysis (PCA)
- Improving the quality of vehicle fleets (e.g., banning old polluting vehicles and retrofitting old vehicles with new technology) [10];
- Implementing an effective water spray programme during construction and demolition activities to reduce the amount of dust [50];
- Electrifying vehicle fleets and providing charging facilities [51];
- Discouraging idling [10];
- Further improving and encouraging public transport [10];
- Taking action to encourage active mobility, including cycling and walking [52].
4. Conclusions
Author Contributions
Funding
Institutional Review Board Statement
Acknowledgments
Conflicts of Interest
References
- Dastoorpoor, M.; Sekhavatpour, Z.; Masoumi, K.; Mohammadi, M.J.; Aghababaeian, H.; Khanjani, N.; Hashemzadeh, B.; Vahedian, M. Air pollution and hospital admissions for cardiovascular diseases in Ahvaz, Iran. Sci. Total Environ. 2019, 652, 1318–1330. [Google Scholar] [CrossRef]
- WHO. Ambient (Outdoor) Air Pollution. 2018. Available online: https://www.who.int/news-room/fact-sheets/detail/ambient-(outdoor)-air-quality-and-health (accessed on 5 May 2021).
- World Bank. The Cost of Air Pollution: Strengthening the Economic Case for Action; World Bank: Washington, DC, USA, 2016; Available online: https://openknowledge.worldbank.org/handle/10986/25013 (accessed on 5 November 2021).
- WHO. Air Pollution and Health: Summary. 2006. Available online: https://www.who.int/airpollution/ambient/about/en/ (accessed on 18 May 2021).
- Power, A.L.; Tennant, R.K.; Jones, R.T.; Tang, Y.; Du, J.; Worsley, A.T.; Love, J. Monitoring Impacts of Urbanisation and Industrialisation on Air Quality in the Anthropocene Using Urban Pond Sediments. Front. Earth Sci. 2018, 6, 31. [Google Scholar] [CrossRef]
- Nayebare, S.R.; Aburizaiza, O.S.; Khwaja, H.A.; Siddique, A.; Hussain, M.M.; Zeb, J.; Khatib, F.; Carpenter, D.O.; Blake, D.R. Chemical Characterization and Source Apportionment of PM2.5 in Rabigh, Saudi Arabia. Aerosol Air Qual. Res. 2016, 16, 3114–3129. [Google Scholar] [CrossRef] [Green Version]
- Mirza, A.P. Annual Number of Hajj Pilgrims to Saudi Arabia from 1999 to 2019. 2021. Available online: https://0-www-statista-com.brum.beds.ac.uk/statistics/617696/saudi-arabia-total-hajj-pilgrims/ (accessed on 12 December 2021).
- Seroji, A.R. Particulates in the atmosphere of Makkah and Mina valley during the Ramadan and Hajj sea-sons of 2004 and 2005. In Air Pollution XIX; WIT Transactions on Ecology and the Environment; WIT Press: Southampton, UK, 2011; Volume 147. [Google Scholar]
- Munir, S.; Habeebullah, T.M.; Seroji, A.; Morsy, E.A.; Mohammed, A.M.; Abu Saud, W.; Abdou, A.E.; Awad, A.H. Modeling Particulate Matter Concentrations in Makkah, Applying a Statistical Modeling Approach. Aerosol Air Qual. Res. 2013, 13, 901–910. [Google Scholar] [CrossRef] [Green Version]
- Simpson, I.J.; Aburizaiza, O.S.; Siddique, A.; Barletta, B.; Blake, N.J.; Gartner, A.; Khwaja, H.; Meinardi, S.; Zeb, J.; Blake, D.R. Air Quality in Mecca and Surrounding Holy Places in Saudi Arabia During Hajj: Initial Survey. Environ. Sci. Technol. 2014, 48, 8529–8537. [Google Scholar] [CrossRef] [Green Version]
- Nayebare, S.R.; Aburizaiza, O.S.; Siddique, A.; Carpenter, D.O.; Hussain, M.M.; Zeb, J.; Aburiziza, A.J.; Khwaja, H.A. Ambient air quality in the holy city of Makkah: A source apportionment with elemental enrichment factors (EFs) and factor analysis (PMF). Environ. Pollut. 2018, 243, 1791–1801. [Google Scholar] [CrossRef] [PubMed]
- Cusack, M.; Arrieta, J.M.; Duarte, C.M. Source Apportionment and Elemental Composition of Atmospheric Total Suspended Particulates (TSP) Over the Red Sea Coast of Saudi Arabia. Earth Syst. Environ. 2020, 4, 777–788. [Google Scholar] [CrossRef]
- Habeebullah, M.T. Chemical Composition of Particulate Matters in Makkah—Focusing on Cations, Anions and Heavy Metals. Aerosol. Air Qual. Res. 2016, 16, 336–347. [Google Scholar] [CrossRef] [Green Version]
- Khoder, M.; Shamy, M.; Alghamdi, M.; Zhong, M.; Sun, H.; Costa, M.; Chen, L.-C.; Maciejczyk, P. Source apportionment and elemental composition of PM2.5 and PM10 in Jeddah City, Saudi Arabia. Atmos. Pollut. Res. 2012, 3, 331–340. [Google Scholar] [CrossRef] [Green Version]
- Shahsavani, A.; Naddafi, K.; Haghighifard, N.J.; Mesdaghinia, A.; Yunesian, M.; Nabizadeh, R.; Arhami, M.; Yarahmadi, M.; Sowlat, M.H.; Ghani, M.; et al. Characterization of ionic composition of TSP and PM10 during the Middle Eastern Dust (MED) storms in Ahvaz, Iran. Environ. Monit. Assess 2012, 184, 6683–6692. [Google Scholar] [CrossRef]
- Pio, C.; Alves, C.; Nunes, T.; Cerqueira, M.; Lucarelli, F.; Nava, S.; Calzolai, G.; Gianelle, V.; Colombi, C.; Amato, F.; et al. Source apportionment of PM2.5 and PM10 by Ionic and Mass Balance (IMB) in a traffic-influenced urban atmosphere, in Portugal. Atmos. Environ. 2020, 223, 117217. [Google Scholar] [CrossRef]
- Bozkurt, Z. Seasonal variation of water-soluble inorganic ions in PM10 in a city of northwestern Turkey. Environ. Forensics 2017, 19, 1–13. [Google Scholar] [CrossRef]
- Liu, H.; Zheng, J.; Qu, C.; Zhang, J.; Wang, Y.; Zhan, C.; Yao, R.; Cao, J. Characteristics and Source Aanalysis of Water-Soluble Inorganic Ions in PM10 in a Typical Mining City, Central China. Atmosphere 2017, 8, 74. [Google Scholar] [CrossRef] [Green Version]
- Deshmukh, D.K.; Tsai, Y.I.; Deb, M.K.; Zarmpas, P. Characteristics and sources of water-soluble ionic species associated with PM10 particles in the ambient air of central India. Bull. Environ. Contam. Toxicol. 2012, 89, 1091–1097. [Google Scholar] [CrossRef] [PubMed]
- CDSI. Central Department of Statistics and Information of Saudi Arabia. 2020. Available online: https://www.stats.gov.sa/en (accessed on 19 September 2021).
- Almazroui, M. Temperature variability over Saudi Arabia during the period 1978–2010 and its association with global climate indices. Met. Environ. Arid Land Agric. Sci. 2012, 23, 85–108. [Google Scholar] [CrossRef]
- Ferreira, R.; Nunes, C.; Souza, M.; Canela, M. Multivariate Optimization of Extraction Variables of PAH in Particulate Matter (PM10) in Indoor/Outdoor Air at Campos dos Goytacazes, Brazil. J. Braz. Chem. Soc. 2021, 32, 618–625. [Google Scholar] [CrossRef]
- Sowlat, M.H.; Naddafi, K.; Yunesian, M.; Jackson, P.L.; Lotfi, S.; Shahsavani, A. PM10 Source Apportionment in Ahvaz, Iran, Using Positive Matrix Factorization | Enhanced Reader. Clean Soil Air Water 2013, 41, 1143–1151. [Google Scholar] [CrossRef]
- CARB. Standard Operating Procedure for the Determination of PM10 Mass by Gravimetric Analysis. Northern Laboratory Branch, Monitoring and Laboratory Division. 2018. Available online: https://www.arb.ca.gov/aaqm/sop/mld016.pdf (accessed on 20 September 2021).
- R Core Team RC. R: A Language and Environment for Statistical Computing; R Foundation for Statistical Computing: Vienna, Austria; Available online: http://www.r-project.org/index.html (accessed on 20 April 2021).
- Carslaw, D. The Openair Manual: Open-Source Tools for Analysing Air Pollution Data. 2019. Available online: https://davidcarslaw.com/files/openairmanual.pdf (accessed on 23 April 2021).
- Wickham, H. ggplot2: Elegant Graphics for Data Analysis, 2nd ed.; Springer International Publishing: Berlin/Heidelberg, Germany, 2009; Available online: https://0-link-springer-com.brum.beds.ac.uk/book/10.1007/978-0-387-98141-3 (accessed on 12 August 2021).
- Park, K.; Dam, H.D. Characterization of metal aerosols in PM10 from urban, industrial, and Asian Dust sources. Environ. Monit. Assess. 2008, 160, 289–300. [Google Scholar] [CrossRef] [PubMed]
- Zuska, Z.; Kopcinska, J.; Dacewicz, E.; Skowera, B.; Wojkowski, J.; Wojtaszek, A.Z. Application of the Principal Component Analysis (PCA) Method to Assess the Impact of Meteorological Elements on Concentrations of Particu-late Matter (PM10): A Case Study of the Mountain Valley (the Sacz Sasin, Poland). Sustainability 2019, 11, 6740. [Google Scholar] [CrossRef] [Green Version]
- Cesari, D.; Amato, F.; Pandolfi, M.; Alastuey, A.; Querol, X.; Contini, D. An inter-comparison of PM10 source appor-tionment using PCA and PMF receptor models in three European sites. Environ. Sci. Pollut. Res. 2016, 23, 15133–15148. [Google Scholar] [CrossRef]
- ArRiaydh Air Quality. Air Quality Standards, Legislations and Policy. Available online: http://aq.arriyadhenv.gov.sa/aq/about-us/riyadh-air-quality-standards/ (accessed on 18 December 2021).
- Mohammed, A.M.F.; Munir, S.; Habeebullah, T.M. Characterization of atmospheric aerosols in Makkah. Int. J. Agric. Environ. Res. 2021, 1, 1–17. [Google Scholar]
- Al-Jeelani, H.A. Evaluation of air quality in the Holy Makkah during Hajj season 1425 H. J. Appl. Sci. Res. 2009, 5, 115–121. [Google Scholar]
- Othman, N.; Jafri, M.Z.M.; San, L.H. Estimating Particulate Matter Concentration over Arid Region Using Satellite Remote Sensing: A Case Study in Makkah, Saudi Arabia. Mod. Appl. Sci. 2010, 4, 131. [Google Scholar] [CrossRef] [Green Version]
- Morsy, E.; Habeebullah, T.M.; Othman, A. Assessing the air quality of megacities during the COVID-19 pandemic lockdown: A case study from Makkah City, Saudi Arabia. Arab. J. Geosci. 2021, 14, 1–12. [Google Scholar] [CrossRef]
- Schober, P.; Boer, C.; Schwarte, L.A. Correlation Coefficients: Appropriate Use and Interpretation. Anesth. Analg. 2018, 126, 1763–1768. [Google Scholar] [CrossRef]
- Kumar, R.; Elizabeth, A.; Gawane, A.G. Air Quality Profile of Inorganic Ionic Composition of Fine Aerosols at Two Sites in Mumbai City. Aerosol Sci. Technol. 2006, 40, 477–489. [Google Scholar] [CrossRef]
- Cheng, Z.; Lam, K.; Chan, L.; Wang, T.; Cheng, K. Chemical characteristics of aerosols at coastal station in Hong Kong. I. Seasonal variation of major ions, halogens and mineral dusts between 1995 and 1996. Atmos. Environ. 2000, 34, 2771–2783. [Google Scholar] [CrossRef]
- Keene, W.C.; Pszenny, A.A.P.; Galloway, J.N.; Hawley, M.E. Sea-salt corrections and interpretation of constituent ratios in marine precipitation. J. Geophys. Res. Space Phys. 1986, 91, 6647–6658. [Google Scholar] [CrossRef]
- Sander, R.; Keene, W.C.; Pszenny, A.A.P.; Arimoto, R.; Ayers, G.P.; Baboukas, E.; Cainey, J.M.; Crutzen, P.J.; Duce, R.A.; Hönninger, G.; et al. Inorganic bromine in the marine boundary layer: A critical review. Atmos. Chem. Phys. Discuss. 2003, 3, 1301–1336. [Google Scholar] [CrossRef] [Green Version]
- Jayarathne, T.; Stockwell, C.E.; Yokelson, R.; Nakao, S.; Stone, E.A. Emissions of Fine Particle Fluoride from Biomass Burning. Environ. Sci. Technol. 2014, 48, 12636–12644. [Google Scholar] [CrossRef]
- Zhang, G.; Ding, C.; Jiang, X.; Pan, G.; Wei, X.; Sun, Y. Chemical Compositions and Sources Contribution of Atmos-pheric Particles at a Typical Steel Industrial Urban Site. Sci. Rep. 2020, 10, 7654. [Google Scholar] [CrossRef]
- Chen, L.; Peng, C.; Gu, W.; Fu, H.; Jian, X.; Zhang, H.; Zhang, G.; Zhu, J.; Wang, X.; Tang, M. On mineral dust aerosol hygroscopicity. Atmos. Chem. Phys. Discuss. 2020, 20, 13611–13626. [Google Scholar] [CrossRef]
- Duxbury, A.C.; Byrne, R.H.; Mackenzie, F.T. Sewater. 2020. Available online: https://www.britannica.com/science/seawater (accessed on 12 December 2021).
- Moller, D. The Na/Cl ratio in rainwater and the seasalt chloride cycle. Tellus 1990, 42, 254–262. [Google Scholar] [CrossRef]
- Mahowald, N.; Jickells, T.D.; Baker, A.R.; Artaxo, P.; Benitez-Nelson, C.R.; Bergametti, G.; Bond, T.C.; Chen, Y.; Cohen, D.D.; Herut, B.; et al. Global distribution of atmospheric phosphorus sources, concentrations and deposition rates, and anthropogenic impacts. Glob. Biogeochem. Cycles 2008, 22, 1–19. [Google Scholar] [CrossRef] [Green Version]
- Alleman, L.; Lamaison, L.; Perdrix, E.; Robache, A.; Galloo, J.-C. PM10 metal concentrations and source identification using positive matrix factorization and wind sectoring in a French industrial zone. Atmos. Res. 2010, 96, 612–625. [Google Scholar] [CrossRef]
- Letter, C.; Jäger, G. Simulating the potential of trees to reduce particulate matter pollution in urban areas throughout the year. Environ. Dev. Sustain. 2019, 22, 4311–4321. [Google Scholar] [CrossRef] [Green Version]
- Chen, L.; Liu, C.; Zhang, L.; Zou, R.; Zhang, Z. Variation in Tree Species Ability to Capture and Retain Air-borne Fine Particulate Matter (PM2.5). Sci. Rep. 2017, 7, 32006. [Google Scholar]
- Munir, S.; Habeebullah, T.M.; Seroji, A.R.; Gabr, S.S.; Mohammed, A.M.; Morsy, E.A. Quantifying temporal trends of atmospheric pollutants in Makkah (1997–2012). Atmos. Environ. 2013, 77, 647–655. [Google Scholar] [CrossRef]
- Barisione, M. Electric Vehicles and Air Pollution: The Claims and The Facts. Clean Air-Analysis & Opinion. 2021. Available online: https://epha.org/electric-vehicles-and-air-pollution-the-claims-and-the-facts/ (accessed on 18 December 2021).
- Carnevale, C.; DeAngelis, E.; Finzi, G.; Turrini, E.; Volta, M. Evaluating economic and health impacts of active mobility through an integrated assessment model. IFAC-PapersOnLine 2018, 51, 49–54. [Google Scholar] [CrossRef]
- Hart, K.M.; Pankow, J.F. Comparison of n-alkane and PAH concentrations collected on quartz fiber and Teflon membrane filters in an urban environment. J. Aerosol Sci. 1990, 21 (Suppl. S1), S377–S380. [Google Scholar] [CrossRef]
- Ligocki, M.P.; Pankow, J.F. Measurements of the gas/particle distributions of atmospheric organic compounds. Environ. Sci. Technol. 1989, 23, 75–83. [Google Scholar] [CrossRef]
- Klippel, W.; Warneck, P. The formaldehyde content of the atmospheric aerosol. Atmos. Environ. 1980, 14, 809–818. [Google Scholar] [CrossRef]


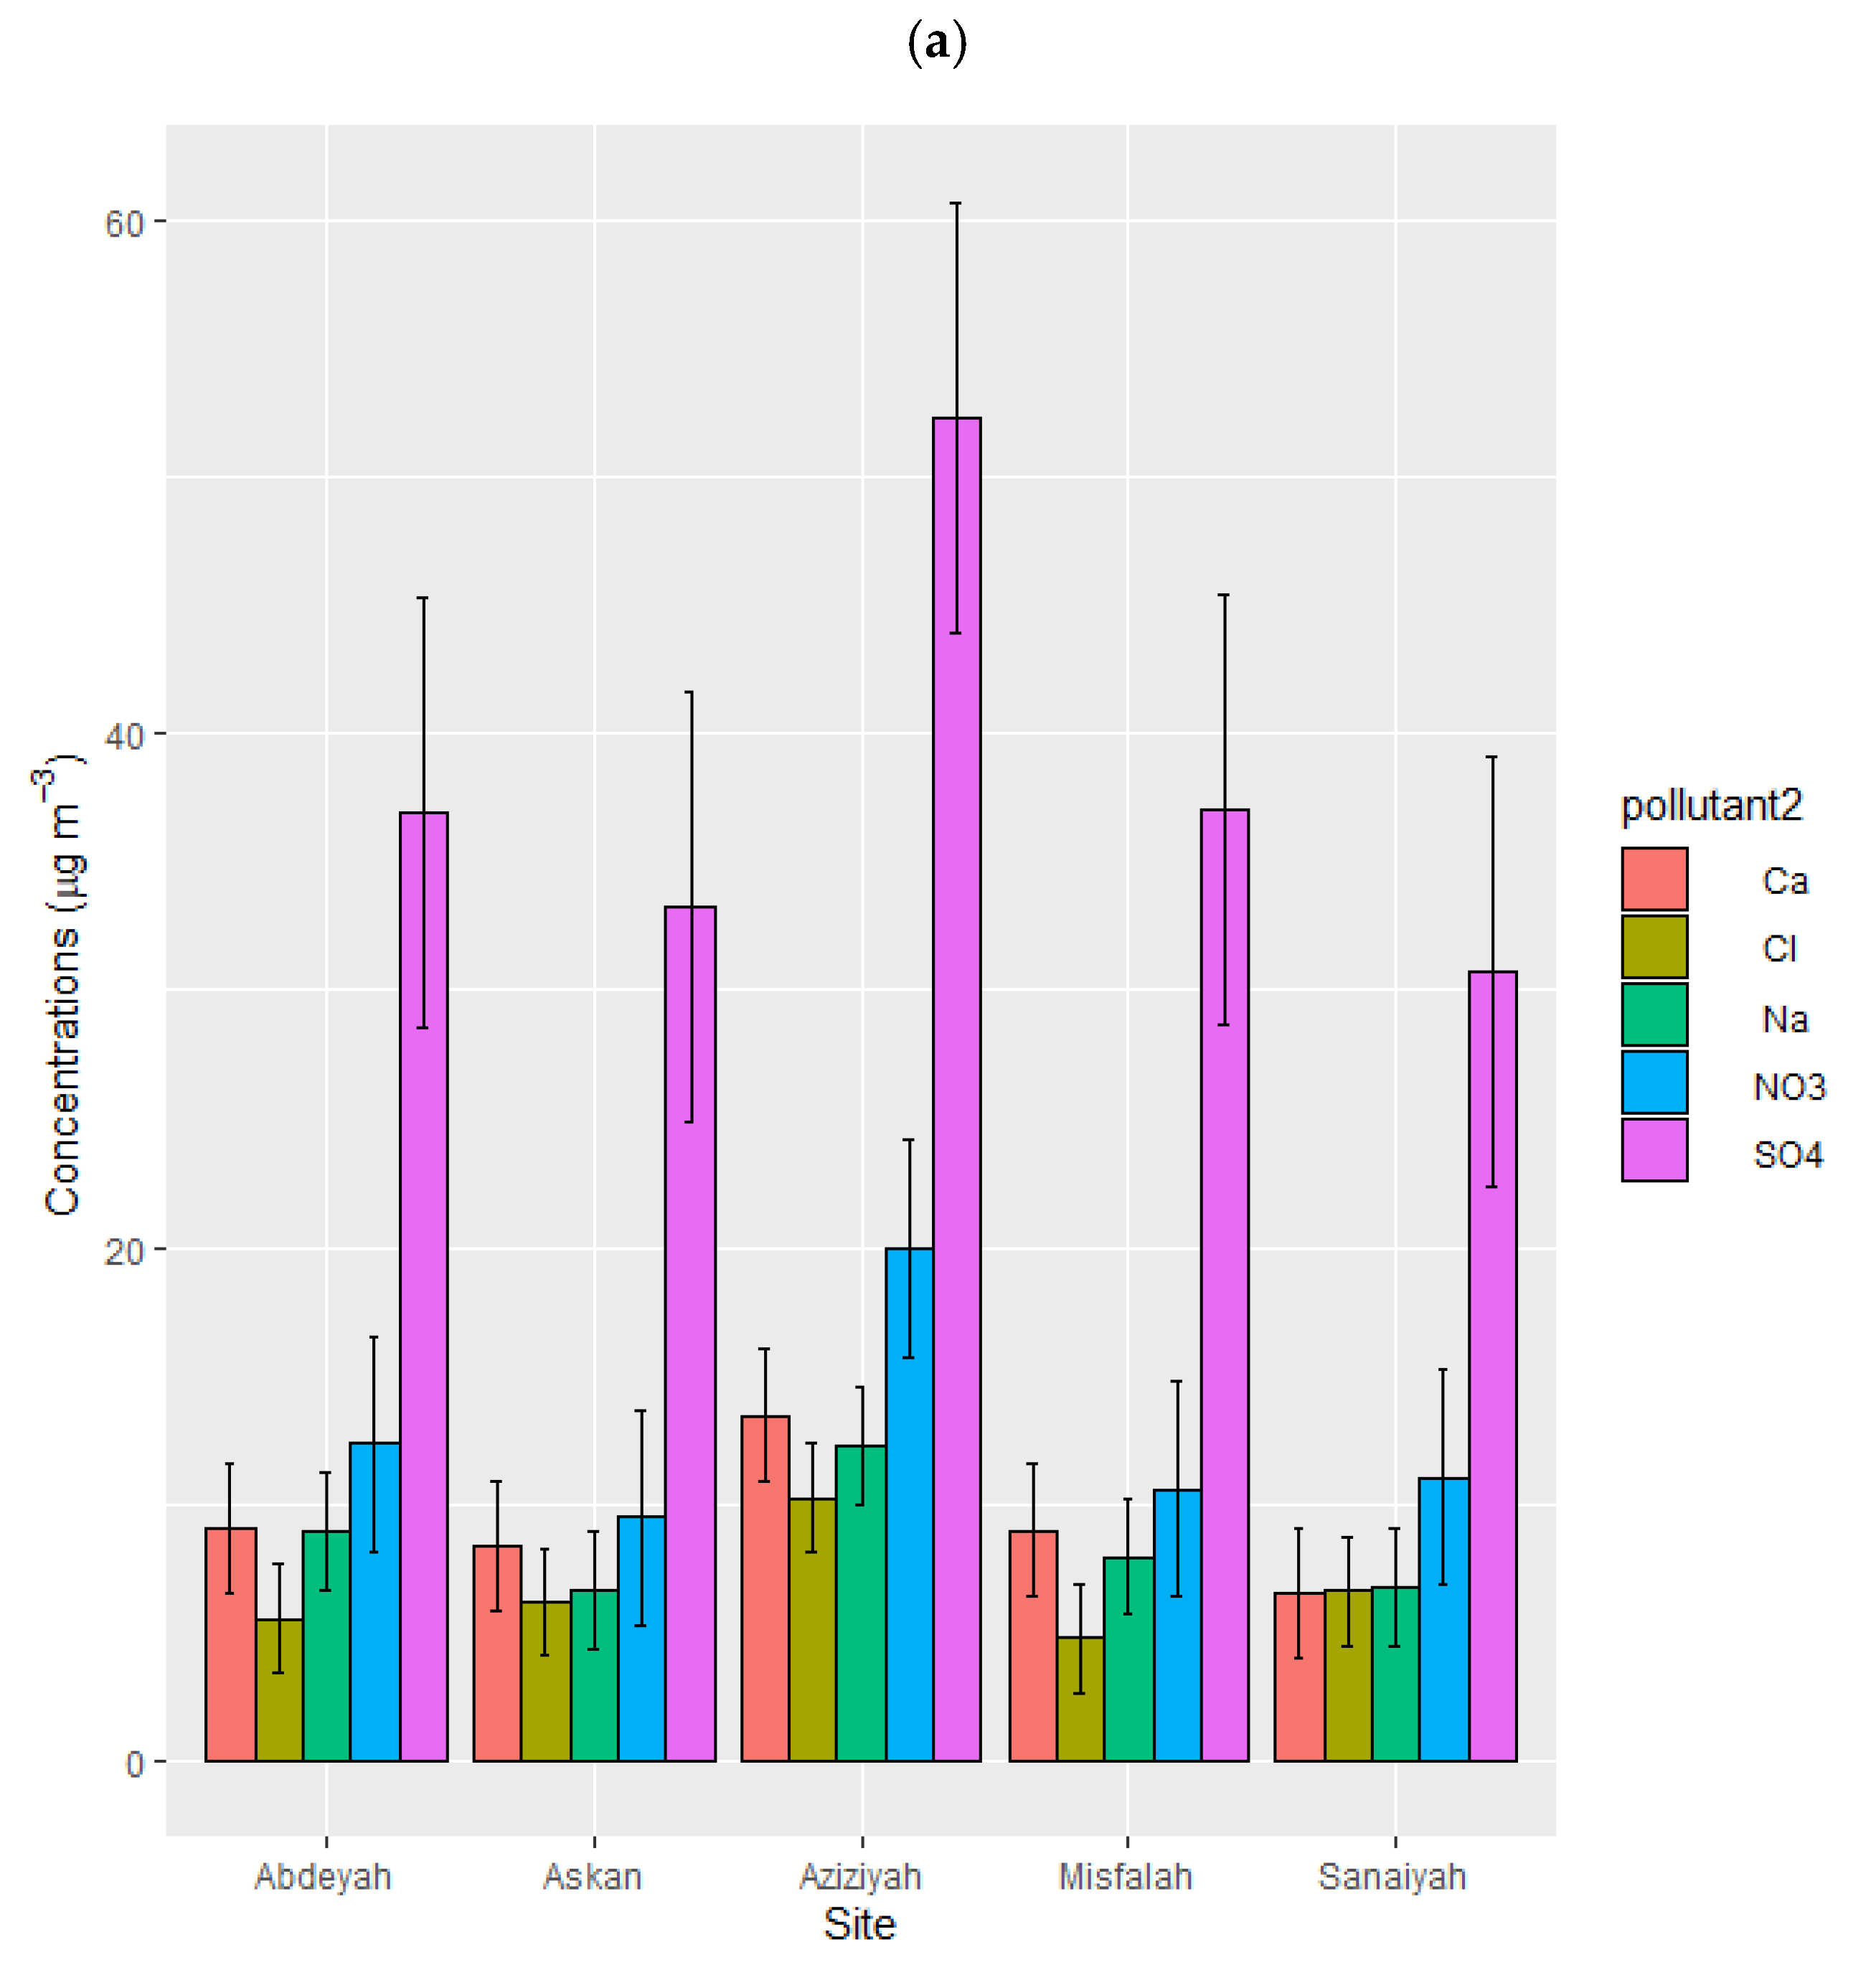
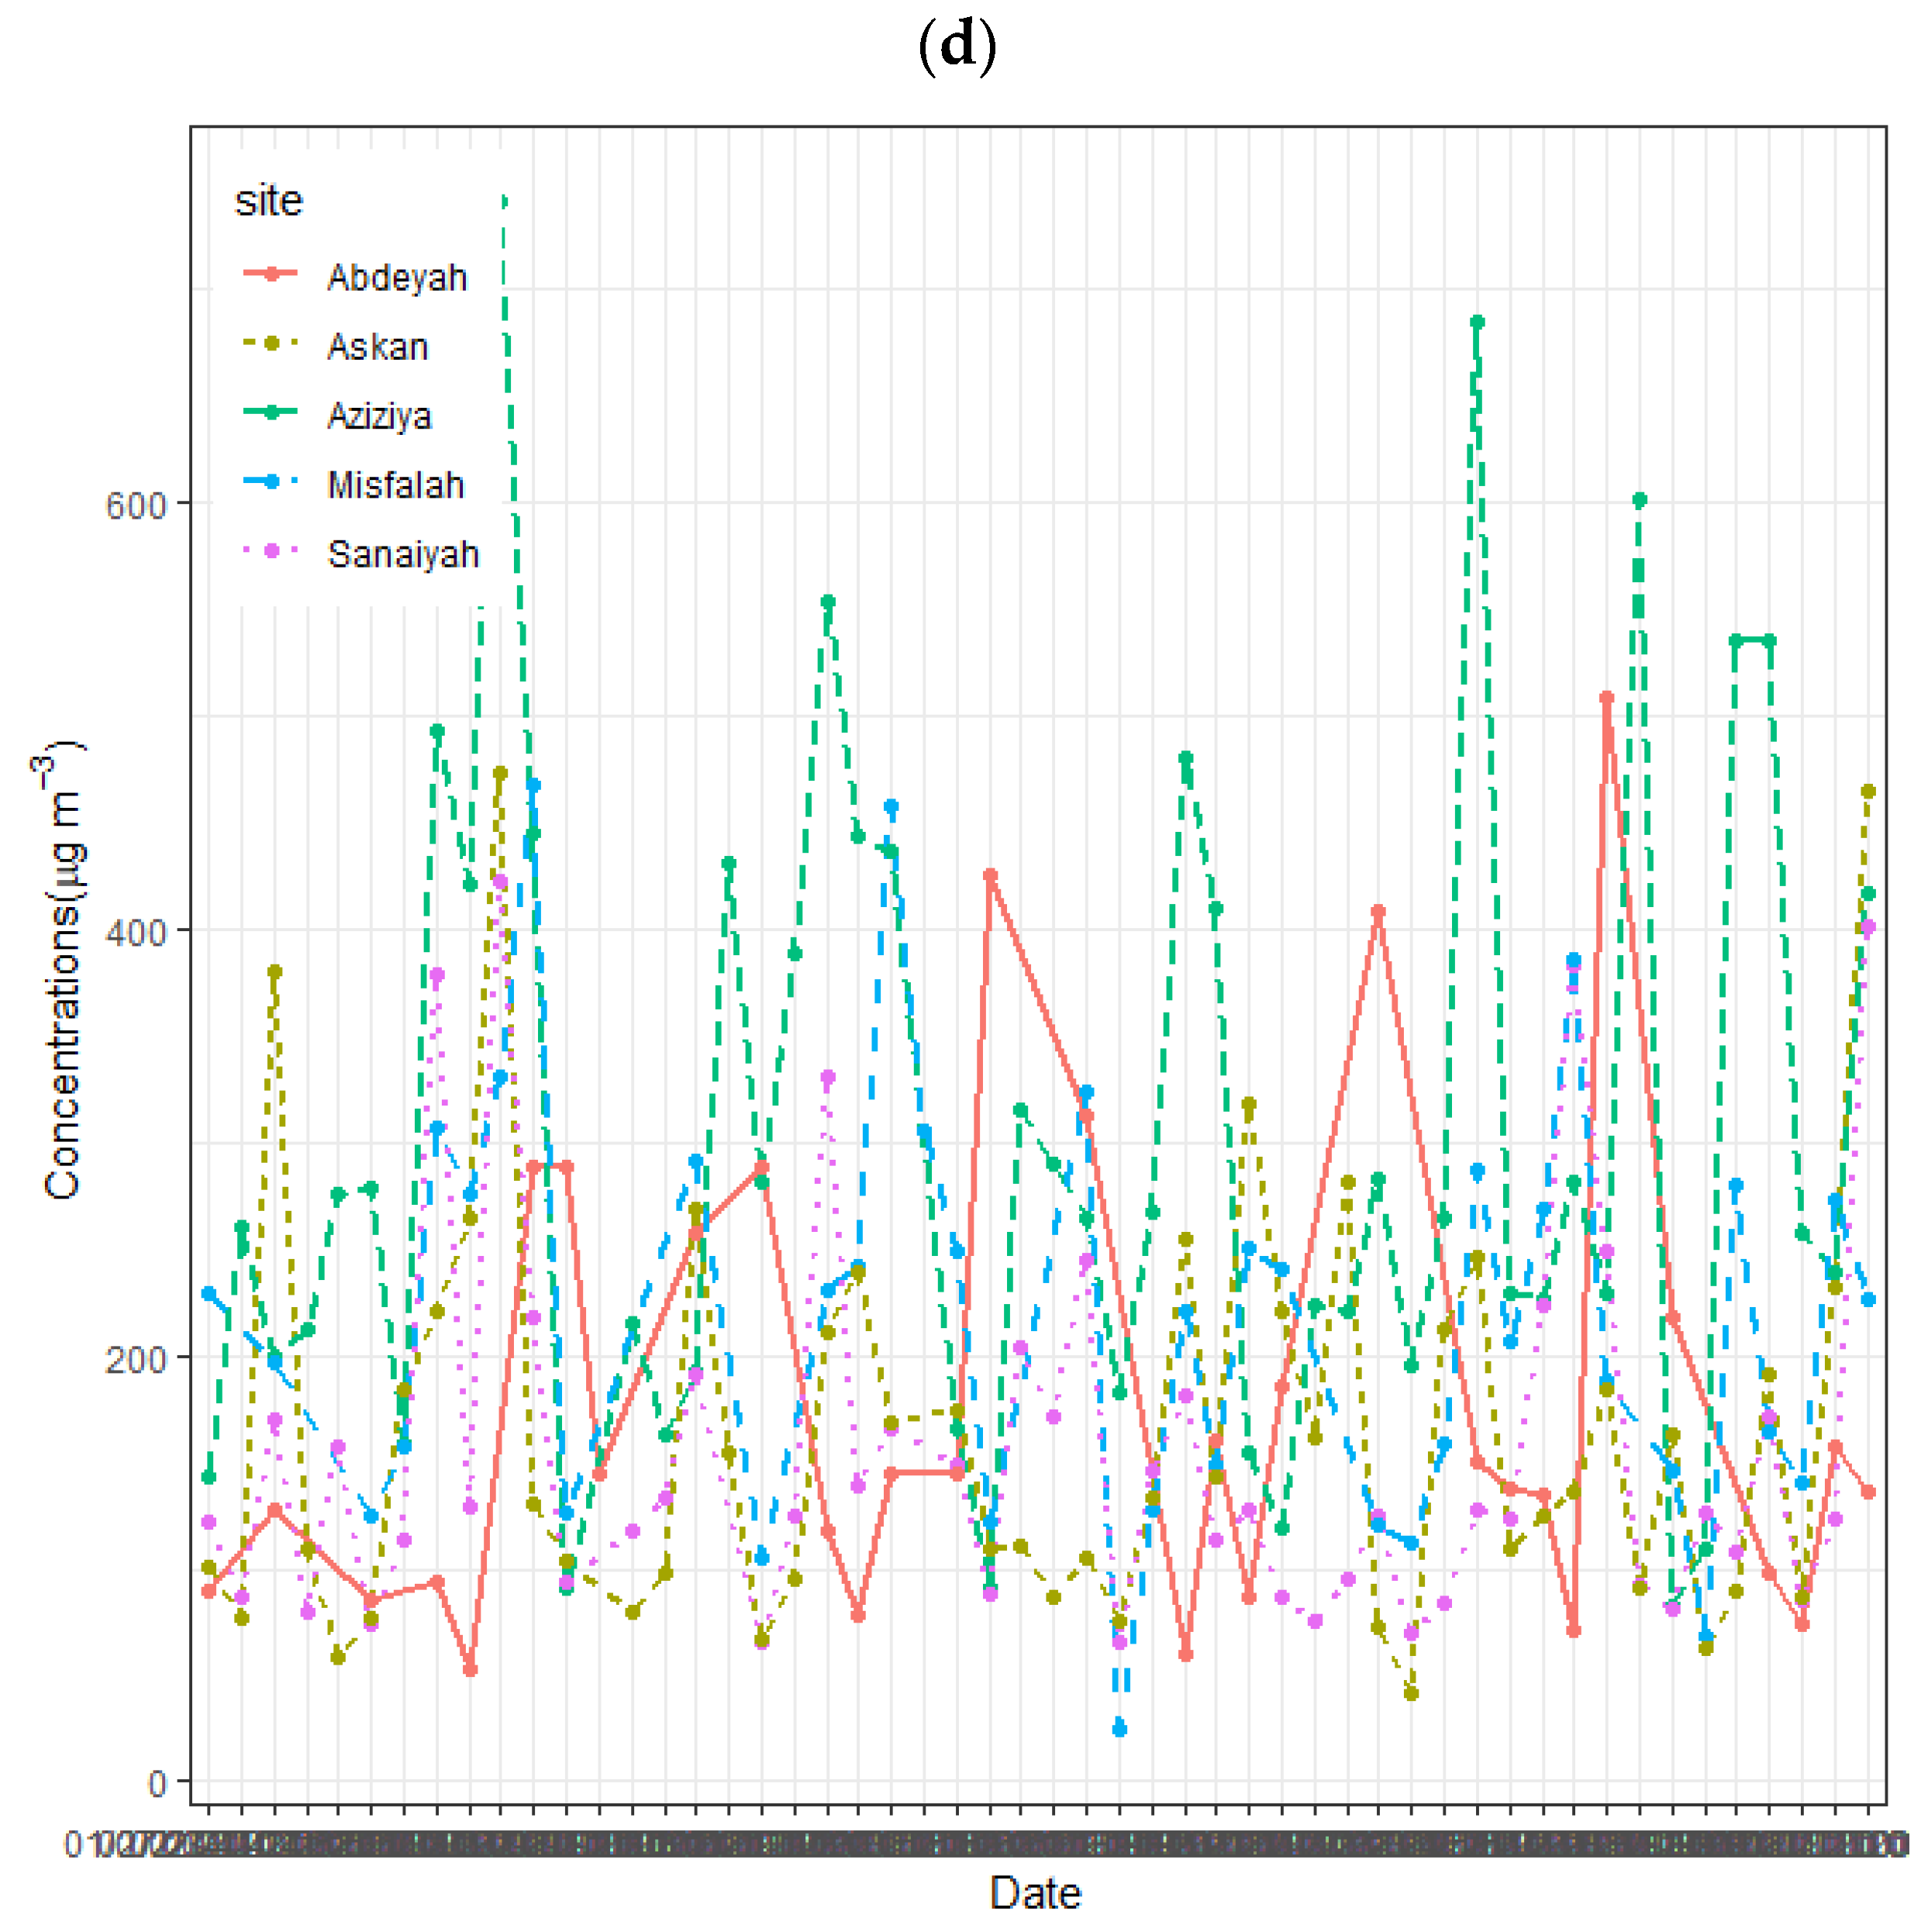
| Site | PM10 Conc. | Ions Conc. | % Contribution |
|---|---|---|---|
| Aziziyah | 303.18 ± 169.00 | 110.03 ± 31.61 | 36.29 ± 5.39 |
| Sanaiyah | 155.55 ± 24.57 | 62.42 ± 6.49 | 40.13 ± 8.81 |
| Misfalah | 219.7 ± 7.89 | 70.28 ± 7.69 | 31.99 ± 3.41 |
| Abdeyah | 177.99 ± 21.67 | 73.69 ± 6.03 | 41.40 ± 4.31 |
| Askan | 164.53 ± 81.53 | 64.60 ± 17.60 | 39.26 ± 4.07 |
| average | 204.19 ± 60.93 | 76.20 ± 13.89 | 37.81 ± 5.20 |
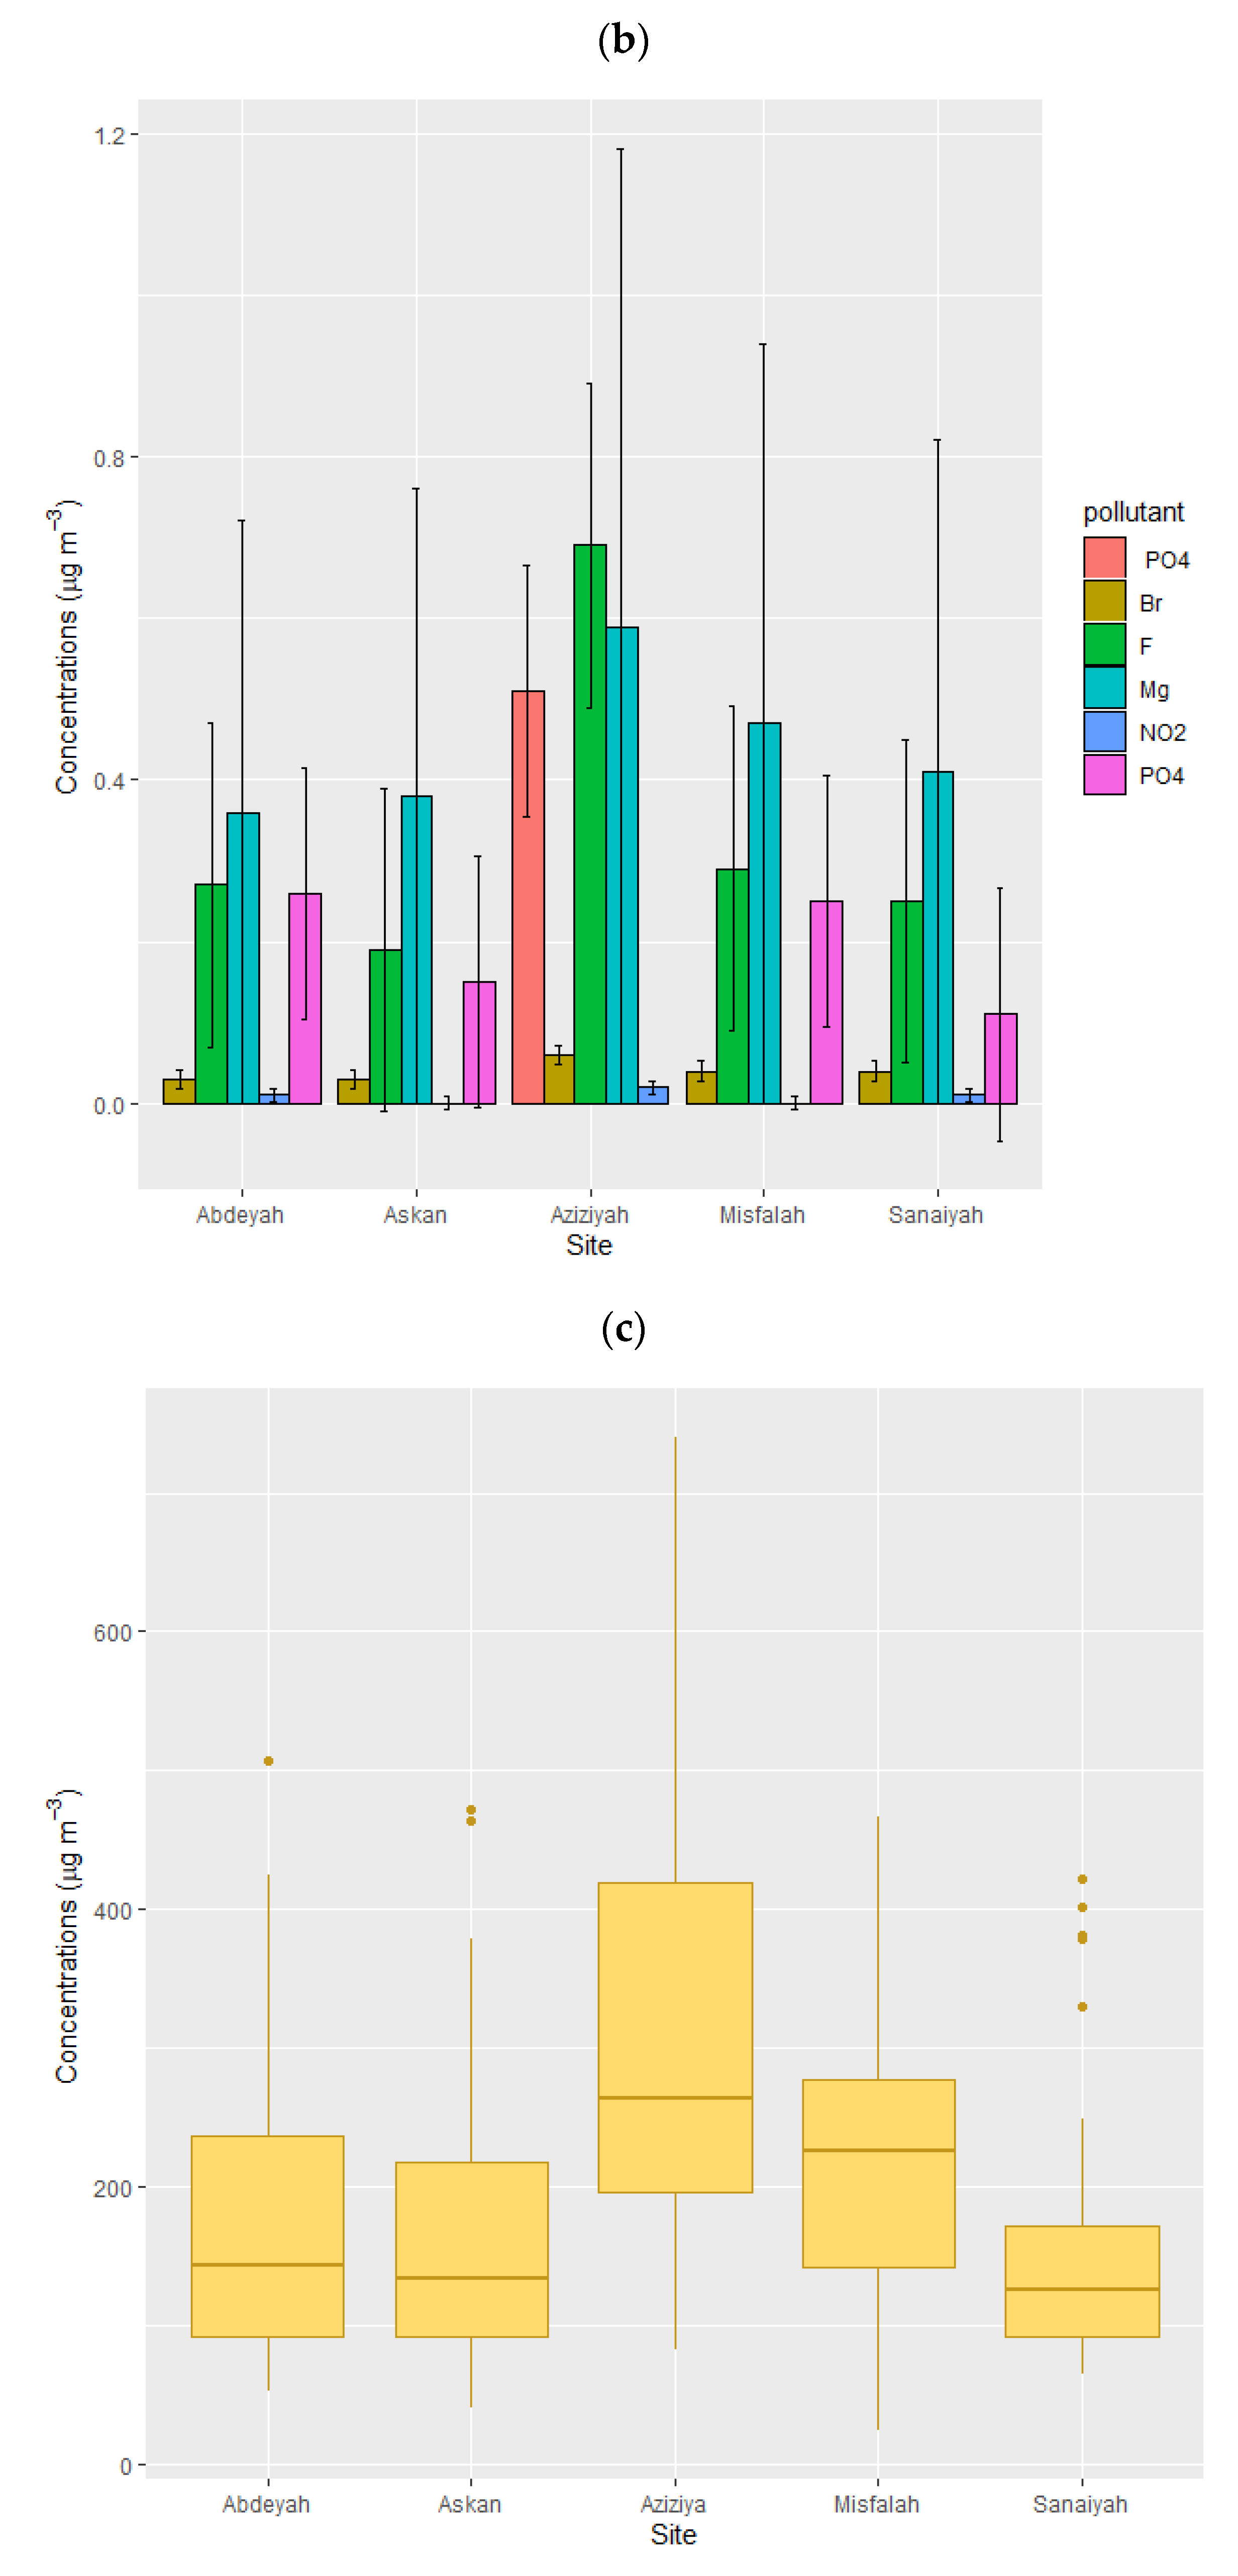
| Ions | Aziziyah | Sanaiyah | Misfalah | Abdeyah | Askan | Average |
|---|---|---|---|---|---|---|
| F− | 0.63 ± 0.47 | 0.40 ± 0.01 | 0.41 ± 0.20 | 0.37 ± 0.07 | 0.29 ± 0.02 | 0.42 ± 0.15 |
| Cl− | 9.28 ± 8.26 | 10.51 ± 0.54 | 6.73 ± 0.93 | 7.46 ± 0.26 | 9.52 ± 1.58 | 8.70 ± 2.31 |
| NO2− | 0.02 ± 0.01 | 0.02 ± 0.01 | 0.01 ± 0.01 | 0.01 ± 0.01 | 0.01 ± 0.01 | 0.01 ± 0.01 |
| Br− | 0.05 ± 0.03 | 0.06 ± 0.01 | 0.06 ± 0.04 | 0.04 ± 0.01 | 0.05 ± 0.01 | 0.05 ± 0.02 |
| NO3− | 18.13 ± 5.11 | 17.67 ± 6.40 | 15.03 ± 0.91 | 16.75 ± 1.49 | 14.60 ± 2.59 | 16.43 ± 3.30 |
| PO43− | 0.46 ± 0.19 | 0.18 ± 0.03 | 0.36 ± 0.04 | 0.35 ± 0.05 | 0.23 ± 0.01 | 0.32 ± 0.06 |
| SO42− | 47.55 ± 10.23 | 49.26 ± 0.30 | 52.73 ± 2.19 | 50.13 ± 1.54 | 51.56 ± 10.72 | 50.25 ± 5.00 |
| Na+ | 11.12 ± 3.02 | 10.78 ± 0.40 | 11.28 ± 5.62 | 12.16 ± 4.55 | 10.28 ± 0.16 | 11.12 ± 2.75 |
| Ca2+ | 12.22 ± 4.21 | 10.46 ± 0.35 | 12.73 ± 1.79 | 12.24 ± 1.64 | 12.88 ± 2.79 | 12.11 ± 2.16 |
| Mg2+ | 0.54 ± 0.09 | 0.66 ± 0.05 | 0.67 ± 0.06 | 0.49 ± 0.03 | 0.59 ± 0.07 | 0.59 ± 0.06 |
| Aziziyah | Sanaiyah | |||||||
|---|---|---|---|---|---|---|---|---|
| Metrics | PC1 | PC2 | PC3 | PC4 | PC1 | PC2 | PC3 | PC4 |
| Eigenvalue | 2.82 | 0.97 | 0.79 | 0.68 | 2.83 | 0.99 | 0.94 | 0.59 |
| % Variance | 0.72 | 0.09 | 0.06 | 0.04 | 0.73 | 0.09 | 0.08 | 0.03 |
| % Cumulative variance | 0.72 | 0.81 | 0.87 | 0.91 | 0.73 | 0.82 | 0.90 | 0.93 |
| Misfalah | Abdeyah | |||||||
| Metrics | PC1 | PC2 | PC3 | PC4 | PC1 | PC2 | PC3 | PC4 |
| Eigenvalue | 2.51 | 1.06 | 0.94 | 0.93 | 3.03 | 0.99 | 0.58 | 0.52 |
| % Variance | 0.57 | 0.10 | 0.08 | 0.08 | 0.84 | 0.09 | 0.03 | 0.02 |
| % Cumulative variance | 0.57 | 0.68 | 0.76 | 0.84 | 0.84 | 0.93 | 0.96 | 0.98 |
| Askan | All Sites | |||||||
| Metrics | PC1 | PC2 | PC3 | PC4 | PC1 | PC2 | PC3 | PC4 |
| Eigenvalue | 2.87 | 1.06 | 0.84 | 0.50 | 2.78 | 0.94 | 0.86 | 0.69 |
| % Variance | 0.75 | 0.10 | 0.06 | 0.02 | 0.70 | 0.08 | 0.07 | 0.04 |
| % Cumulative variance | 0.75 | 0.85 | 0.92 | 0.94 | 0.70 | 0.78 | 0.85 | 0.89 |
| PC1 | PC2 | PC3 | PC4 | |
|---|---|---|---|---|
| Variables contributing positively to each PC | F−, Cl−, NO2−, Br−, NO3−, PO43−, SO42−, Na+, Ca2+, Mg2+ | Cl−, F−, Na+ Ca2+, Mg2+, PO43− | F−, SO42−, Ca2+, Mg2+ | Cl−, Br−, Mg2+, Na+ |
| Eigenvalue | 2.78 | 0.94 | 0.86 | 0.69 |
| % Variance | 0.70 | 0.08 | 0.07 | 0.04 |
| % Cumulative variance | 0.70 | 0.78 | 0.85 | 0.89 |
| Ions | PC1 | PC2 | PC3 | PC4 |
|---|---|---|---|---|
| F− | −0.31 | 0.42 | −0.13 | 0.16 |
| Cl− | −0.30 | 0.40 | 0.20 | −0.63 |
| NO2− | −0.28 | 0.50 | 0.00 | 0.58 |
| Br− | −0.23 | −0.17 | 0.90 | 0.21 |
| NO3− | −0.34 | −0.20 | 0.03 | −0.10 |
| PO43− | −0.33 | −0.29 | −0.08 | −0.24 |
| SO42− | −0.34 | −0.02 | −0.28 | −0.02 |
| Na+ | −0.29 | −0.50 | −0.21 | 0.33 |
| Ca2+ | −0.36 | −0.09 | −0.05 | −0.03 |
| Mg2+ | −0.36 | −0.01 | −0.10 | −0.10 |
Publisher’s Note: MDPI stays neutral with regard to jurisdictional claims in published maps and institutional affiliations. |
© 2022 by the authors. Licensee MDPI, Basel, Switzerland. This article is an open access article distributed under the terms and conditions of the Creative Commons Attribution (CC BY) license (https://creativecommons.org/licenses/by/4.0/).
Share and Cite
Habeebullah, T.M.; Munir, S.; Zeb, J.; Morsy, E.A. Analysis and Sources Identification of Atmospheric PM10 and Its Cation and Anion Contents in Makkah, Saudi Arabia. Atmosphere 2022, 13, 87. https://0-doi-org.brum.beds.ac.uk/10.3390/atmos13010087
Habeebullah TM, Munir S, Zeb J, Morsy EA. Analysis and Sources Identification of Atmospheric PM10 and Its Cation and Anion Contents in Makkah, Saudi Arabia. Atmosphere. 2022; 13(1):87. https://0-doi-org.brum.beds.ac.uk/10.3390/atmos13010087
Chicago/Turabian StyleHabeebullah, Turki M., Said Munir, Jahan Zeb, and Essam A. Morsy. 2022. "Analysis and Sources Identification of Atmospheric PM10 and Its Cation and Anion Contents in Makkah, Saudi Arabia" Atmosphere 13, no. 1: 87. https://0-doi-org.brum.beds.ac.uk/10.3390/atmos13010087