
Exploring the Impact of Planetary Boundary Layer Schemes on Rainfall Forecasts for Typhoon Mujigae, 2015


1
CMA-GDOU Joint Laboratory for Marine Meteorology, South China Sea Institute of Marine Meteorology, Guangdong Ocean University, Zhanjiang 524088, China
2
College of Ocean and Meteorology, Guangdong Ocean University, Zhanjiang 524088, China
3
Marine Meteorological Research Center, Shenzhen Institute, Guangdong Ocean University, Shenzhen 518120, China
*
Authors to whom correspondence should be addressed.
Atmosphere 2022, 13(2), 220; https://0-doi-org.brum.beds.ac.uk/10.3390/atmos13020220
Submission received: 15 November 2021
/
Revised: 5 January 2022
/
Accepted: 27 January 2022
/
Published: 28 January 2022
(This article belongs to the Special Issue Tropical Cyclone Evolution: Changes in Structure, Intensity, and Environmental Interactions)
Abstract
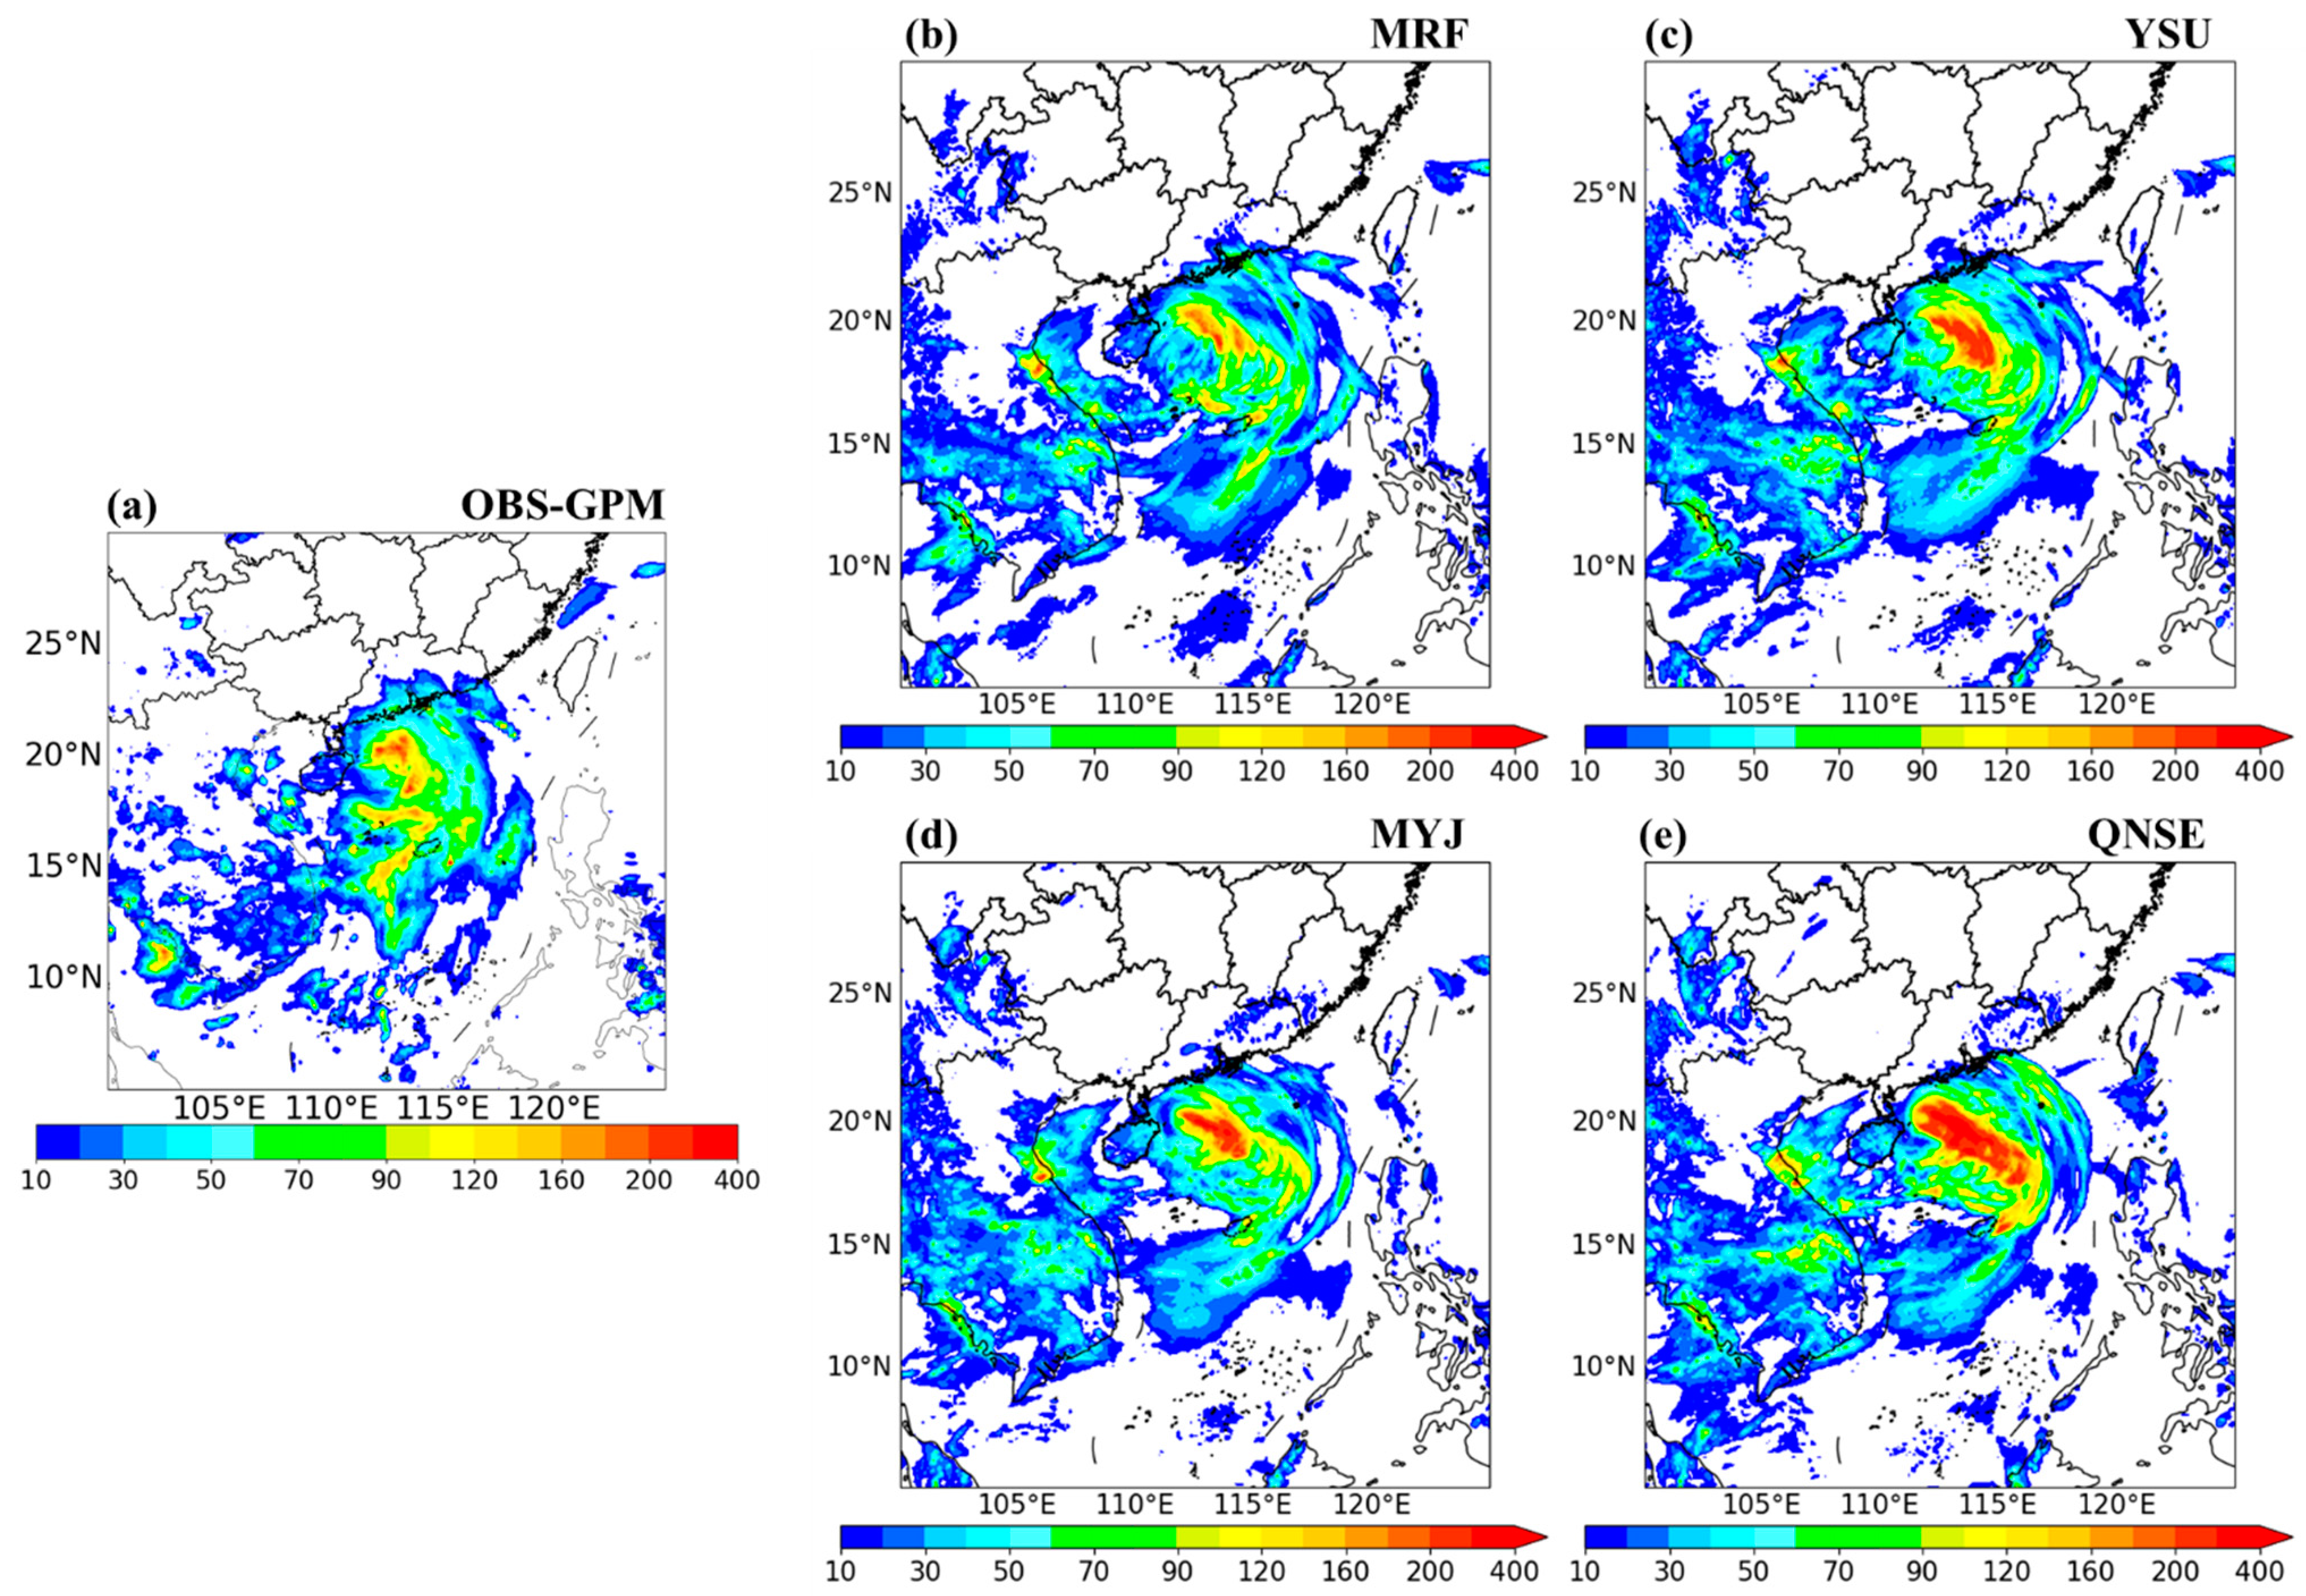
:Sensitivity experiments were conducted on Typhoon Mujigae, which occurred in 2015, wherein the Weather Research and Forecasting Advanced Research (WRF-ARW) model was used to select two local and two nonlocal planetary boundary layer (PBL) parameterization schemes: the quasi-normal scale elimination (QNSE) and Mellor–Yamada–Janjic (MYJ) schemes, and the Yonsei University (YSU) and medium-range forecast (MRF) schemes, respectively. The differences in rainfall response in the typhoon’s inner core and outer region were evaluated by comparing the anomaly rainfall distribution, heat transmission, and mixing processes in the boundary layer among the PBL schemes. The results show that the simulated rainfall in typhoon Mujigae has large uncertainty among the PBL schemes and a significant difference between the inner and outer regions. Compared with the observation, the simulated rainfall was significantly higher in the inner core and slightly lower in the outer region. All PBL schemes accurately identified the rainfall location, although the amounts differed between the schemes. The rainfall levels in the MRF scheme were closest to the observation, followed by those in the YSU and MYJ schemes; the QNSE scheme showed the largest deviation. In general, rainfall simulation using a nonlocal boundary layer scheme such as MRF had the best results for both the inner core and the outer region.
1. Introduction
A tropical cyclone (TC) is a deep system generated over tropical or subtropical ocean areas that contains a warm core structure. Extreme, disastrous weather accompanying cyclones leads to disasters such as floods and landslides, which pose a great threat to life and property as well as social productivity. In recent decades, many studies on typhoons have been conducted [1,2,3,4,5,6,7,8]. To explore the changes in TC structures, Li and Pu performed a numerical simulation experiment using the Weather Research and Forecasting (WRF) model [9]; they found that the early rapid intensification of Hurricane Emily was very sensitive to the selection of CM and PBL schemes in the WRF model. Using a regional climate model, Xi et al. found a significant positive correlation between the warm core temperature and the typhoon intensity; they determined that the cumulus parameterization scheme had a strong impact on the warm core structure of the simulated typhoon [10].
The planetary boundary layer (PBL) affects the exchange of physical parameters such as water vapor, heat, momentum transport, and friction between the underlying surface and the atmosphere, and provides the absolute angular momentum required by typhoons [11,12]. Therefore, the selection of the PBL scheme is very important in the numerical simulation of typhoons. The methods used to calculate the vortex diffusion coefficient differ between the various PBL schemes, resulting in differences in the simulated typhoon’s intensity and the wind field structure at the bottom of the inner core [13]. By studying Hurricane Earl, Zhang determined that a decrease in the diffusion rate of the vertical vortex in the boundary layer enhances the inflow and convergence, resulting in a stronger and more symmetrical convective system [14]. To understand the mechanism of Hurricane Katrina’s rapid intensification before landfall, Liu conducted several separate experiments using the Weather Research and Forecasting (WRF) model with the Mellor–Yamada–Janjic (MYJ) and Yonsei University (YSU) schemes; he found that the sea–air interaction was stronger in the MYJ scheme, owing to stronger surface flux and vertical mixing [15].
Naturally, the selection of the PBL parameterization scheme has an important impact on the path, intensity, and rainfall distribution in typhoon simulations. Braun and Tao used the Penn State–National Center for Atmospheric Research (NCAR) model (MM5) to investigate the differences between four types of PBL schemes—including medium-range forecast (MRF), Blackadar, Burk–Thompson, and bulk schemes—in the simulation of Hurricane Bob; he concluded that the rainfall sensitivity in a PBL scheme is essentially the same as that in a cloud microphysical parameterization scheme [16]. Dong compared the effects of several different PBL schemes in the simulation of Typhoon Fitow, which made landfall in southeastern China, and showed that the distribution of precipitation after landing differed between the PBL schemes [17]. Considering the results in the literature, we concur that the PBL scheme selection has a significant effect on the simulation of a typhoon’s rainfall, intensity, and movement. However, the results obtained from the different processing methods also differ for the flux calculation of momentum, heat, and water vapor. For example, the PBL schemes in the WRF-Advanced Research Weather (ARW) mesoscale model of the National Oceanic and Atmospheric Administration (NOAA) include local and nonlocal closure schemes, such as the MYJ and quasi-normal scale elimination (QNSE) schemes and the YSU and MRF schemes, respectively [18]; of these, the local closure schemes calculate the pulsating flux using only the variable or its gradient at each layer, and an unknown variable at any grid point is parameterized by the values of a known variable at the same grid point. In contrast, the nonlocal closure schemes parameterize the unknown quantity at one point in space with the known quantity values of other points [19,20]. Local closure schemes consider the interaction of parameters in the exchange of momentum, heat, and water vapor only between adjacent layers—i.e., local mixing—whereas nonlocal closure schemes add mixing processes involving the entire boundary layer. Local (nonlocal) closure schemes are suitable for stable (unstable) conditions [21].
Numerous studies using PBL schemes for the modeling and prediction of a typhoon’s track, intensity, and precipitation have been conducted. However, the precipitation induced by a typhoon is a complicated topic, because after or near the time of its landfall, extreme weather such as rainstorms and strong winds occur, with distinct differences between the outer region and the inner core of the typhoon [22,23,24]. Recently, Tu et al. used the WRF-ARW model to determine that the rain rates in the outer region and inner core of a typhoon have opposite trends, as confirmed by Tropical Rainfall Measuring Mission (TRMM) satellite observations [25]; they pointed out that the short-term prediction of the model failed in describing the circulation near the typhoon center well. Cumulus, microphysical, and PBL parameterization schemes are all sensitive to precipitation simulation; thus, a considerable amount of studies have been carried out to investigate the impact of these three parameterization schemes in simulating precipitation; among them, most of the research focuses on the performance of PBL schemes in simulating the track and intensity of typhoons, rather than precipitation, and it is unclear whether the PBL schemes have consistent performance in simulating precipitation in the inner core and outer region of typhoon. Thus, the present study seeks to determine the impact of PBL schemes on precipitation in a typhoon’s inner core and outer region. In particular, numerical experiments are conducted using different PBL schemes to assess the similarities and differences in the simulation of precipitation in the inner core and outer regions of Typhoon Mujigae, and their mechanisms are discussed. The article is arranged as follows: The second section provides information about Typhoon Mujigae, and the data and the experimental designs are introduced in the third section. The results and mechanisms are discussed in the fourth and fifth sections, respectively, and the summary and discussion are presented in the final section.
2. Case Review
Typhoon Mujigae formed as a tropical depression over the South China Sea, east of the Philippines, at 09:20 UTC on 1 October 2015. At 19:00 on the same day, the Japanese Meteorological Agency upgraded the depression to a tropical storm and named it Mujigae, international storm No. 1522. During the day on 3 October, Mujigae continued to absorb energy on the surface of the South China Sea, and the central pressure continued to decrease. At 06:00 on 4 October, Mujigae made landfall in Zhanjiang city, Guangdong Province, China, with a minimum central pressure of 935 hPa. The accumulated precipitation within 24 h was up to 400 mm (Figure 1a), which caused serious casualties and economic losses [26,27,28]. On 2 October 2015, the warm and humid air transported by the cross-equatorial flow and the southwest monsoon provided abundant water vapor for the development of Mujigae. Under the guidance of the southeast airflow of the subtropical high, Mujigae moved northwestward. At 22:00 on 3 October, the center of the South Asian High was located near 120° E, which corresponded to the upper level of Mujigae. This type of convergence and divergence at the bottom and upper levels of an anticyclone favors the formation of precipitation. Adequate water vapor with the intrusion of weak cold air at the bottom enabled Mujigae to further strengthen before making landfall.
3. Data and Experiment Design
3.1. Data
In this study, the National Center for Environmental Prediction Final Analysis (NCEP FNL) Operational Global Analysis data of the Global Forecast System (GFS) run by NOAA were used as the initial and boundary conditions in the WRF-ARW model on 1° × 1° grids. The data of the Integrated Multi-Satellite Retrievals for GPM (IMERG) Final Precipitation L3 Half-Hourly 0.1° × 0.1° V06 (GPM_3IMERGHH) of the National Aeronautics and Space Administration (NASA) Global Precipitation Measurement Mission (GPM) were used as the observed precipitation. The fifth-generation European Centre for Medium-Range Weather Forecasts (ECMWF) reanalysis (ERA5) data for global climate and weather were used to evaluate the performance in the simulation of sensible heat flux, latent heat flux, boundary layer height, and other variables, which were taken as the metrics. The best track observation dataset of the typhoon released by the Shanghai Typhoon Institute of the China Meteorological Administration (CMA) was adopted.
3.2. Experiment Design
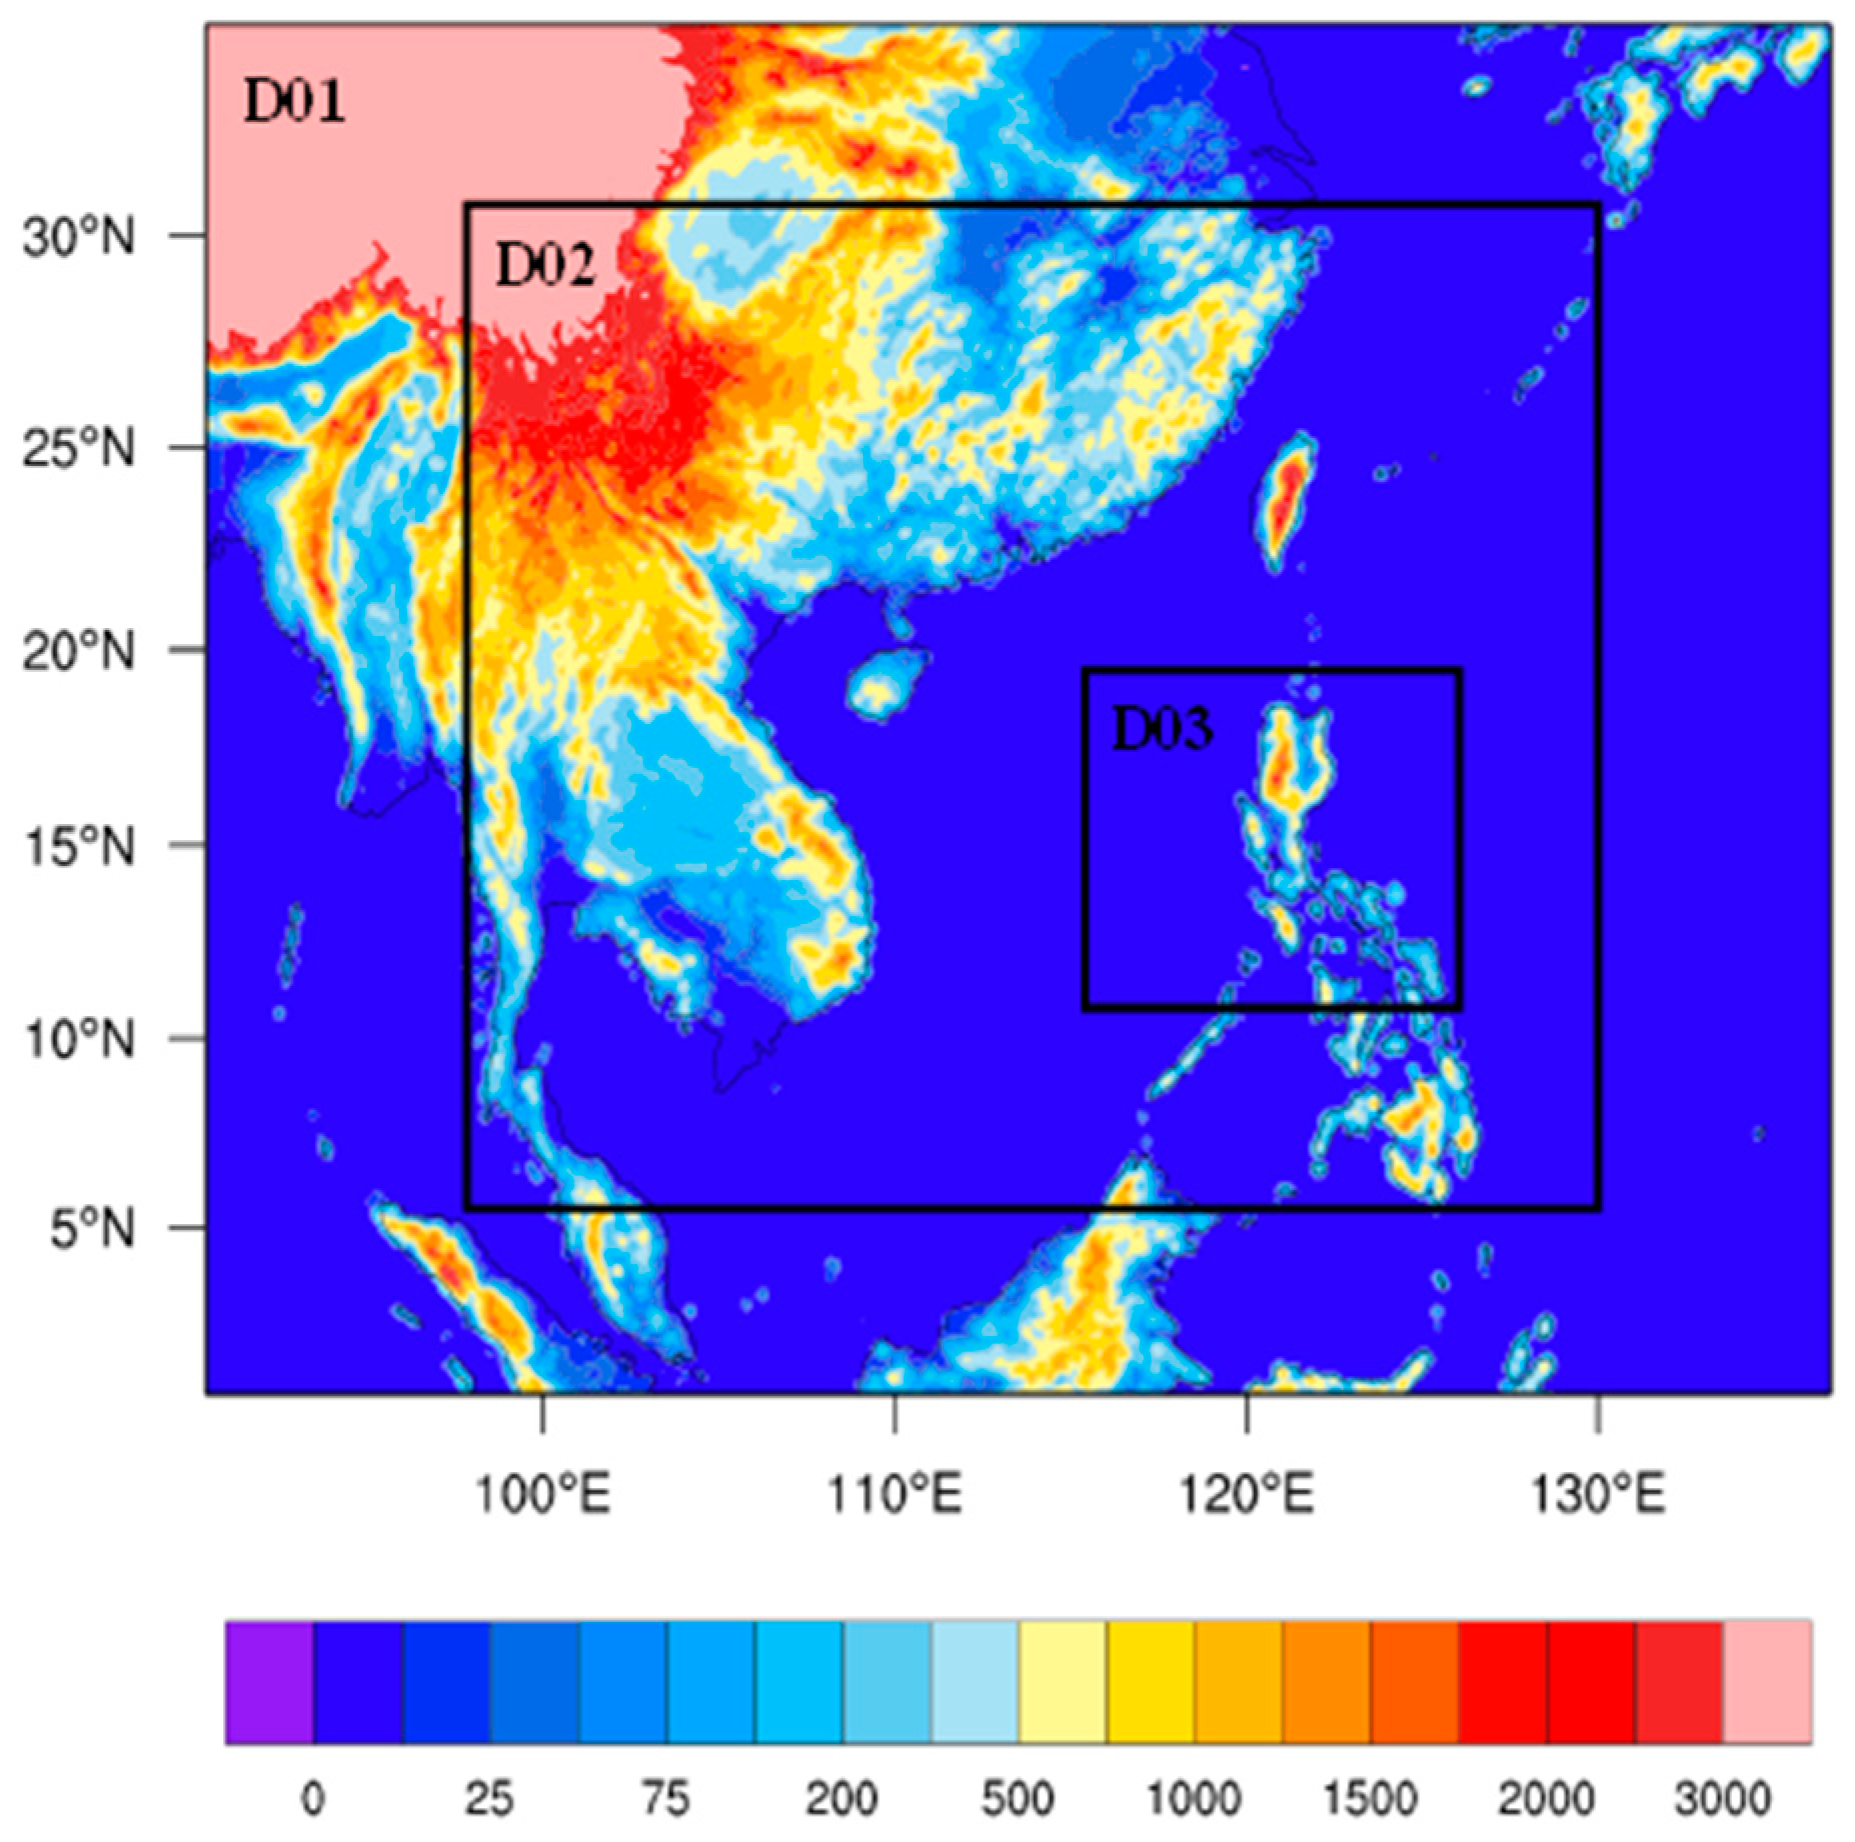
The model used in this study, WRF-ARW version 4.0.2, is a non-hydrostatic and fully compressible primitive equations model developed by the NCAR [18]. The triple-nested model domain is shown in Figure 2. The parent domain (D01) covers East Asia and the northwestern Pacific, with 408 × 323 horizontal grid points and a resolution of 12 km. The middle domain (D02), within southeastern China and part of the northwestern Pacific, has 832 × 721 horizontal grid points with a horizontal resolution of 4 km. The inner domain (D03)—the setting in which Mujigae formed and subsequently moved—contains 829 × 703 horizontal grid points with a resolution of 1.33 km. The model has 40 layers in the vertical direction, and the pressure at the top is 50 hPa. The physical parameterization scheme settings are detailed in Table 1. The simulation period was 72 h from 00:00 on 2 October to 00:00 on 5 October 2015, including the complete process of typhoon genesis, development, and landfall. To evaluate the effects of the different PBL schemes on the precipitation in the inner core and outer region of Mujigae, two nonlocal and two local closure schemes were selected to conduct sensitivity experiments: MRF [29] and YSU [30] schemes, and MYJ [31] and QNSE [32] schemes, respectively.
4. Results
4.1. Track and Intensity of Mujigae
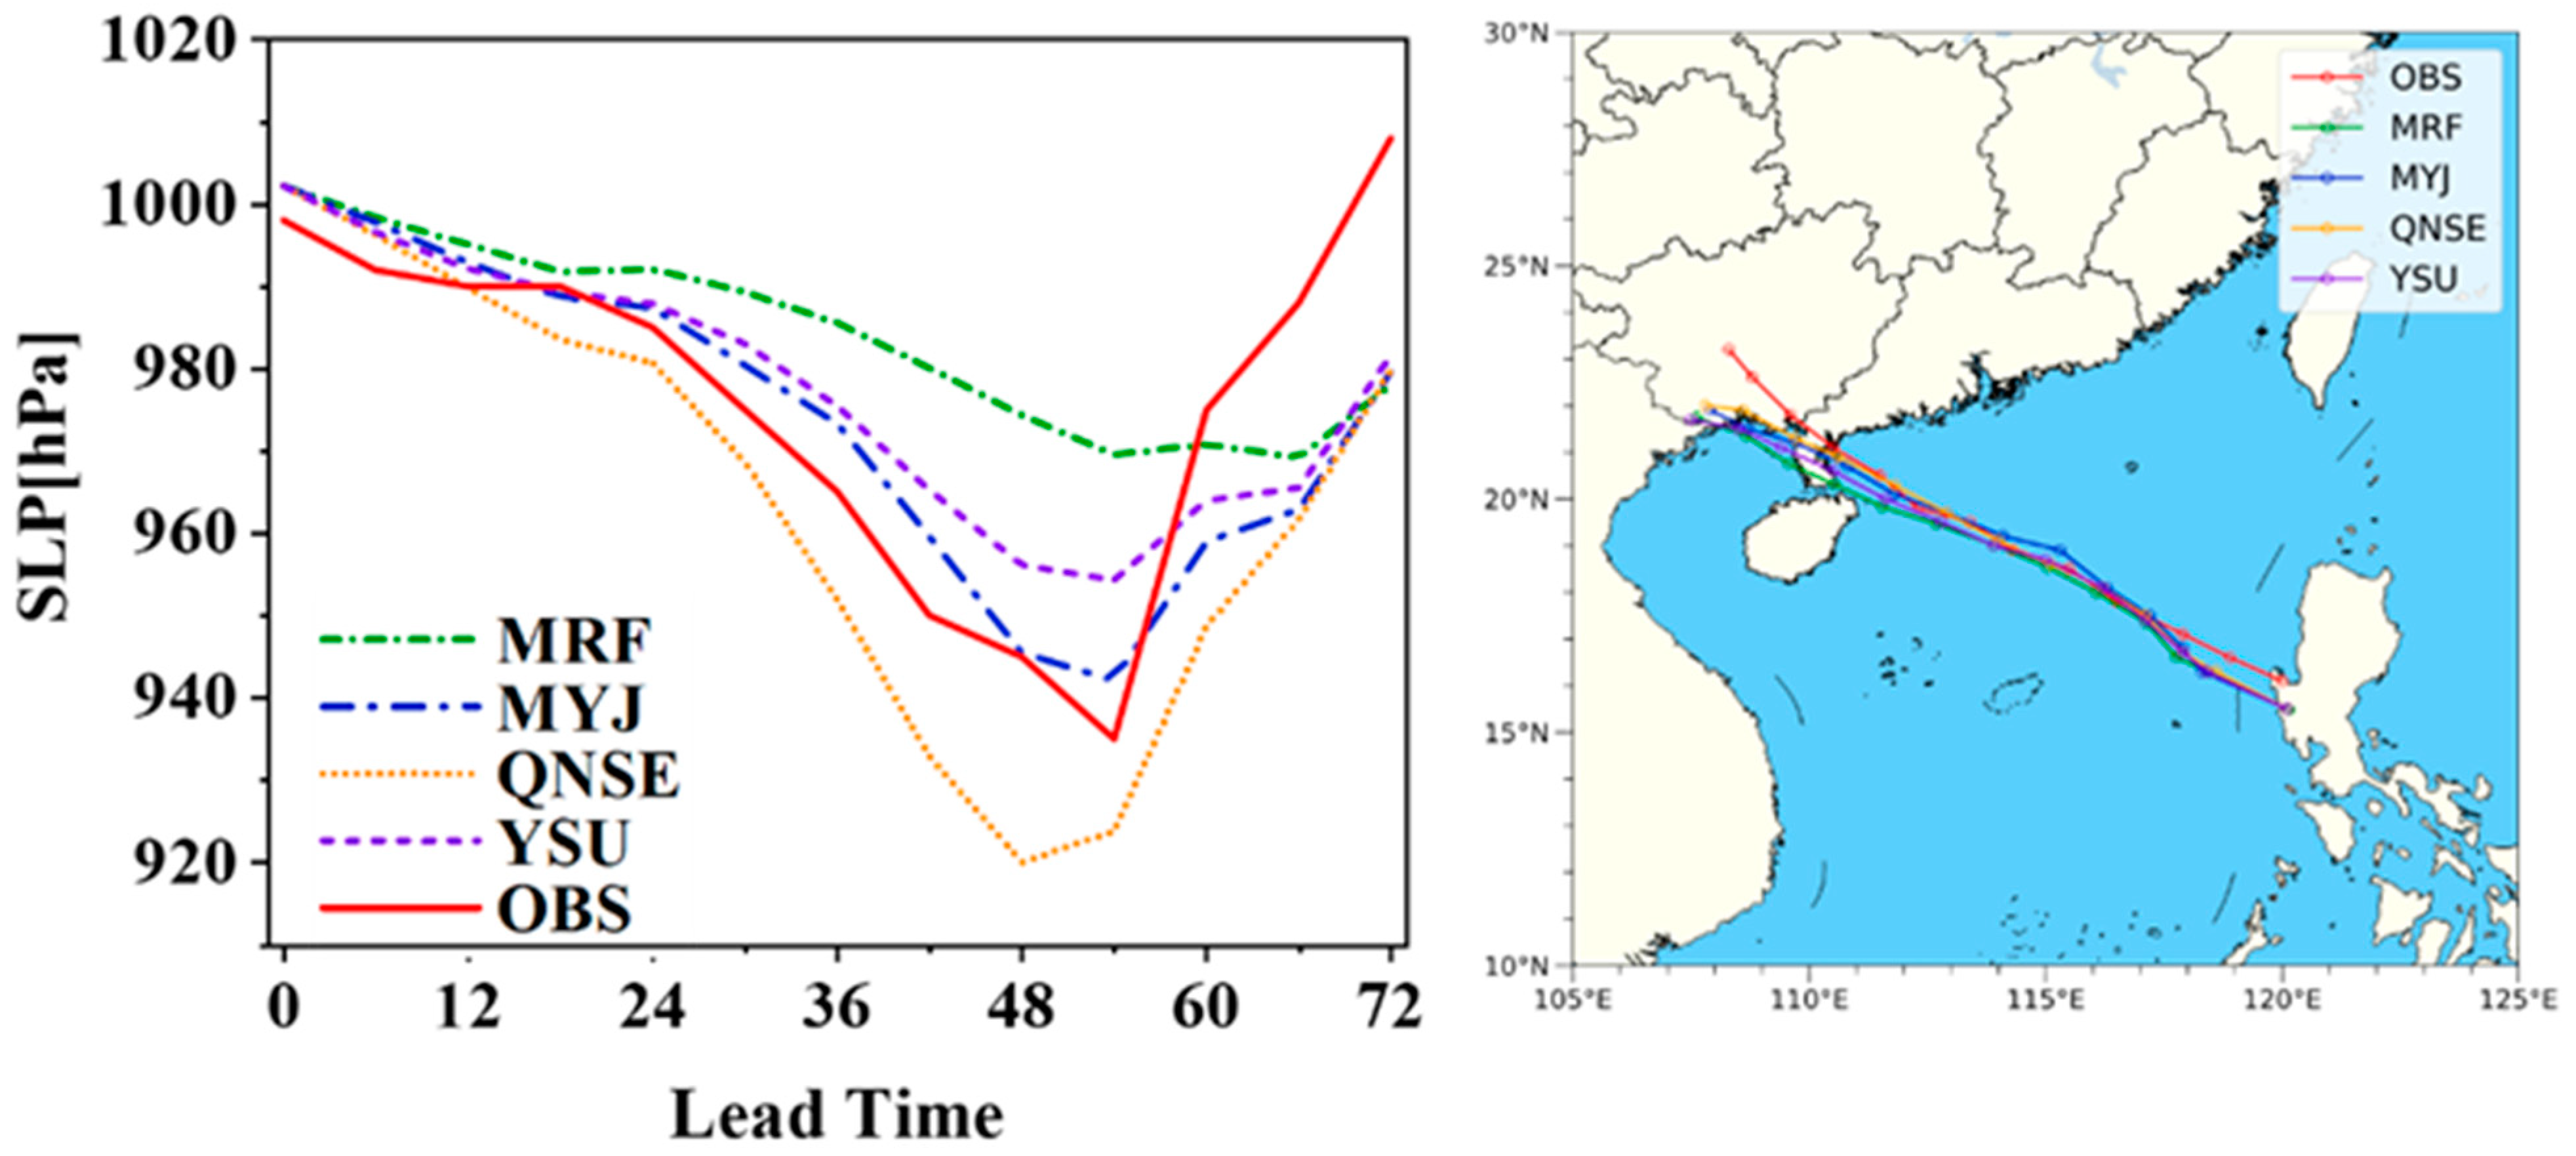
Figure 3 shows the changes in the minimum central pressure and track of Mujigae from 00:00 on 2 October to 00:00 on 5 October 2015. Each set of experiments was able to roughly simulate the evolution of Mujigae’s intensity. The smallest (largest) deviation was produced by the MYJ (QNSE) scheme. With the deviation within 25 hPa, the simulated intensity of the MYJ scheme was closest to the observation provided by the CMA. For the track simulation, all PBL schemes were able to capture the characteristics of Typhoon Mujigae moving northwestward. Although the landfall locations were all southwest of the observation, the discrepancies were small. The minimum track error was shown in the QNSE and MYJ schemes, which are both local closure schemes. These results show that all of the experiments successfully simulated the intensity and track of Mujigae, producing a solid foundation for the precipitation analysis.
4.2. Precipitation
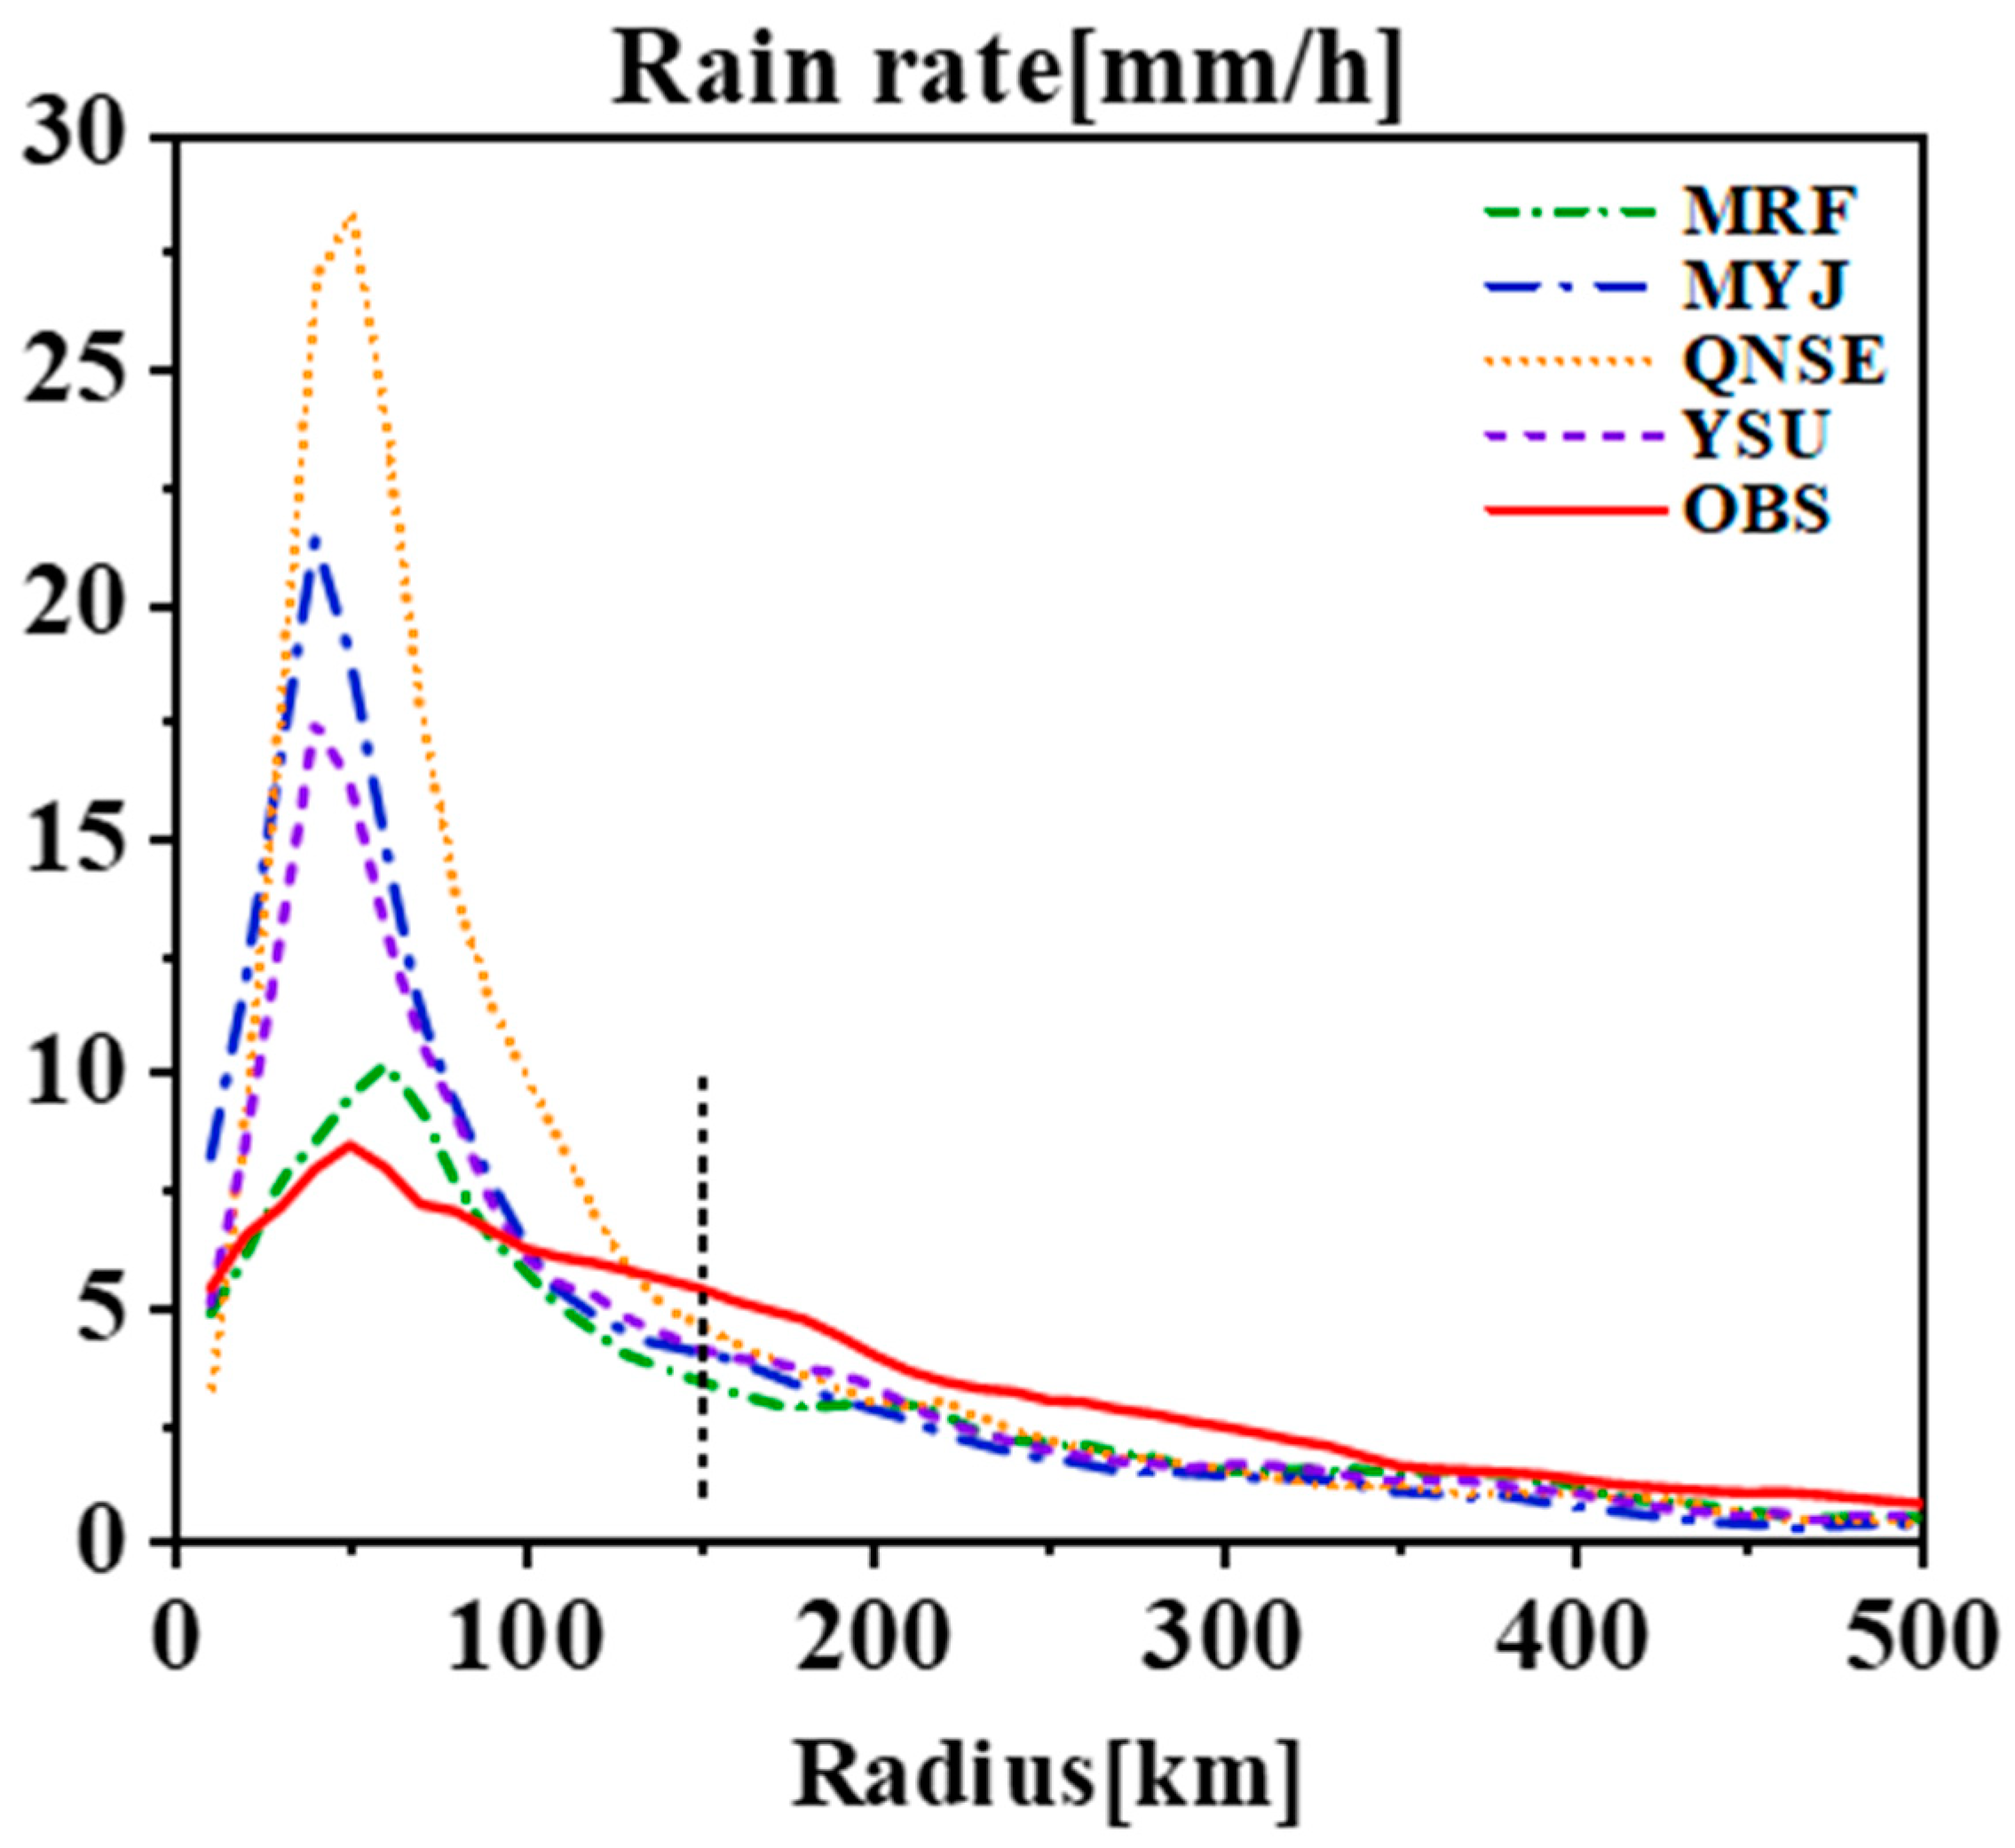
On the basis of our previous study [25], the inner core of a typhoon is defined as the region between the typhoon’s center and the position with the maximum radial gradient of the rain rate. According to this definition, the radius of the inner core for Typhoon Mujigae was ~150 km, and the outer region extended to 500 km. The horizontal distribution of precipitation simulated by each scheme was mainly consistent with the observations (Figure 1). The changes in the 72-h-averaged and azimuthally averaged rain rates with the radius of the typhoon (Figure 4) show that within the inner core, all of the simulated rain rates were higher than the observation. The QNSE scheme had the largest deviation, at ~20 mm/h, whereas the MRF scheme had the smallest, at ~3 mm/h. In contrast, all of the simulated rain rates in the outer region were lower than the observation. These results can be confirmed in Table 2, in which the values represent the differences between the simulated 72-h-averaged rain rates for each scheme and the GPM satellite observation values in the inner core and outer region.
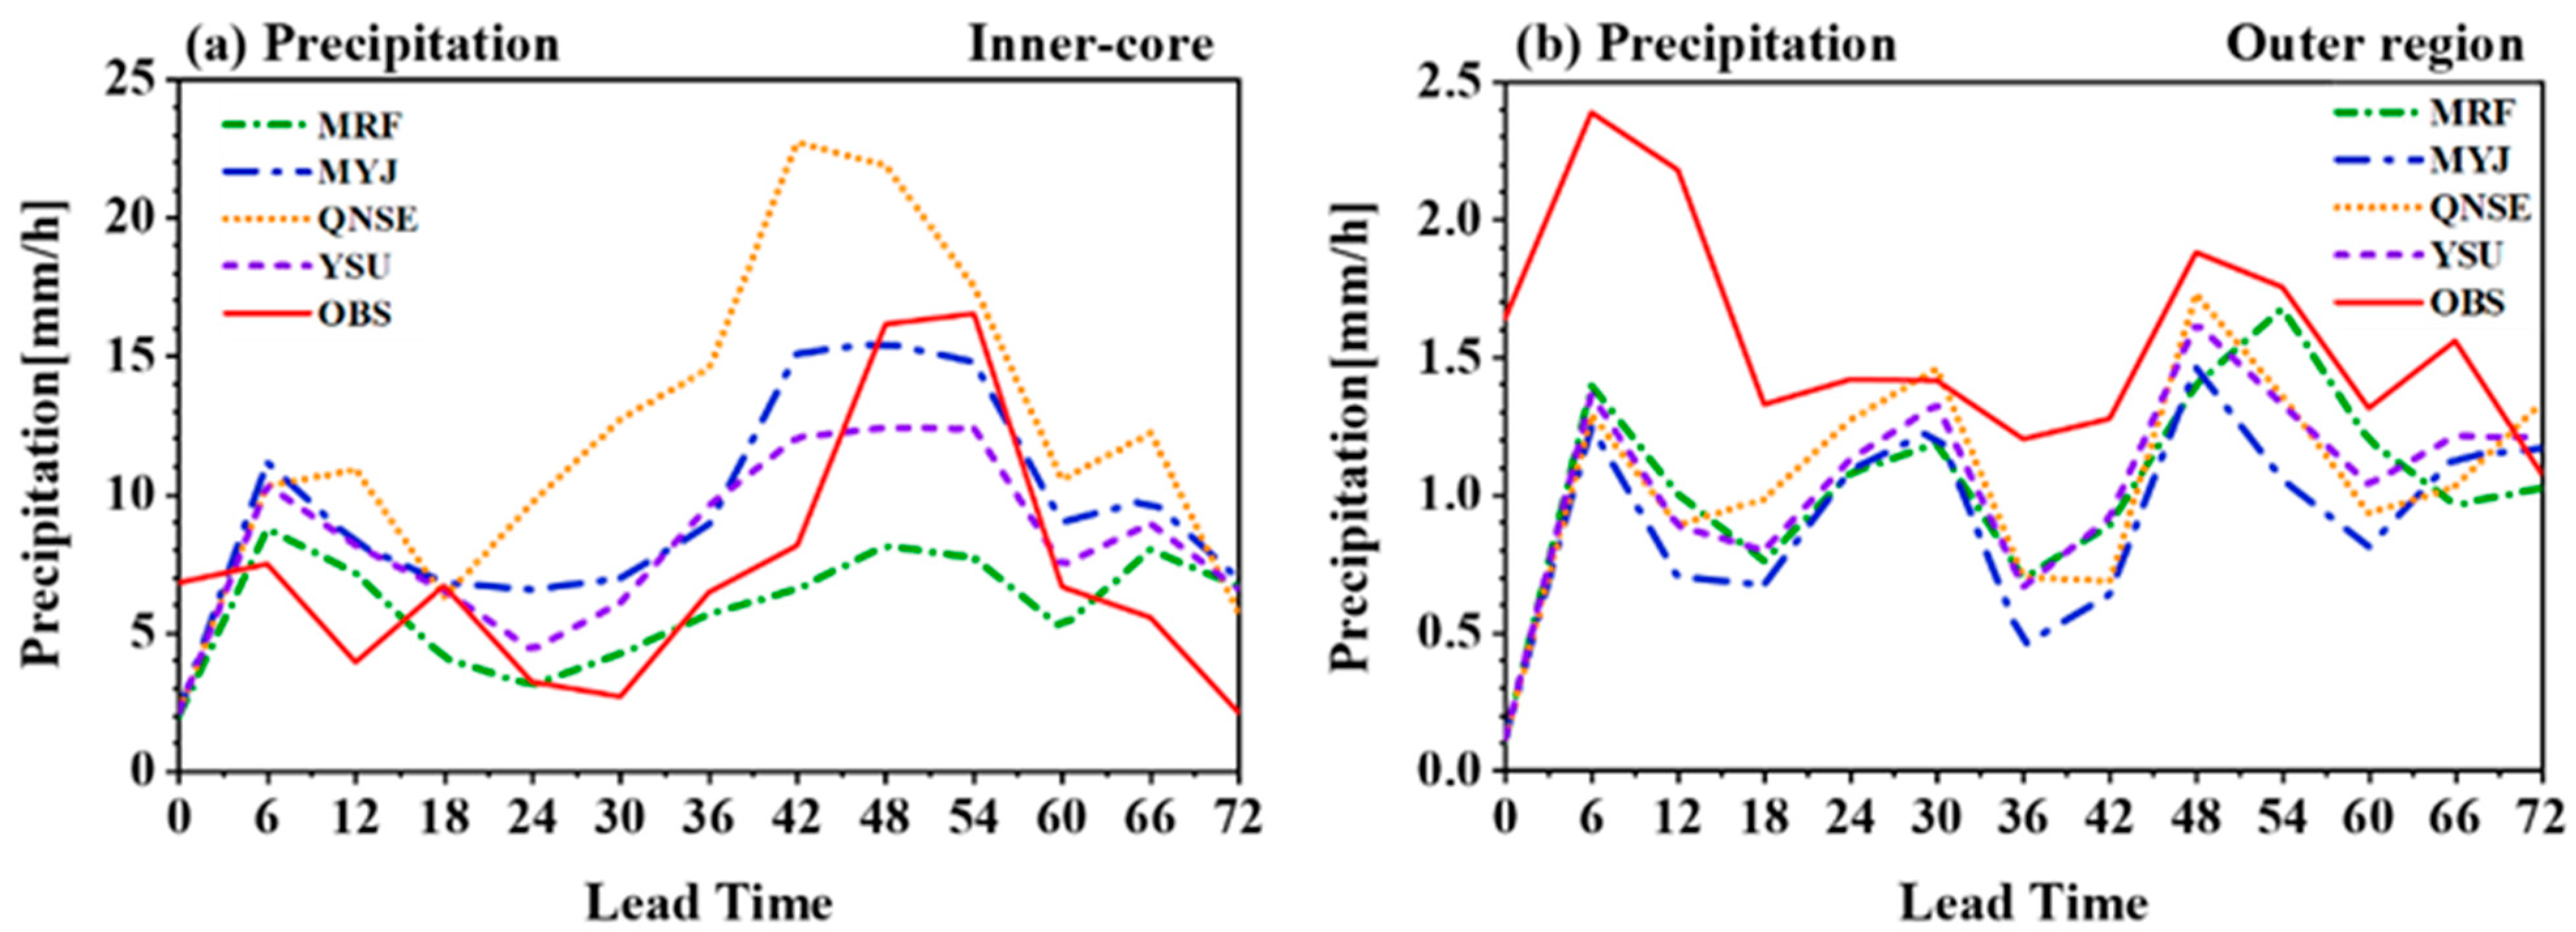
The time series of the rain rate within the 72 h period (Figure 5) shows that the largest rainfall, with a maximum rain rate of 21 mm/h, occurred in the QNSE scheme within the inner core (Figure 5a), although it occurred 6 h earlier than the actual typhoon landfall. The MRF scheme showed significantly lower rainfall, whereas the YSU and MYJ schemes showed maximum rainfall occurring slightly earlier than the observation. All of the schemes showed more rainfall than the observation after the typhoon made landfall. In the outer region (Figure 5b), all of the schemes showed similar rain rates, with lower amounts than the observation indicated at each step of the typhoon movement.
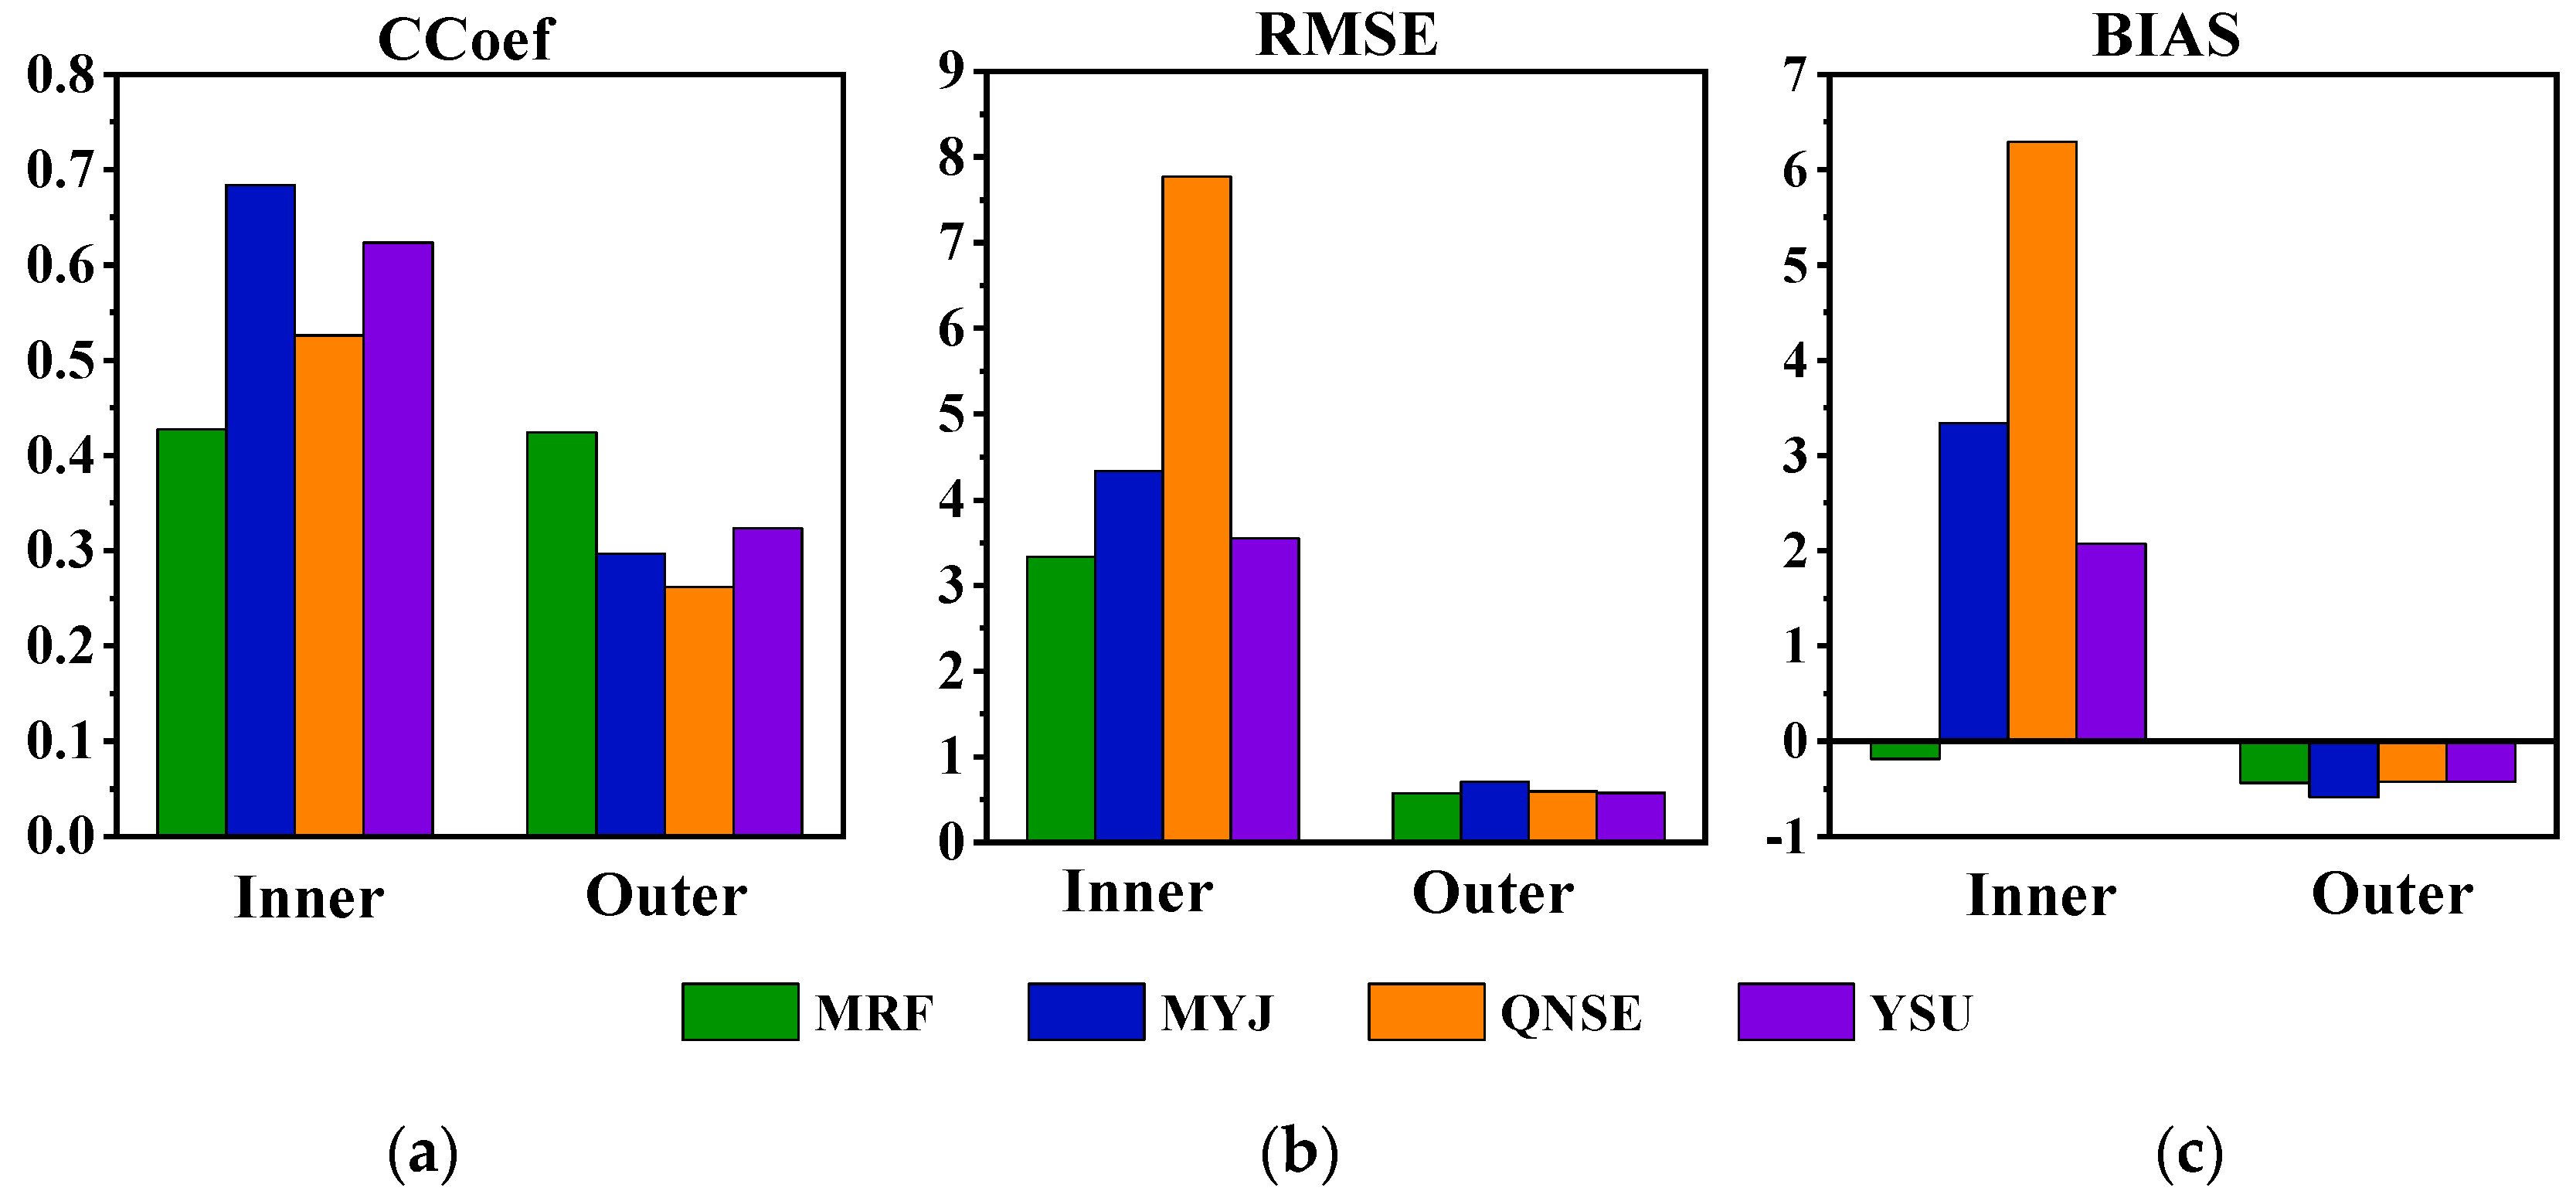
To further investigate the performance of each PBL scheme in the inner core and outer region, the correlation coefficient (CCoef), root-mean-square error (RMSE), and bias (BIAS) between the simulation and observations were calculated. Here, the position of the typhoon center in each scheme was located by the respective simulated minimum central pressure, instead of the best track provided by the CMA. Therefore, the deviation caused by the differences between the observed and simulated track was removed. The results (Figure 6) showed that the CCoef (Figure 6a) in the YSU, MYJ, and QNSE schemes was greater than 0.5 in the inner core; the value was 0.42 in the MRF scheme. However, all CCoef values in the outer region were less than 0.5. This result indicates that the pattern of simulated rainfall in the inner core was better than that in the outer region. For the RMSE (Figure 6b), the largest value in the inner core was found in the QNSE scheme; all schemes showed significantly smaller RMSE values in the outer region. Similarly, the BIAS (Figure 6c) in the QNSE scheme in the inner core was the largest, showing a positive value; all schemes in the outer region showed significantly smaller negative BIAS values. The BIAS values confirm the results shown in Figure 4, in that the simulated rainfall was greater (lower) than the observation in the inner core (outer region).
Overall, the four PBL schemes effectively simulated the rainfall of Typhoon Mujigae, although uncertainties were found. With the exception of the MRF scheme, all schemes overestimated the rainfall in the inner core and underestimated it in the outer region, even though the rain rate was significantly smaller. In general, the MRF scheme was the best and the QNSE scheme was the worst for the rainfall simulation in this case study.
5. Mechanisms
To further explore the factors responsible for the uncertainties in the different PBL schemes and the different patterns in the inner core and outer region, the heat, water vapor flux, vertical motion, and turbulent mixing in all PBL schemes are discussed in this section.
5.1. Sensible and Latent Heat Flux
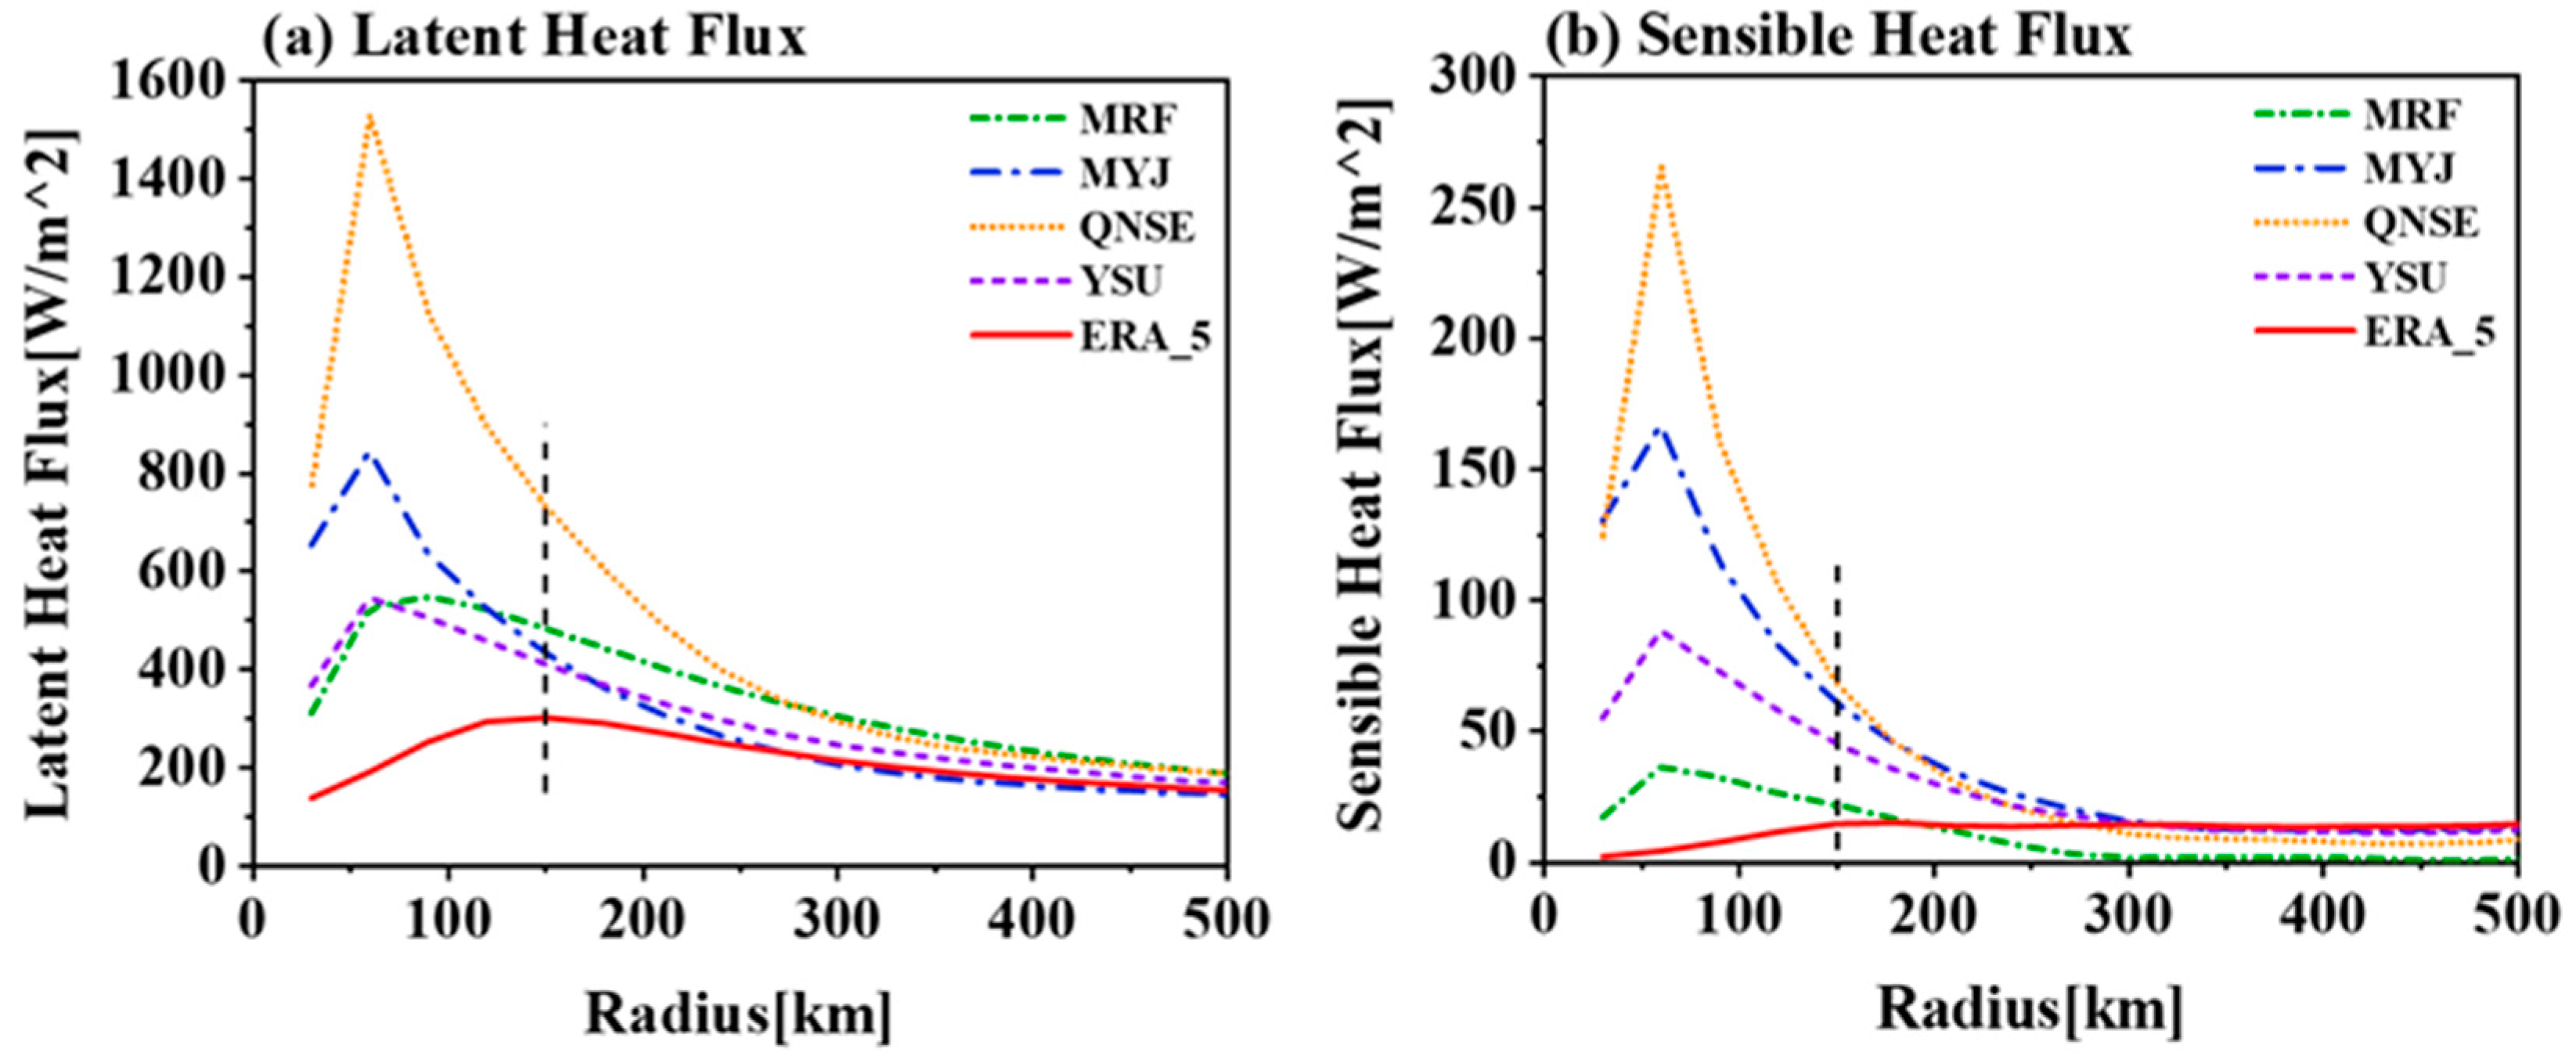
In the PBL, the energy and water vapor near the surface are able to be transported upward owing to turbulent motion, which affects the development of convection. Turbulent motion can be mechanical or buoyancy-driven. Mechanical turbulence refers to the turbulent motion caused by dynamic or mechanical factors such as wind shear, whereas buoyant turbulence is caused by buoyancy, which is affected by the surface heat flux. Sensible and latent heat fluxes provide energy for the typhoon, which is an essential part of the rainfall [9,33]. The surface latent heat flux usually characterizes the amount of water vapor evaporated from the ocean and transmitted to the atmosphere, whereas the surface sensible heat flux characterizes the buoyancy turbulence of the PBL, which affects the upward transmission of water vapor and heat from the sea’s surface. Figure 7a shows that all simulated latent heat fluxes were larger than that in the ERA5 reanalysis in the entire area of Mujigae. However, the distribution of the sensible heat flux shown in Figure 7b is consistent with the rainfall, which was overestimated in the inner core and underestimated in the outer region. This indicates that between the underlying surface and the bottom layer of the model, the simulated water vapor in the QNSE scheme was greatest to a significant degree, followed by the MYJ scheme; the simulated water vapor in the MRF and YSU schemes was relatively low. In the inner core, the QNSE scheme showed the largest sensible heat flux—which led to thermal instability and stronger buoyant turbulence—followed by the MYJ and YSU schemes. The MRF scheme had the highest stability, thus resulting in the corresponding rainfall distribution. The sensible heat flux in the YSU scheme was larger than that in the MRF scheme, and had the same buoyant turbulence. Therefore, despite the similarity in the distribution of the surface latent heat flux, the YSU scheme generated more rainfall than the MRF scheme.
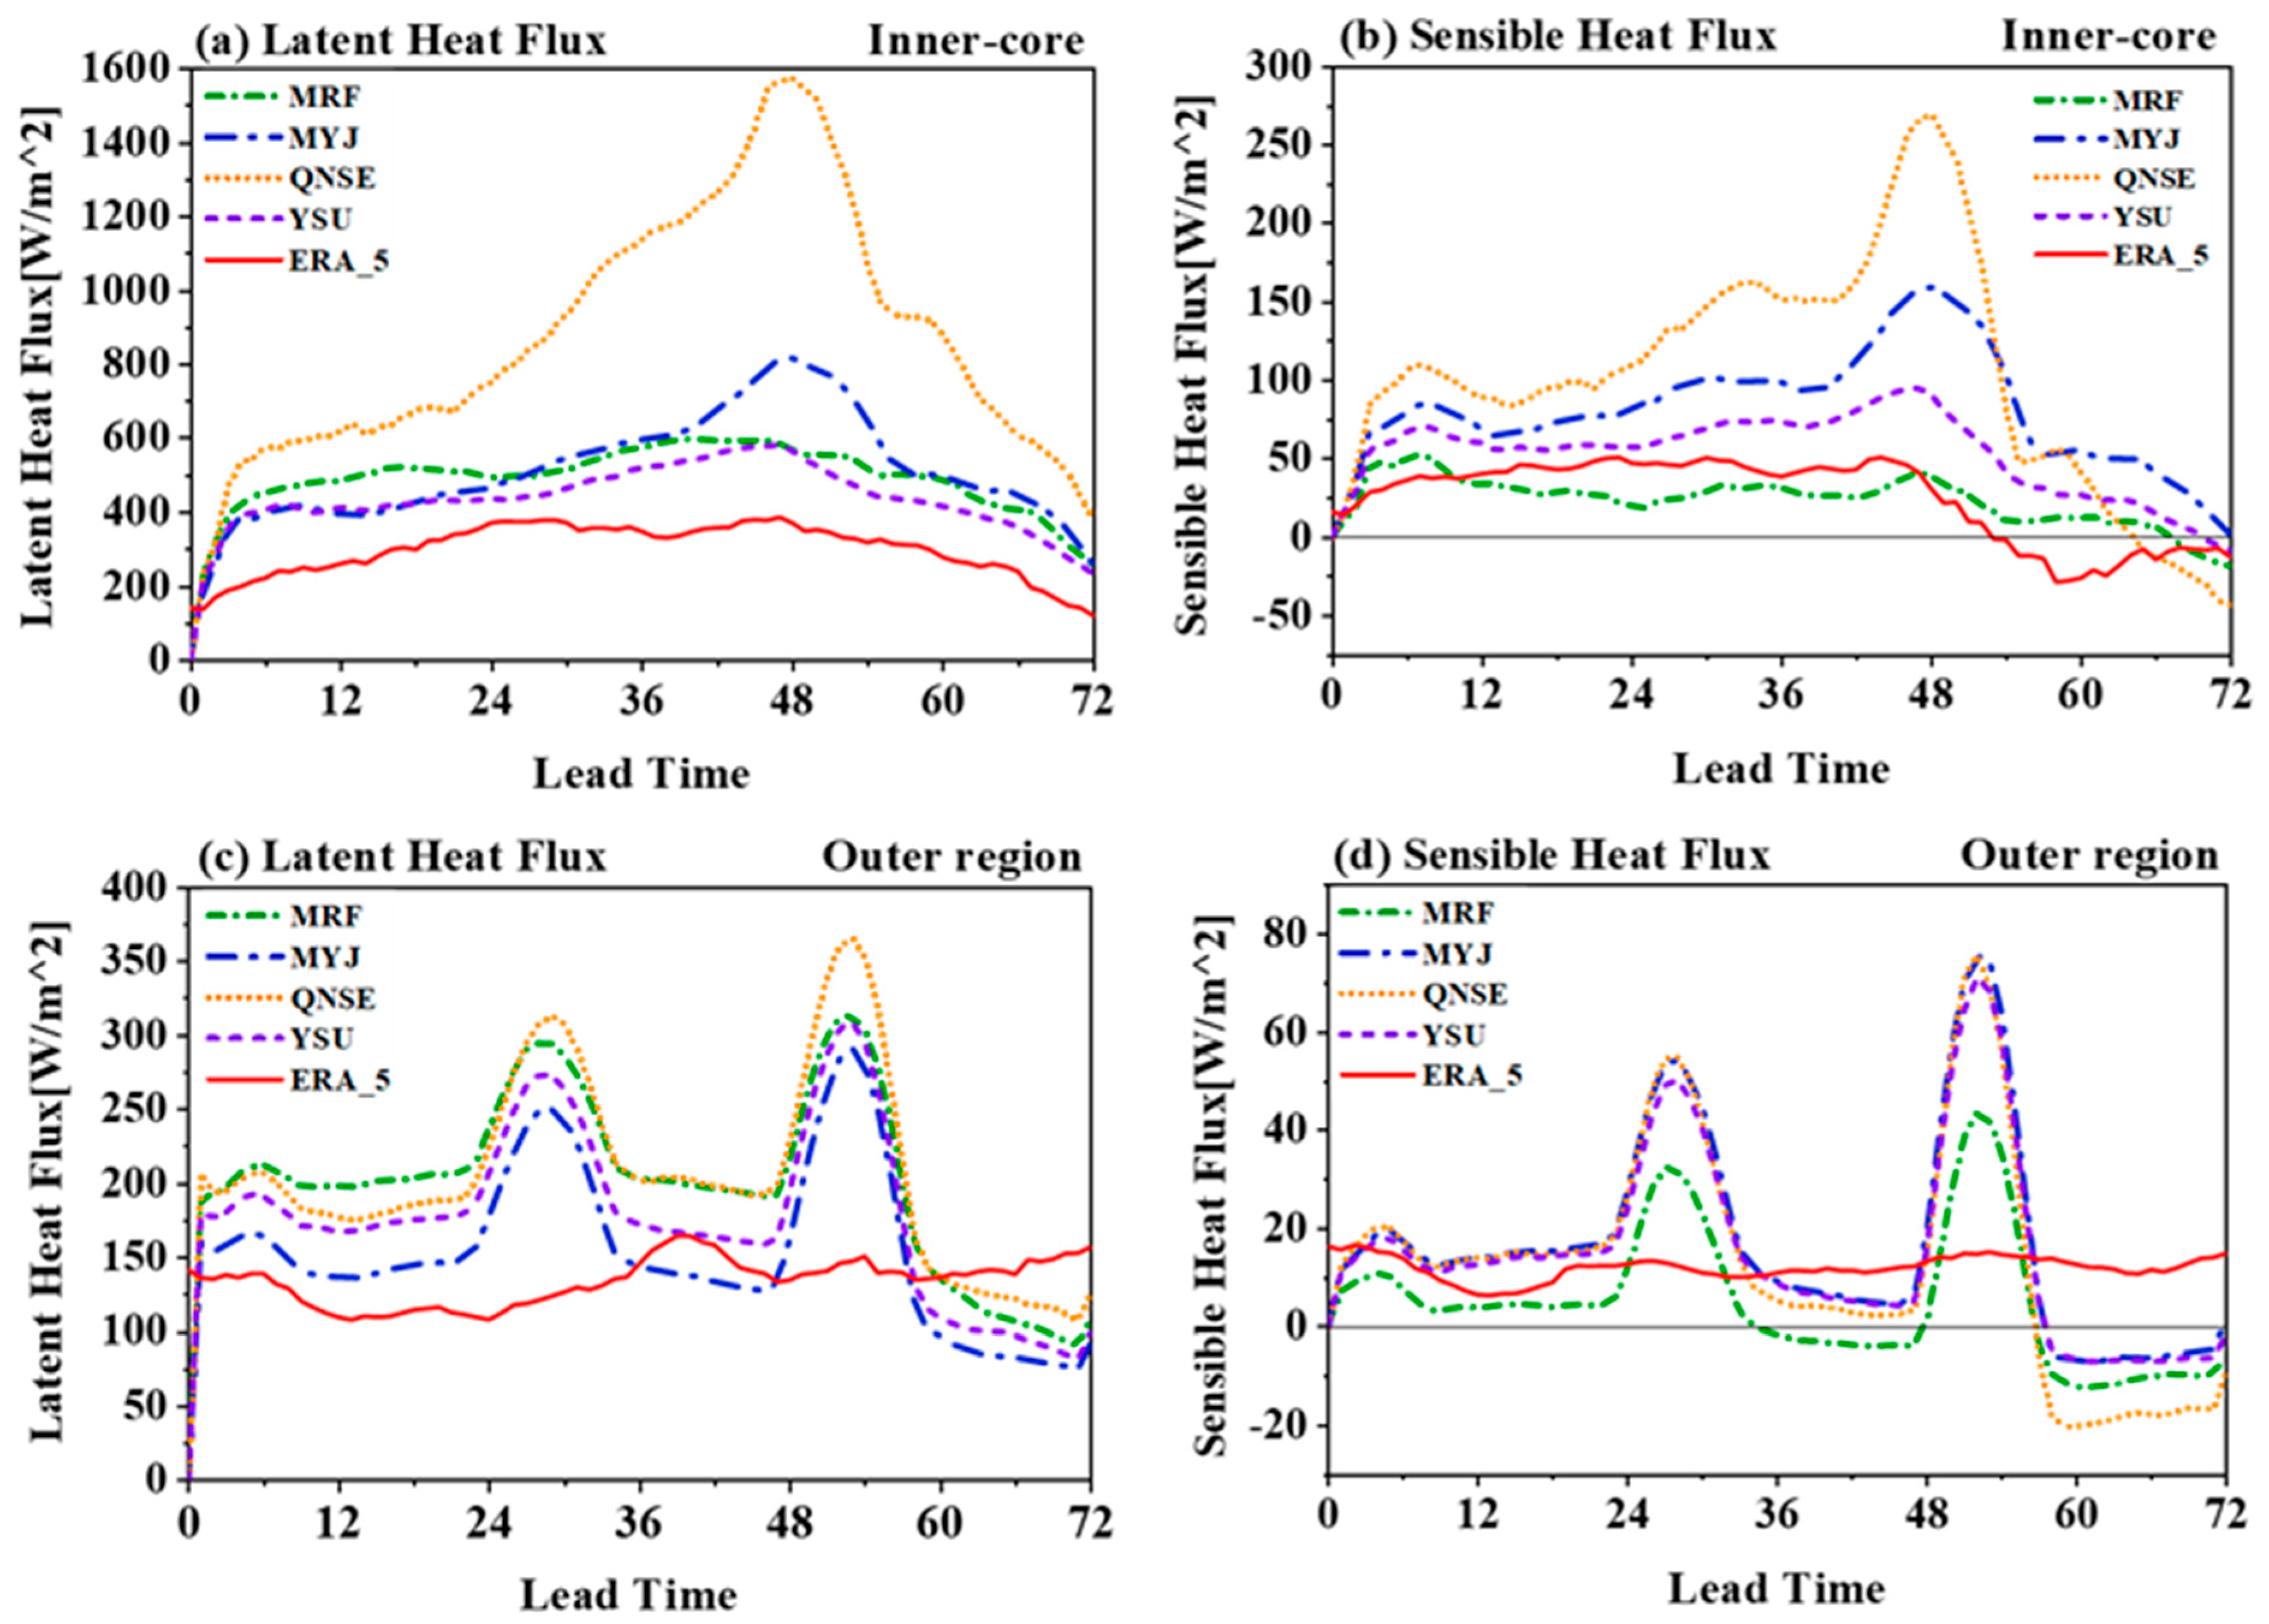
The changes in the simulated latent heat flux in the inner core (Figure 8a) were highly consistent with the variation in rainfall (Figure 5a). Generally, the greater the latent heat flux, the greater the water vapor evaporation from the sea’s surface into the atmosphere. Figure 8a shows that the latent heat flux in the QNSE scheme was still greatest throughout the entire period, whereas the difference was negligible in the other schemes. Thus, the greatest amount of precipitation was produced by the QNSE scheme. The changes in the simulated sensible heat flux (Figure 8b) indicate a similar pattern, although its contribution was significantly lower than that of the latent heat flux.
For the outer region, all schemes exhibited distinct diurnal variation in the simulation for both latent heat flux and sensible heat flux (Figure 8c,d), which is consistent with the results documented by Dunion in 2019 [34], although little difference was noted among them. The latent and sensible heat fluxes in the ERA5 data indicate strong discrepancy from that simulated by the model, particularly in the sensible heat flux after landfall.
Generally, inconsistent with the conclusions of Dong [17] and Wang [35], the sensible heat flux simulated by the local schemes (QNSE, MYJ) was larger than that simulated by the nonlocal schemes (MRF, YSU) in this case. This, combined with the distribution of latent heat flux, generated abundant rainfall. However, the simulations of both sensible and latent heat flux in the MRF scheme were closest to the ERA5 data. Thus, the simulation of rainfall was more realistic.
5.2. Vapor Flux
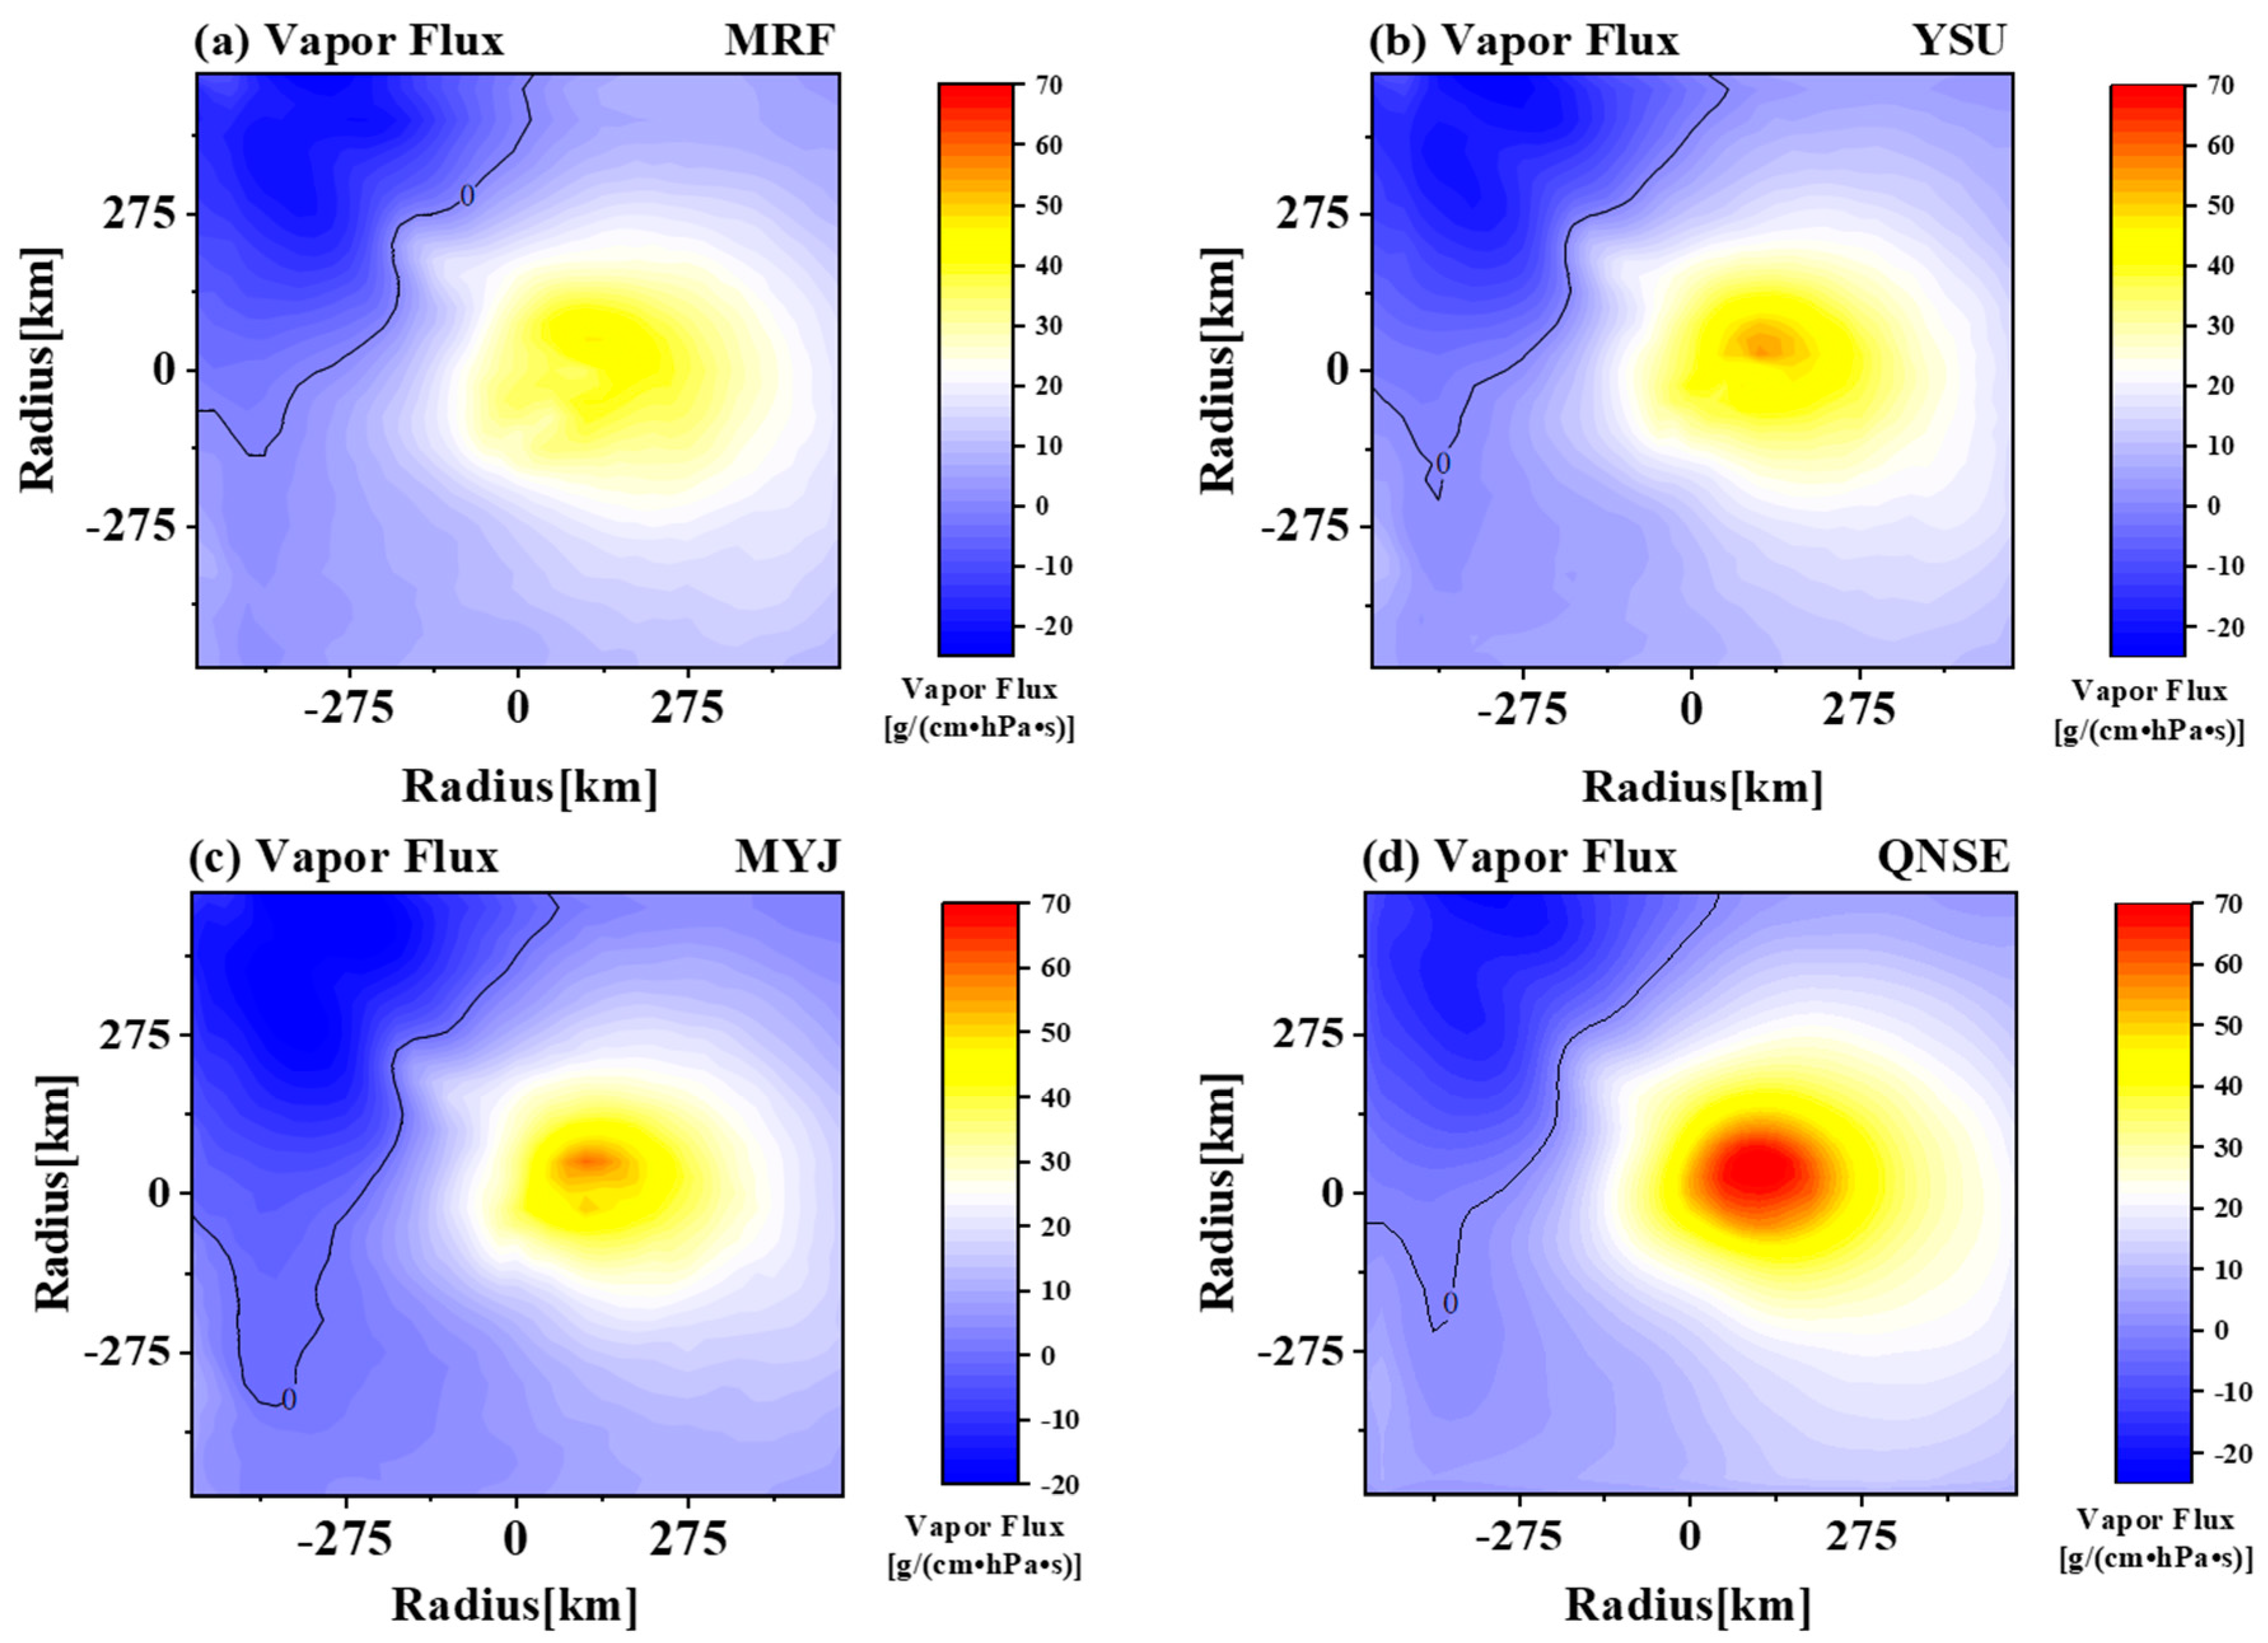
Water vapor plays an indispensable role in rainfall. The vapor flux at 850 hPa clearly reflects the water vapor transported from the underlying surface to the upper air. The difference in the simulated water vapor flux at 850 hPa minus the ERA5 reanalyzed data was taken as the abnormal value. On this basis, the time and azimuthally averaged value (Figure 9) indicated that the vapor flux at 850 hPa in the four schemes was overestimated in the inner core, with the center of the large value occurring in the eastern side, whereas the value was underestimated in the northwestern area of the outer region. This result shows that the water vapor in the inner core was rich and the rainfall was higher than that in the observation. In the outer area, although both positive and negative anomalies occurred in the vapor flux at 850 hPa, they balanced one another, making the rainfall in the outer area slightly higher than that in the observation. Although the positive anomaly center in the MRF and YSU schemes was large, the magnitude was smaller than that in the MYJ and QNSE schemes (which was consistent with the differences in moisture fluxes from Dong (2019) [17]). Therefore, the anomalies of vapor flux at 850 hPa in each scheme were consistent with the rainfall distribution.
5.3. Vertical Velocity
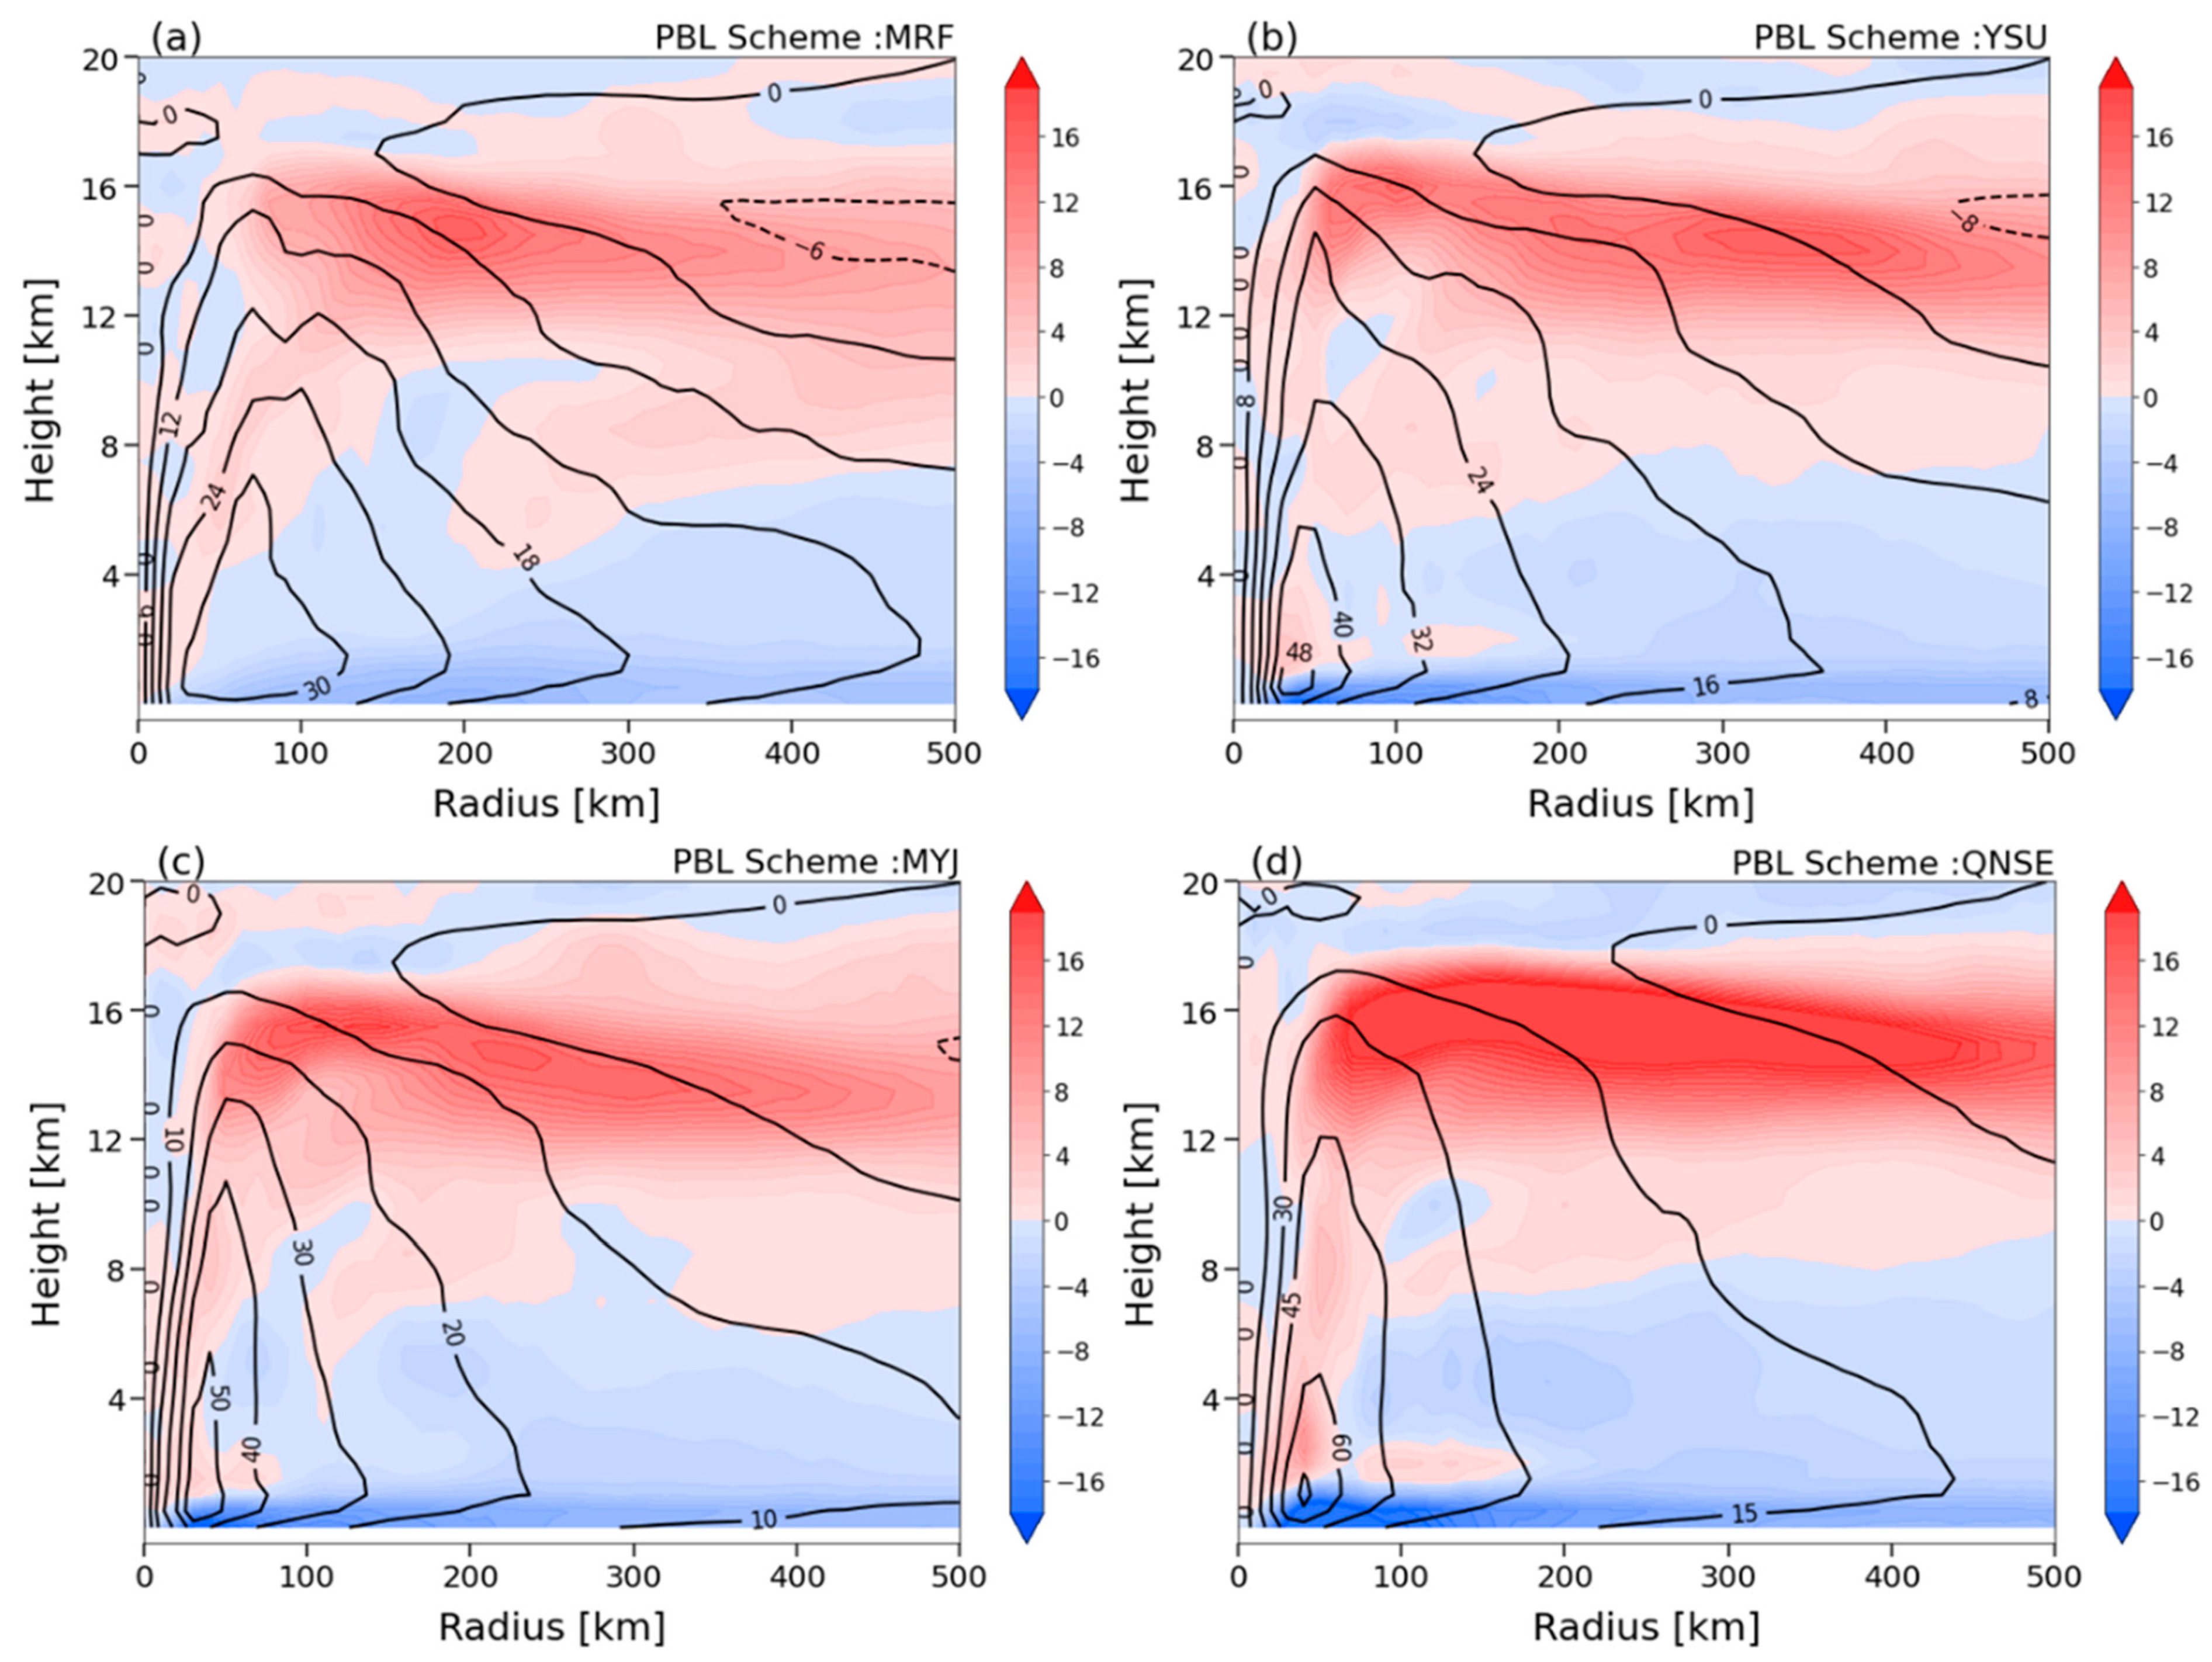
The vertical motion in a typhoon transports water vapor and heat to the upper air; thus, the greater the vertical velocity, the stronger the vertical mixing. In this study, the results were time-averaged after the subtraction of vertical velocity between the simulations from each PBL scheme and that of the ERA5 data, which are referred to as anomalies in the vertical velocity. Cross-sections of the anomalies along the radius of Mujigae are displayed in Figure 10. Overall, the upward vertical velocity simulated by each scheme was stronger in the inner core, whereas the downward motion was stronger in the outer region. This favors the formation of heavy rainfall in the inner core and drying of the outer region. In addition, the large-value centers of the anomalies in the vertical velocity in the four schemes appeared on the eastern side of the typhoon center, which is consistent with the positive anomaly of the vapor flux at 850 hPa. This confirms that the simulated precipitation in each scheme was overrated in the inner core and underrated in the outer region.
5.4. PBL Height
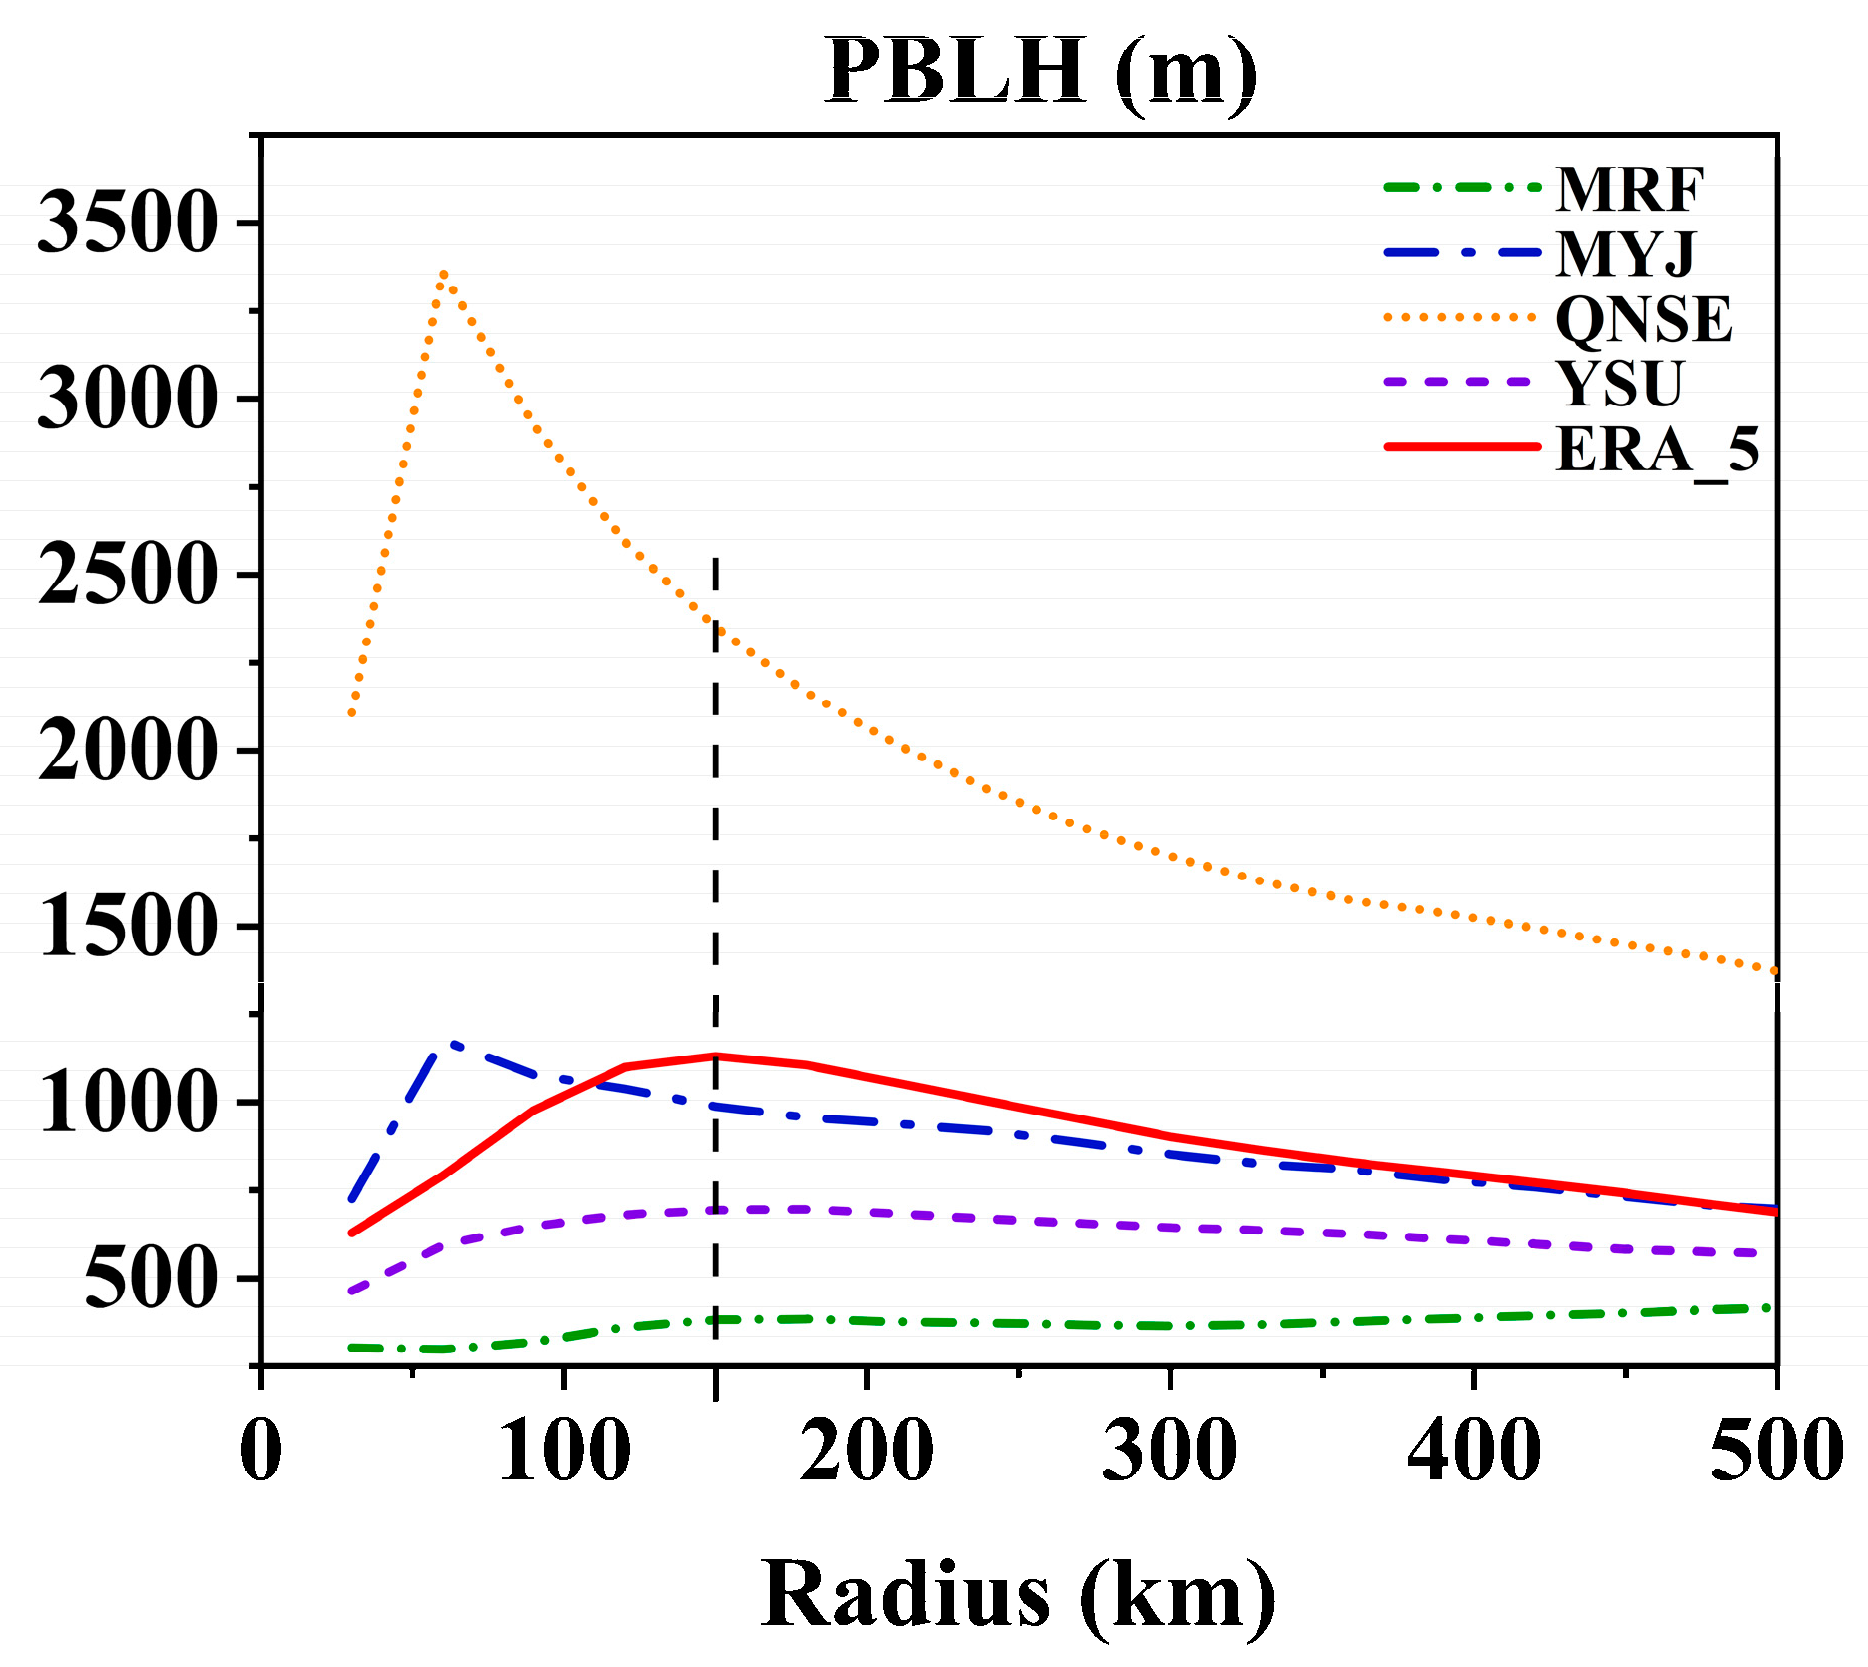
The PBL height (PBLH) reflects the strength of vertical mixing, and is closely related to other meteorological elements [36]. A higher PBLH leads to stronger vertical mixing in the boundary layer, and vice versa [37]. The methods used for calculating the PBLH differ between the local and nonlocal closure schemes. In particular, the YSU and MRF schemes use the bulk Richardson method, whereas the QNSE and MYJ schemes use methods related to turbulent kinetic energy (TKE) [37].
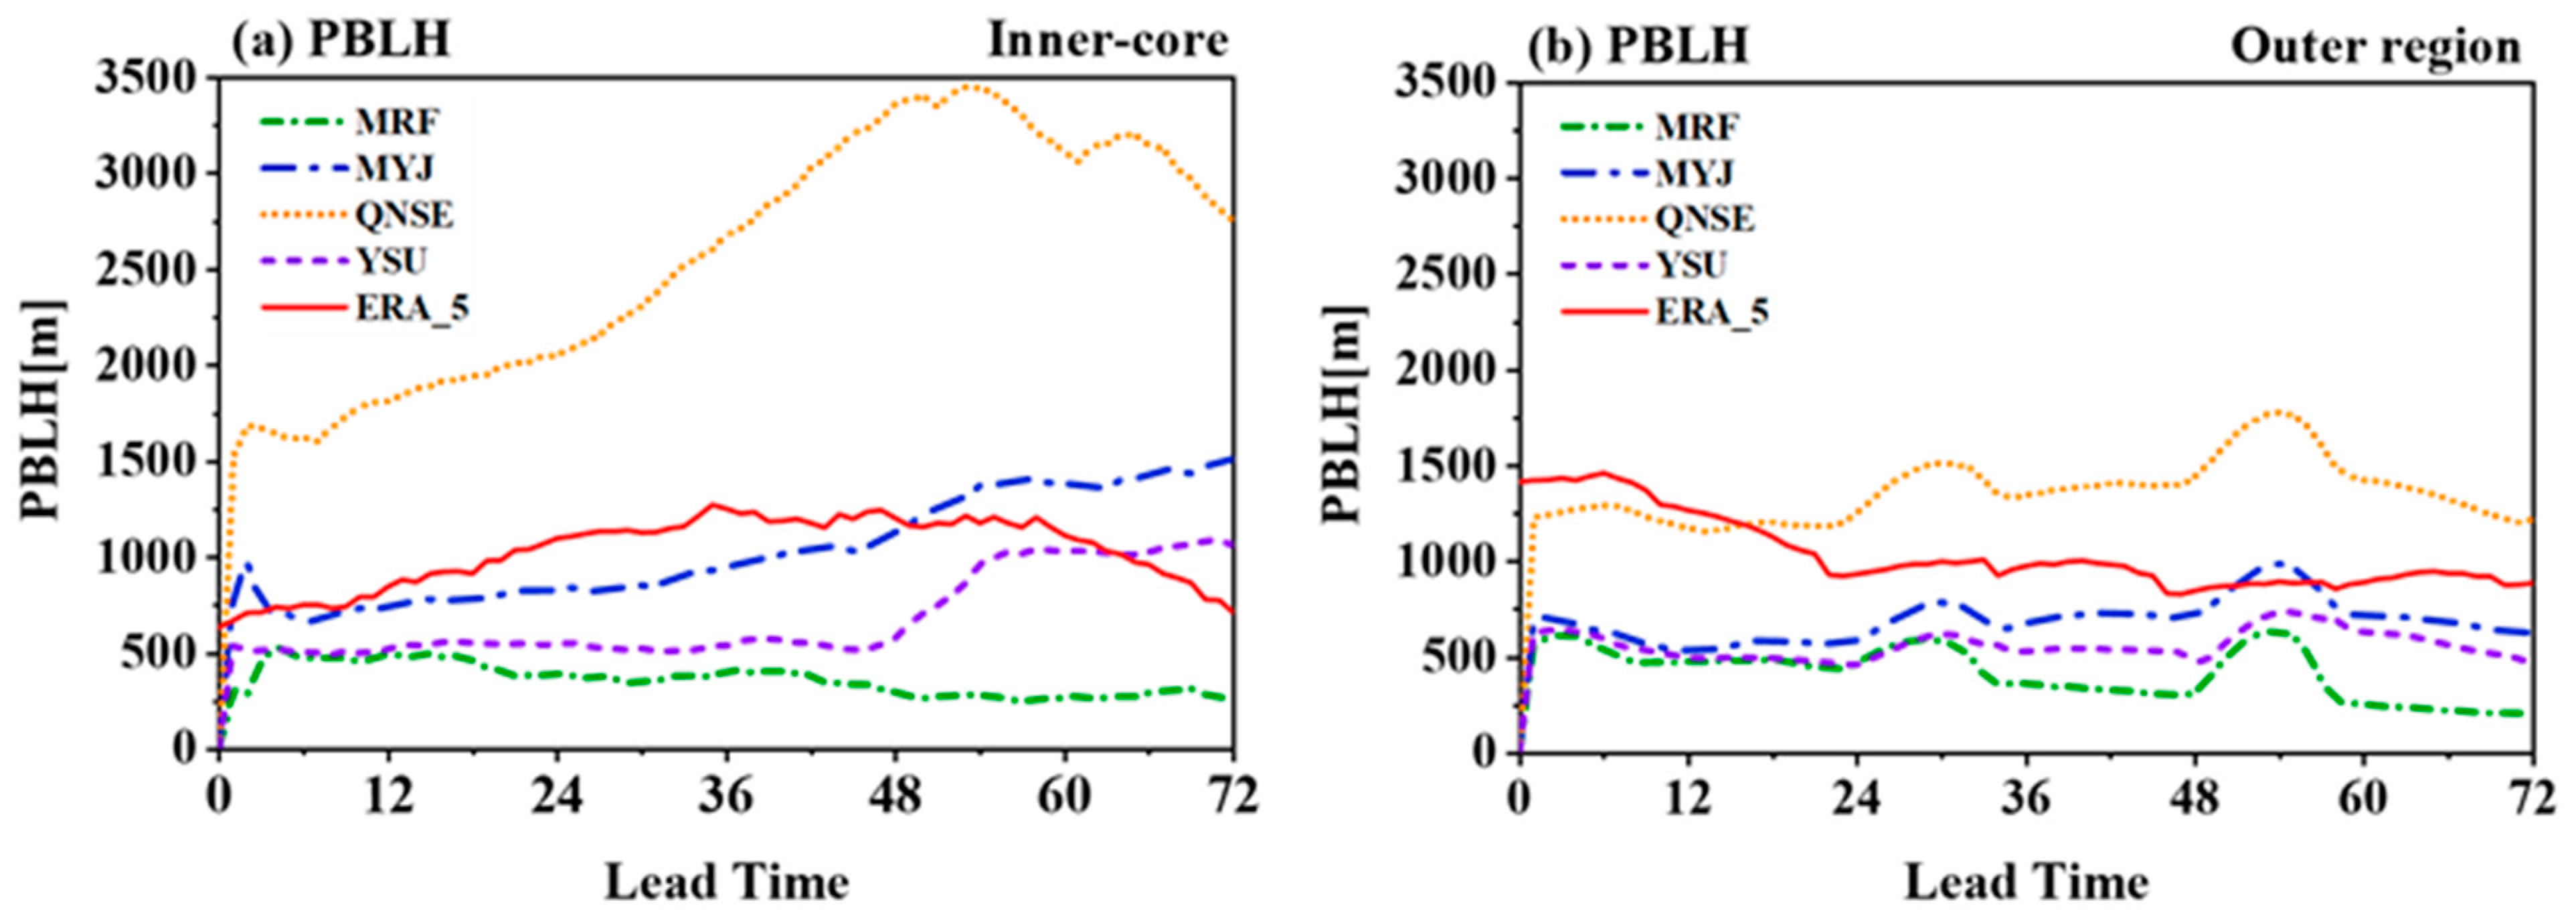
From the inner core to the outer region, the simulated PBLH in each scheme showed significant differences (Figure 11 and Figure 12). The PBLH simulated by the MRF scheme was the most unrealistic, because the entrainment effect at the top of the boundary layer was not considered. However, the YSU scheme improves on this [30], and considers the turbulence caused by the entrainment effect; therefore, the simulated PBLH is more realistic in this scheme. This indicates that the entrainment effect can strongly affect the vertical mixing. The PBLH simulated by the QNSE scheme deviated the most from the ERA5 data, whereas that in the MYJ scheme—which is also a local scheme—was closest to the ERA5 data.
Although no obvious difference was noted in the arrangement and distribution of the PBLH between the schemes and the ERA5 data within and outside of the inner core, the PBLH was strongly correlated with the precipitation. The PBLH characterizes the intensity of vertical mixing. In both the inner core and the outer region, the QNSE scheme had the strongest vertical mixing, followed by MYJ and YSU; the MRF scheme was the weakest. This distribution corresponds to the amount of precipitation observed.
According to the above analysis, the sensible and latent heat fluxes simulated by each scheme in the inner core were generally higher than that of ERA5. More water vapor was evaporated from the underlying surface to the atmosphere, and the upward motion was stronger. This was manifested by the higher vapor flux at 850 hPa and the larger vertical velocity in the inner core of Mujigae, which induced the stronger vertical mixing and precipitation. In a large part of the outer region, the sensible heat flux in each experiment was slightly lower than that in the ERA5 data, whereas the latent heat flux was slightly higher. The weak upward motion resulted in weak vertical mixing, and the water vapor and heat were unable to be transported to the upper air; thus, the simulated precipitation was smaller than that in the observation. The difference in the PBLH also effectively explains the precipitation differences between the schemes.
5.5. Tangential and Radial Velocity
The main circulation of the typhoon can be well reflected with tangential velocity. As shown in Figure 13, the simulated tangential velocity of the QNSE scheme was stronger than that in the MRF, YSU, and MYJ schemes, with maximum tangential speeds of 63 m/s, 30 m/s, 48m/s, and 50 m/s, respectively. The differences in simulated tangential wind between PBL schemes corresponded to the simulated intensity. However, the simulated tangential wind is stronger in YSU scheme compare to MYJ and QNSE schemes in Dong (2019) [17].
Radial velocity embodied the inflow and outflow of the typhoon. In Figure 13, the negative radial velocity indicates the inflow (blue shaded), while the positive value indicates the outflow (red shaded). As we can see, the inflow was generally at the lower layer below 2 km, while the outflow was generally at the upper layer above 2 km. The strongest simulated inflow was still found in the QNSE scheme (which was consistent with Dong’s research [17]), while the weakest was in the MRF scheme. Stronger inflow can transfer more water vapor from the environment to the center of the typhoon, increasing precipitation in the inner core. Therefore, the largest amount of water vapor transferred horizontally into the inner core was simulated by the QNSE scheme, and the least by the MRF scheme, which is consistent with the distribution of simulated precipitation.
6. Discussion and Conclusions
Owing to a lack of research on the sensitivity of PBL schemes to precipitation in the inner core and outer region of typhoons using numerical models at the synoptic scale, no definite conclusion has been reached on this topic. Therefore, in order to investigate the influence of PBL schemes on the differences in precipitation between the inner cores and outer regions of typhoons, the WRF version 4.0.2 weather model was used in the present study. Two local (QNSE and MYJ) and two nonlocal (YSU and MRF) closure planetary boundary layer parameterization schemes were selected to conduct four groups of simulations for Typhoon Mujigae, which occurred in 2015. The heat flux, vapor flux, vertical velocity, and PBLH simulated by each PBL scheme were analyzed spatially and temporally. The main conclusions are presented in this section.
In the case of Typhoon Mujigae, the different PBL schemes shared common effects on the simulated precipitation in the inner core and outer region. Within the inner core (outer region), the simulated precipitation was generally greater (slightly lower) than the observation. Further investigation revealed that this phenomenon was mainly the result of the higher values of sensible heat flux, latent heat flux, vertical velocity, and vapor flux simulated by each scheme in the inner core (Table 3). More water evaporated from the underlying surface; combined with the stronger upward motion, this resulted in more vapor transported to the upper level, which led to stronger precipitation. In the outer region (Table 3), all of the PBL schemes except for the MRF scheme produced slightly higher sensible heat fluxes than that in the ERA5 data, and all of the schemes showed mildly higher latent heat fluxes and vapor fluxes but slightly weaker vertical velocity (upward) than the ERA5 data. This resulted in poor transmission of vapor to the upper level, and an underestimation of precipitation. Appropriate adjustment of the processing method for these variables might improve this situation.
However, differences were noted between the PBL schemes in the simulation of precipitation, with obvious sensitivity. Each experiment was capable of roughly matching the area of rainfall in the inner core and outer region of Mujigae, although the amount of precipitation differed significantly between the schemes. Owing to its superior performance in the simulation of sensible heat flux, latent heat flux, vapor flux, and vertical velocity, the precipitation simulated by the MRF scheme was closest to the observation, both spatially and temporally. However, the PBLH simulated by the MRF scheme was far from the metric. To avoid this result, improvements were made to the YSU scheme in order to produce higher and more realistic PBLH values, although the amount of precipitation was larger. The MYJ and QNSE schemes, which are both local closure schemes, showed the largest deviations in the precipitation simulation.
In general, the vertical, tangential, and radial velocities simulated in the inner core of Mujigae were higher in the local closure schemes than in the nonlocal closure schemes. This resulted in stronger vertical mixing, horizontal inflow, and higher PBLH values, which are suitable for the formation of strong convection. The greater latent heat flux and water vapor flux produced abundant precipitation, which was overrated compared with the observation. Thus, the precipitation simulated in the local closure schemes was more accurate than that in the nonlocal schemes. No obvious difference was found between the schemes in the outer region of Typhoon Mujigae. The anomalies of sensible heat flux, vertical velocity, and other variables simulated in the PBL schemes between the inner core and the outer region shared the corresponding precipitation distribution. However, it should be noted that the results in this case are based on only one typhoon, and could be limited and accidental. To further explore the impact of the PBL schemes on the simulation of precipitation in the inner cores and outer regions of typhoons, a large amount of numerical simulation is needed.
Author Contributions
Writing—original draft preparation, formal analysis, visualization, validation, W.S.; investigation, resources, data curation, writing—review and editing, Z.L.; conceptualization, methodology, supervision, project administration, Y.Z. and J.X.; methodology, software, writing—review and editing, S.C. and G.Y. All authors have read and agreed to the published version of the manuscript.
Funding
This study was jointly supported by the National Natural Science Foundation of China (Funding number: 42130605), the Guangdong Basic and Applied Basic Science Research Foundation (Funding number: 2019B1515120018), the Project of Enhancing School with Innovation of Guangdong Ocean University (Funding number: 230419053), the Projects (Platforms) for Construction of Top-ranking Disciplines of Guangdong Ocean University (Funding number: 231419022), and the Special Funds of Central Finance Support the Development of Local Colleges and Universities (Funding number: 000041).
Institutional Review Board Statement
Not applicable.
Informed Consent Statement
Not applicable.
Data Availability Statement
The data of the Integrated Multi-Satellite Retrievals for GPM (IMERG) Final Precipitation L3 Half-Hourly 0.1° × 0.1° V06 (GPM_3IMERGHH) can be found in Goddard Earth Sciences Data and Information Services Center at 10.5067/GPM/IMERG/3B-HH/06. The National Center for Environmental Prediction Final Analysis (NCEP FNL) Operational Global Analysis data presented in this study are openly available in the research data archive at https://0-doi-org.brum.beds.ac.uk/10.5065/D6M043C6, accessed on 14 November 2021. The fifth-generation European Centre for Medium-Range Weather Forecasts (ECMWF) re-analysis (ERA5) data presented in this study are openly available in the Copernicus Climate Data Store (CDS) at 10.24381/cds.adbb2d47 and 10.24381/cds.bd0915c6. The best track observation dataset of the typhoon released by the Shanghai Typhoon Institute of the China Meteorological Administration (CMA) can be found at tcdata.typhoon.org.cn.
Conflicts of Interest
The authors declare no conflict of interest.
References
- Leslie, L.M.; Holland, G.J. On the Bogussing of Tropical Cyclones in Numerical Models: A Comparison of Vortex Profiles. Meteorol. Atmos. Phys. 1995, 56, 101–110. [Google Scholar] [CrossRef]
- Mathur, M.B. Development of an Eye-Wall like Structure in a Tropical Cyclone Model Simulation. Dyn. Atmos. Ocean. 1998, 27, 527–547. [Google Scholar] [CrossRef]
- Gu, J.; Xiao, Q.; Kuo, Y.H.; Barker, D.M.; Ma, X. Assimilation and Simulation of Typhoon Rusa (2002) Using the WRF System. Adv. Atmos. Sci. 2005, 22, 13. [Google Scholar]
- Xu, J.; Rugg, S.; Horner, M.; Byerle, L. Application of ATOVS Radiance with ARW WRF/GSI Data Assimilation System in the Prediction of Hurricane Katrina. Open Atmos. Sci. J. 2009, 3, 13–28. [Google Scholar] [CrossRef]
- Subramani, D.; Chandrasekar, R.; Ramanujam, K.S.; Balaji, C. A New Ensemble-Based Data Assimilation Algorithm to Improve Track Prediction of Tropical Cyclones. Nat. Hazards 2014, 71, 659–682. [Google Scholar] [CrossRef]
- Srinivas, C.V.; Mohan, G.M.; Yesubabu, V.; Hariprasad, K.; Venkatraman, B. Data Assimilation Experiments with ARW–3DVAR for Tropical Cyclone Extreme Weather Predictions Over Bay of Bengal; Tropical Cyclone Activity over the North Indian Ocean; Springer: Cham, Switzerland, 2017. [Google Scholar]
- Xu, D.; Shen, F.; Min, J.; Shu, A. Assimilation of GPM Microwave Imager Radiance for Track Prediction of Typhoon Cases with the WRF Hybrid En3DVAR System. Adv. Atmos. Sci. 2021, 38, 983–993. [Google Scholar] [CrossRef]
- Chen, S.; Xu, F.; Zhang, Y.; Ye, G.; Xu, J.; Liu, C. Sensitivity of Typhoon Lingling (2019) Simulations to Horizontal Mixing Length and Planetary Boundary Layer Parameterizations. Front. Earth Sci. 2021, 1–19. [Google Scholar] [CrossRef]
- Li, X.; Pu, Z. Sensitivity of Numerical Simulation of Early Rapid Intensification of Hurricane Emily (2005) to Cloud Microphysical and Planetary Boundary Layer Parameterizations. Mon. Weather Rev. 2008, 136, 4819–4838. [Google Scholar] [CrossRef]
- Xi, D.; Chu, K.; Tan, Z.M.; Gu, J.F.; Shen, W.; Zhang, Y.; Tang, J. Characteristics of Warm Cores of Tropical Cyclones in a 25-Km-Mesh Regional Climate Simulation over CORDEX East Asia Domain. Clim. Dyn. 2021, 57, 2375–2389. [Google Scholar] [CrossRef]
- Stull, R.B. An Introduction to Boundary Layer Meteorology||Mean Boundary Layer Characteristics; Springer: Cham, Switzerland, 1988; pp. 1–27. [Google Scholar]
- Emanuel, K.A. Some Aspects of Hurricane Inner-Core Dynamics and Energetics. J. Atmos. Sci. 1997, 54, 1014–1026. [Google Scholar] [CrossRef]
- Smith, R.K.; Thomsen, G.L. Dependence of Tropical-cyclone Intensification on the Boundary-layer Representation in a Numerical Model. Q. J. R. Meteorol. Soc. 2010, 136, 1671–1685. [Google Scholar] [CrossRef]
- Zhang, J.A.; Rogers, R.F. Effects of Parameterized Boundary Layer Structure on Hurricane Rapid Intensification in Shear. Mon. Weather 2018, 147, 853–871. [Google Scholar] [CrossRef]
- Liu, J.; Zhang, F.; Pu, Z. Numerical Simulation of the Rapid Intensification of Hurricane Katrina (2005): Sensitivity to Boundary Layer Parameterization Schemes. Adv. Atmos. Sci. 2017, 34, 482–496. [Google Scholar] [CrossRef]
- Braun, S.A.; Tao, W.K. Sensitivity of High-Resolution Simulations of Hurricane Bob (1991) to Planetary Boundary Layer Parameterizations. Mon. Weather Rev. 2000, 128, 3941. [Google Scholar] [CrossRef] [Green Version]
- Dong, M.; Ji, C.; Chen, F.; Wang, Y. Numerical Study of Boundary Layer Structure and Rainfall after Landfall of Typhoon Fitow (2013): Sensitivity to Planetary Boundary Layer Parameterization. Adv. Atmos. Sci. 2019, 36, 431–450. [Google Scholar] [CrossRef]
- Skamarock, C.; Klemp, B.; Dudhia, J.; Gill, O.; Liu, Z.; Berner, J.; Wang, W.; Powers, G.; Duda, G.; Barker, D.M.; et al. A Description of the Advanced Research WRF Model Version 4; National Center for Atmospheric Research: Boulder, CO, USA, 2019. [Google Scholar]
- Cohen, A.E.; Cavallo, S.M.; Coniglio, M.C.; Brooks, H.E. A Review of Planetary Boundary Layer Parameterization Schemes and Their Sensitivity in Simulating Southeastern U.S. Cold Season Severe Weather Environments. Weather Forecast. 2015, 30, 591–612. [Google Scholar] [CrossRef]
- Dzebre, D.E.; Adaramola, M.S. A Preliminary Sensitivity Study of Planetary Boundary Layer Parameterisation Schemes in the Weather Research and Forecasting Model to Surface Winds in Coastal Ghana. Renew. Energy 2020, 146, 66–86. [Google Scholar] [CrossRef]
- Jia, W.; Zhang, X. The Role of the Planetary Boundary Layer Parameterization Schemes on the Meteorological and Aerosol Pollution Simulations: A Review. Atmos. Res. 2020, 239, 104890. [Google Scholar] [CrossRef]
- Wu, Q.; Ruan, Z.; Chen, D.; Lian, T. Diurnal Variations of Tropical Cyclone Precipitation in the Inner and Outer Rainbands. J. Geophys. Res. Atmos. 2015, 120, 1–11. [Google Scholar] [CrossRef]
- Ankur, K.; Busireddy, N.K.R.; Osuri, K.K.; Niyogi, D. On the Relationship between Intensity Changes and Rainfall Distribution in Tropical Cyclones over the North Indian Ocean. Int. J. Climatol. 2019, 40, 2015–2025. [Google Scholar] [CrossRef]
- Liu, M.; Yang, L.; Smith, J.A.; Vecchi, G.A. Response of Extreme Rainfall for Landfalling Tropical Cyclones Undergoing Extratropical Transition to Projected Climate Change: Hurricane Irene (2011). Earth Future 2020, 8, e2019EF001360. [Google Scholar] [CrossRef] [PubMed] [Green Version]
- Tu, S.; Xu, J.; Chan, J.; Huang, K.; Long, S.C. Recent Global Decrease in the Inner-Core Rain Rate of Tropical Cyclones. Nat. Commun. 2021, 12, 1948. [Google Scholar] [CrossRef] [PubMed]
- Guo, H.X.; Yang, J.Y.; Zhang, X.X.; Deng, H.Y. Analysis of the Characteristics of Severe Typhoon Mujigae (1522). Guangdong Meteorol. 2016, 38, 6–9. [Google Scholar]
- Cai-Ling, L.I.; Yan, L.J.; Zhao-Hui, L.I.; Mai, X.H.; Huang, X.X. Analysis of a Tornado in Outside-Region of Typhoon Mujigae in 2015. J. Trop. Meteorol. 2016, 32, 416–424. [Google Scholar]
- Huang, J.; Wang, S.; Liang, Y.; Chen, X.; Bureau, G.M. Diagnostic Analysis of Rainstorm Associated with Typhoon “Rainbow” in the Autumn of 2015. Chin. Agric. Sci. Bull. 2017, 2017, 14. [Google Scholar]
- Hong, S.Y.; Pan, H.L. Nonlocal Boundary Layer Vertical Diffusion in a Medium-Range Forecast Model. Mon. Weather Rev. 1996, 124, 2322. [Google Scholar] [CrossRef] [Green Version]
- Hong, S.Y.; Noh, Y.; Dudhia, J. A New Vertical Diffusion Package with an Explicit Treatment of Entrainment Processes. Mon. Weather Rev. 2005, 134, 2318. [Google Scholar] [CrossRef] [Green Version]
- Janji, Z.I. The Step-Mountain Eta Coordinate Model: Further Developments of the Convection, Viscous Sublayer, and Turbulence Closure Schemes. Mon. Weather Rev. 1994, 122, 927. [Google Scholar] [CrossRef] [Green Version]
- Sukoriansky, S.; Galperin, B.; Perov, V. Application of a New Spectral Theory of Stably Stratified Turbulence to the Atmospheric Boundary Layer over Sea Ice. Bound. Layer Meteorol. 2005, 117, 231–257. [Google Scholar] [CrossRef]
- Liu, G.R.; Liu, C.C.; Huang, C.S.; Lin, T.H.; Chen, W.J.; Chao, C.C. Diagnosing the Growth of Equatorial Typhoon Vamei (2001) from an Energy Standpoint. Terr. Atmos. Ocean. Sci. 2010, 21, 817–827. [Google Scholar] [CrossRef] [Green Version]
- Dunion, J.P.; Thorncroft, C.D.; Nolan, D.S. Tropical Cyclone Diurnal Cycle Signals in a Hurricane Nature Run. Mon. Weather Rev. 2019, 147, 363–388. [Google Scholar] [CrossRef]
- Korhonen, K.; Giannakaki, E.; Mielonen, T.; Pfüller, A.; Laakso, L. Atmospheric Boundary Layer Top Height in South Africa: Measurements with Lidar and Radiosonde Compared to Three Atmospheric Models. Atmos. Chem. Phys. 2014, 14, 4263–4278. [Google Scholar] [CrossRef] [Green Version]
- Seibert, P.; Beyrich, F.; Gryning, S.E.; Joffre, S.; Rasmussen, A.; Tercier, P. Review and Intercomparison of Operational Methods for the Determination of the Mixing Height. Atmos. Environ. 2000, 34, 1001–1027. [Google Scholar] [CrossRef]
- Adl, A.; Mn, B.; Rmga, B.; Lld, A. Sensitivity of Meteorological Variables on Planetary Boundary Layer Parameterization Schemes in the WRF-ARW Model—ScienceDirect. Atmos. Res. 2020, 247, 105214. [Google Scholar]
Figure 1.
Precipitation (mm) accumulated over 24 h from 00:00 on 3 October to 00:00 on 4 October, 2015 for observations (a) GPM and all simulations: (b) MRF; (c) YSU; (d) MYJ and (e) QNSE.
Figure 1.
Precipitation (mm) accumulated over 24 h from 00:00 on 3 October to 00:00 on 4 October, 2015 for observations (a) GPM and all simulations: (b) MRF; (c) YSU; (d) MYJ and (e) QNSE.

Figure 2.
Simulation domain for the WRF-ARW model. The contours (m) indicate the terrain.

Figure 3.
Observation and simulation results of the central minimum pressure and track of Typhoon Mujigae. The observations are shown in red; the MRF, MYJ, QNSE, and YSU schemes are shown in green, blue, orange, and purple, respectively.
Figure 3.
Observation and simulation results of the central minimum pressure and track of Typhoon Mujigae. The observations are shown in red; the MRF, MYJ, QNSE, and YSU schemes are shown in green, blue, orange, and purple, respectively.

Figure 4.
Distribution of 72-h-averaged rain rates (mm/h) along the radius of Typhoon Mujigae according to the observation and the simulation schemes. The black dotted line indicates the radius of the typhoon’s inner core. The observation is shown in red; the MRF, MYJ, QNSE, and YSU schemes are shown in green, blue, orange, and purple, respectively.

Figure 5.
Observation and simulation results of area-averaged precipitation (mm/h) in the (a) inner core and (b) outer region of Typhoon Mujigae. The observation is shown in red; the MRF, MYJ, QNSE, and YSU schemes are shown in green, blue, orange, and purple, respectively.
Figure 5.
Observation and simulation results of area-averaged precipitation (mm/h) in the (a) inner core and (b) outer region of Typhoon Mujigae. The observation is shown in red; the MRF, MYJ, QNSE, and YSU schemes are shown in green, blue, orange, and purple, respectively.

Figure 6.
(a) Correlation coefficient (CCoef), (b) root-mean-square error (RMSE), and (c) bias (BIAS) in the inner core and outer region of Typhoon Mujigae according to the various schemes. The MRF, MYJ, QNSE, and YSU schemes are shown in green, blue, orange, and purple, respectively.
Figure 6.
(a) Correlation coefficient (CCoef), (b) root-mean-square error (RMSE), and (c) bias (BIAS) in the inner core and outer region of Typhoon Mujigae according to the various schemes. The MRF, MYJ, QNSE, and YSU schemes are shown in green, blue, orange, and purple, respectively.

Figure 7.
72-h-averaged (a) surface latent heat flux (W/m2) and (b) surface sensible heat flux distributions along the radius of Typhoon Mujigae. The black dotted line indicates the radius of the inner core. ERA5 is shown in red; the MRF, MYJ, QNSE, and YSU schemes are shown in green, blue, orange, and purple, respectively.

Figure 8.
Time series of surface latent heat flux and surface sensible heat flux in the (a,b) inner core and (c,d) outer region of Typhoon Mujigae. ERA5 is shown in red; the MRF, MYJ, QNSE, and YSU schemes are shown in green, blue, orange, and purple, respectively.
Figure 8.
Time series of surface latent heat flux and surface sensible heat flux in the (a,b) inner core and (c,d) outer region of Typhoon Mujigae. ERA5 is shown in red; the MRF, MYJ, QNSE, and YSU schemes are shown in green, blue, orange, and purple, respectively.

Figure 9.
72-h-averaged anomalies in the vapor flux at 850 hPa for all simulations: (a) MRF; (b) YSU; (c) MYJ and (d) QNSE, distributed along the radius of Typhoon Mujigae. The contour line in the figures indicates zero.
Figure 9.
72-h-averaged anomalies in the vapor flux at 850 hPa for all simulations: (a) MRF; (b) YSU; (c) MYJ and (d) QNSE, distributed along the radius of Typhoon Mujigae. The contour line in the figures indicates zero.

Figure 10.
Cross-sections of 72-h-averaged anomalies in the vertical velocity produced by all PBL schemes: (a) MRF; (b) YSU; (c) MYJ and (d) QNSE along the radius of Typhoon Mujigae. The contour line in the figures indicates zero. Positive (negative) values indicate upward (downward) motion anomalies.

Figure 11.
ERA5 data and simulation of 72-h-averaged PBLH (m) along the radius of Typhoon Mujigae. The black dotted line indicates the radius of the inner core. ERA5 is shown in red; the MRF, MYJ, QNSE, and YSU schemes are shown in green, blue, orange, and purple, respectively.
Figure 11.
ERA5 data and simulation of 72-h-averaged PBLH (m) along the radius of Typhoon Mujigae. The black dotted line indicates the radius of the inner core. ERA5 is shown in red; the MRF, MYJ, QNSE, and YSU schemes are shown in green, blue, orange, and purple, respectively.

Figure 12.
Time series of the area-averaged PBLH in the (a) inner core and (b) outer region of Typhoon Mujigae. ERA5 is shown in red; the MRF, MYJ, QNSE, and YSU schemes are shown in green, blue, orange, and purple, respectively.
Figure 12.
Time series of the area-averaged PBLH in the (a) inner core and (b) outer region of Typhoon Mujigae. ERA5 is shown in red; the MRF, MYJ, QNSE, and YSU schemes are shown in green, blue, orange, and purple, respectively.

Figure 13.
Simulated azimuthally averaged radial (shaded) and tangential (contour) velocity (unit: m/s) at 00:00 on 4 October 2015 for all PBL schemes: (a) MRF; (b) YSU; (c) MYJ and (d) QNSE, at radius height.
Figure 13.
Simulated azimuthally averaged radial (shaded) and tangential (contour) velocity (unit: m/s) at 00:00 on 4 October 2015 for all PBL schemes: (a) MRF; (b) YSU; (c) MYJ and (d) QNSE, at radius height.


Table 1.
Configuration of WRF v4.0.1.
| Title 1 | Description |
|---|---|
| Initial and border conditions | FNL reanalysis |
| Model domain | D01: 408 × 323 × 40 D02:832 × 721 × 40 D03:829 × 703 × 40 (moving) |
| Central spot | (18.5°N, 113.5°E) |
| Horizontal resolution | 12 km; 4 km;1.33 km |
| Pressure at top level | 50 hPa |
| Number of vertical levels | 40 |
| Microphysics | WSM6 schemes |
| Cumulus Parameterization | Kain–Fritsch (turning off in D03) |
| Longwave radiation | RRTM |
| Shortwave radiation | Dudhia |
| Surface processes | Noah |
| PBL schemes | YSU scheme, MYJ scheme, MRF scheme, QNSE scheme |
Table 2.
Anomalies between the 72-h-averaged precipitation (mm) and GPM observations for each scheme.
Table 2.
Anomalies between the 72-h-averaged precipitation (mm) and GPM observations for each scheme.
| YSU | MRF | MYJ | QNSE | |
|---|---|---|---|---|
| Inner core | 33.6 | 1.1 | 52.9 | 95.7 |
| Outer region | −23.6 | −26.1 | −33.2 | −22.1 |
Table 3.
Differentials of different variables in the inner core and outer region of Typhoon Mujigae among the PBL schemes.
Table 3.
Differentials of different variables in the inner core and outer region of Typhoon Mujigae among the PBL schemes.
| Q850 | W | SHF | LH | Precipitation | ||
|---|---|---|---|---|---|---|
| Inner core | MRF | 31.6 | 1.4 | 136.4 | 1.1 | |
| YSU | 34.8 | 28.1 | 191.1 | 33.6 | ||
| MYJ | 33.9 | 55.8 | 211.0 | 52.9 | ||
| QNSE | 44.9 | 77.8 | 565.5 | 95.7 | ||
| Outer region | MRF | 7.5 | −6.9 | 65.5 | −26.1 | |
| YSU | 7.2 | 3.3 | 42.7 | −23.6 | ||
| MYJ | 6.3 | 4.9 | 18.9 | −33.2 | ||
| QNSE | 8.8 | 1.1 | 69.6 | −22.1 |
Notes: Q850 represents the vapor flux at 850 hPa; units: g/(cm/hPa/s). W represents the vertical velocity; units: m/s; SHF represents the sensible heat flux, and LHF represents the latent heat flux; units: W/m2. The above values were obtained by taking the difference between the PBL scheme simulations and observations based on GPM or ERA5 data for the corresponding variables.
Publisher’s Note: MDPI stays neutral with regard to jurisdictional claims in published maps and institutional affiliations. |
© 2022 by the authors. Licensee MDPI, Basel, Switzerland. This article is an open access article distributed under the terms and conditions of the Creative Commons Attribution (CC BY) license (https://creativecommons.org/licenses/by/4.0/).
Share and Cite
MDPI and ACS Style
Shen, W.; Lu, Z.; Ye, G.; Zhang, Y.; Chen, S.; Xu, J. Exploring the Impact of Planetary Boundary Layer Schemes on Rainfall Forecasts for Typhoon Mujigae, 2015. Atmosphere 2022, 13, 220. https://0-doi-org.brum.beds.ac.uk/10.3390/atmos13020220
AMA Style
Shen W, Lu Z, Ye G, Zhang Y, Chen S, Xu J. Exploring the Impact of Planetary Boundary Layer Schemes on Rainfall Forecasts for Typhoon Mujigae, 2015. Atmosphere. 2022; 13(2):220. https://0-doi-org.brum.beds.ac.uk/10.3390/atmos13020220
Chicago/Turabian StyleShen, Wenqi, Zebin Lu, Guilin Ye, Yu Zhang, Siqi Chen, and Jianjun Xu. 2022. "Exploring the Impact of Planetary Boundary Layer Schemes on Rainfall Forecasts for Typhoon Mujigae, 2015" Atmosphere 13, no. 2: 220. https://0-doi-org.brum.beds.ac.uk/10.3390/atmos13020220
Note that from the first issue of 2016, this journal uses article numbers instead of page numbers. See further details here.