Article

Signal Simulation of Dual-Polarization Weather Radar and Its Application in Range Ambiguity Mitigation

1
College of Electronic Engineering, Chengdu University of Information Technology, Chengdu 610225, China
2
Key Laboratory of Atmospheric Sounding, China Meteorological Administration, Chengdu 610225, China
3
Meteorological Observation Center, China Meteorological Administration, Beijing 100081, China
4
Meteorological Observation Center, Inner Mongolia Meteorological Service, Hohhot 010051, China
*
Authors to whom correspondence should be addressed.
Submission received: 21 February 2022 / Revised: 5 March 2022 / Accepted: 6 March 2022 / Published: 8 March 2022
(This article belongs to the Special Issue Radar Sensing Atmosphere: Modelling, Imaging and Prediction)

Abstract

:
In this paper, a dual-polarization weather radar echo signal simulation method is proposed for the evaluation of the performance enhancement of dual-polarization weather radar systems, the optimization of signal processing algorithms and the improvement of scanning strategies. The actual weather radar base data are used in the simulation as the reference weather scene, which avoids using a complex algorithm for weather modeling. Moreover, based on radar weather equations, the radar system parameters are added into the radar echo signal modeling to establish the relationship between the simulated echo signal and radar system. As a result, the final simulated echo signal not only shows both the time and frequency domain characteristics of the weather target, but also includes the effects of the important performance of the dual-polarization weather radar system. In addition, to evaluate the performance of range ambiguity mitigation using phase coding and batch working modes, two different simulation methods for the radar signal are established on the method above; one is for batch working mode with long-PRT (pulse repetition time) and short-PRT transmission and receiving, and the other is for phase-coded mode with phase-coded transmission and phase-uncoded receiving. Under the same weather scene, the observation of these two different methods of range ambiguity mitigation are simulated and compared. Results show that the performance of the phase coding mode for mitigating range ambiguity is better than that of the batch mode. Obviously, the simulation method can be used to directly show the observation of different algorithms for mitigation range ambiguity under the same weather process, and quickly compare and evaluate the algorithm’s performance, which is not possible for real radars.

1. Introduction

Dual-polarization weather radar is one of the most widely used and effective tools for the monitoring and early warning of disastrous weather. The main advantage of dual-polarization weather radar is that it can not only obtain the intensity and velocity information of the rainfall, but also increase the detection of polarization features, such as differential reflectivity (Zdr), differential phase ( φ d p ), and correlation coefficient ( ρ h v ( 0 ) ) [1]. The polarization data can be inverted into the microphysical structures, such as rainfall morphology and phase state, which provides rich information for quantitative rainfall measurement and early warning of disastrous weather [2].
With the rapid development of meteorological business toward higher precision, higher requirements have also been put forward for the system performance, processing algorithms, and working strategies of dual-polarization weather radar. However, for radar manufacturers or radar-using departments, to solve these problems, it is often necessary to produce radar equipment and then through long-term observation experiments, data acquisition, and data analysis to obtain the results of radar performance enhancement, signal processing algorithm optimization, and scanning strategy improvement on radar observation data. Compared with radar experiments, the radar echo simulation method can flexibly simulate different weather processes, different radar system parameters, different radar working modes, and different processing algorithms, which has the advantages of efficiency, shorter time, and fuller verification.
The existing radar echo simulation methods are mainly divided into two categories: generating an echo signal, or directly generating the spectral moment parameter and polarization parameter. Most of them are based on the physical characteristics of precipitation to simulate the spectral moment parameters and dual-polarization parameters. For example, E.N. Anagnostou et al. simulate the reflectivity, differential reflectivity, and differential phase of dual-polarization weather radar according to the space–time random model of raindrop size distribution [3]. The purpose of the simulation is to verify the relationship between the polarization parameters of dual-polarization weather radar and the actual rainfall physical characteristics by using the known raindrop distribution. Capson et al. proposed a more complex simulator based on physical properties, which generates weather signals with a given resolution volume by a coherent and additive antenna pattern (in azimuth) and pulse waveform (in range) [4]. Similarly, such feasibility studies have been performed for airborne radars [5] and polarimetric data assimilation [6]. This method can only simulate the polarization parameters of dual-polarization weather radar, and it cannot simulate the echo signal of dual-polarization weather radar and cannot establish the relationship with the parameters of the dual-polarization weather radar system.
However, for some signal processing techniques, such as phase-coded signal simulation [7,8], modeling of echo signals is required. Similarly, Feng et al. simulated the effect of degraded antenna pattern sidelobes based on simulation signals [9]. For echo signal simulation, the simulation method based on the Gaussian power model for Doppler weather radar is established, which can simulate the signal of single-polarization doppler weather radar based on echo power, radial velocity, and spectral width [10]. For dual-polarization weather radar echo signal simulation, David Schvartzman et al. proposed a novel dual-polarization weather radar echo simulation method, which can simulate the echo through the data collected by the WSR-88D radar [11]. However, the simulation methods cannot establish the relationship between the echo signal and the weather radar system parameters, and they cannot simulate the echo characteristics of the working mode of the weather radar.
To solve the above problems, this paper proposes a dual-polarization weather radar echo signal simulation method that takes the data of reflectivity, velocity, spectral width, differential reflectivity, differential phase, and correlation coefficient as the information of the weather scene. Moreover, the radar system parameters, such as radar wavelength, pulse width, and beam width, are added to the radar echo signal modeling to establish the relationship between the echo signal and radar system performance. Therefore, the simulated echo signal reflects both the time and frequency domain characteristics of the weather target, as well as the important performance of the dual-polarization weather radar system.
In dual-polarization weather radar applications, the maximum unambiguous range ( R m a x ) and the maximum unambiguous velocity ( V m a x ) of the radar are contradictory. If the radar wavelength is fixed, then R m a x and V m a x will be constrained by each other; when increasing one of them, it must lead to a decrease in the other, so R m a x cannot be increased infinitely. When the target is located outside R m a x , the radar will show the position of the target within R m a x , resulting in the target range being incorrect; usually, this phenomenon is called range ambiguity. The occurrence of range ambiguity in radar echoes can lead the forecaster to misjudge the location of rainfall areas, so measurements must be taken to mitigate the effects of range ambiguity. Current operational radars mainly use batch pulses [12] and phase coding techniques [13,14] to mitigate the effects of range ambiguity on the data. Moreover, in some new range ambiguity mitigation techniques, phase coding is used. For example, Zhang et al. combined phase coding methods with polarization techniques for removing the second trip echo and recovering the first trip echo [15]. In batch working mode, the radar transmits two types of pulses with different pulse repetition times (PRT). The long-PRT (PRT1) pulses are used to obtain the estimation of echo intensity (reflectivity) and position, while the short-PRT (PRT2) pulses are used to estimate the velocity. When transmitting PRT2 pulses, Vmax is large but Rmax is small, so range ambiguity mitigation may be required. The intensity and position information of PRT1 is used to fix whether the velocity estimation from PRT2 is from the first trip echo or the second trip, and decide the velocity estimation from PRT2 at the appropriate range location. The batch pulse technique can find the position of overlapping echo and mark the unrecoverable echo of the velocity and spectral width. The phase coding method is designed to modulate the phase of the transmitted pulse when the radar transmits, and then demodulate the phase from the received pulse using the known phase when the radar receives. The result is that the first trip echo is synchronized and the second trip echo is modulated, so that the first trip echo is recovered and the second trip echo is filtered out due to the property that the phase-incoherent signal behaves as noise in the spectrum. How can the effectiveness of the two mitigation range ambiguity techniques be compared? This requires the radar transmitter to work in two different modes, the signal processor to have two different algorithms of range ambiguous mitigation, and the experiment to do with the same weather scene. Due to the limitations of practical conditions, no similar comparative analysis of the two mitigation range ambiguity techniques has been seen in the literature before. In this paper, based on the previous dual-polarization weather radar echo simulation method, two different simulation methods for the radar signal are established on the method above; one is for the batch working mode with long-PRT and short-PRT transmission and receiving, and the other is for the phase-coded mode with phase-coded transmission and phase-uncoded receiving. Then, based on these methods, the radar echoes under the batch and phase coding working modes are simulated under the same reference weather scene, and the processing performance is directly compared after mitigated range ambiguity processing.

2. Methods

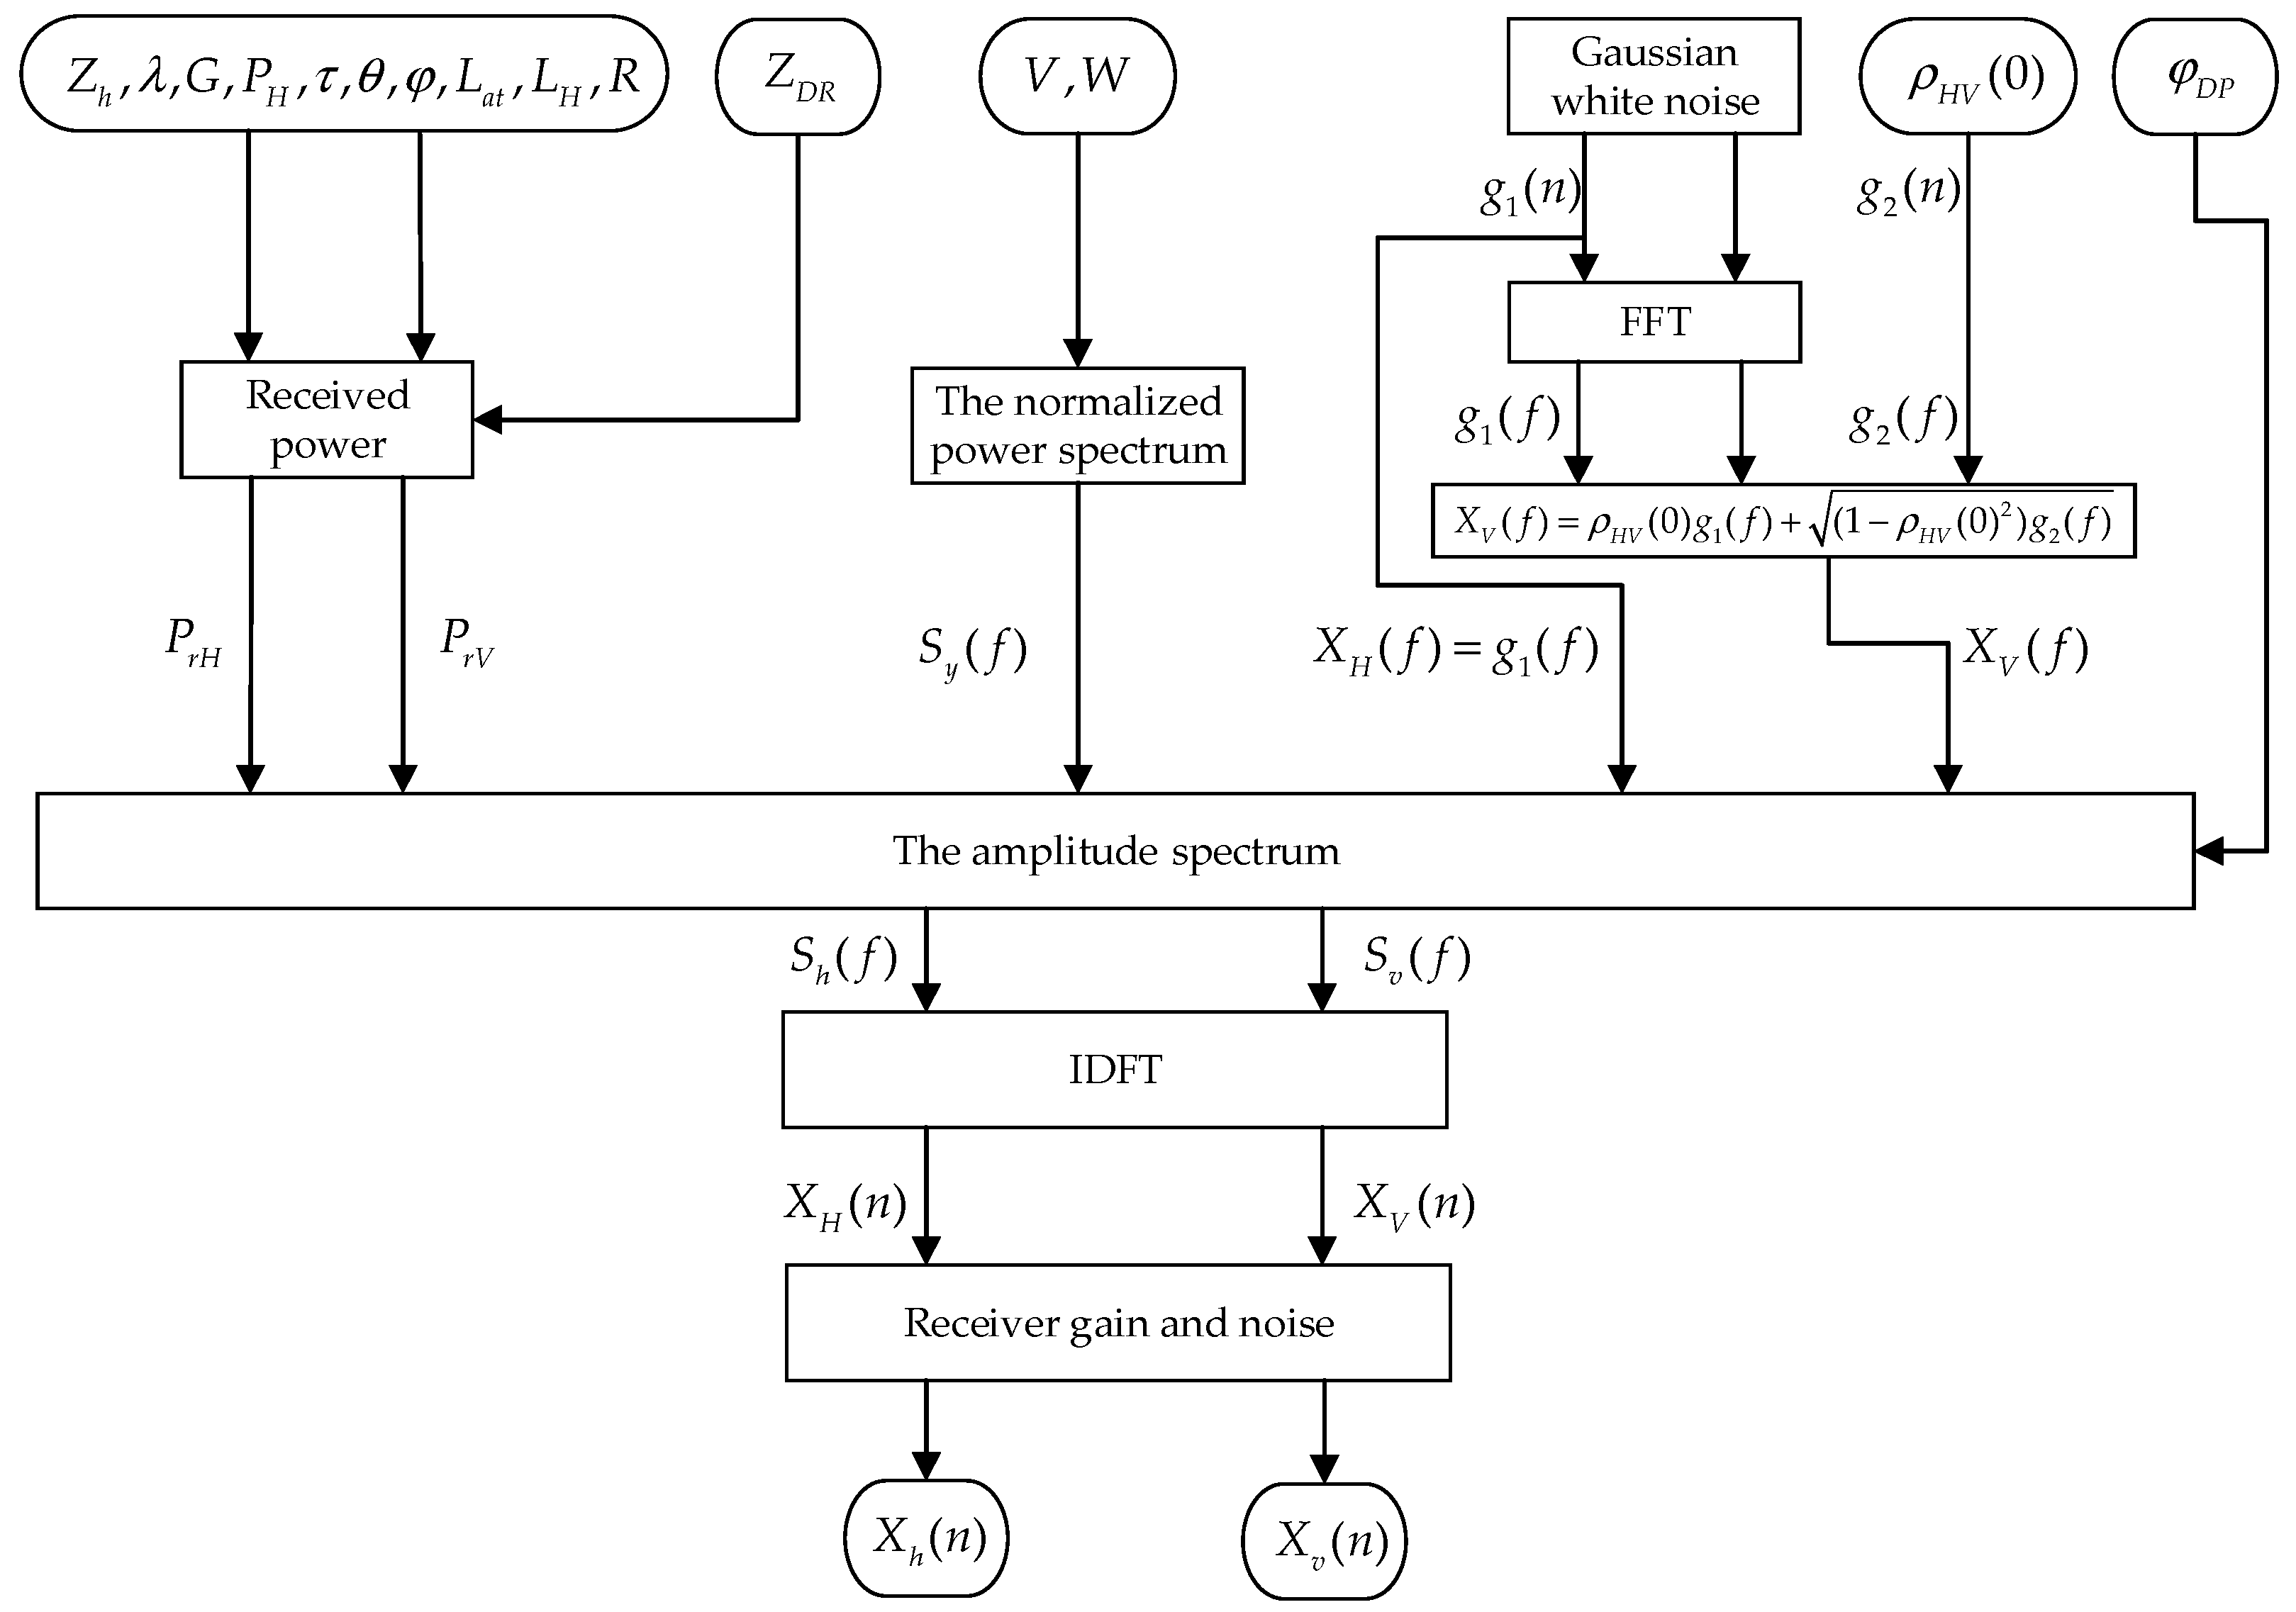
2.1. Simulation Algorithm of Dual-Polarization Weather Radar Echo Signal

The echo signal simulation method is based on the combination of both the Doppler weather radar echo signal generation method [16] proposed by Zrnic et al. and the correlation series generation method [17] proposed by Galati et al. On this basis, the weather radar base data are used as the reference scene to generate radar echoes with the desired weather characteristics. The base data collected by weather radar contain various weather target features, so using radar base data as the reference weather scene can avoid the complex mathematical modeling of weather features. In addition, the influence of the performance parameters of the dual-polarization weather radar system is added into the radar signal by the radar meteorological equations. The radar parameters include the transmit peak power, radar wavelength, pulse width, beam width, antenna gain, receive branch loss, transmit branch loss, noise coefficient, receiver gain, pulse repetition time, pulse accumulation number, etc. The peak transmitting power and antenna gain will affect the intensity of the target echo; the noise coefficient, receiver gain, and pulse number will affect the signal-to-noise ratio (SNR) of the echo; the pulse repetition time will affect the R m a x and V m a x of the radar, which may produce range ambiguity and speed ambiguity; the beam width and pulse width will affect the azimuth resolution and range resolution of the radar echo.
The dual-polarization weather radar echo signal simulation method in this paper are implemented through the following four steps. In the first step, the received power modeling of the horizontal−channel (H−channel) and vertical−channel (V−channel) echo signals is first established based on a radar meteorological equation and then, using the phase difference and correlation of the horizontal-/vertical-channel echo signals, will be taken into the normalized Gaussian spectral model in the second step to establish the power spectral model of the dual-channel echo signals with the required weather characteristics. Based on this, the mathematical model of the two-channel echo signal can be calculated in the third step. Finally, the effect of the radar reception performance index on the radar echo signal is also simulated and modeled in the fourth step.
(1)
Modeling of radar signal power
In this simulation, the signal power of the H−channel and the V−channel of the dual-polarization weather radar is calculated by the weather radar equation [12]. After conversion of the constants and their units in the radar meteorological equation, the power calculation equation of the H−channel echo signal is derived as follows:
  P r H = Z H 10 log 10 [ 2.69 × λ 2 P H τ θ φ ] + 2 × G 160 L H 20 log 10 ( R ) R × L a t 2 0 R A ( r ) d r
where P r H is the echo signal power of the H−channel, and its unit is d B m ; Z H is the reflectivity of the H−-channel of the weather radar, and the unit is d B Z ; λ is the radar wavelength in c m ; G is antenna gain in d B ; P H is the radar H−channel transmission peak power in k w ;   τ is the pulse width in μ s ; θ and φ are the horizontal beamwidth and the vertical beamwidth in degrees; L a t is atmospheric loss in d B / k m ;   L H is the total loss except L a t including the total feeder loss of the H−channel transmitting branch and the total loss of the H−channel receiving feeder branch, and the unit is dB , and R is the distance between the scatterer and the radar in km. A ( r ) is the attenuation coefficient of rainfall at the radar range r. The attenuation coefficient of rainfall is calculated by A ( r ) = a Z ( r ) b ; a and b are empirical constants. For C−band weather radar, a = 2.2 × 10 3 and b = 0.17 , and for X−band weather radar, a = 1.37 × 10 4 and   b = 0.779 .
Melniko et al. proposed that the differential reflectivity can be calculated from the differential value between the received power of the H−channel and V−channel [18]. This is also a common method for calculating the differential reflectivity. Therefore, the received power of the V−channel can also be back−calculated from the differential reflectivity. The calculation of P r V is as follows:
  P r V = Z H + Z d r 10 log 10 [ 2.69 × λ 2 P V τ θ φ ] + 2 × G 160 L V 20 log 10 ( R ) R × L a t 2 0 R A ( r ) d r
where P r V is the received power of the V−channel, and the unit is d B m . Z d r   is the differential reflectivity, and the unit is d B Z . L V is the total loss of the V−channel except for L a t , including the total feeder loss of the V−channel transmitting branch and the total loss of the V−channel receiving feeder branch in d B . Other parameters are consistent with Equation (1).
(2)
Power spectrum modeling of H−channel and V−channel echo signal
The spectral distribution of most precipitation echo signals is approximate to Gaussian distribution [19]. Therefore, the Gaussian spectrum model is selected as the normalized power spectrum of the echo signal. The calculation formula of power spectrum S y ( f ) is:
  S y ( f ) = 1 2 π σ f exp ( ( f f d ) 2 2 δ f 2 )
where σ f is the spectral width in the frequency domain, and the unit is Hz, σ f = 2 W / λ ; W is the spectral width in the velocity domain, i.e., the spectral width data in the radar base data, and the unit is m/s; f d is the Doppler frequency, and the unit is Hz, f d = 2 V / λ ; V is radar velocity, i.e., spectral width data in the radar base data, and the unit is m/s. Through velocity and spectral width, the power spectrum of echo signals can be established by Equation (3).
For the dual-polarization weather radar, the echo signals of the H−channel and V−channel not only contain the amplitude and phase information, but also contain the polarization information, such as the amplitude difference, phase difference, and correlation between the dual channels. Equation (3) has established the echo power spectrum model of a single channel, but it cannot reflect the polarization information. Therefore, the power spectrum model of Equation (3) needs to be improved.
First of all, the correlation coefficient ρ H V ( 0 ) is used to establish the correlation between the echo signals of the H−channel and V−channel for generating two mutually correlated pseudo-random signals [17]. Then, the received power of the echo signals of the H−channel and V−channel calculated by Equations (1) and (2) is brought into Equation (3), so that the echo signals of the H−channel and V−channel have the appropriate power ratio. Finally, the differential phase is brought into Equation (3) to obtain the correct phase difference for the two-channel signal. Therefore, the improved echo signal amplitude spectrum (the square of power spectrum) can be obtained.
The amplitude spectrum model equations of the echo signal in the H−channel and V−channel are expressed as:
  S h ( f ) = 10 ( P r H 10 ) [ S y ( f ) X h ( f ) ] [ S y ( f ) X h ( f ) ] exp ( i · p h ( f ) )
    S v ( f ) = 10 ( P r V 10 ) [ S y ( f ) X v ( f ) ] [ S y ( f ) X v ( f ) ] exp ( i · p h ( f ) ) exp ( i · φ d p )
In Equations (4) and (5), f = p r f 2 + p r f · k 2 , k = 1 , 2 , , N , N is the accumulation number of radar transmission pulses, p r f is the pulse repetition frequency in H z ; φ d p is the difference propagation phase in degrees; p h ( f ) is the random phase, where the unit is radians. X h ( f ) and X v ( f ) are the randomization noise of the power spectrum of the H−channel and V−channel, and the relationship between them is
  X h ( f ) = g 1 ( f )
  X v ( f ) = ρ H V ( 0 ) g 1 ( f ) + 1 ρ H V ( 0 ) 2 g 2 ( f )
where g 1 ( f ) is the Fourier transform of the Gaussian and white complex sequence with a zero average value in the H−channel; g 2 ( f ) is the Fourier transform of the Gaussian and white complex sequence with a zero average value in the V−channel, and g 1 ( f ) and g 2 ( f ) are independent. ρ H V ( 0 ) is the zero-lag correlation coefficient, which is the correlation coefficient of the polarization parameter data of the dual-polarization weather radar.
(3)
Time-domain generation of echo signal for H−channel and V−channel
The mathematical formula of echo signal generation in the H−channel and V−channel is expressed as:
  x H ( n ) = I H ( n ) + j · Q H ( n ) = i = 1 N S H ( f ) exp ( j 2 π n i N )
  x V ( n ) = I V ( n ) + j · Q V ( n ) = i = 1 N S V ( f ) exp ( j 2 π n i N )
n = 1 , 2 , , N , indicating the serial number of each radial pulse.
(4)
Modeling of the effect of radar receiver noise and gain into radar signal
For the actual weather radar echo signal, the radio frequency signal is first received at the antenna end, and then to the radar receiver. The echo power calculated by Equations (8) and (9) is equivalent to the echo power received by the actual radar at the antenna end, so it is necessary to add the receiver channel noise and gain in the simulation signal. In order to simulate the characteristics of receiver channel noise and channel amplification gain, the receiver noise is used to calculate the receiver noise equivalent power in the simulation, and the receiver channel gain is used to calculate the power increase of the echo signal in the process of the receiver channel to the digital intermediate frequency.
The mathematical formulas of time-domain echo signal generation of the H−channel and V−channel considering receiver channel noise and amplification gain are as follows:
  s h ( n ) = G h ( x h ( n ) + P h n · s h n ( n ) )
  s v ( n ) = G v ( x v ( n ) + P v n · s v n ( n ) )
where G h and G v are the receiver channel gain of the H−channel and V−channel, respectively; s h n ( n ) and s v n ( n ) are Gaussian random noise, which is used to represent the receiver noise of the H−channel and V−channel. P h n and P v n are the receiver noise power values of the H−channel and V−channel, respectively. The relationship between the receiver noise coefficient and receiver noise power values is as follows:
  P h n = k T 0 B n F h
  P v n = k T 0 B n F v
where k = 1.378 × 10 23   ( J / K ) is the Boltzmann constant, T 0 is the normal atmospheric temperature, B n is the radar receiver bandwidth, and F h and F v are the receiver noise figures of the H−channel and V−channel.
With steps (1) to (4) above, a dual-polarization weather radar echo signal simulation with the input of six radar base data ( Z h ,   V ,   W ,   Z D R ,   φ D P ,   ρ h v ) as the reference scene is implemented. In addition, in the simulation, the quantitative calculation of important radar parameters, such as peak transmitting power, radar wavelength, pulse width, beamwidth, antenna gain, receiving branch feeder loss, transmitting branch feeder loss, noise coefficient, receiver gain, pulse repetition frequency, and pulse accumulation number, is added. This will make the generated echo signal not only simulate the time domain and frequency domain characteristics of weather targets but also simulate the important performance of the weather radar system. The formula flow chart in Figure 1 gives a detailed overview of the input and output data flow of the simulation algorithm.

2.2. Batch Work Mode and Phase-Encoded Work Mode Echo Signal Simulation

The existing dual-polarization weather radar mainly uses batch working mode and phase encoding working mode to mitigate the range ambiguity problem. However, the limitation of radar practical conditions makes it impossible to compare the two modes for the same weather process to mitigate the range ambiguity effect. Thus, if the batch work mode and phase-encoded work mode can be implemented in the form of a simulation for the same moment in the weather scene, it will provide a more reliable basis for the qualitative evaluation of both work modes.

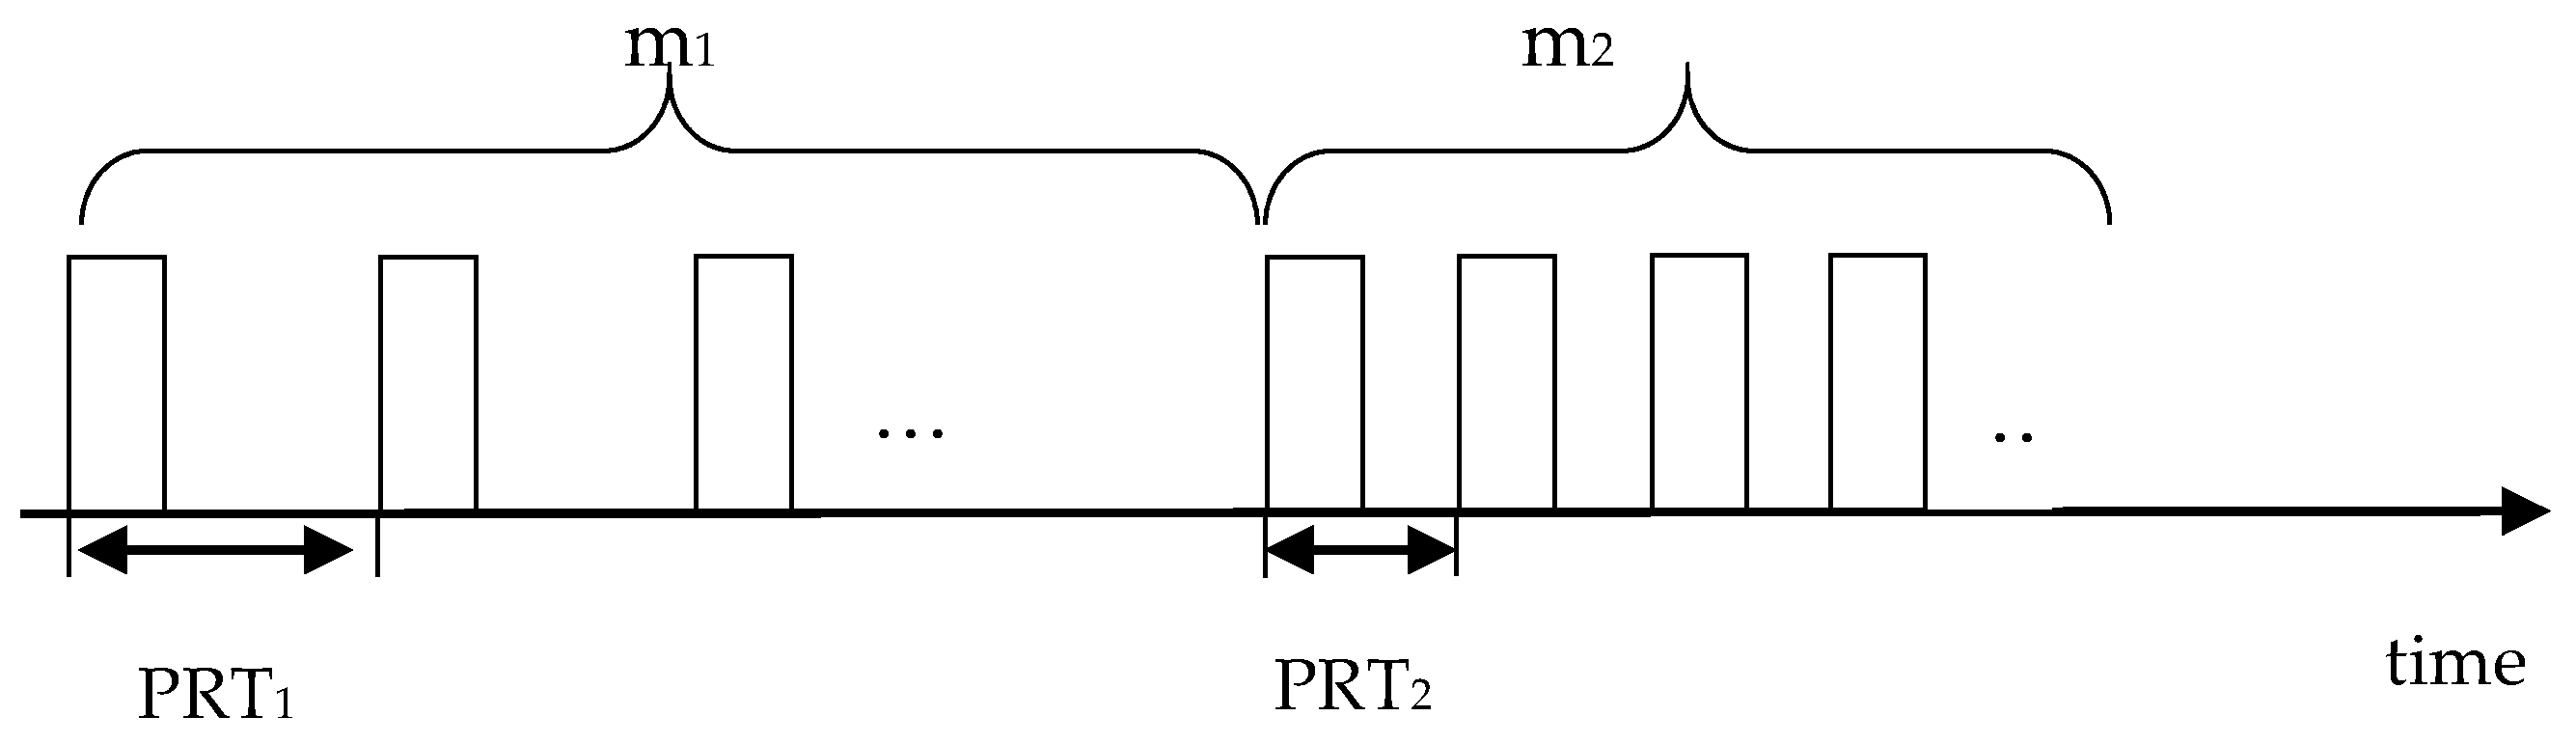
2.2.1. Batch Working Mode Echo Simulation Modeling

The pulse transmission process using batch working mode [20] is shown in Figure 2: first, a group of long-PRT (PRT1) pulses are transmitted to obtain the estimation of echo intensity (reflectivity) and position; then, a group of short-PRT (PRT2) pulses are transmitted to obtain the estimation the Doppler velocity. When transmitting PRT2 pulses, Vmax is large but Rmax is small, so range ambiguity mitigation may be required. The intensity and position information of PRT1 is used to fix whether the velocity estimation from PRT2 is from the first trip echo or the second trip one, and decide the velocity estimation from PRT2 at the appropriate range location.
In view of echo signal generation, first, the m1 long-PRT (PRT1) pulses are generated; then, the m2 short-PRT (PRT2) pulses are generated (PRT1 > PRT2). Thus, the echo signal of a range gate is combined from PRT1 and PRT2 pulses. The same method is used for each range gate until the entire scan is simulated. The flow of the echo signal simulation in batch work mode is as follows.
First, when the pulse repetition time is PRT1, a radial echo signal can be obtained by using the simulation method mentioned in Section 2.1. When the pulse repetition time is PRT2, because R m a x becomes small, range ambiguity usually easily occurs; thus, it is necessary to discuss whether the echo will have range folding according to the current echo range location, and to calculate the echo position of range folding.
The range folding position of the echo signal is as follows:
  R t = R K R m a x , K = 0 , ± 1 , ± 2
In Equation (14), R is the actual position of the echo, R t is the position after the radar produces range folding, and K is the value of range folding times. When R < R m a x , the K value is 0, R t = R ; when R m a x < R < 2 R m a x , the K value is 1, R t = R R m a x . Sometimes, the K value is 2 or the K value is more than 2; the positions of the echo can be calculated based on the K value.
In the simulation, the echo signal time-domain addition method is used to simulate the ambiguity process. If the range position R 1 ( R < R m a x ) and the range position R 2 ( R m a x < R < 2 R m a x ) are at the same azimuth angle, the R t through Equation (14) is simply equal to R 1 . In this case, the echo signal of the position R1 will become the addition of the position R1 and R2. The formula of the echo signal is as follows:
  s h , P R T 2 ( n ) = s h , P R T 2 ( n , R 1 ) + s h , P R T 2 ( n 1 , R 2 ) , n = m 1 + 1 : m 1 + m 2
where s h , P R T 2 ( n , R 1 ) and s h , P R T 2 ( n 1 , R 2 ) represent the original echo signal of the position R 1 and R 2 . This signal is generated by Equations (10) and (11), and n represents the current pulse; n − 1 represents the last pulse. Moreover, when s h , P R T 2 ( n , R 2 ) is generated, the power attenuation range in Equation (1) should use R2 for calculation, not the folded range R t . The ambiguity mitigation signal calculation equation of the V−channel is similar.
Therefore, in the batch working mode, the echo signals of the H−channel and V−channel of a range gate can be expressed by the following mathematical formulas:
  S h ( n ) = { S h , P R T 1 ( n ) ,   n = 1 : m 1 S h , P R T 2 ( n ) ,   n = m 1 + 1 : m 1 + m 2
  S v ( n ) = { S v , P R T 1 ( n ) ,   n = 1 : m 1 S v , P R T 2 ( n ) ,   n = m 1 + 1 : m 1 + m 2
where S h , P R T 1 ( n )   and S h , P R T 2 ( n ) are signal sequences under PRT1 and PRT2.

2.2.2. Phase-Coded Mode Echo Simulation Modeling

The theory of the weather radar phase encoding technique [21] is to modulate the transmitted pulse with the sequence a k = exp ( j · ψ k ) , which means adding ψ k to the phase of the transmitted pulse sequence. The received echo signal is restored by multiplication with a k , i.e., the phase of the received sequence decreases by ψ k . Thus, the first trip echo is synchronized, and the second trip echo is modulated by c k = a k 1 a k , R2(1) = 0. The echo signal can also be multiplied by a k 1 to synchronize the second trip echo, and the first trip echo is modulated by c k = a k 1 a k , R1(1) = 0. Therefore, the phase-coded working mode can be used to separate R1(1) and R2(1), and then the velocity of the first and second trip echoes can be estimated.
In the weather radar poly-pulse-pair (PPP) algorithm, the Doppler velocity is estimated by the phase of the first-order self-correlation R(1) of the echo signal. When the echo S(n) contains first trip echo S1(n) and second trip echo S2(n), R(1) can be described with the sum of the self-correlation functions of the first and second trip echoes, as shown in formula (18).
  R ( 1 ) = E [ S ( n ) S ( n + 1 ) ] = E { [ S 1 ( n ) + S 2 ( n ) ] [ S 1 ( n + 1 ) + S 2 ( n + 1 ) ] }
In most cases, the first and second trip echoes are not related or their correlation is very small, so R(1) can be expressed as:
  R ( 1 ) = E [ S 1 ( n ) S 1 ( n + 1 ) + S 2 ( n ) S 2 ( n + 1 ) ] = R 1 ( 1 ) + R 2 ( 1 )
and when using R(1) to calculate the velocity of the first or second trip echoes, it will inevitably cause an error in velocity estimation. The purpose of phase-coded working mode is to modulate the phase of the first and second trip echoes, so that R1(1) = 0 or R2(1) = 0.
Therefore, the flow of the echo signal simulation in phase coding working mode is as follows.
Similar to the batch working mode, the SZ(8/64) phase coding working mode also uses long-PRT and short-PRT for working, respectively. The difference is that the phase encoding working mode needs to modulate the phase of the transmitted pulse when working with the short PRT. It first uses the long PRT to work 360 ° at a certain elevation angle, and then immediately switches to the encoded short PRT to work 360 °   at the same elevation angle. The simulation of the echo signal in SZ(8/64) phase coding mode includes two algorithms: (1) long-PRT (PRT1), echo signal without phase coding; (2) short-PRT (PRT2), SZ(8/64) phase coding. The simulation of PRT1 is similar to the batch mode when the pulse repetition time is PRT1, and the echo simulation is used for all the range gates in the whole scanning process.
The simulation algorithm of PRT2, SZ (8/64) phase coded echo signal is as follows:
(a)
First, the echo signal sequences S h , P R T 2 ( n ) and S v , P R T 2 ( n ) of the H−channel and V−channel of a single range gate are generated according to the echo signal simulation algorithm in Section 2.1.
(b)
Second, the phase modulation of s h ( n ) and s v ( n ) is formulated as follows:
  s 1 h , P R T 2 = s h ( n ) · exp ( j k = 0 N m π k 2 M ) ,   n = 1 , 2 , N
    s 1 v , P R T 2 = s v ( n ) · exp ( j k = 0 N m π k 2 M ) ,   n = 1 , 2 , N
where m and M are phase encoding parameters. Weather radar often uses SZ(8/64) coding for modulation output, namely m = 8, M = 64. The phases in Equations (20) and (21) change repeatedly with a period of 8, and the 8 duplicate phases are −0, −π/8, −4π/8, −9π/8, 0, −9π/8, −4π/8, −πh/8.
(c)
Third, the range folding judgment and folding position calculation are used for each range gate, which is consistent with the PRT2 working in the batch working mode. Thus, the additional echo signal of the position R1 and R2 is calculated as follows:
  s 1 h , P R T 2 ( n ) = s 1 h , P R T 2 ( n , R 1 ) + s 1 h , P R T 2 ( n 1 , R 2 ) ,   n = 1 , 2 , N
  s 1 v , P R T 2 ( n ) = s 1 v , P R T 2 ( n , R 1 ) + s 1 v , P R T 2 ( n 1 , R 2 ) ,   n = 1 , 2 , N
(d)
Finally, other range gates’ echo signals are generated according to the above (a)–(b) process until the entire scan is simulated.

3. Results

This section gives the simulation results of the algorithms in the Method section and analyzes the results using qualitative evaluation and quantitative analysis. First, the accuracy of the dual-polarization weather radar signal simulation algorithm model is verified by (1) analyzing whether the echo signal obtained from the simulation has the time–frequency characteristics of the weather target; (2) putting the simulation echo signal through the signal processing algorithm to estimate the base data and making a quantitative comparison with the reference scene base data; (3) presenting the simulation base data in the form of a plan position indicator (PPI) and performing a qualitative assessment with the reference scene base data PPI; (4) making a quantitative comparison between the simulation base data scene and the reference scene through calculating the standard deviation. Then, the range ambiguity mitigation effects of the batch and phase coding working modes are verified: (1) qualitative evaluation of the effectiveness of both working modes in mitigating range ambiguity for the same weather process using PPI plots; (2) quantitative analysis of both working modes by the percentage of the area where the range ambiguity mitigation algorithm is ineffective and effective; (3) quantitative analysis of both working modes by the standard deviation of the effective area of the algorithm and the corresponding area of the reference scene data.

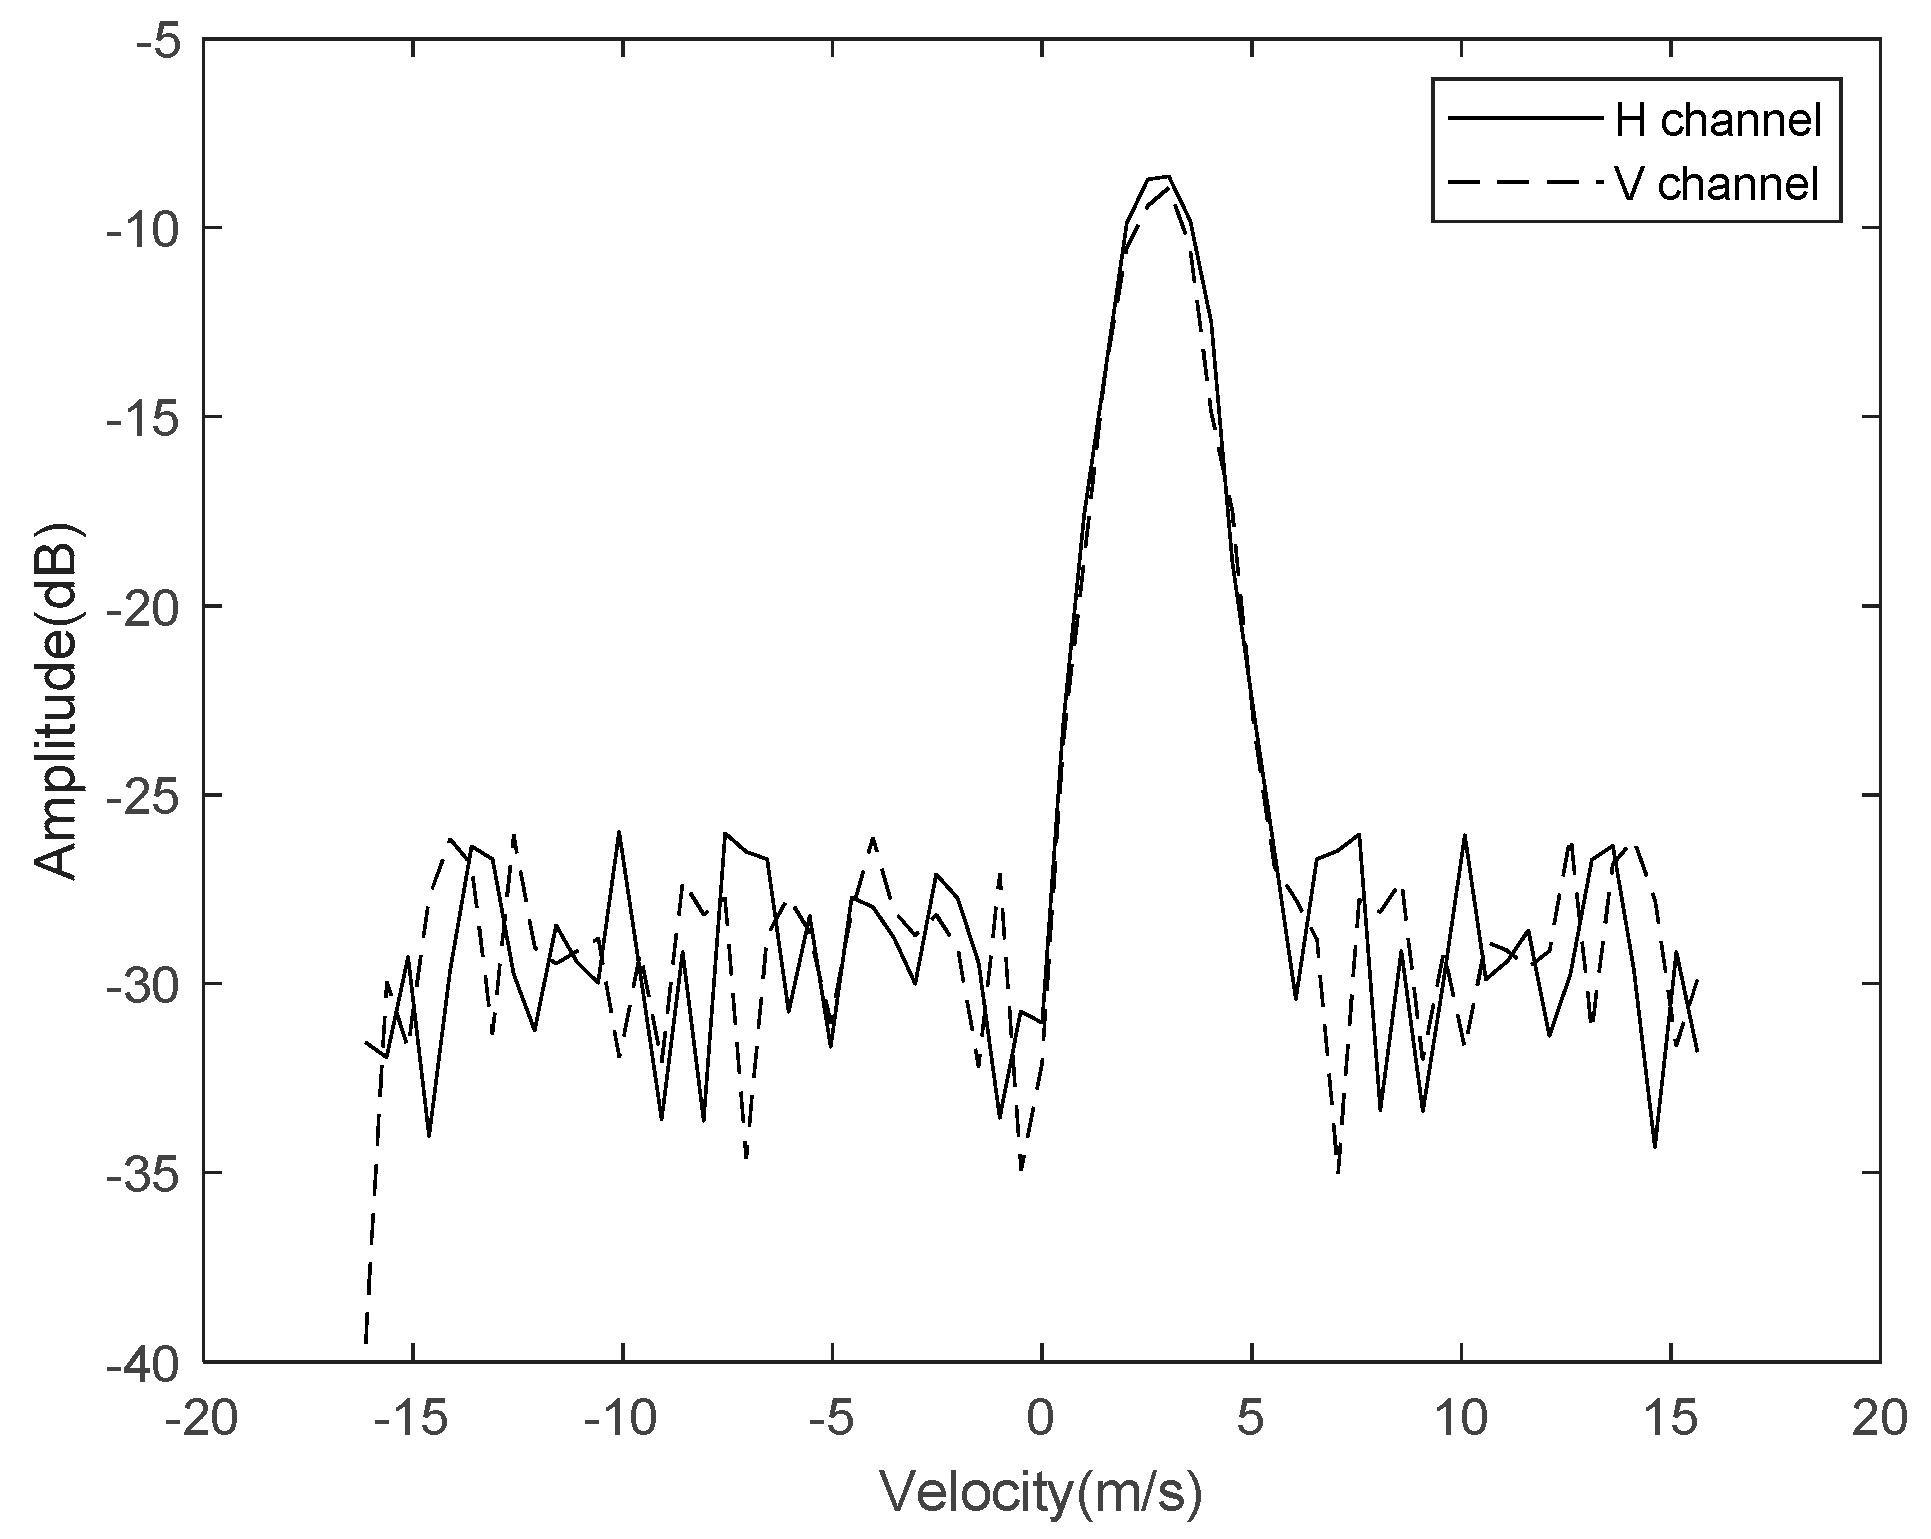
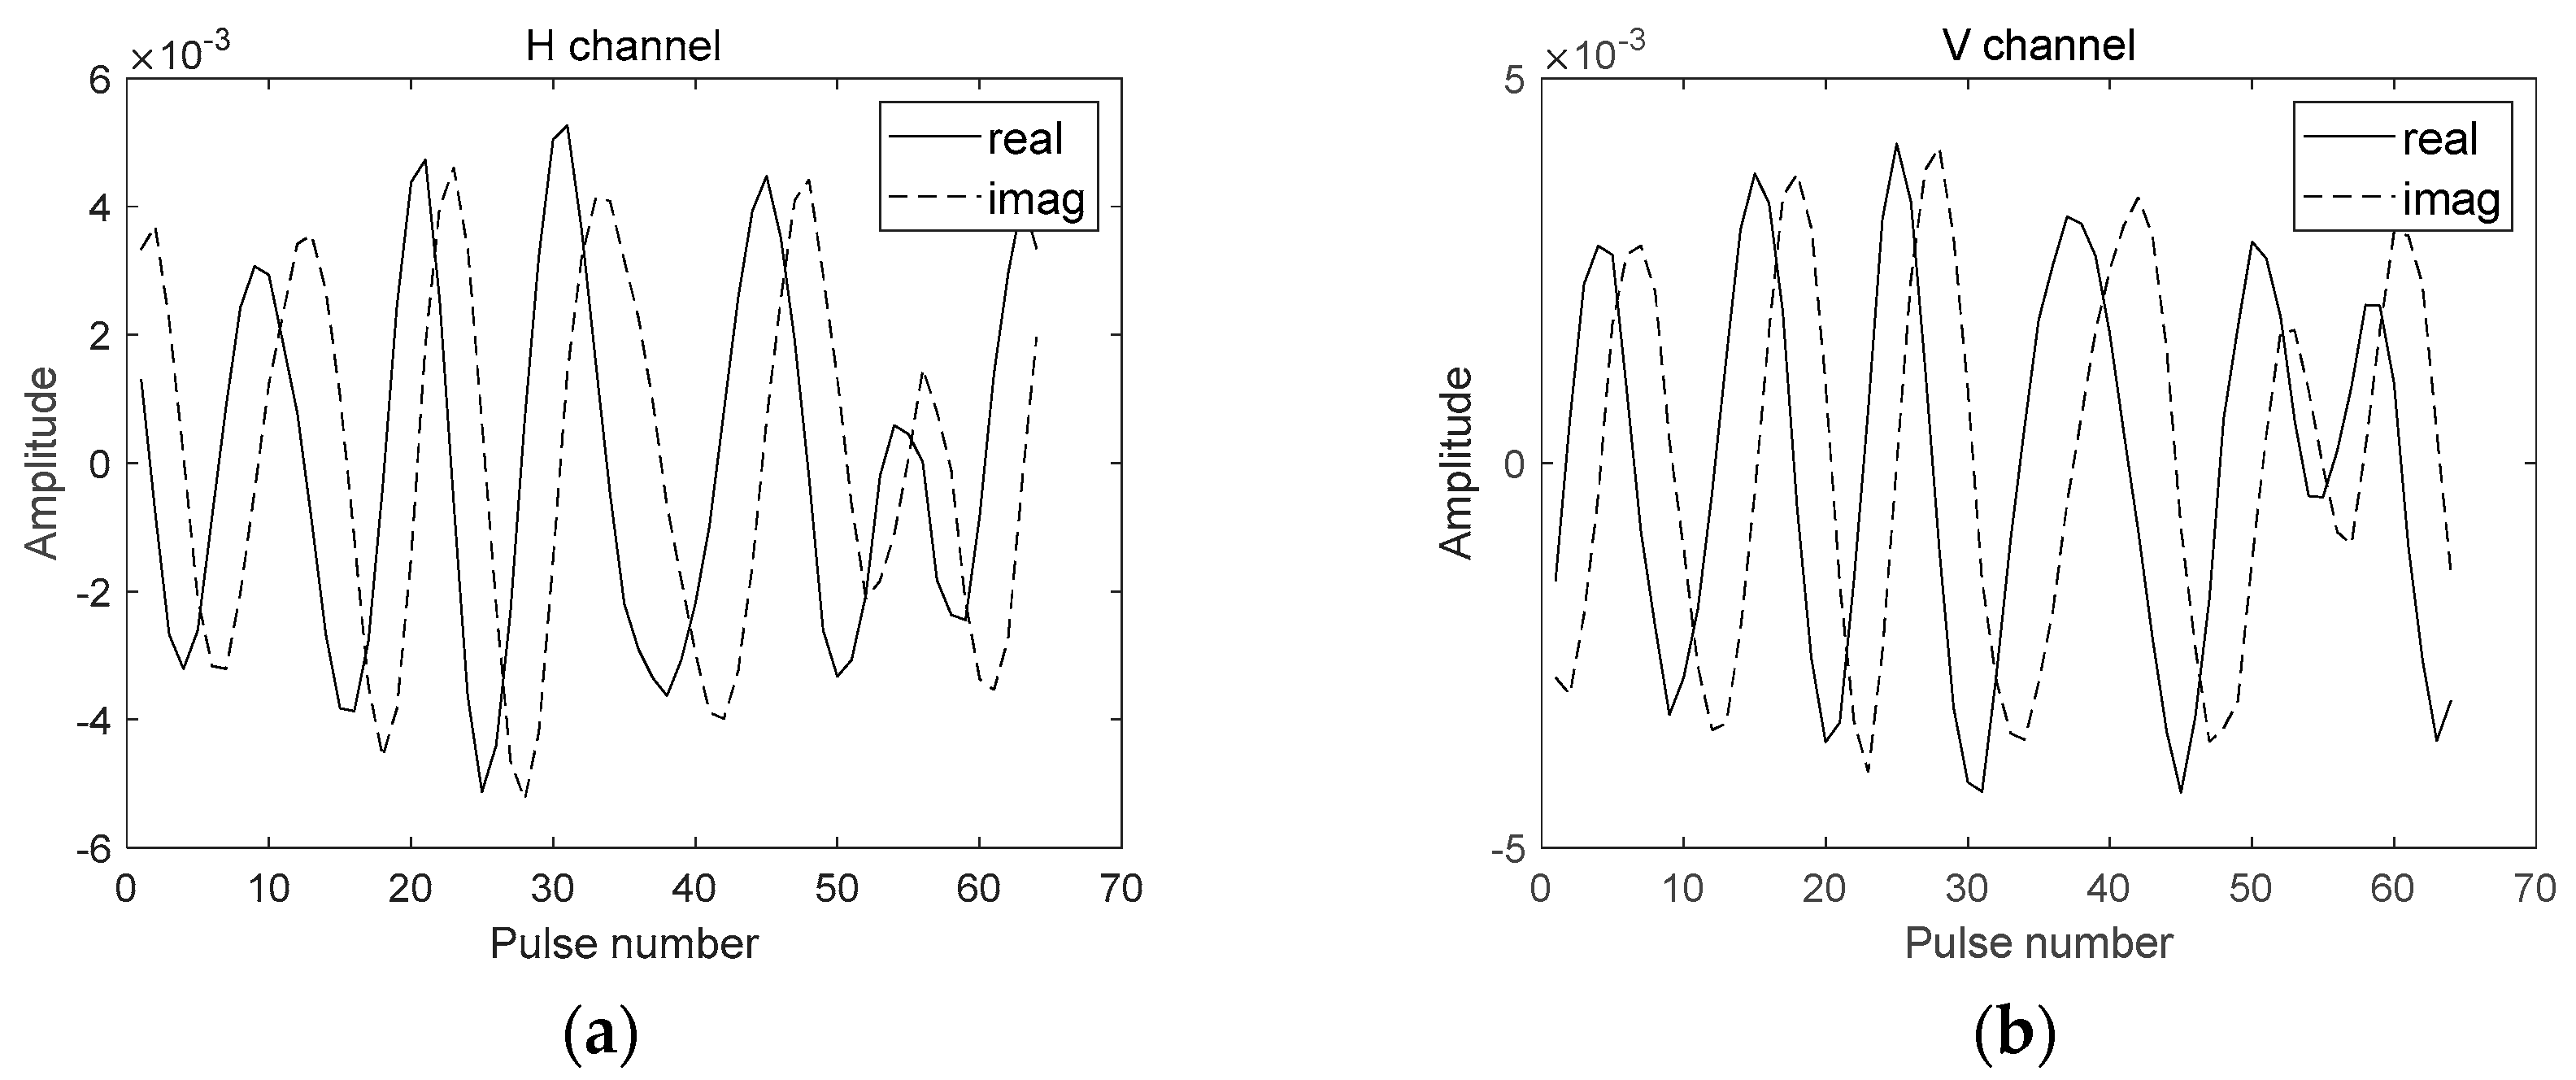
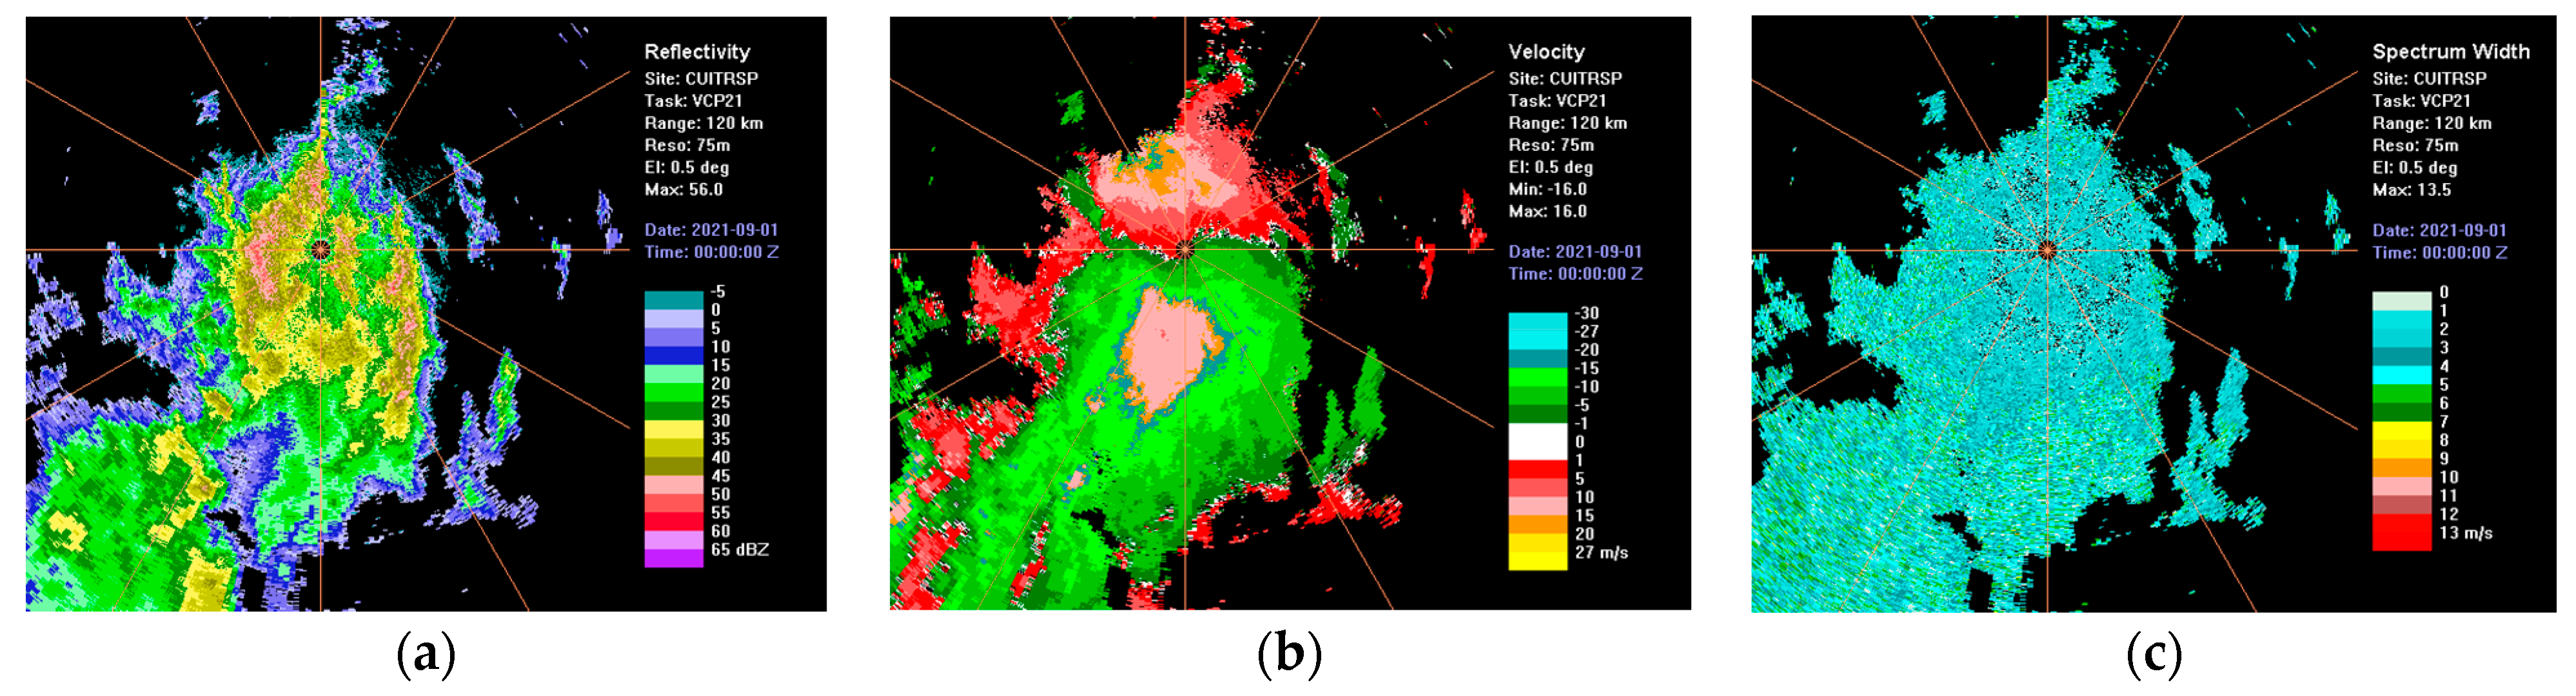
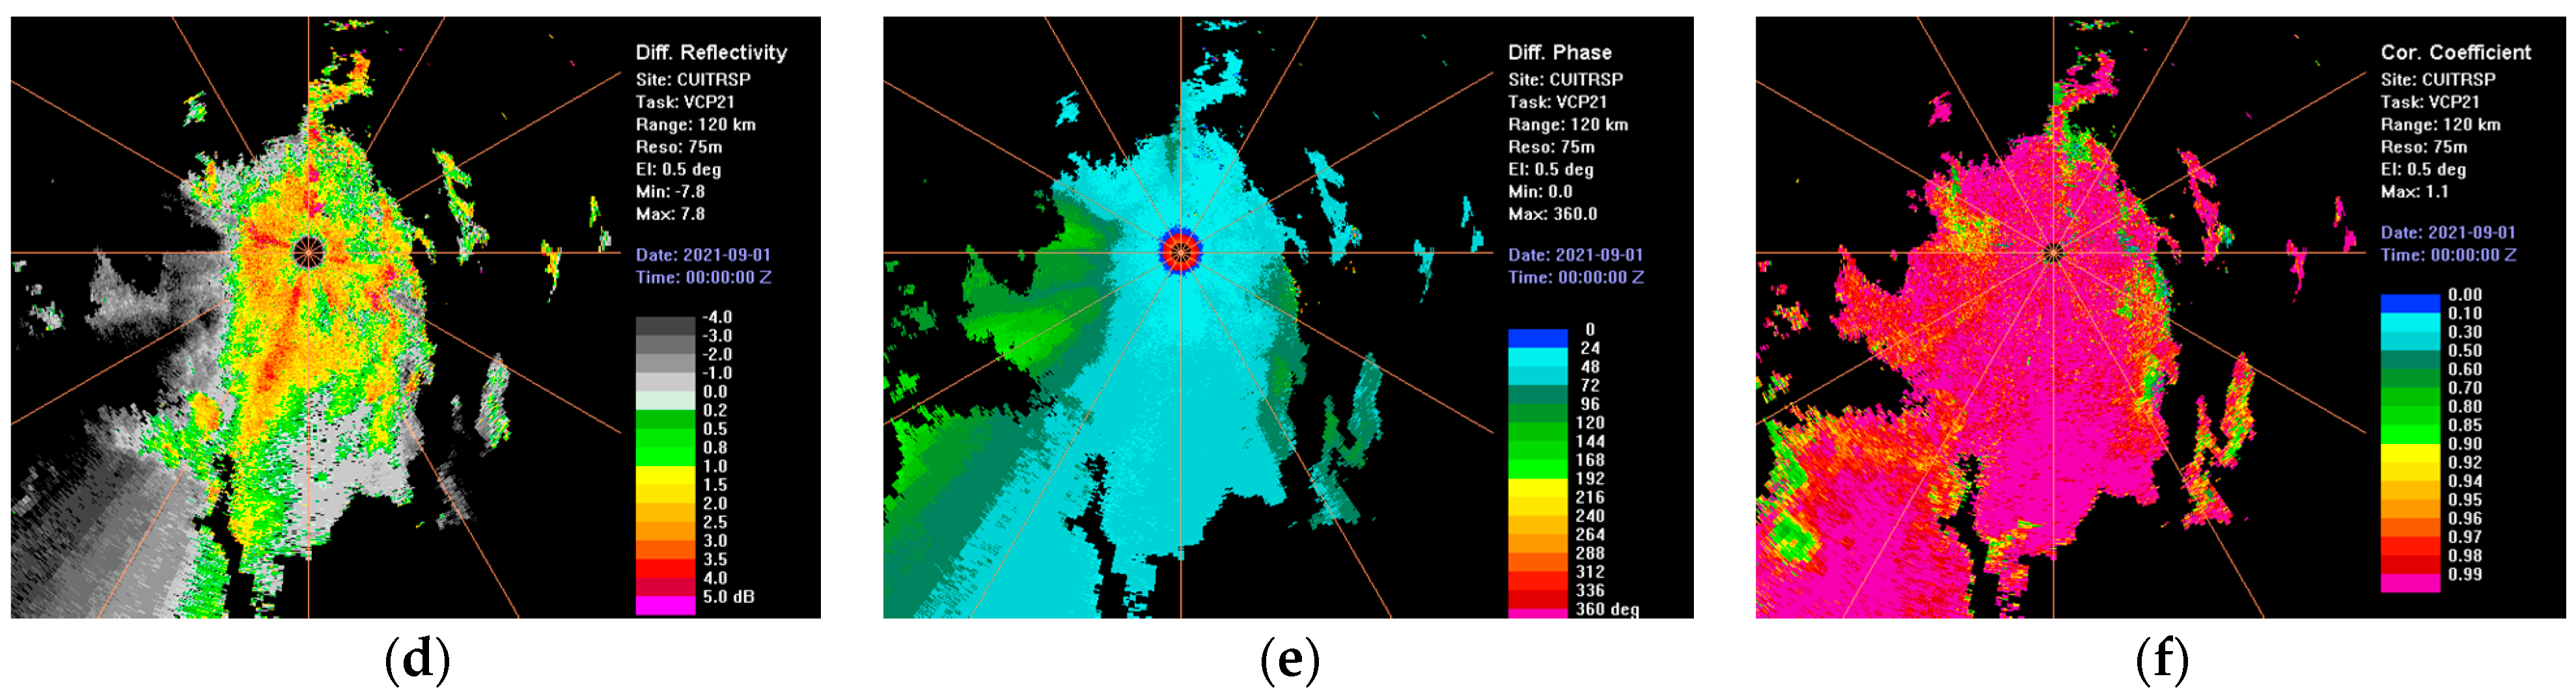
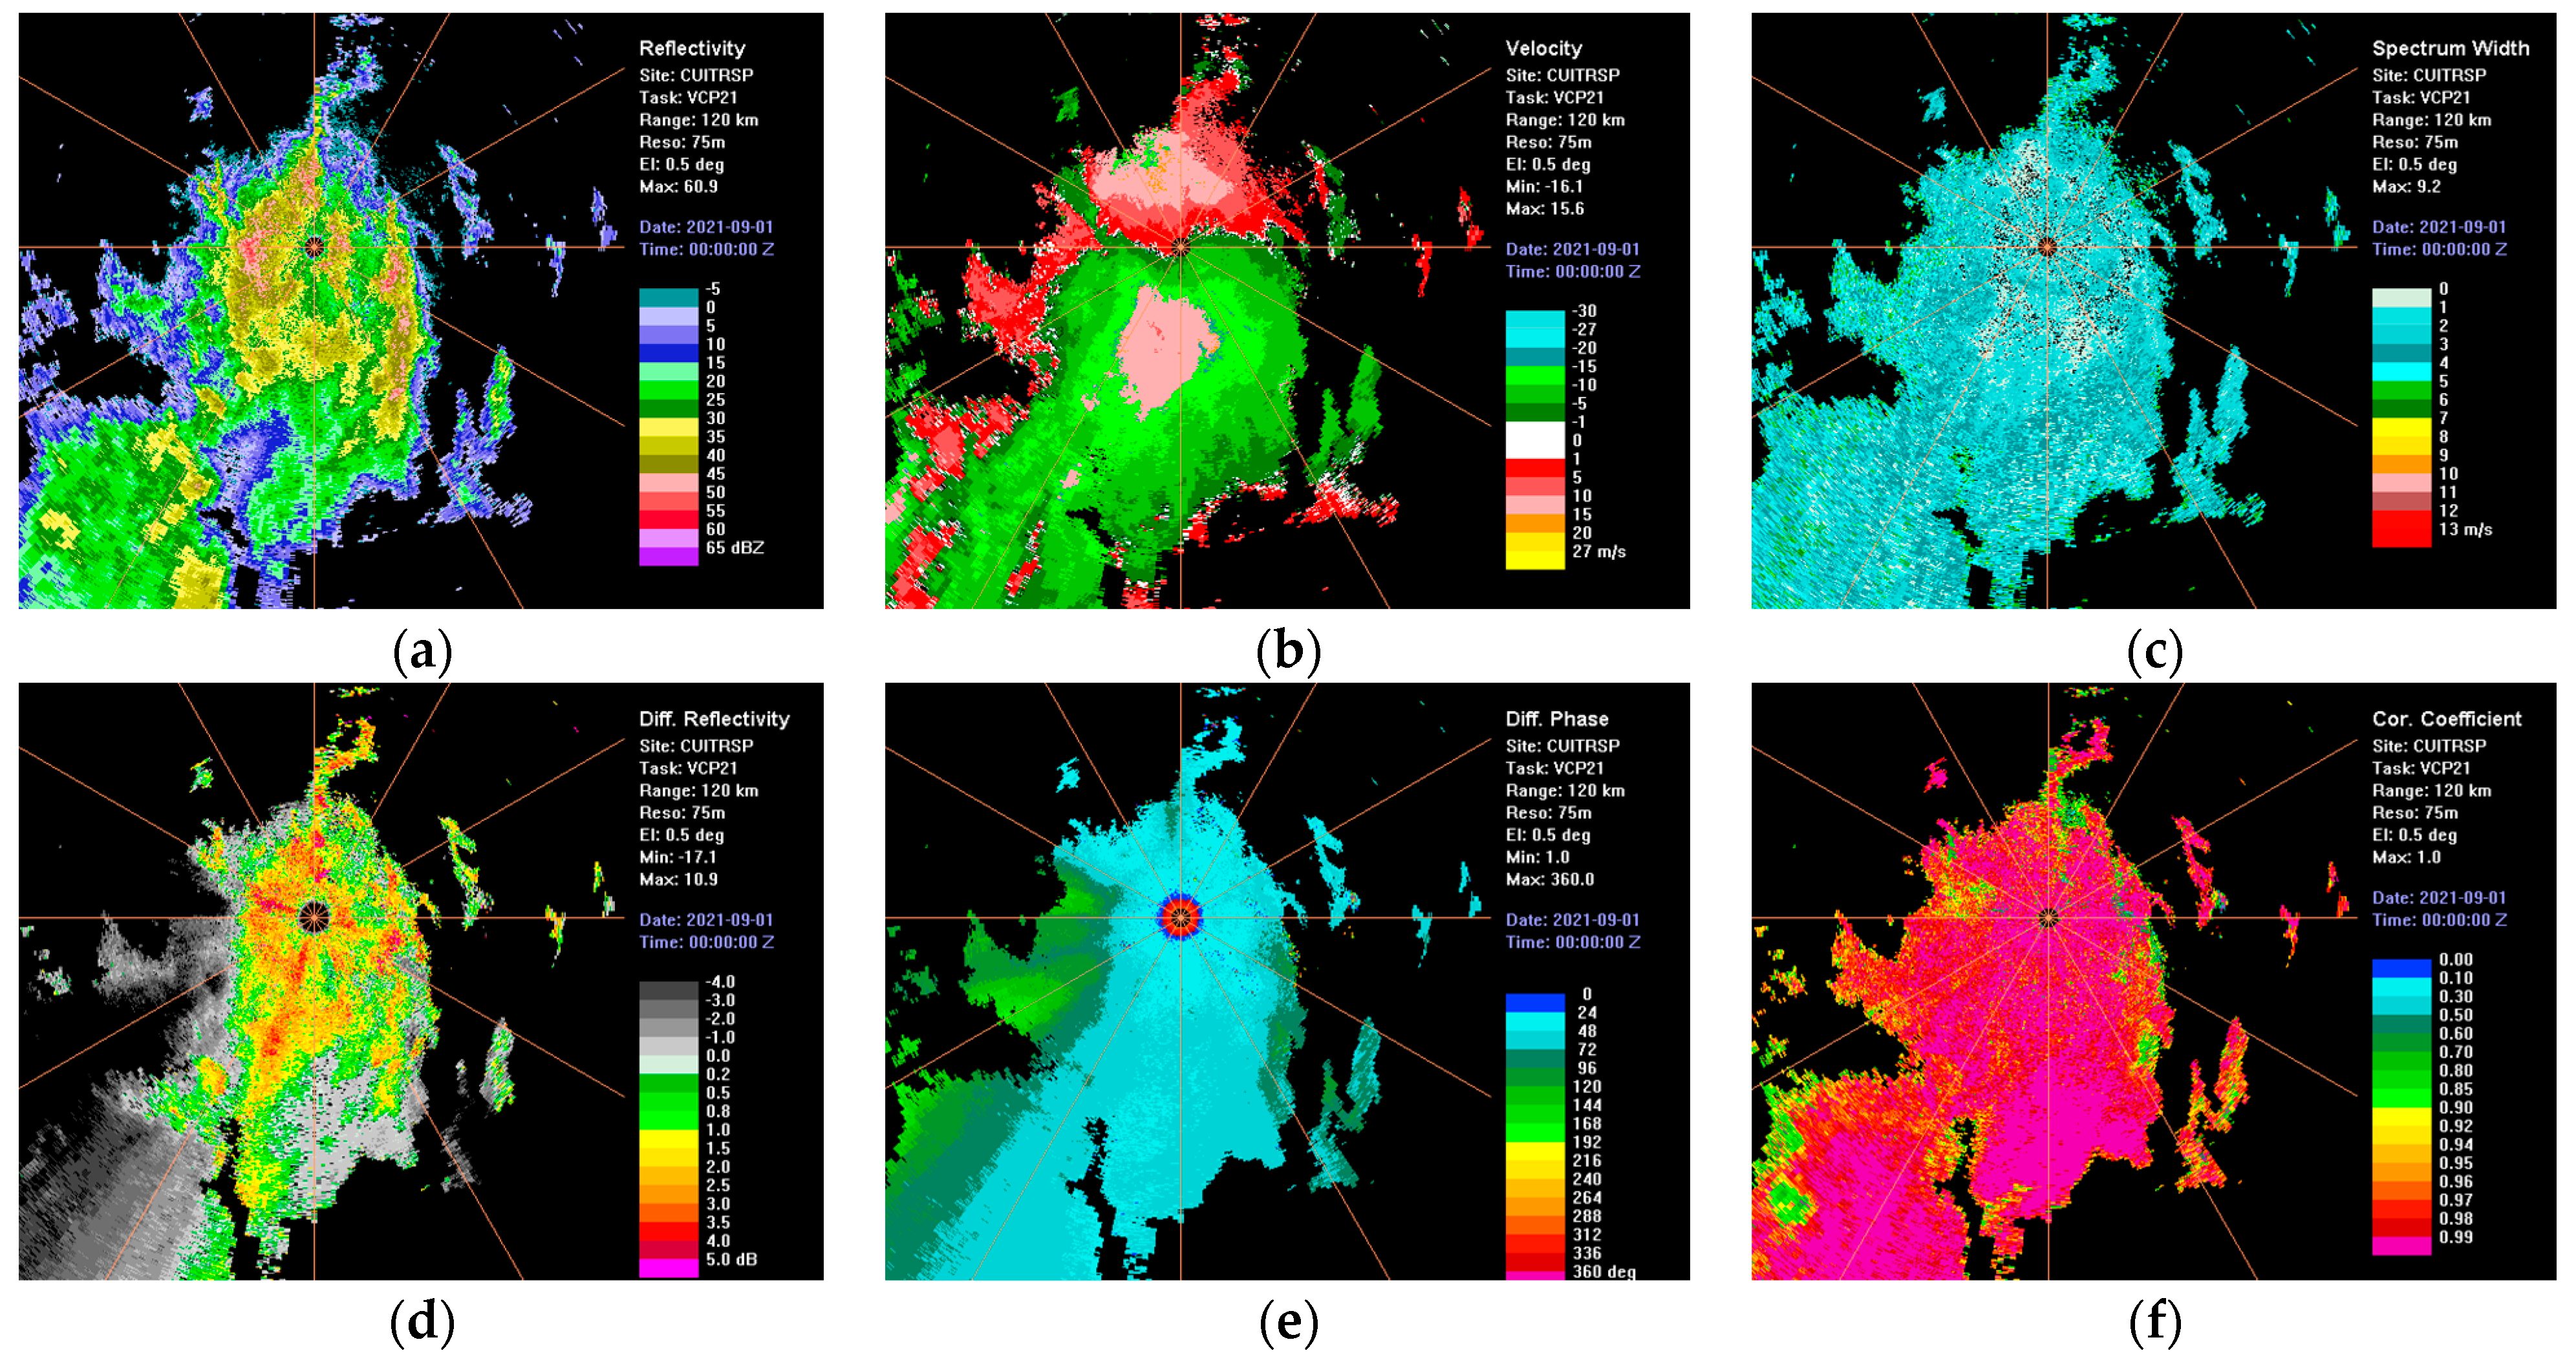
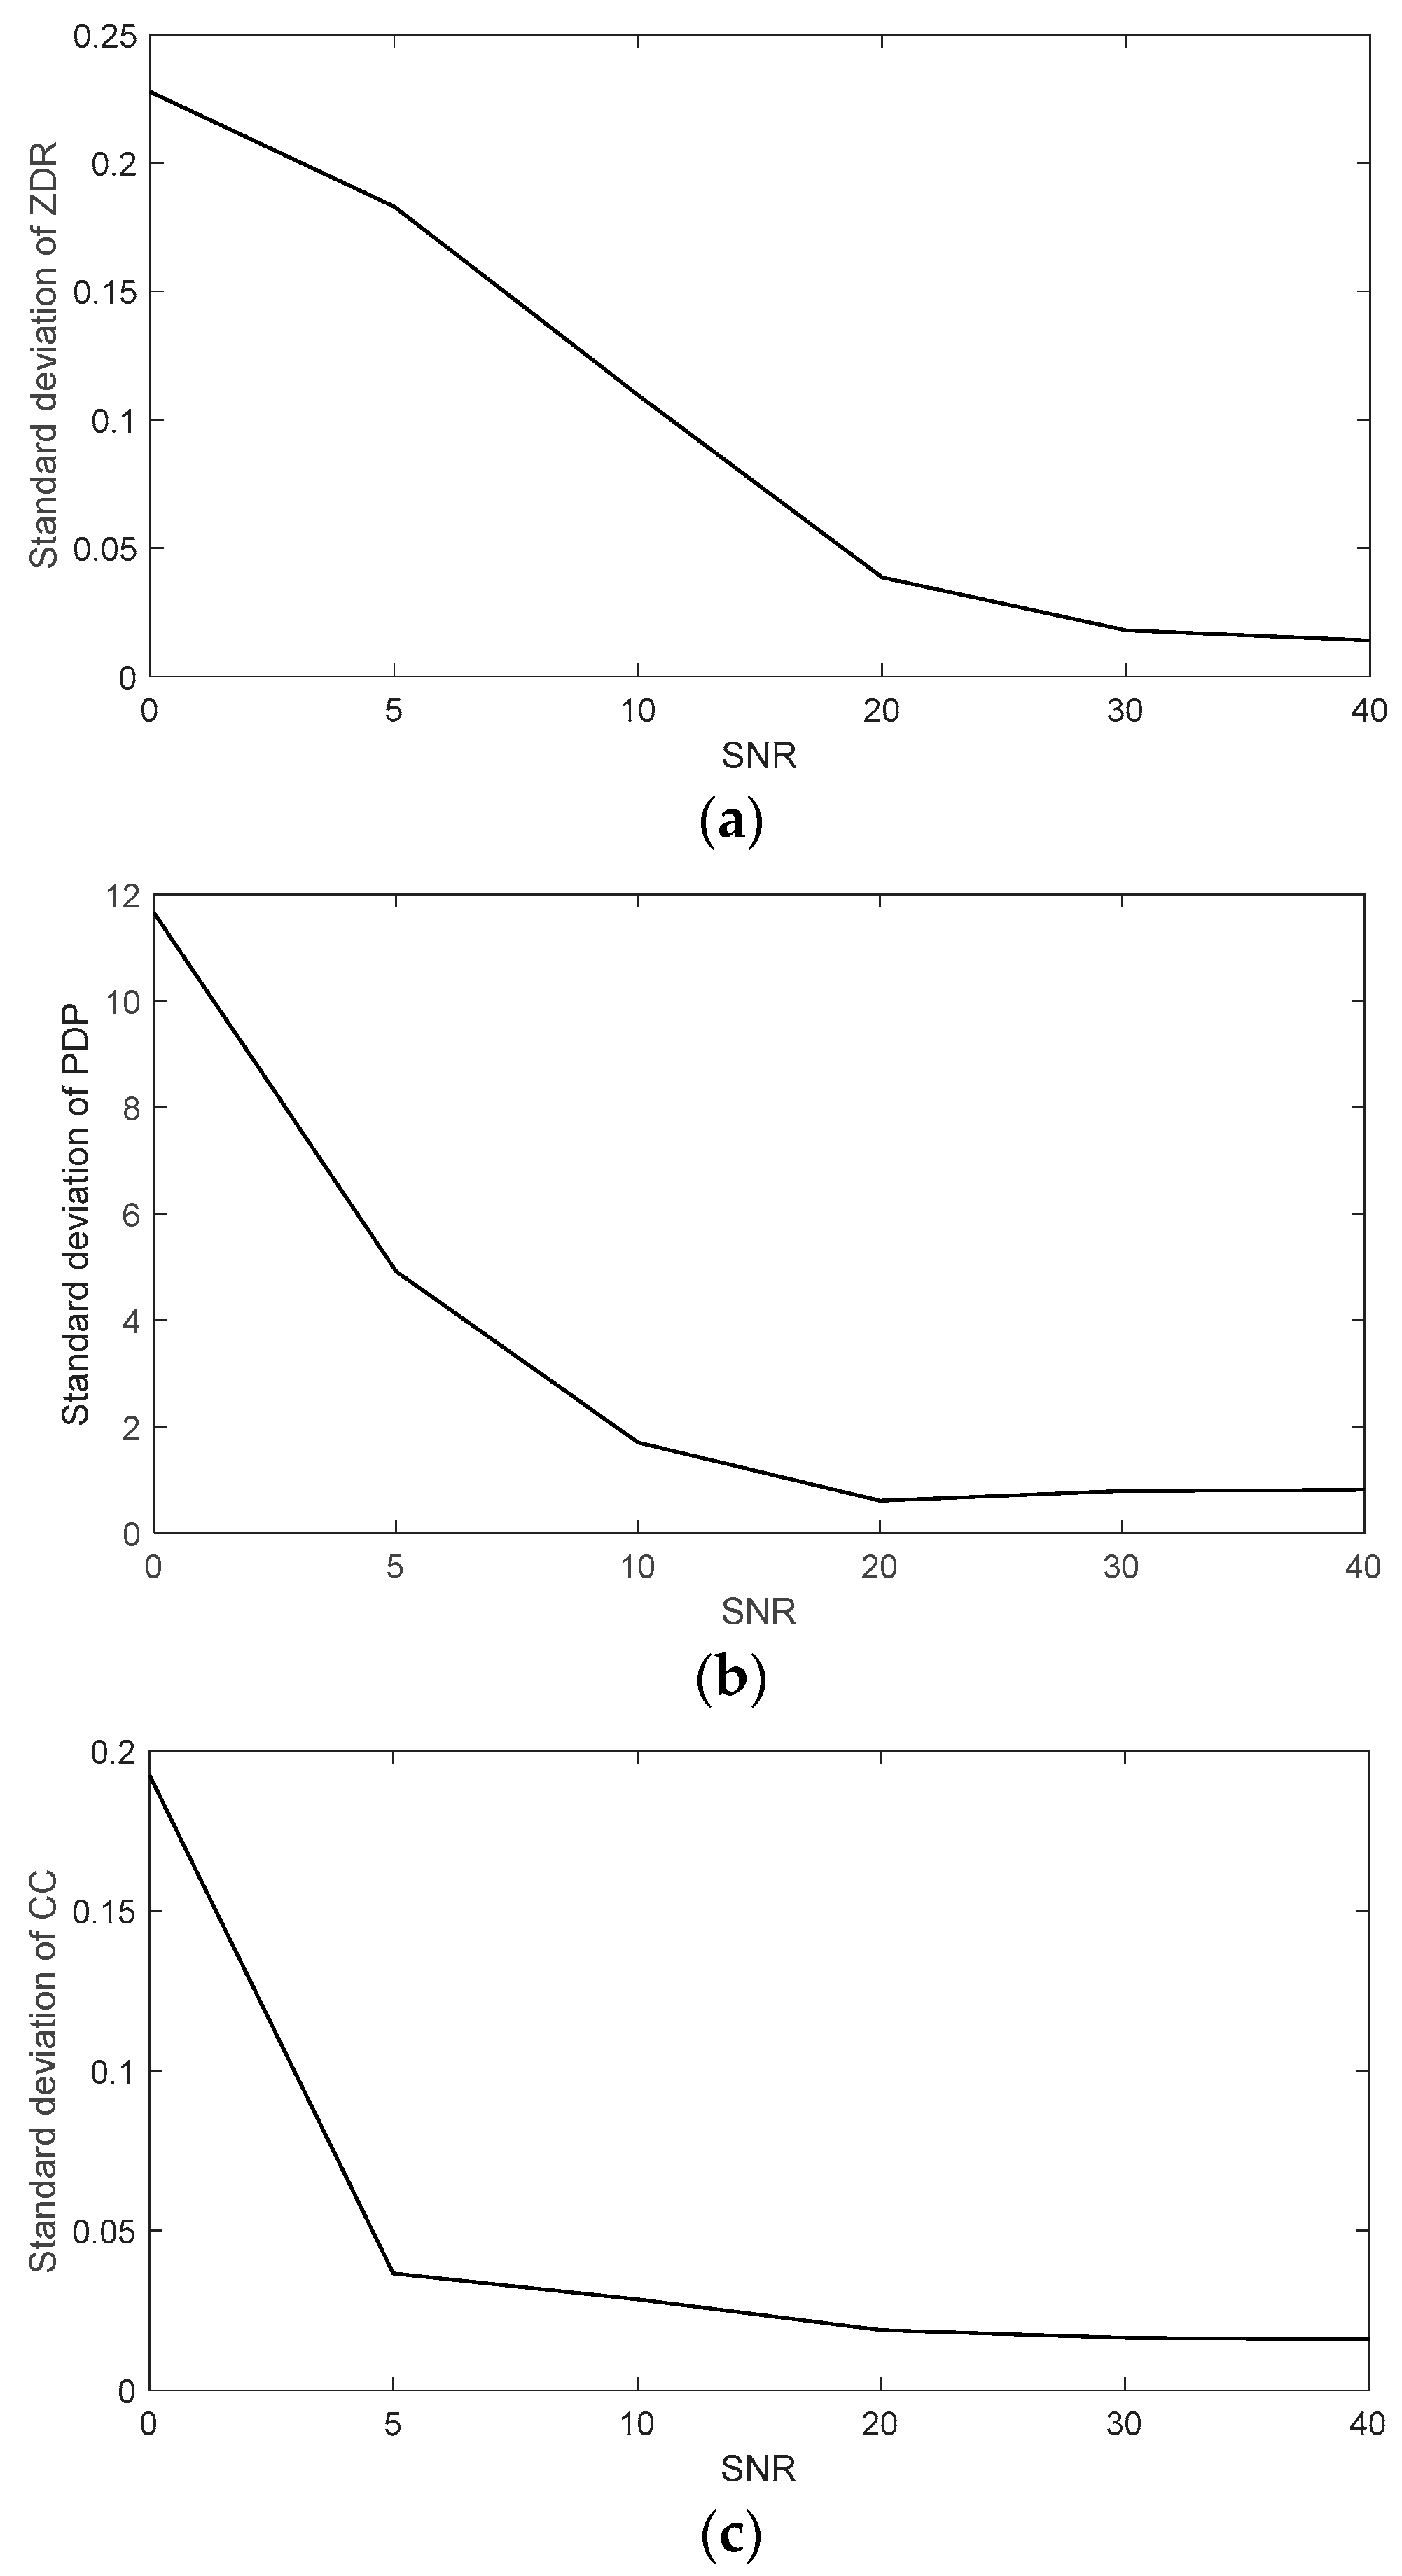
3.1. Verification of Simulation Results of Dual-Polarization Weather Radar Echo Signals

Echo signal simulation is based on a C-band dual-polarization weather base’s data as a reference scene. The system parameters of the weather radar (shown in Table 1) are used as the input of the simulation algorithm. The weather radar detection base data are then read as a reference value, such as reflectivity: Z h = 14.47   d B Z ; Doppler velocity: V = 2.82   m / s ; spectral width: W = 0.6   m / s ; difference reflectivity: Z D R = 1.2   d B Z ; differential phase:   φ d p = 177.38 ° ; correlation coefficient: ρ H V ( 0 ) = 0.96 .
The echo signal and power spectrum of the H−channel and V−channel can be obtained by bringing the above parameters into the echo simulation algorithm of the dual-polarization weather radar mentioned in Section 2.1. Figure 3 is the power spectrum of the simulated H−channel echo signal and V−channel, and Figure 4 shows the real and imaginary parts of the simulated H−channel and V−channel echo signal. Using the signal processing algorithm to calculate the simulation base data for the H−channel and V−channel echo signal, we obtain reflectivity: Z h _ s i m u = 14.5038   dBZ ; Doppler velocity: V s i m u = 2.8300   m / s ; spectral width: W s i m u = 0.7907   m / s ; difference reflectivity: Z D R _ s i m u = 1.1809   dBZ ; differential phase:   φ d p = 178.0494 ° ; correlation coefficient: ρ H V ( 0 ) = 0.9513 . Calculating the difference value between the base data of the simulated echo signal and the base data of the reference scene, we obtain Z d i f f = 0.0938   dBZ ;   V d i f f = 0.01   m / s ;   W d i f f = 0.1907   m / s ;   Z D R _ d i f f = 0.0191   dB ;   φ d p _ d i f f = 0.6694 ° ; ρ H V _ d i f f ( 0 ) = 0.0087 . The signal processing algorithm used here is the traditional algorithm of dual-polarization weather radar, which is not presented here and can be found in References [12,22,23].
The above is to simulate the echo signal of a range gate, and further verify that the simulation algorithm can simulate all the range gates in the whole working process. Under the radar system parameters set in Table 1, the echo signal simulation is used for all the range gates of the C-band weather radar in this working process. The results given in Figure 5 and Figure 6 could be obtained, where Figure 5 shows the PPI display of the reference scene base data and Figure 6 shows the PPI display of the base data of the simulation signal.
Since the SNR affects the accuracy of the simulation model, all range gates for the entire working process are classified according to the SNR. Moreover, the standard deviation of the simulation base data and reference scene base data is calculated as follows.
  D = i = 1 n ( | X i Y i | ) n = [ i = 1 n ( X i Y i ) 2 n × D 2 ] n 1
  σ = [ i = 1 n ( X i Y i ) 2 n × D 2 ] n 1
where D is the mean deviation and σ is the standard deviation.
The results shown in Figure 7 can be obtained, where the horizontal axis is the SNR, and the vertical axis is the standard deviation of the simulated data and the reference scene data. Since the simulation method of the single-polarization Doppler weather radar echo signal is very mature, this paper mainly analyzes the polarization information calculated by the dual-channel echo signal.
The analysis of the time to perform echo signal simulation for a single range gate and for all range gates for the whole scanning process gives the Table 2 results.

3.2. Verification of Batch Work Mode and Phase-Encoded Work Mode Echo Signal Simulation Results

First, the weather radar parameters provided in Table 1 are again selected as the input. Secondly, the weather radar base’s data are reselected as the reference scene. Finally, the batch work mode echo signal simulation method and the phase-encoded work mode echo signal simulation method mentioned in Section 2.2 are used to perform simulations for all range gates. In the simulation process of both modes, the problem of range folding is involved. Table 3 gives the corresponding parameters of range folding.
The mitigation range ambiguity processing is used to simulate the obtained echo signal, which is not the focus of this study, so it is not elaborated in detail and can be referred to in [20]. Figure 8 shows the PPI of the results. Figure 8a is the reflectivity PPI of the reference scene base data, and since it is necessary to judge the velocity given position with the help of reflectivity in the batch mode, the reflectivity PPI is shown here; Figure 8b is the velocity PPI of the reference scene data. Figure 8c is the velocity PPI of the batch mode obtained from the simulation; Figure 8d is the velocity PPI of the phase encoding obtained from the simulation.
The area processed by the range ambiguity mitigation algorithm is divided into the mitigation ambiguity effective area and the mitigation ambiguity ineffective area (the area marked in purple). The area percentage PO, which cannot recover the velocity by the mitigation range ambiguity algorithm, is used to quantitatively analyze the percentage of the mitigation ambiguity ineffective area to the range ambiguity echo area.
  P O = A c A c + A v
In the equation, A c is the mitigation ambiguity ineffective area and A v is the mitigation ambiguity effective area.
Using Equation (26) to calculate the PO for the batch and phase coding working modes, the results are shown in Table 4.
The mitigation range ambiguity effect of the batch and phase encoding working modes is quantified by the standard deviation of the effective area of algorithm and the corresponding area of the reference scene base data. The calculation results are shown in Table 5.

4. Discussion

In order to prove the accuracy of the dual-channel echo signal obtained by the simulation model, it is necessary to analyze the time–frequency characteristics of the simulated signal. It can be seen from Figure 3 that the simulated power spectrum satisfies Gaussian distribution. Because the received power of the H−channel and V−channel is different (the difference value is 1.2dB), the peak power spectrum amplitude of the H−channel is higher than that of the V−channel, and the central frequency is near 3 m/s. The analysis above shows that the simulation of the power spectrum is in accord with real echo characteristics. It can be seen from Figure 4 that the change in the echo signal in the H-channel and V-channel is basically the same, and the real and imaginary part of the echo signal are in line with the orthogonal relationship. In this paper, the echo signal simulation method is extended to the whole PPI scanning of weather radar, and the simulation results are analyzed in detail below. Through the comparison between Figure 5 and Figure 6, it can be found that the simulated base data are in good agreement with the reference scene base data, which have the same structure distribution, and there are similar values in the data of reflectivity, velocity, differential reflectivity, and correlation coefficient. As can be seen from Figure 7, for the polarization parameter estimation, the simulation accuracy is related to the SNR, while the standard deviation of the simulation data and the reference scene base data is small when the SNR is greater than 10 dB. Compared with the Doppler weather radar echo signal simulation, this algorithm increases the complexity of the simulation because it needs to generate two channels of echo signals, i.e., the inverse Fourier transform needs to be applied twice during the simulation. However, as can be seen from Table 2, the simulation speed is still fast.
According to the mitigation range ambiguity algorithm of batch mode, when the first trip echo and second trip echo are overlapped, the ratio of the power of them will be used to decide the velocity estimation at the appropriate range location. If the ratio value is greater than the threshold value set by the batch algorithm (here, the threshold value is set to 5dB), the velocity value of the echo with high power can be recovered, and the velocity value of the echo with low power cannot be recovered. Moreover, when the ratio value is less than the threshold, the velocity values of both echoes are not recoverable; thus, it can be seen that both the first trip echo and second trip echo fall within the purple region in Figure 8c, which means that the range ambiguity cannot be mitigated completely. The receiving power of the second trip echo is more seriously attenuated by the rain, so more ambiguity regions appear in the second trip echo.
Comparing Figure 8d with Figure 8b, it can be seen that more effective velocity data in the phase encoding work mode can be obtained without the large purple area in the batch work mode. This indicates that the phase encoding algorithm can recover the velocity values of not only the first trip echo but also the second trip echo. Further, it can be concluded from Table 4 that, in this experiment, the percentage of the batch mitigation range ambiguity in the effective area is 59.75%, which is much higher than the phase coding. Table 5 also indicates that the standard deviation of the phase encoding is also smaller than that of the batch processing in the area where both methods of mitigation range ambiguity are valid. Although the amount of computation of phase encoding is larger than that of batch processing, its effect of weakening range ambiguity is better than that of traditional batch processing.

5. Conclusions

In this paper, we establish a dual-polarization weather radar echo signal simulation method and apply the simulation method to a mitigation range ambiguous algorithm. The actual weather radar base data are used in the simulation as the weather reference scene, which avoids the use of complex algorithms for weather modeling. Moreover, based on radar weather equations, the radar system parameters are added into the radar echo signal modeling to establish the relationship between the simulated echo signal and radar system. As a result, the final simulated echo signal not only shows both the time and frequency domain characteristics of the weather target, but also includes the effects of the important performance of the dual-polarization weather radar system. In the simulation, the Gaussian spectrum is used for power spectrum modeling, and the correlation coefficient is introduced to establish the correlation of the two-channel echo signal, so that the generated two-channel echo signal has the polarization information of rainfall. Echo signal simulation is an important tool for testing signal processing techniques and can also be used to test changes in system characteristics. To solve the problem of the existing weather radar, which cannot realize the batch working and phase encoding of the same weather scene due to the actual condition limitation, this paper uses a simulation approach to implement two different working modes for the same weather scene to generate a weather radar echo signal. Moreover, under the same weather scene, the observations of these two different methods after range ambiguity mitigation have been simulated and compared. Results show that using the phase coding mode can obtain a better effect of range ambiguity mitigation than when using batch work mode for the same weather scene. Using the echo signal simulation approach, different working modes can be used for the same weather scene to verify their effects on the weather data. In addition, by modeling the antenna pattern [24], the beam angle, beam width, or beam pointing consistency can be studied, which will be our next focus of attention based on this paper.

Author Contributions

S.D. and X.L. designed the algorithm; S.D. and Y.C. performed programming to obtain algorithm results; M.L. and M.X. analyzed the results; Z.B. and J.H. supervised the work and provided comments on the results; S.D. wrote this paper; X.L. and Y.C. revised the paper. All authors have read and agreed to the published version of the manuscript.

Funding

This work was supported by the Natural Science Foundation of China (41575022), National Key R & D Program of the Ministry of Science and Technology (2017YFC1501701), and Sichuan Provincial Department of Education Focus (2018Z088).

Institutional Review Board Statement

Not applicable.

Informed Consent Statement

Not applicable.

Data Availability Statement

Data set available on request to corresponding authors.

Conflicts of Interest

The authors declare no conflict of interest.

References

  1. Kumjian, M. Principles and applications of dual-polarization weather radar. Part I: Description of the polarimetric radar variables. J. Oper. Meteorol. 2013, 1, 226–242. [Google Scholar] [CrossRef]
  2. Lim, S.; Cifelli, R.; Chandrasekar, V.; Matrosov, S.Y. Precipitation Classification and Quantification Using X-Band Dual-Polarization Weather Radar: Application in the Hydrometeorology Testbed. J. Atmos. Ocean. Technol. 2013, 30, 2108–2120. [Google Scholar] [CrossRef]
  3. Anagnostou, E.N.; Krajewski, W.F. Simulation of radar reflectivity fields: Algorithm formulation and evaluation. Water Resour. Res. 1997, 33, 1419–1428. [Google Scholar] [CrossRef]
  4. Capsoni, C.; D’Amico, M.; Nebuloni, R. A Multiparameter Polarimetric Radar Simulator. J. Atmos. Ocean. Technol. 2001, 18, 1799–1809. [Google Scholar] [CrossRef]
  5. Lupidi, A.; Moscardini, C.; Garzelli, A.; Berizzi, F.; Cuccoli, F.; Bernabò, M. Polarimetry applied to avionic weather radar: Improvement on meteorological phenomena detection and classification. In Proceedings of the 2011 Tyrrhenian International Workshop on Digital Communications—Enhanced Surveillance of Aircraft and Vehicles, Capri, Italy, 12–14 September 2011; pp. 73–77. [Google Scholar]
  6. Augros, C.; Caumont, O.; Ducrocq, V.; Tabary, P. Development and validation of a full polarimetric radar simulator. In Proceedings of the 36th Conference on Radar Meteorology, Breckenridge, CO, USA, 16–20 September 2013; American Meteorological Society: Boston, MA, USA, 2013; Volume 387. [Google Scholar]
  7. Ivic, I.R.; Doviak, R.J. Evaluation of Phase Coding to Mitigate Differential Reflectivity Bias in Polarimetric PAR. IEEE Trans. Geosci. Remote Sens. 2015, 54, 431–451. [Google Scholar] [CrossRef]
  8. Zrnić, D.S.; Doviak, R.J.; Melnikov, V.M.; Ivić, I.R. Signal Design to Suppress Coupling in the Polarimetric Phased Array Radar. J. Atmos. Ocean. Technol. 2014, 31, 1063–1077. [Google Scholar] [CrossRef]
  9. Nai, F.; Boettcher, J.; Curtis, C.; Schvartzman, D.; Torres, S. The Impact of Elevation Sidelobe Contamination on Radar Data Quality for Operational Interpretation. J. Appl. Meteorol. Clim. 2020, 59, 707–724. [Google Scholar] [CrossRef] [Green Version]
  10. Li, X.; Wang, C.; Qin, Z.; He, J.; Liu, F.; Sun, Q. A Velocity Dealiasing Algorithm on Frequency Diversity Pulse-Pair for Future Geostationary Spaceborne Doppler Weather Radar. Atmosphere 2018, 9, 234. [Google Scholar] [CrossRef] [Green Version]
  11. Schvartzman, D.; Curtis, C.D. Signal Processing and Radar Characteristics (SPARC) Simulator: A Flexible Dual-Polarization Weather-Radar Signal Simulation Framework Based on Preexisting Radar-Variable Data. IEEE J. Sel. Top. Appl. Earth Obs. Remote Sens. 2018, 12, 135–150. [Google Scholar] [CrossRef]
  12. Doviak, R.; Zrnic, S. Doppler Radar and Weather Observations; Courier Corporation: Chelmsford, MA, USA, 2006. [Google Scholar]
  13. Zrnic, D.S.; Mahapatra, P. Two Methods of Ambiguity Resolution in Pulse Doppler Weather Radars. IEEE Trans. Aerosp. Electron. Syst. 1985, AES-21, 470–483. [Google Scholar]
  14. Sachidananda, M.; Zrnic, D.S. Systematic Phase Codes for Resolving Range Overlaid Signals in a Doppler Weather Radar. J. Atmos. Ocean. Technol. 1999, 16, 1351–1363. [Google Scholar] [CrossRef]
  15. Zhang, S.; Min, J.; Zhang, C.; Huang, X.; Liu, J.; Wei, K. Hybrid Method to Identify Second-trip Echoes Using Phase Modulation and Polarimetric Technology. Adv. Atmos. Sci. 2021, 38, 480–492. [Google Scholar] [CrossRef]
  16. Zrnić, D.S. Simulation of Weatherlike Doppler Spectra and Signals. J. Appl. Meteorol. 1975, 14, 619–620. [Google Scholar] [CrossRef]
  17. Galati, G.; Pavan, G. Computer simulation of weather radar signals. Simul. Pract. Theory 1995, 3, 17–44. [Google Scholar] [CrossRef]
  18. Melnikov, V.M.; Zrnić, D.S. On the Alternate Transmission Mode for Polarimetric Phased Array Weather Radar. J. Atmos. Ocean. Technol. 2015, 32, 220–233. [Google Scholar] [CrossRef]
  19. Doviak, R.J.; Zrnic, D.S. Doppler Radar & Weather Observations; Published Online. 2014. Available online: https://www.numilog.com/355287/Doppler-Radar--Weather-Observations.ebook (accessed on 20 February 2022).
  20. Torres, S.M.; Zrnic, D.S. Range and velocity ambiguity mitigation techniques for the WSR-88D weather radar. In Proceedings of the IGARSS 2004: 2004 IEEE International Geoscience and Remote Sensing Symposium, Anchorage, AK, USA, 20–24 September 2004; Volume 3, pp. 1727–1729. [Google Scholar]
  21. Meymaris, G.; Hubbert, J.; Ellis, S. Quanitative Analysis of the SZ(8/64) Phase Code for the Mitigation of Range and Velocity Ambiquities in the WSR-88D. Available online: https://citeseerx.ist.psu.edu/viewdoc/download?doi=10.1.1.604.2132&rep=rep1&type=pdf (accessed on 20 February 2022).
  22. Zrnic, D. Spectrum Width Estimtes for Weather Echoes. IEEE Trans. Aerosp. Electron. Syst. 1979, AES-15, 613–619. [Google Scholar] [CrossRef]
  23. Sachidananda, M.; Zrnic, D.S. ZDR measurement considerations for a fast scan capability radar. Radio Sci. 1985, 20, 907–922. [Google Scholar] [CrossRef]
  24. Li, X.; He, J.; Wang, C.; Tang, S.; Hou, X. Evaluation of Surface Clutter for Future Geostationary Spaceborne Weather Radar. Atmosphere 2017, 8, 14. [Google Scholar] [CrossRef] [Green Version]
Figure 1. Flow chart of echo signal simulation formula of dual-polarization weather radar.
Atmosphere 13 00432 g001
Figure 2. Pulse generation method of batch working mode.
Atmosphere 13 00432 g002
Figure 3. Power spectrum of H−channel and V−channel of simulation signal.
Atmosphere 13 00432 g003
Figure 4. Simulation signal. (a) The real and imaginary parts of H−channel echo signal; (b) the real and imaginary parts of V−channel echo signal.
Atmosphere 13 00432 g004
Figure 5. The PPI display of reference scene base data. (a) Reflectivity; (b) radial velocity; (c) spectrum width; (d) differential reflectivity; (e) differential phase; (f) correlation coefficient.
Atmosphere 13 00432 g005aAtmosphere 13 00432 g005b
Figure 6. The PPI display of simulation radar base data. (a) Reflectivity; (b) radial velocity; (c) spectrum width; (d) differential reflectivity; (e) differential phase; (f) correlation coefficient.
Atmosphere 13 00432 g006
Figure 7. The standard deviation of simulated data and reference scene data. (a) Differential reflectivity; (b) differential phase; (c) correlation coefficient.
Atmosphere 13 00432 g007
Figure 8. Reference scene base data PPI. (a) reflectivity; (b) velocity; Simulation radar base data PPI. (c) batch mode; (d) SZ(8/64) mode.
Atmosphere 13 00432 g008
Table 1. Parameters of dual-polarization weather radar system.
ParameterParameter Value
Emissive power250 kw
Pulse width 0.5   μ s
Horizontal beam width 1.2 °
Vertical beam width 1.2 °
Pulse repetition frequency2000 hz
Wave length5.3571 cm
Receiver gain35 dB
Antenna gain45 dB
Atmospheric loss0.016 dB
Noise power−112 dB
Table 2. The time of echo signal simulation.
Range Gate NumberSimulation Time (s)
10.125
431,43070.348
Table 3. Radar working parameters used in simulation.
Working Modes Pulse   Repetition   Frequency   ( H z ) R m a x   ( k m ) V m a x   ( m / s )
Batch100015013.3929
150010020.0893
SZ(8/64)1000 (no phase code)15013.3929
1500 (phase code)10020.0893
Table 4. The percentage of the mitigation ambiguity ineffective area to the range ambiguity echo area.
Working ModesPO
Batch59.75%
SZ(8/64)0
Table 5. The standard deviation of the effective area of algorithm and the corresponding area of the reference scene base data.
Working ModesStandard Deviation
Batch1.2312
SZ(8/64)1.1915
Publisher’s Note: MDPI stays neutral with regard to jurisdictional claims in published maps and institutional affiliations.

