
The Impact of Intra-Seasonal Oscillation on Westward Track Deflection of Super Typhoon Fitow (2013)

1
Key Laboratory of Meteorological Disaster Ministry of Education, Joint International Research Laboratory of Climate and Environmental Change, Collaborative Innovation Center on Forecast and Evaluation of Meteorological Disasters, Nanjing University of Information Science and Technology, Nanjing 210044, China
2
Key Laboratory of Cloud-Precipitation Physics and Severe Storms, Institute of Atmospheric Physics, Chinese Academy of Sciences, Beijing 100029, China
3
Suqian Zeda Vocational and Technical College, Suqian 223800, China
*
Author to whom correspondence should be addressed.
Atmosphere 2022, 13(3), 474; https://0-doi-org.brum.beds.ac.uk/10.3390/atmos13030474
Submission received: 31 January 2022
/
Revised: 2 March 2022
/
Accepted: 11 March 2022
/
Published: 14 March 2022
(This article belongs to the Section Meteorology)
Abstract
:Typhoon Fitow (2013) took an unusual westward track deflection after a lengthy northward movement over the western North Pacific (WNP). Based on observation and wave analysis, it is found that the track deflection of Fitow is attributed to the transition of environmental flow from meridional to zonal orientation, which is closely associated with a low-frequency intra-seasonal oscillation (ISO). Furthermore, the impact of ISO on tropical cyclone (TC) unusual movement is investigated using the Advanced Research version of Weather Research and Forecasting (WRF-ARW) model. The control simulation (CTL) reproduces well the synoptic pattern and track deflection of the TC. The TC moves straightly westward and northwestward without track deflection in the sensitivity experiments with the removal of total ISOs and the west-propagating ISO component, while keeping the recurving track with the removal of east-propagating ISO, which suggests that the west-propagating ISO plays a dominant role in the westward track deflection. In the experiment of removing west-propagating ISOs, an anomalous southeast–northwest-oriented wave train around the TC is modified, the mid-latitude trough decays, and the enhanced zonally elongated subtropical high is responsible for the straight northwestward motion of the TC. However, after removing a weaker convection anomaly associated with east-propagating ISOs in the form of a southwest–northeast oriented dipole circulation, the TC is affected by a sustained shallow mid-latitude trough and a west-extended ridge of subtropical high to keep the cyclonic track turning analogous to the counterpart in CTL. The piecewise potential vorticity inversion diagnosis further assesses the contribution of the different ISO components to TC track deflection.
1. Introduction
In recent years, major research on tropical cyclone (TC) movement has focused on unusual TC tracks, such as left and right sudden turning, looping track, rotating track, and zigzagging track [1]. These TC cases are found to cause tremendous challenge to operational weather forecasts and numerical simulations due to complicated dynamic process and interaction with multiple scale disturbances.
The abnormal northward and westward turnings are the most typical unusual TC track types over the western North Pacific (WNP), especially for the north-turning TCs. As for TC sudden northward turning, a large number of previous studies have been conducted based on observational analysis, numerical simulation, ensemble forecasting, and climate statistics [2,3,4,5,6,7,8,9]. Ito et al. [10] summarized the recent understanding of TC motion, which indicates large-scale features, including low-frequency monsoon gyre, upper tropospheric cold low, and subtropical high, are the fundamental factors on the northward track turning of the TC. By comparison, less attention is given to the west- or south-turning (i.e., left-turning) of TC tracks over the WNP, which also probably leads to severe disaster for the eastern China. Are there any different understandings for the occurrence of leftward track deflection?
According to existing studies, it is clear that a certain portion of abrupt left-turning TCs are closely associated with topography effect and binary interaction. For example, Typhoons Nari (2001) [11], Haitang (2005) [12], Fanapi (2010) [4,13], and Megi (2016) [14] are all observed to have experienced the anomalous southwestward deflections while the TCs approached Taiwan Island. Moreover, the corresponding diagnostics and simulation revealed that the channel effect and interaction process induced by Taiwan’s terrain are responsible for these TC track deflections, although individual differences exist. Wu et al. [15] and Huang and Wu [16] conducted idealized experiments to further examine the impact of topography, which indicated that the southwestward track deflection is sensitive to terrain height, TC intensity, and initial location. The relevant mechanisms are explained with the involvement of large-scale environmental flow, low-level channeling effect, and asymmetries in the mid-level flow. Wu et al. [17] and Yang et al. [18] confirmed the quantitative contribution of TC binary interaction to the abnormal southwestward (cyclonic) movement based on the potential vorticity (PV) diagnosis and sensitivity simulations, respectively. Additionally, more precise interaction between binary TCs indicate that the presence of large-scale monsoon circulation causes more complex binary interaction together with significant horizontal PV advection, thus affecting TC track deflection [19].
The steering flows related to the surrounding synoptic systems also have a dominant influence on the west-turning of TCs. Wu et al. [20] indicated that the Pacific subtropical high to the east and the monsoon trough to the west played a combined role in steering Typhoon Sinlaku (2008) from northward to westward. The interaction between a large-scale monsoon gyre circulation and TCs has been discussed by Liang and Wu [21] using idealized numerical simulations that show a fast-moving TC located west of the monsoon gyre center would undergo a westward track. In addition, in the case of a 2006 TC, the observed low-frequency (30–60 days) circulation pattern at 850 hPa can be responsible for the southwest track deflection [22]. Our recent 20-year statistical analysis for the WNP basin was performed to reveal that sudden left-turning TCs are primarily located northwest of a zonally elongated intra-seasonal oscillation (ISO) circulation and thus steered by the enhanced northeasterly flows [23]. It is noted that the ISO fluctuation has been evidenced to pose a potential impact on the unusual westward or southward deflection of TCs by observational and statistical research, while a detailed dynamical process is desirable for more quantitative analysis and model simulation results.
Moreover, when TC activity is accompanied with the evolution of multiscale fluctuations, the dynamical process remains more complicated. Wu et al. [8] found that four sharply northeastward TC tracks are associated with quasi-biweekly oscillation and the Madden–Julian oscillation (MJO), the TC nears the center of the corresponding low-frequency cyclonic circulation, thus making the track change under the influence from the enhanced southwesterly flows. Ching et al. [24] studied the individual roles of the eastward propagating MJO and westward propagating equatorial Rossby (ER) waves on TC activity by designing sensitivity numerical experiments. Therefore, it can be hypothesized that there may be multiple ISO wave modes with different spacing–time scale that pose substantial influence on our concerned westward track deflection, and their individual roles could be investigated by conducting model experiments, thereby giving deeper understanding of the existing mechanisms for the unusual track deflection of TCs over the WNP region.
Taking Typhoon Fitow (2013) with its unusual westward turning as an example, the study starts with the results of observation and wave analysis, establishes six groups of numerical experiments to evaluate the sensitivity of TC track deflection to different spacing–time scale ISO wave components, and performs the quantitative analysis on model results by piecewise PV inversion diagnosis, so as to understand the quantitative steering roles of different ISO wave components on the westward turning of Fitow and the potential dynamical influence on the large-scale environmental fields. The rest of this paper is organized as follows. Section 2 gives an overview and synopsis of Typhoon Fitow. Section 3 provides the description and methodology for the numerical model configuration and experiment design. Section 4 presents the detailed results of the control and sensitivity experiments, and elucidates the relevant dynamical mechanisms for unusual TC westward deflection. The last section presents a summary of this study.
2. Overview of Super Typhoon Fitow (2013)
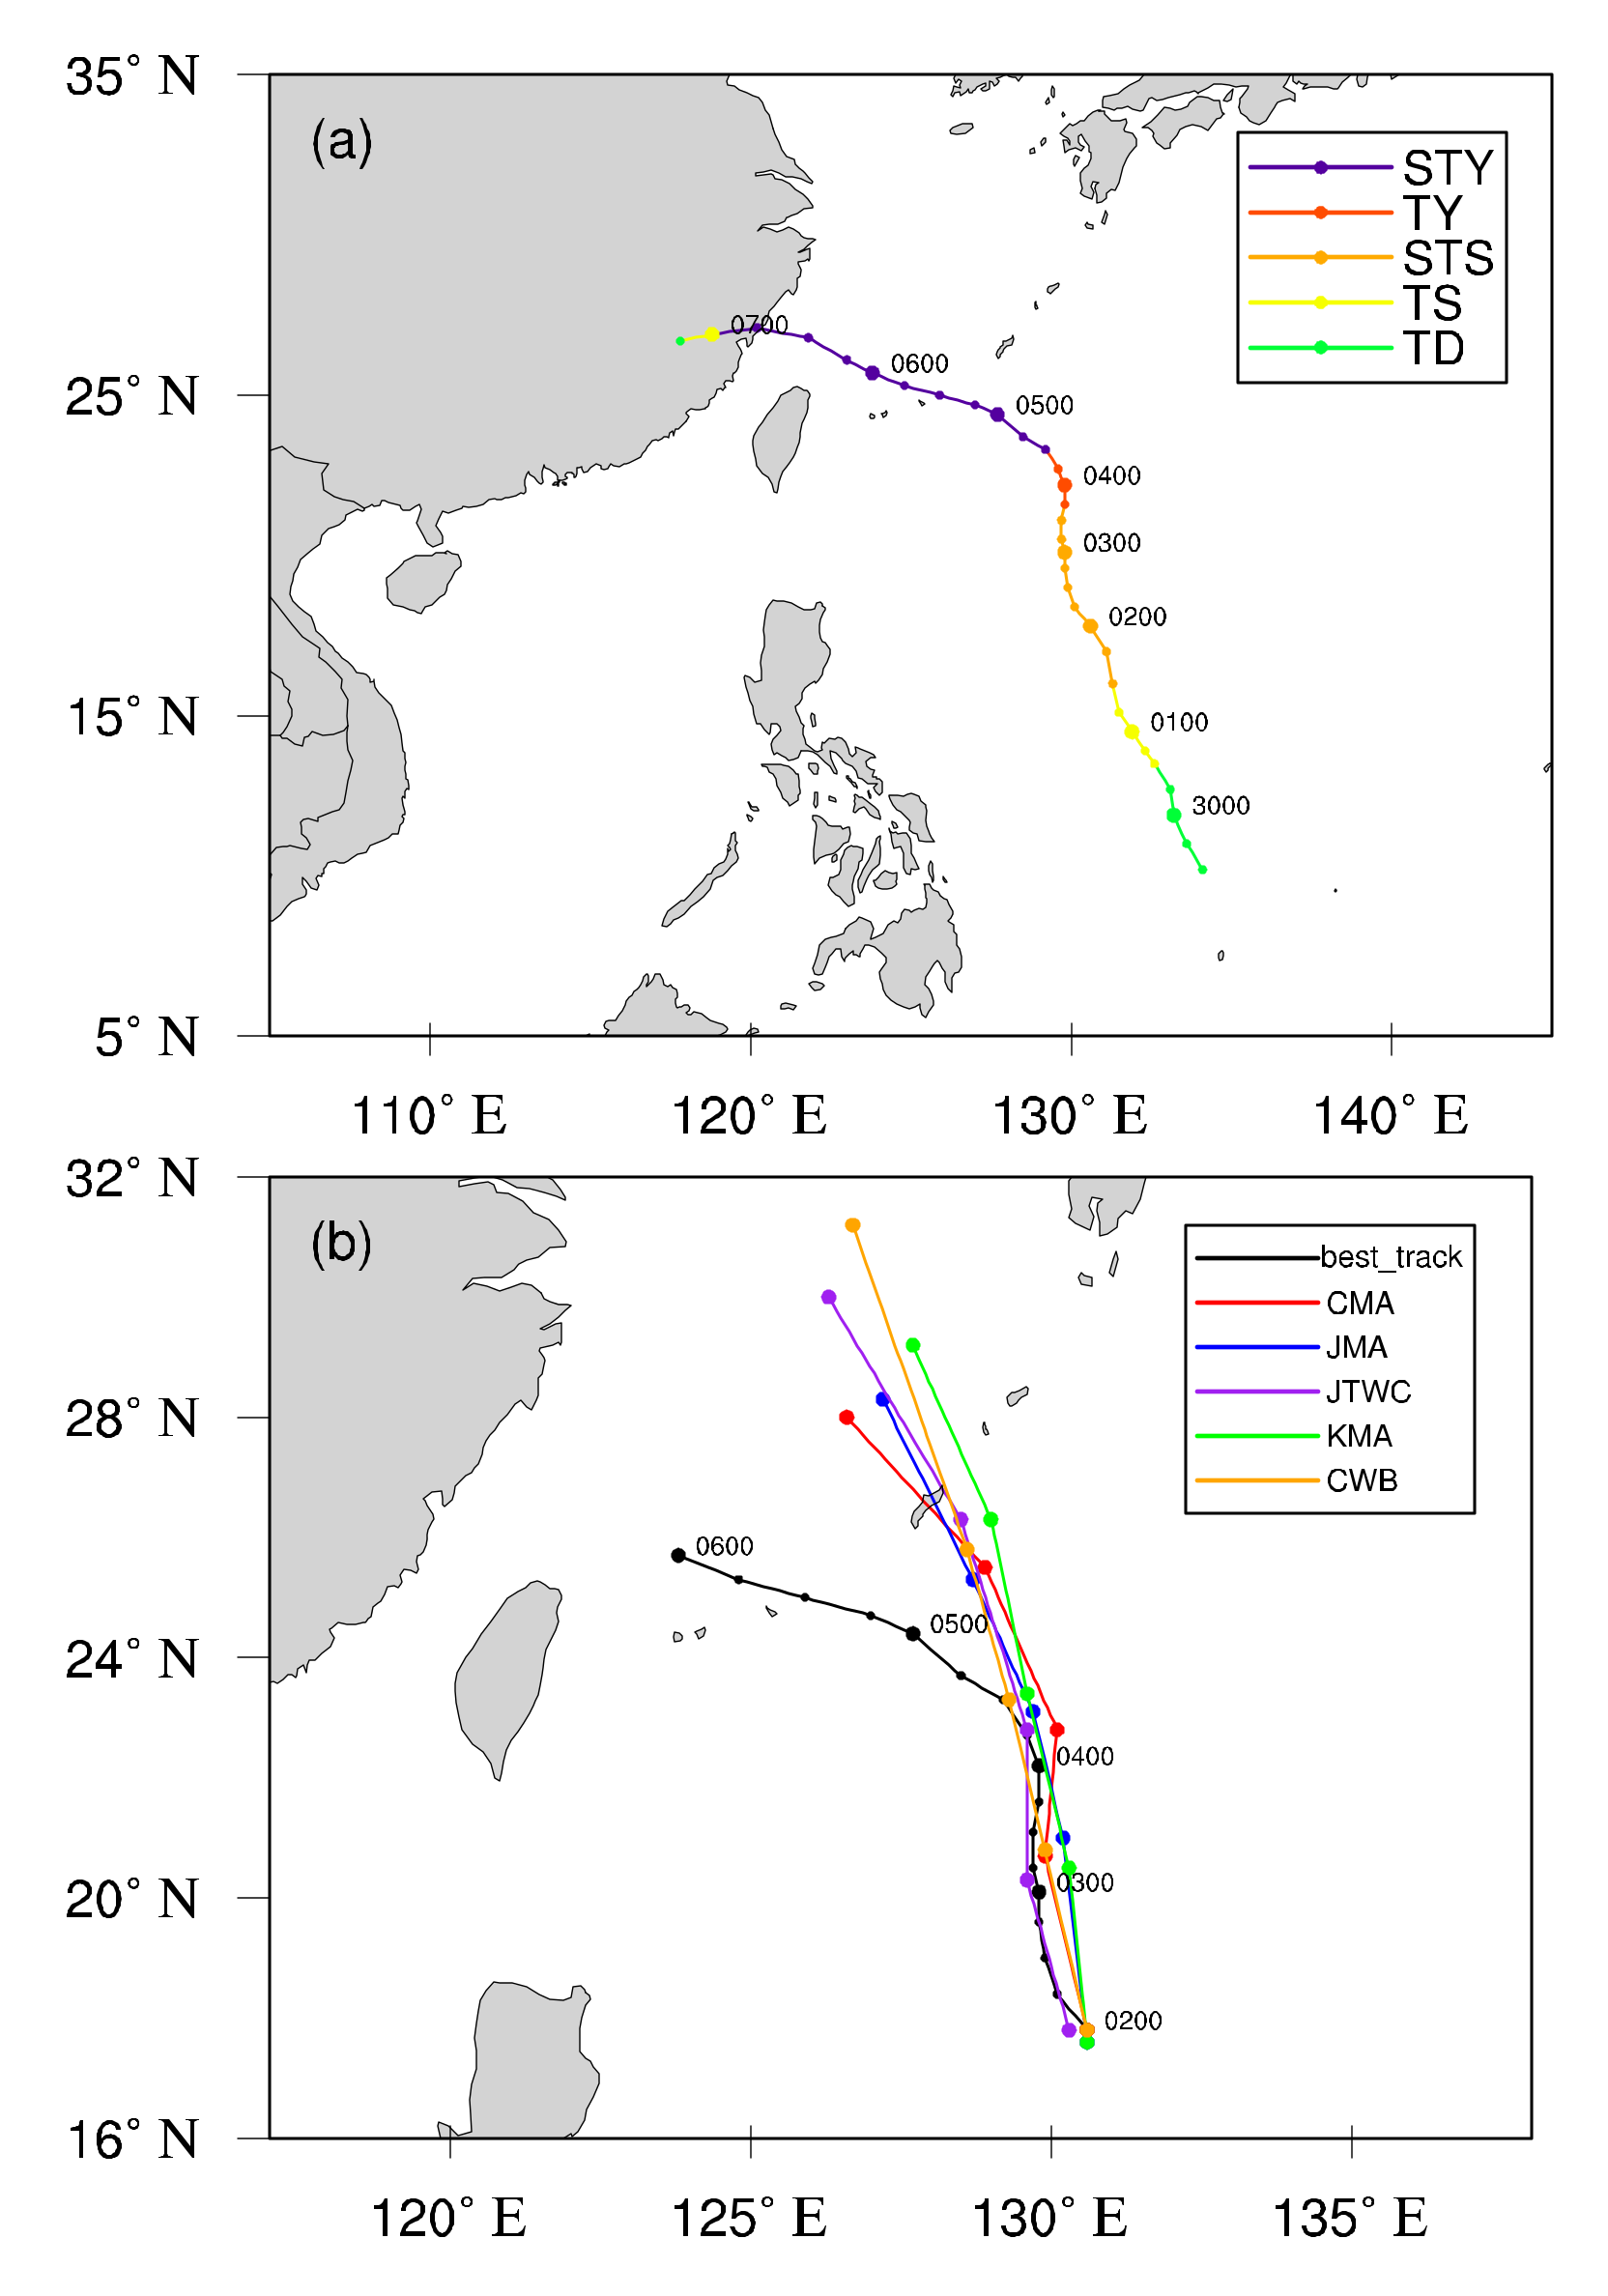
Super Typhoon Fitow was first designated as a tropical depression on 1200 UTC 29 September 2013 over the Philippines’ eastern tropical ocean and then maintained north–northwestward motion to the higher latitude of the WNP in the next two days (Figure 1a). Afterward, Fitow underwent a slower straight northward track for three days and made an unusual westward deflection to the east of Taiwan Island at about 23° N, starting from 1200 UTC 4 October, which largely deviated from the straight northward-moving forecasted by other operational agencies (Figure 1b). Furthermore, it is notable that Fitow continually strengthened during the whole period of poleward motion and upgraded to super typhoon category before turning westward. Finally, super Typhoon Fitow sustained peak intensity and increased the speed of its movement toward the eastern coastal region of China. Because of the unusual track deflection and striking landfall intensity, most eastern provinces of China (i.e., Fujian, Zhejiang, Jiangsu, and Shanghai) suffered major disasters due to the record-breaking winds and torrential precipitation, causing enormous economic losses.
In contrast to previous literature focusing on the landfall intensity and long duration of heavy rainfall of Typhoon Fitow (2013) [25,26,27,28], our study primarily concerns the unusual westward track deflection after Fitow experienced a lengthy northward movement.
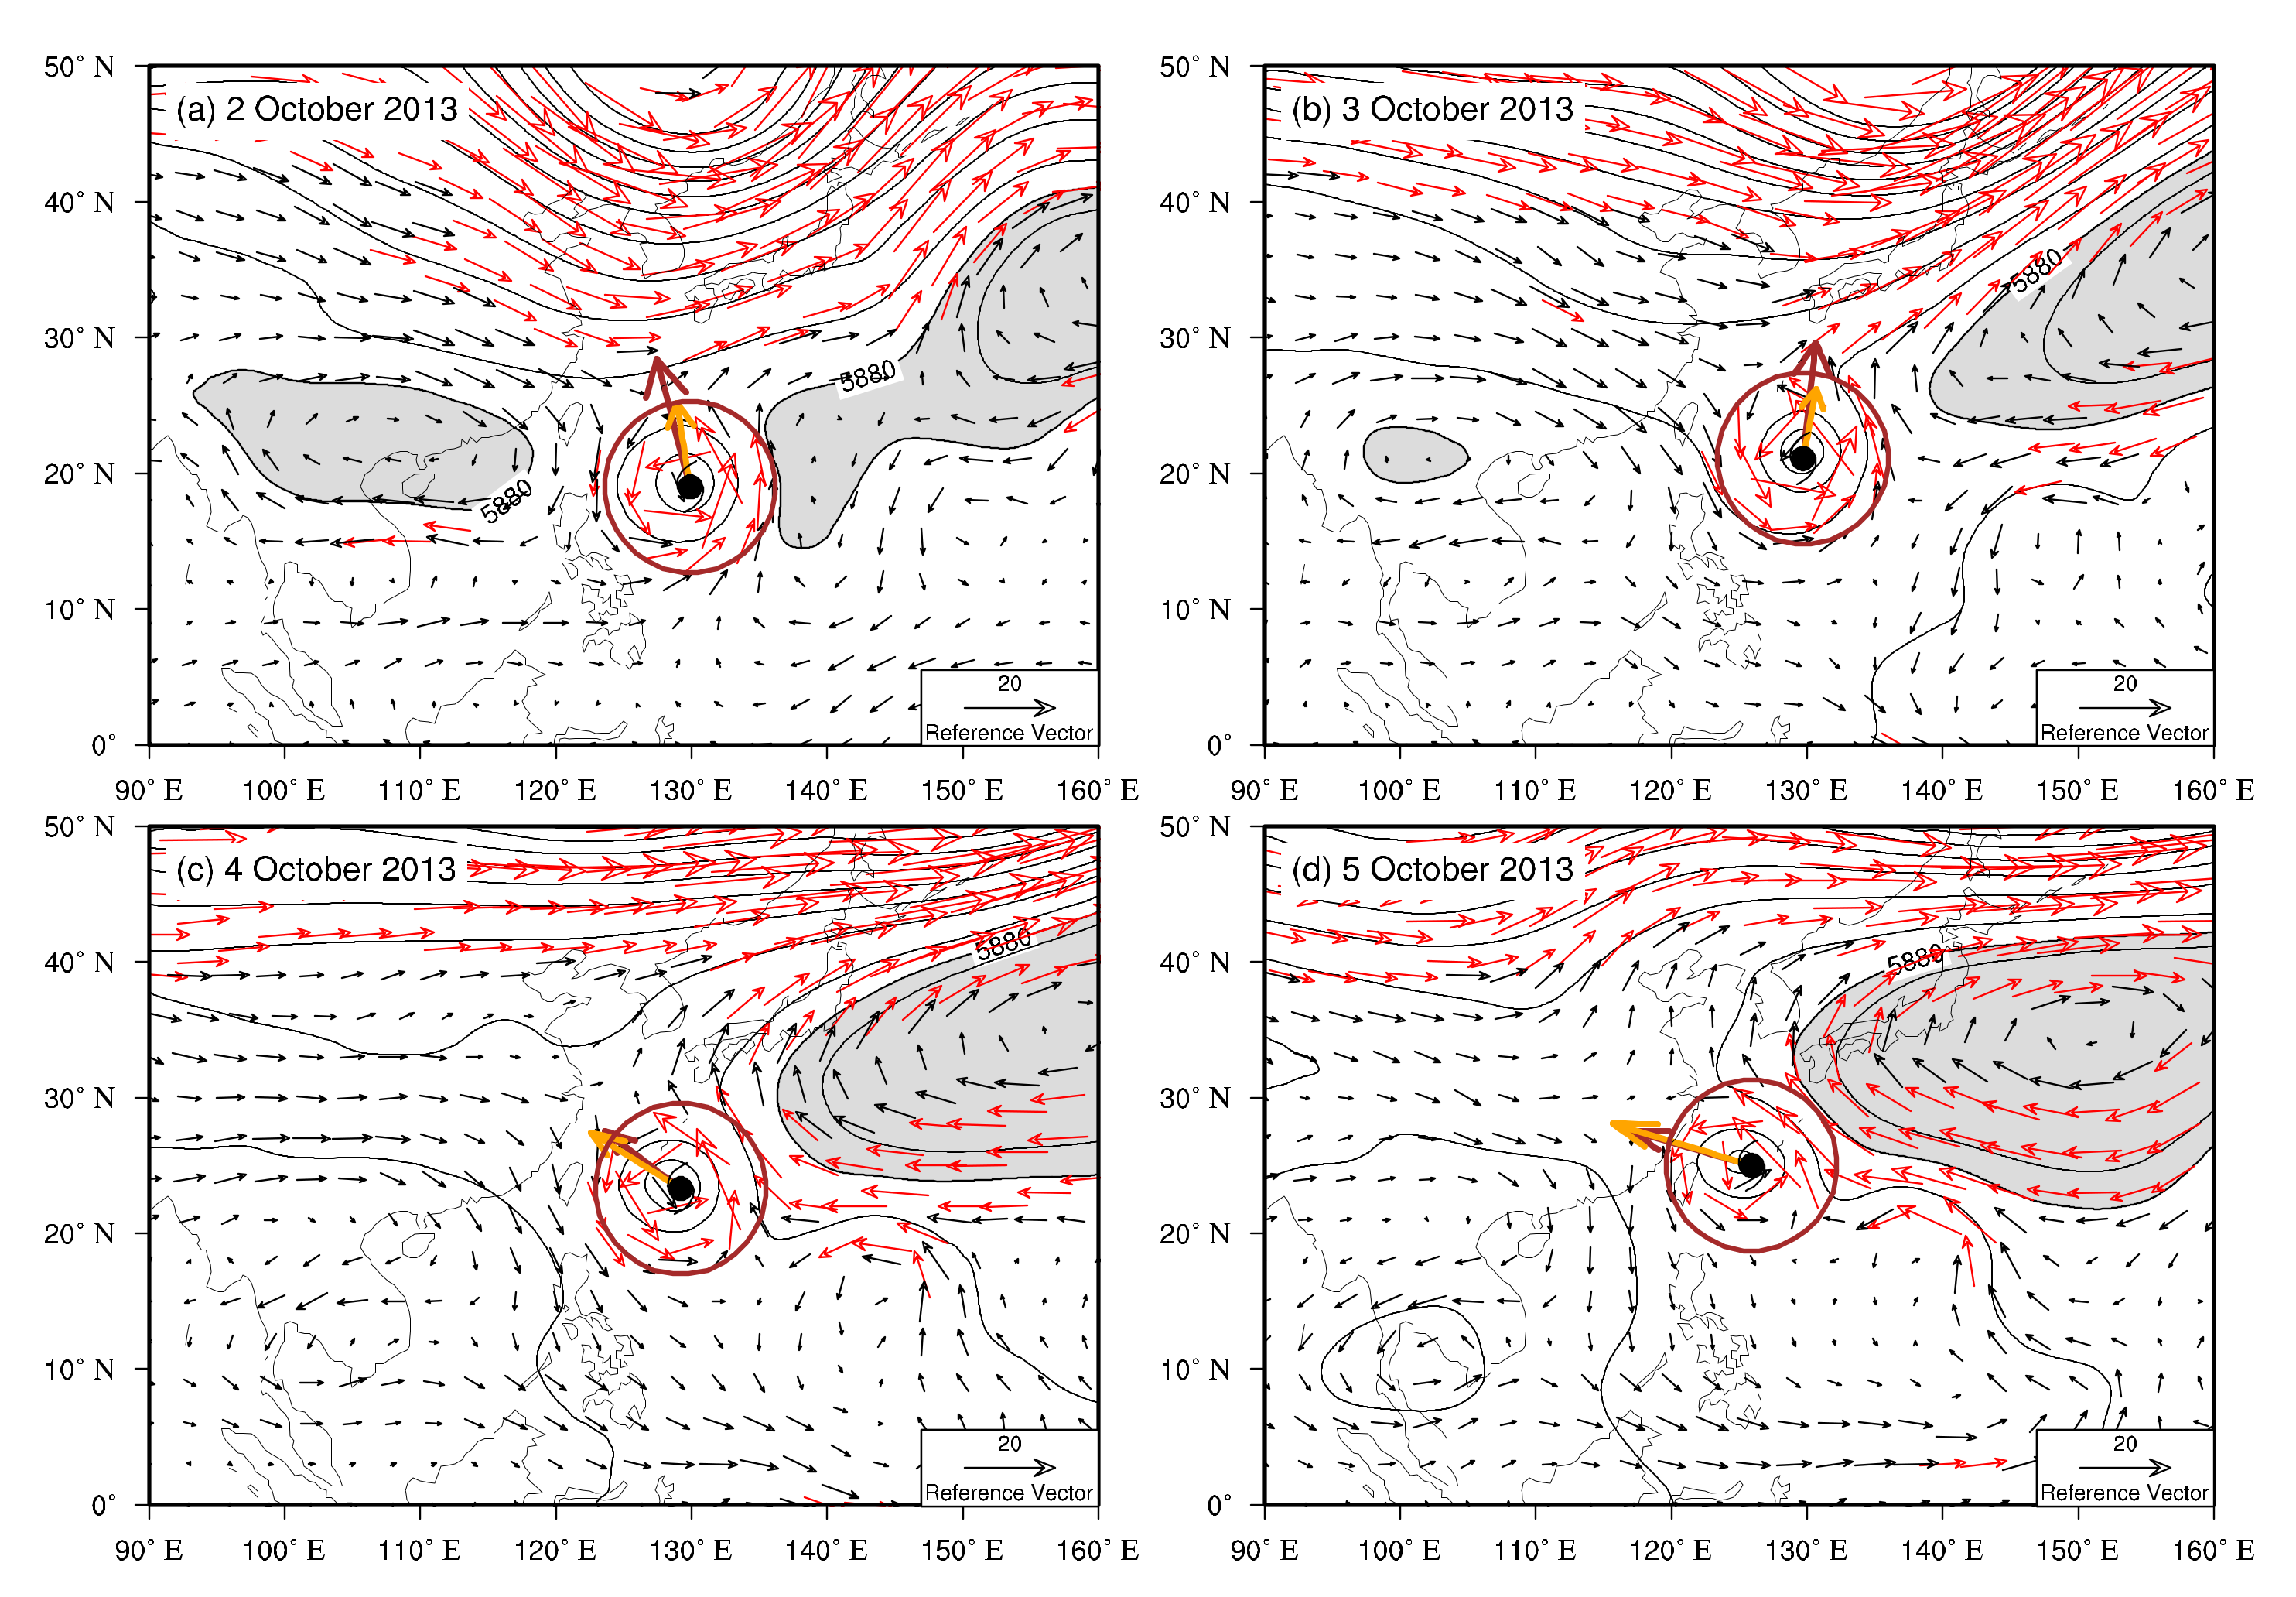
Figure 2 shows how the large-scale unfiltered environment fields evolved as Fitow experienced the track deflection from northward to westward. The environment variables with 6 h intervals used in this study (i.e., geopotential height, three-dimensional wind, and temperature) were obtained from the 1° × 1° Final Operational Global Analysis (FNL) from the National Center for Environmental Prediction. The steering flow is defined by the deep-layer (850–300 hPa) mean wind within a 5° radius of the TC center, denoted by the brown arrows in Figure 2. During the first two days with northward motion (Figure 2a,b), Fitow split the subtropical high belt into two parts and was steered by the asymmetric southerly flows supplied from the eastern subtropical high body and the powerful mid-latitude trough. In contrast, during the two days after the westward track turning, the northern mid-latitude trough system became flattened and retreated northward. The environmental flow surrounding Fitow was more zonally oriented. It is apparent that the subtropical high circulation located on the northeast flank of Fitow exhibited a westward shift at the middle latitude, thus rendering the abnormal westward deflection by the enhanced easterly steering flows (Figure 2c,d).
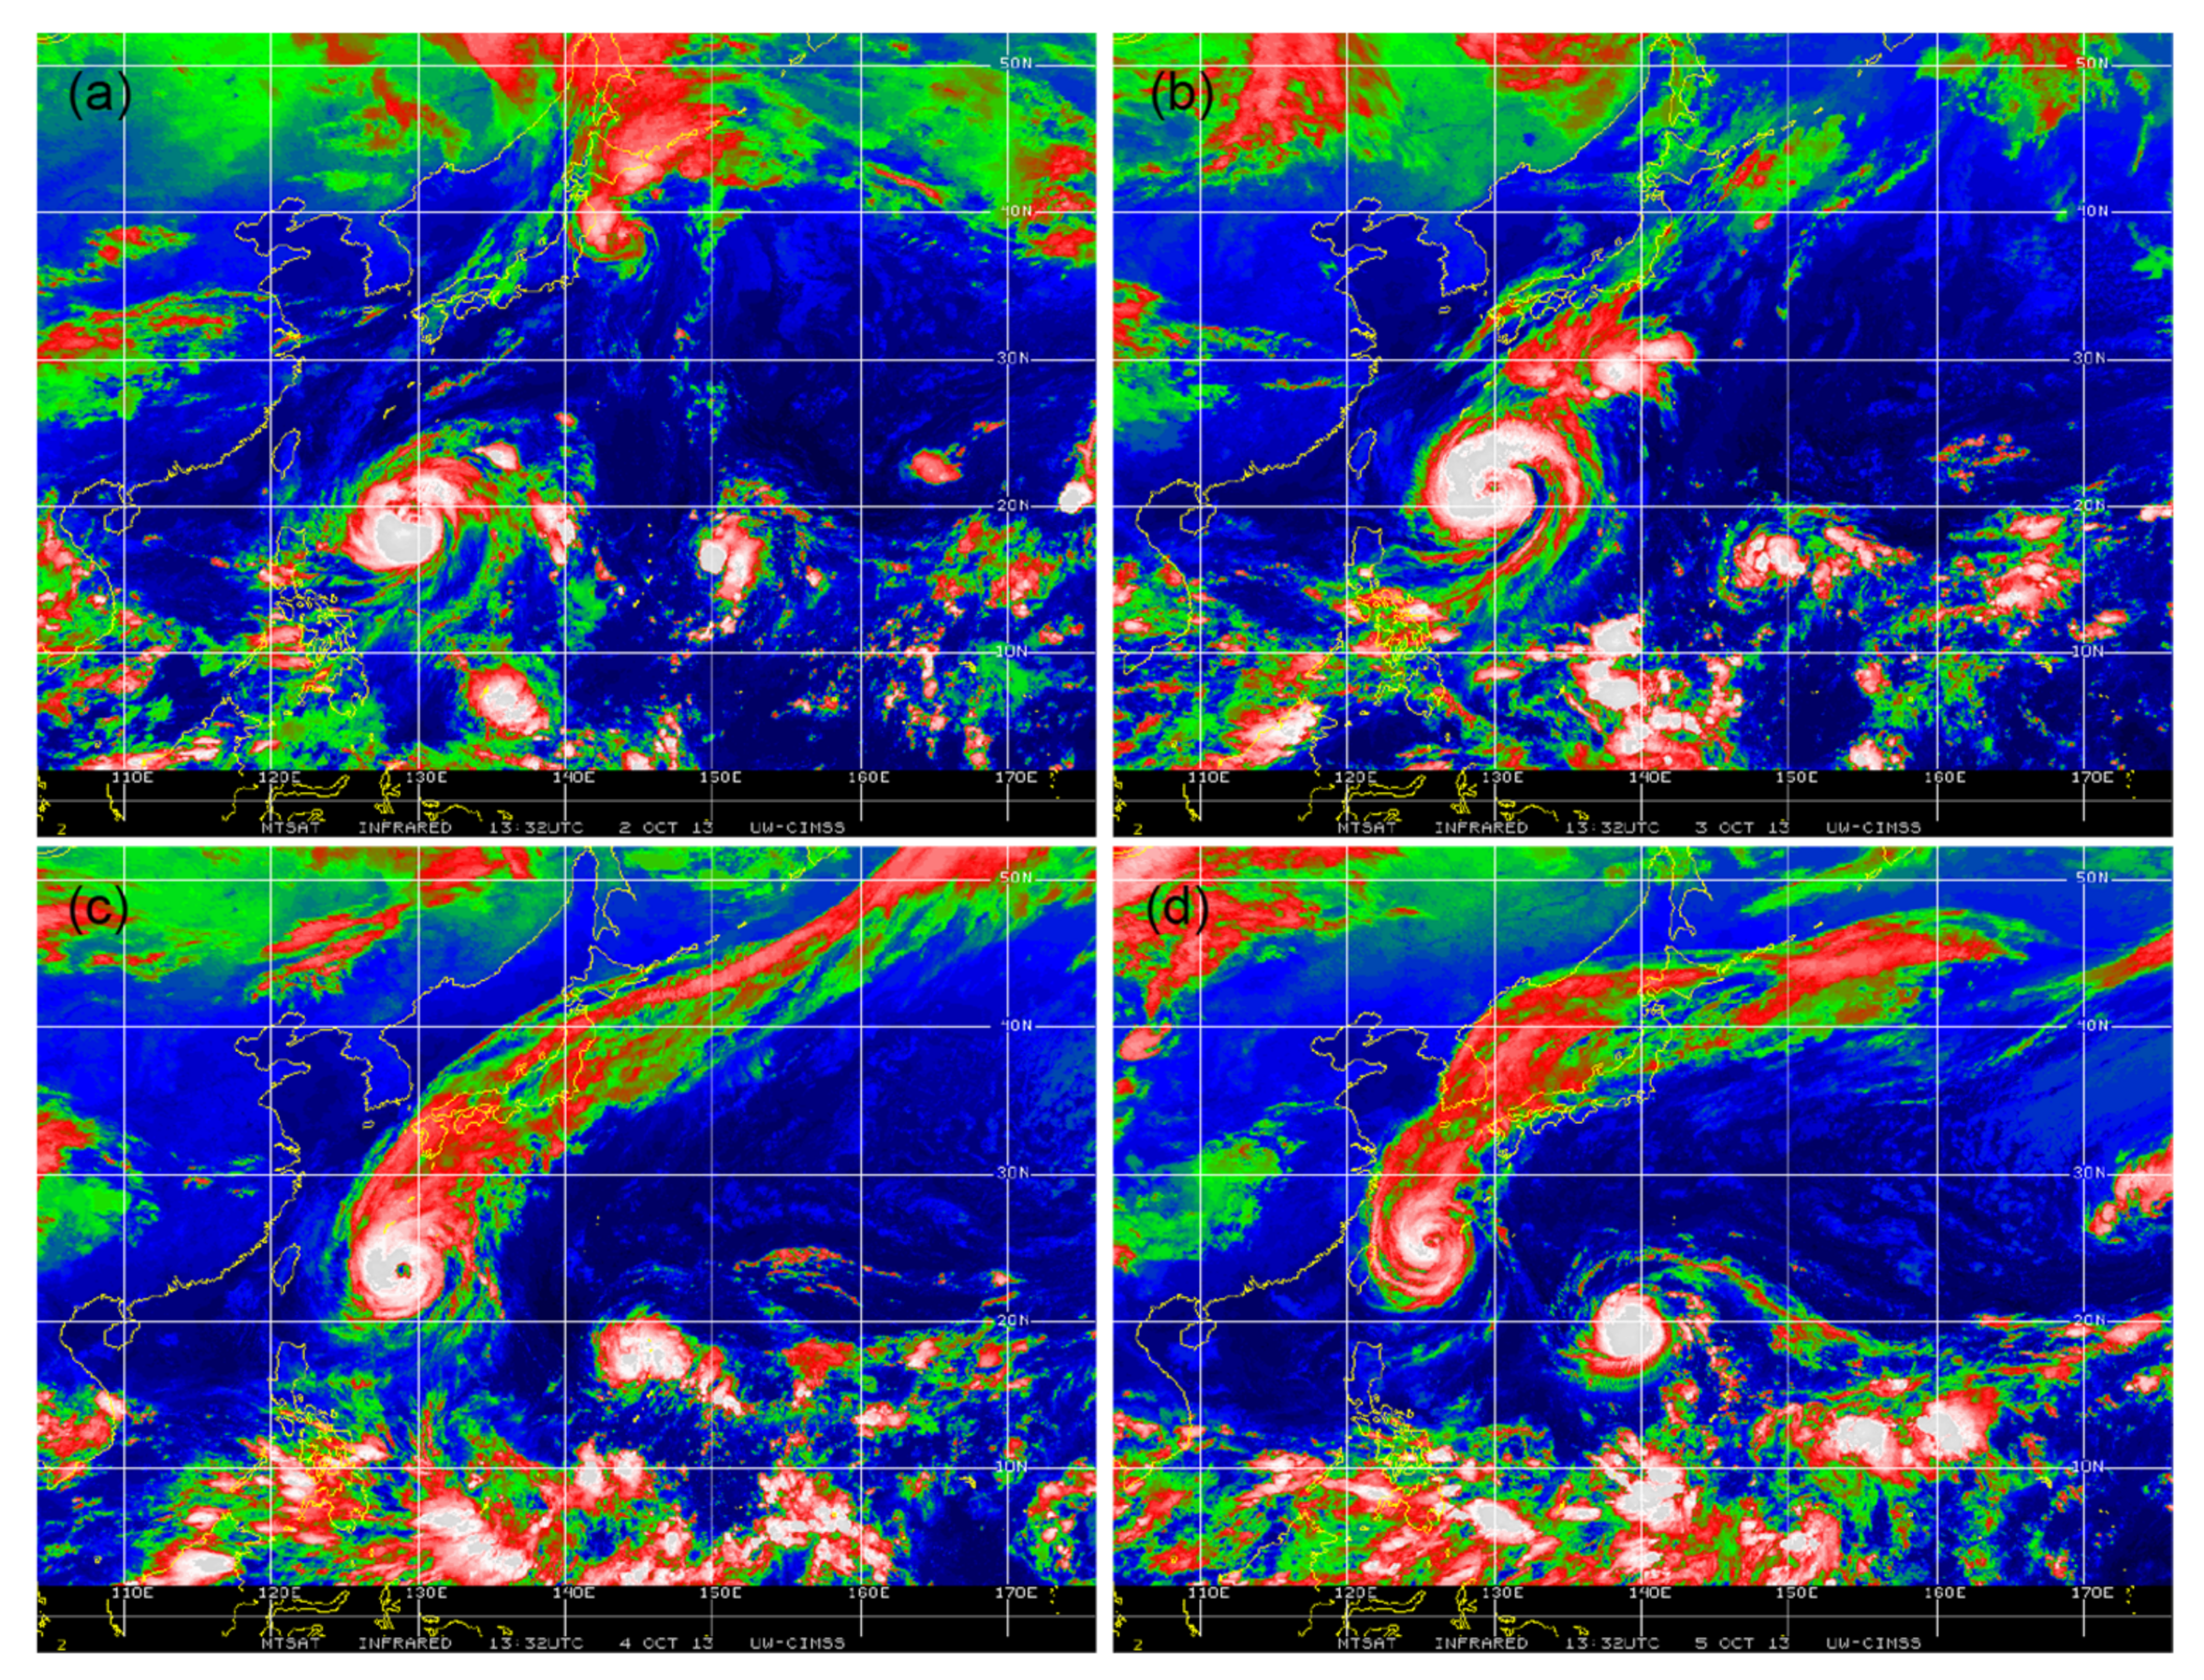
As indicated by the corresponding infrared satellite image in Figure 3, the cloud structure of Typhoon Fitow gradually developed and expanded during the poleward period from tropics to higher latitude (Figure 3a,b). Additionally, the most striking characteristic is that the widely convective cloud mass emerging to the northeast gradually merged with the TC peripheral cloud band during the Fitow’s westward track change (Figure 3b–d).
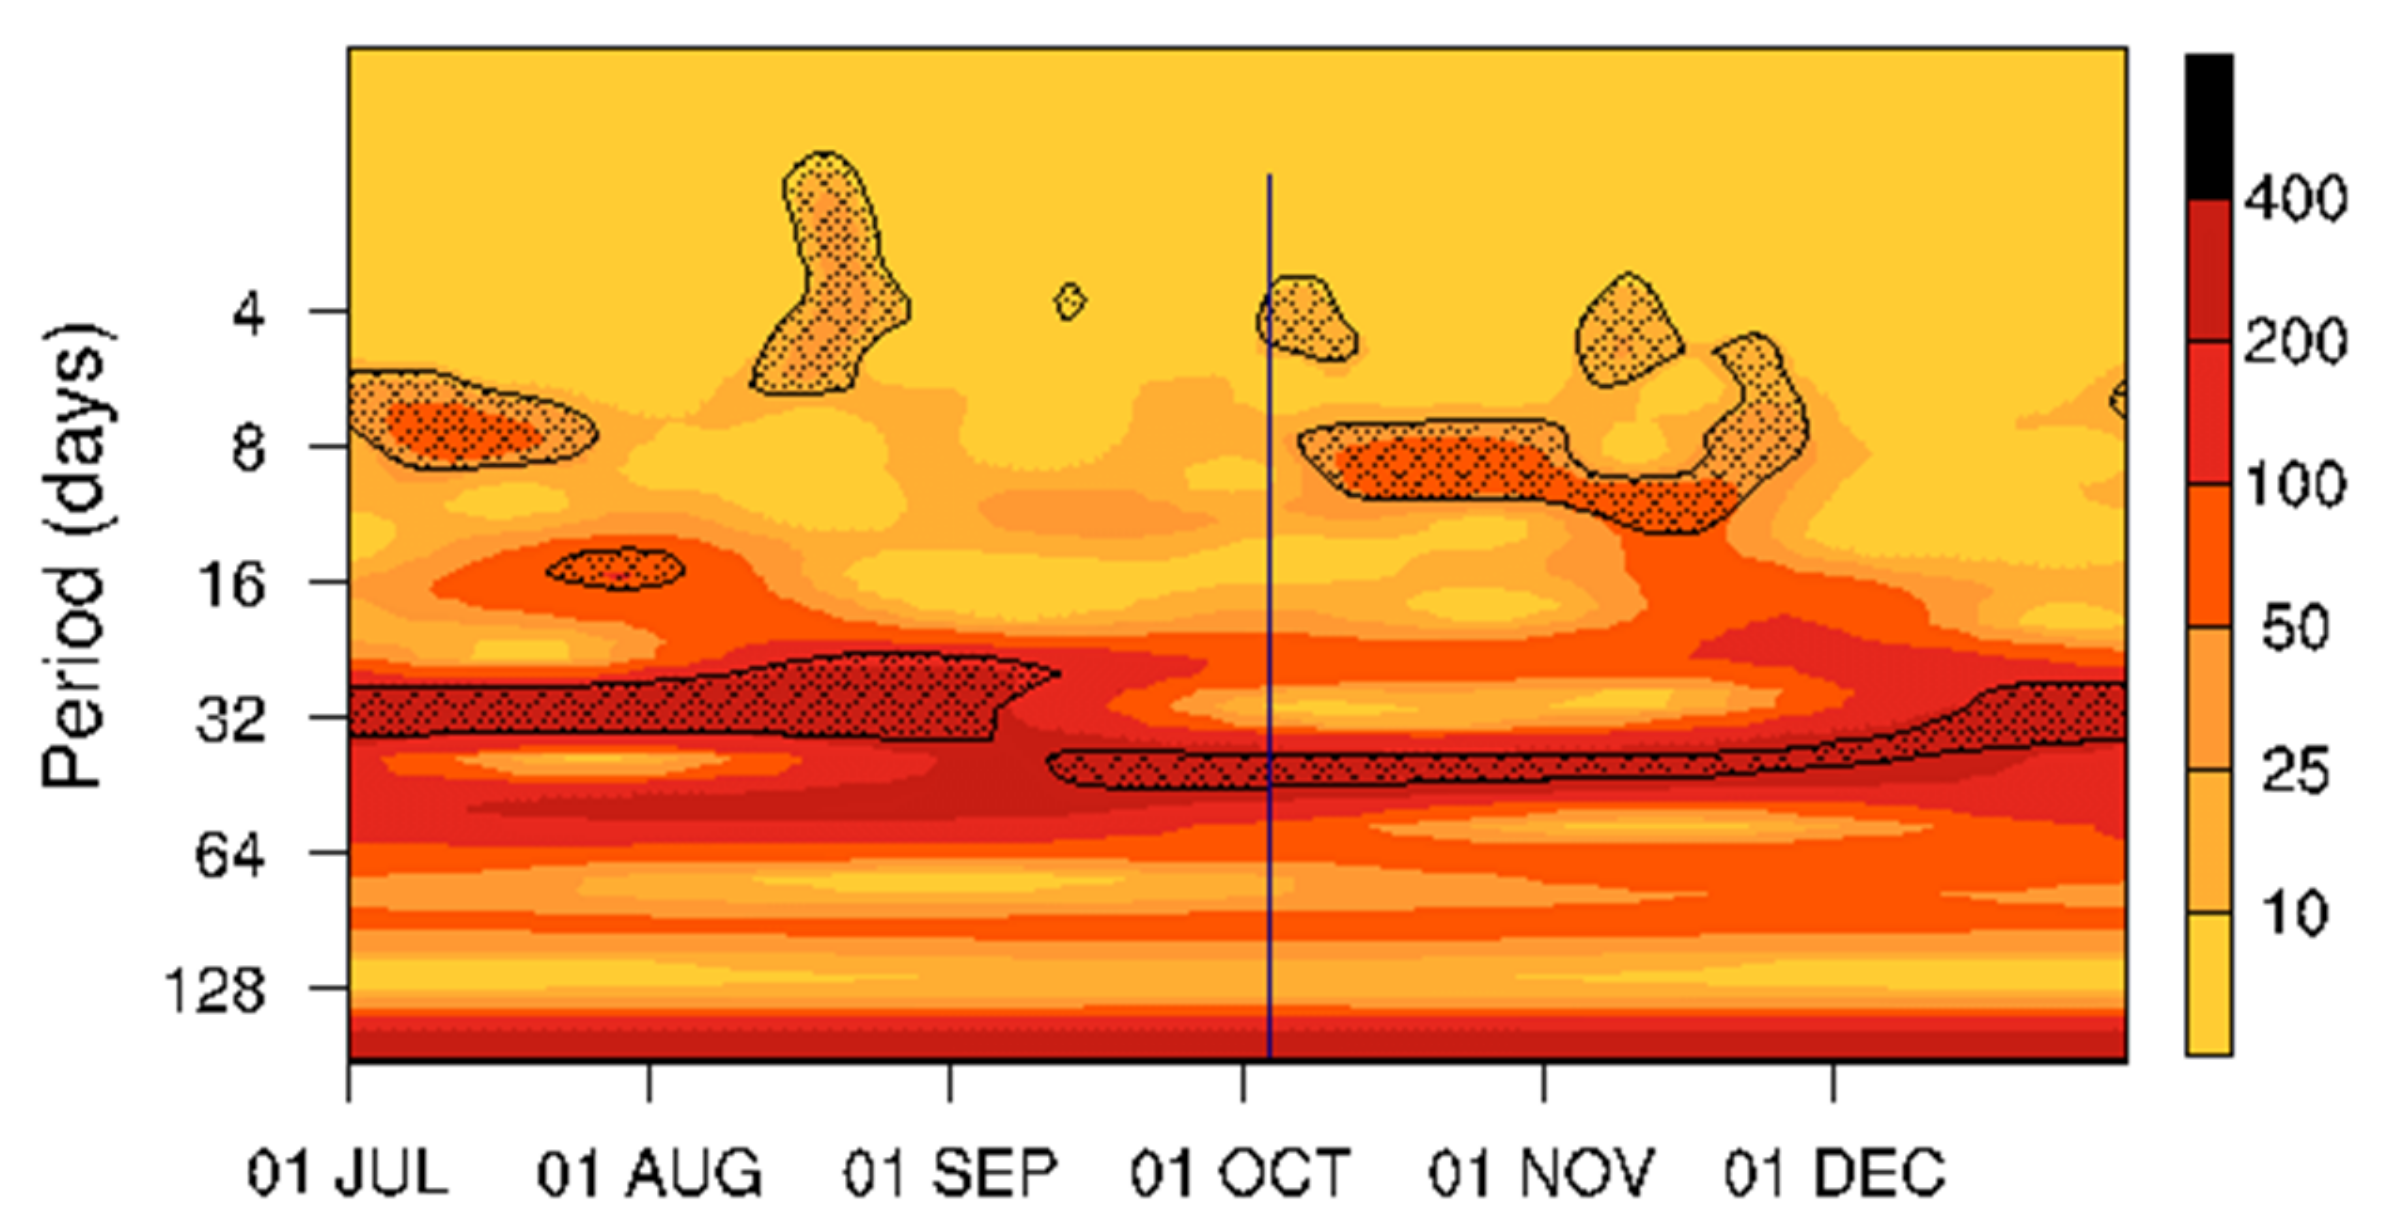
Furthermore, we conducted the wavelet power spectrum of outgoing longwave radiation (OLR) averaged over the region 5° N–30° N and 112.5° E–135° E where the WNP monsoon is active with prominent intra-seasonal variability. The daily OLR used has 2.5° × 2.5° grid spacing and a period of 6 months ranging from 1 July to 31 December 2013, obtained from the National Oceanic and Atmospheric Administration. Figure 4 indicates a prominent power peak at the ISO wave mode with a wide period of 10–90 days during the whole unusual track deflection. Therefore, it is intriguing to examine the individual roles of the complex atmospheric low-frequency oscillations in abruptly turning the track of Typhoon Fitow from northward to westward.
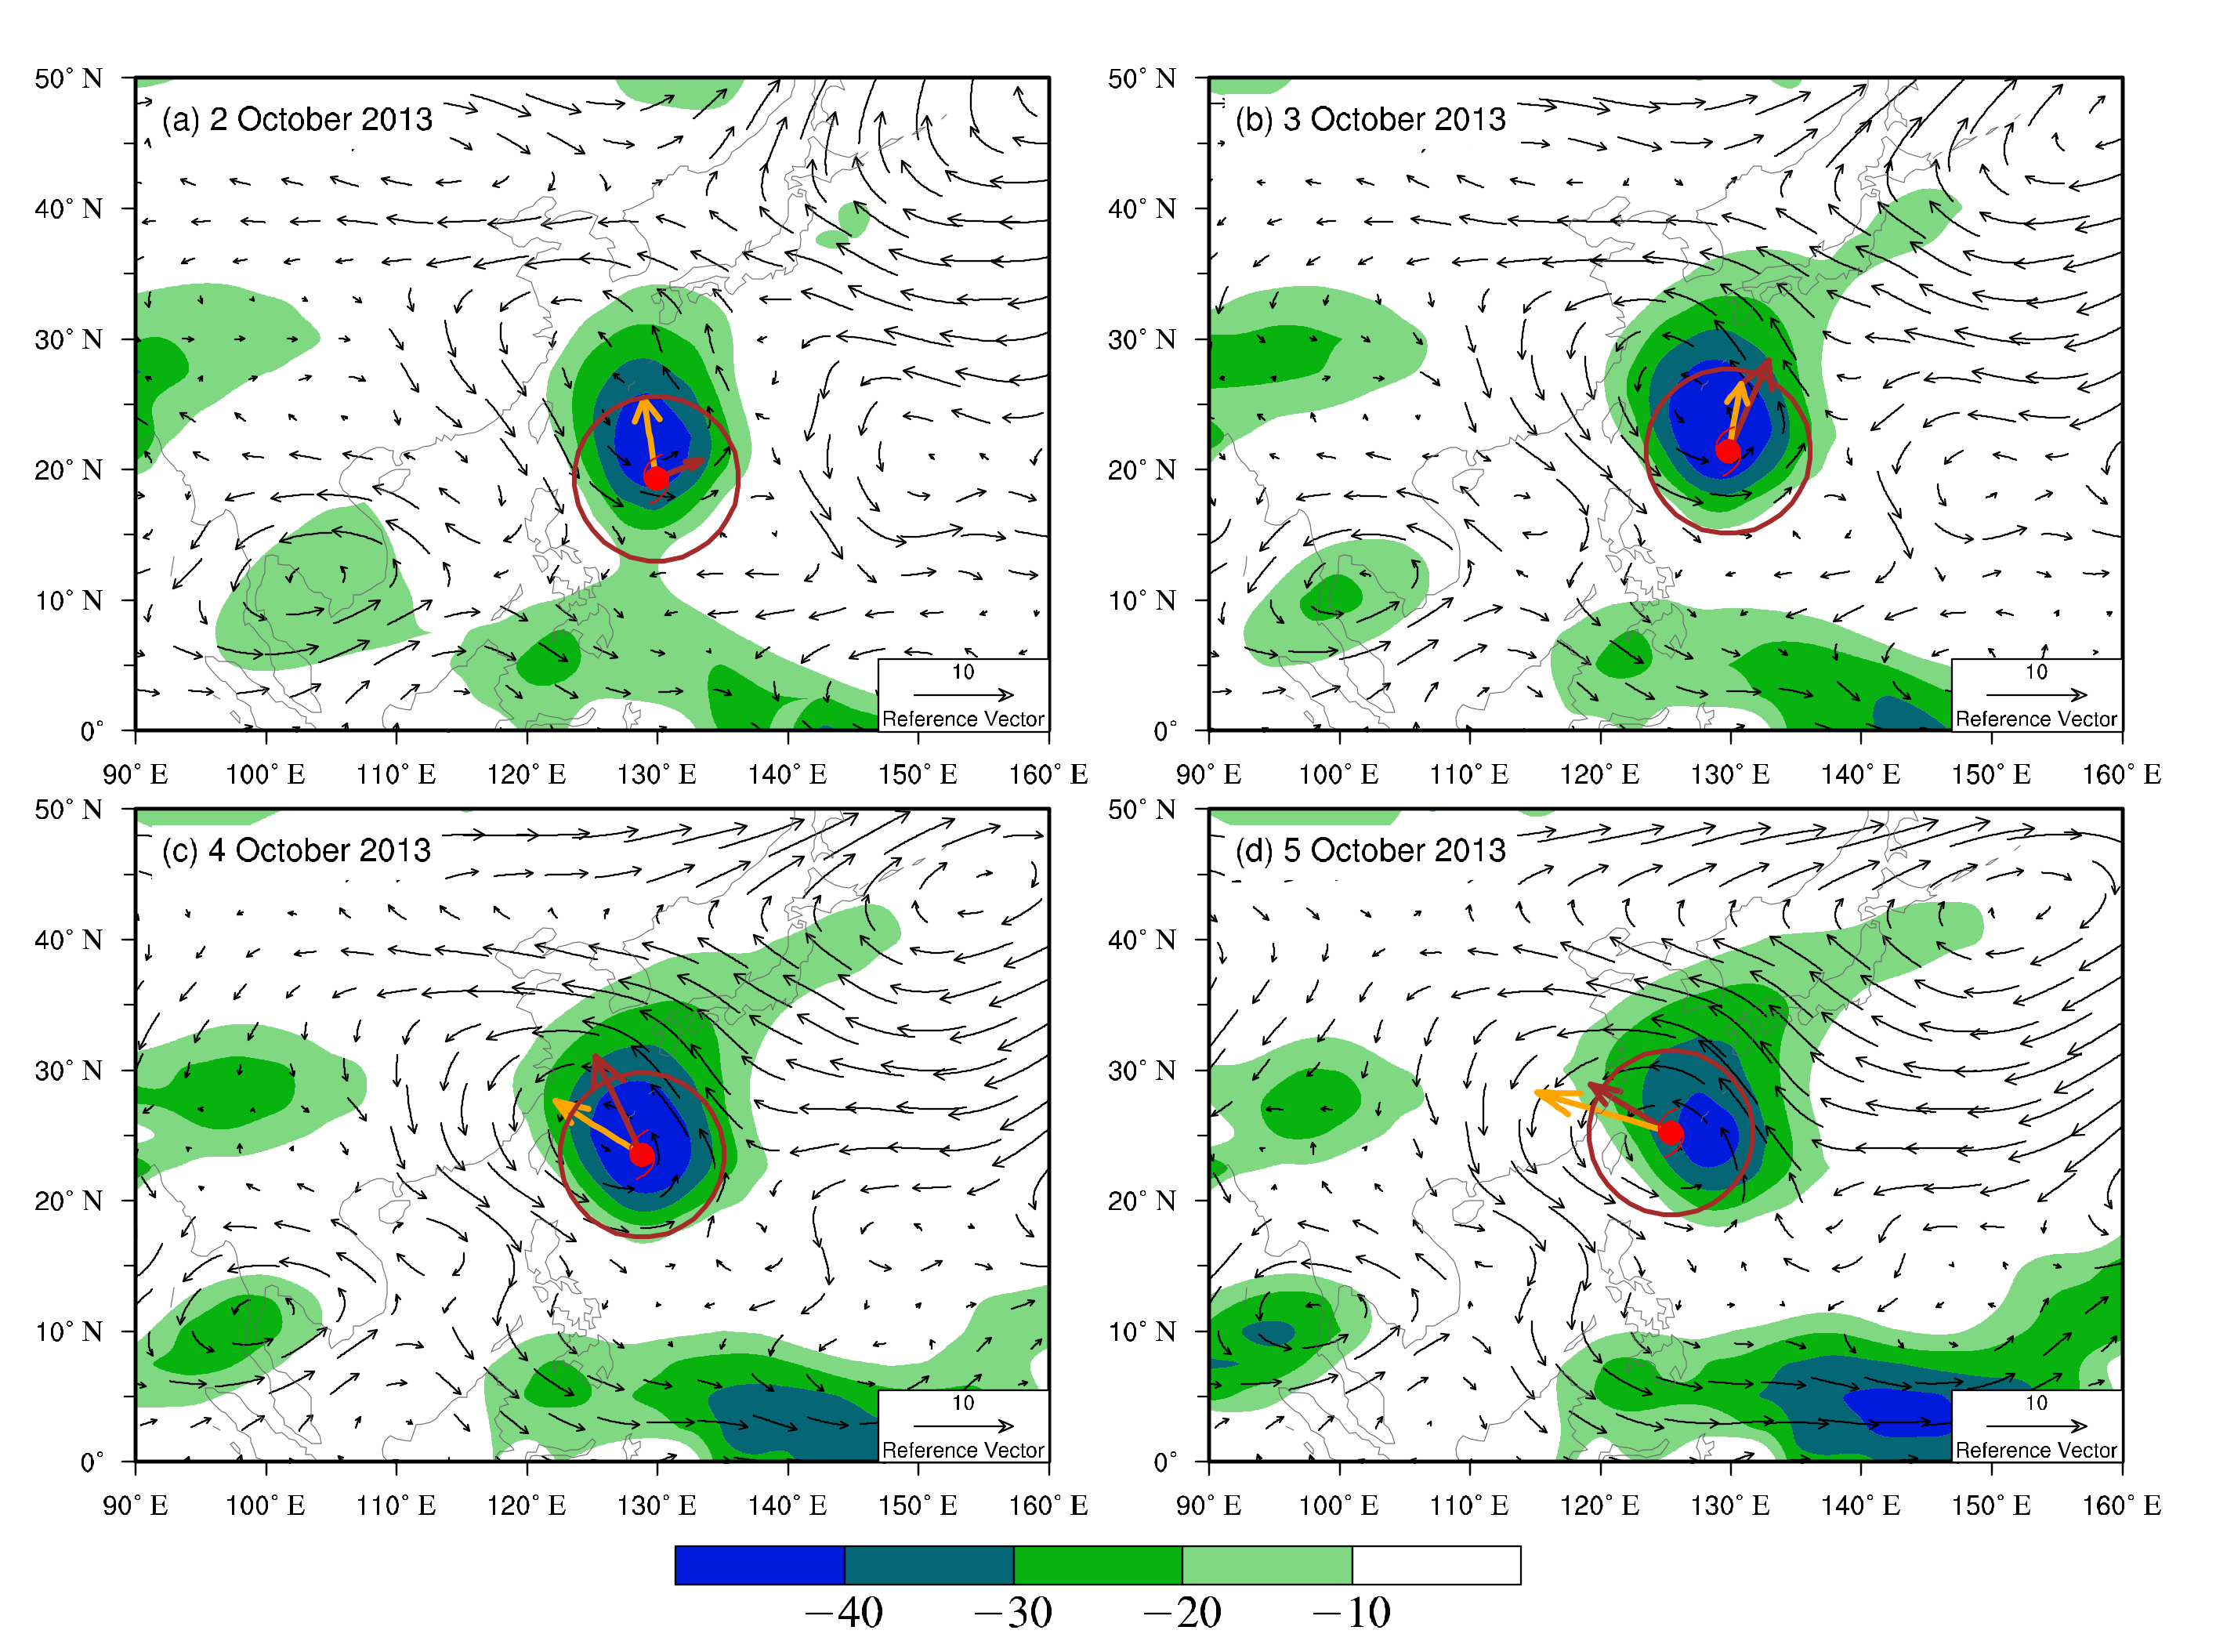
The temporal evolution of the environmental filtered fields and OLR anomalies associated with the 10–90-day ISO wave during the unusual westward deflection is presented in Figure 5. Note that, to diminish the effect of TC-related circulation, a TC removal algorithm proposed by Kurihara et al. [29,30] was adopted before filtering the wind fields. The TC center was first embedded on the southern flank of a weak and loose cyclonic ISO circulation (Figure 5a). Subsequently, the TC center was gradually merged with the center of ISO-scale cyclonic circulation as the ISO-related vortex strengthened with a huge anticyclonic circulation located to the northeast (Figure 5b–d). As a result, the anomalous southeasterly winds were enhanced on the southwest flank of this well-developed anticyclone to accelerate the counterclockwise change of TC motion direction. Therefore, the ISO components of large-scale environmental fields are hypothesized to play an important role in the abnormal westward turning of Fitow. Model simulation, the quantitative contribution associated with the ISOs, and the corresponding dynamical process responsible for Fitow’s unusual westward deflection are detailed in the next section.
3. Model and Experiment Design—Method
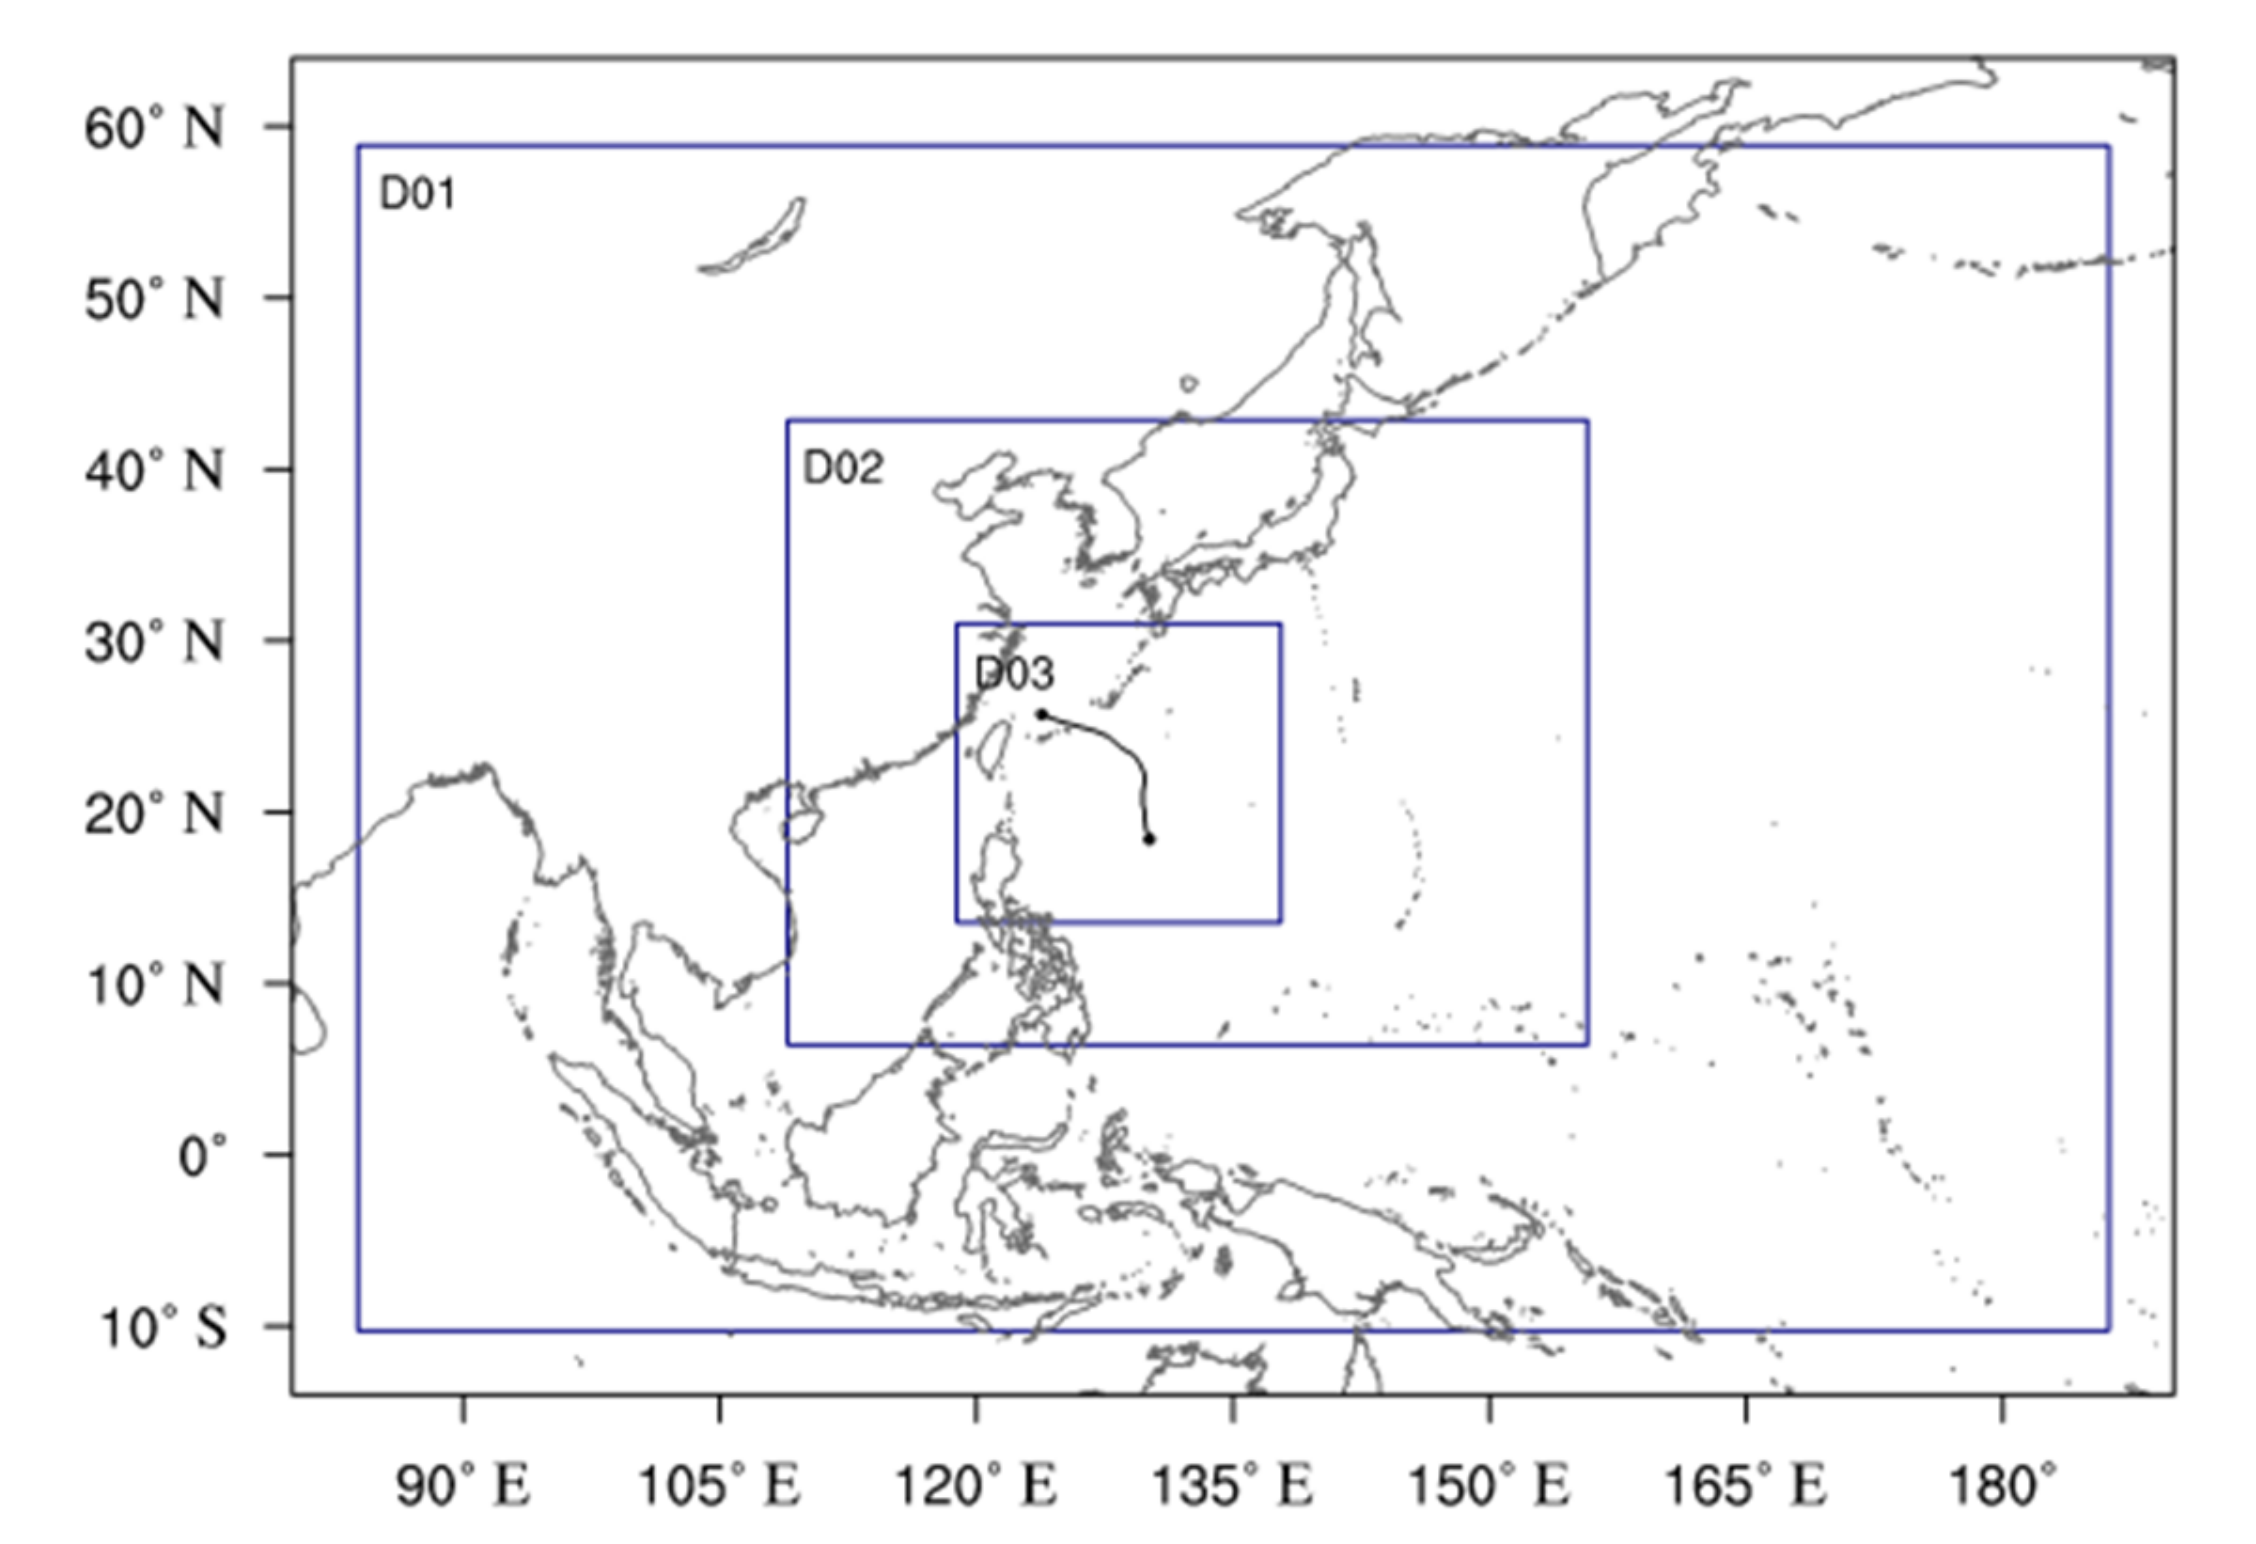
In order to investigate the effect of ISO on Typhoon Fitow’s unusual motion, the Advanced Research version of Weather Research and Forecasting Model (WRF-ARW; V3.6.1) is employed in this study [31]. Our simulations are configured with triple-nested and two-way feedback domains, which have horizontal resolutions of 27, 9, and 3 km grid spacing and 45 vertical levels ranging from surface to 50 hPa (Figure 6). The model physical schemes consist of the WRF single-moment five-class microphysics scheme [32], the Rapid Radiative Transfer Model longwave parameterization [33], the Dudhia shortwave parameterization [34], and the revised Monin–Obukhov surface layer physics [35]. and the Yonsei University planetary boundary layer scheme [36]. Additionally, a Kain–Fritsch cumulus parameterization scheme is used only in the outermost domain [37].
The 1° × 1° FNL analysis data with 6 h interval are taken as the initial and boundary conditions for the control simulation (CTL). To ensure the large-scale model features are close to the observational conditions, an extra nudging is set for wind fields in the outermost and intermediate domain.
There is a total of six experiments performed in our study including a CTL simulation and five sensitivity experiments removing the different ISO perturbations. A series of sensitivity experiments aim to illuminate further the relative influence of the different ISO components on the unusual track. A space–time filtering method developed by Wheeler and Kiladis [38] can identify the zonally eastward or westward propagating waves on various spatiotemporal scales by the wavenumber–frequency spectral analysis, which is employed to filter out the mandatory fields in our study (i.e., wind, temperature, relative humidity, geopotential height, surface pressure, and sea level pressure) associated with the wave bands of the ISO, the westward-propagating ISO, the eastward-propagating ISO, the westward-propagating ER wave, and the eastward-propagating MJO from the initial and boundary conditions, respectively (see Table 1 for details). Based on the same model physics setting, all simulations start at 0600 UTC 2 October 2013 and are integrated for 90 h covering the whole period of the westward deflection of Typhoon Fitow.
4. Simulation Results
4.1. Experiments CTL and NOISO
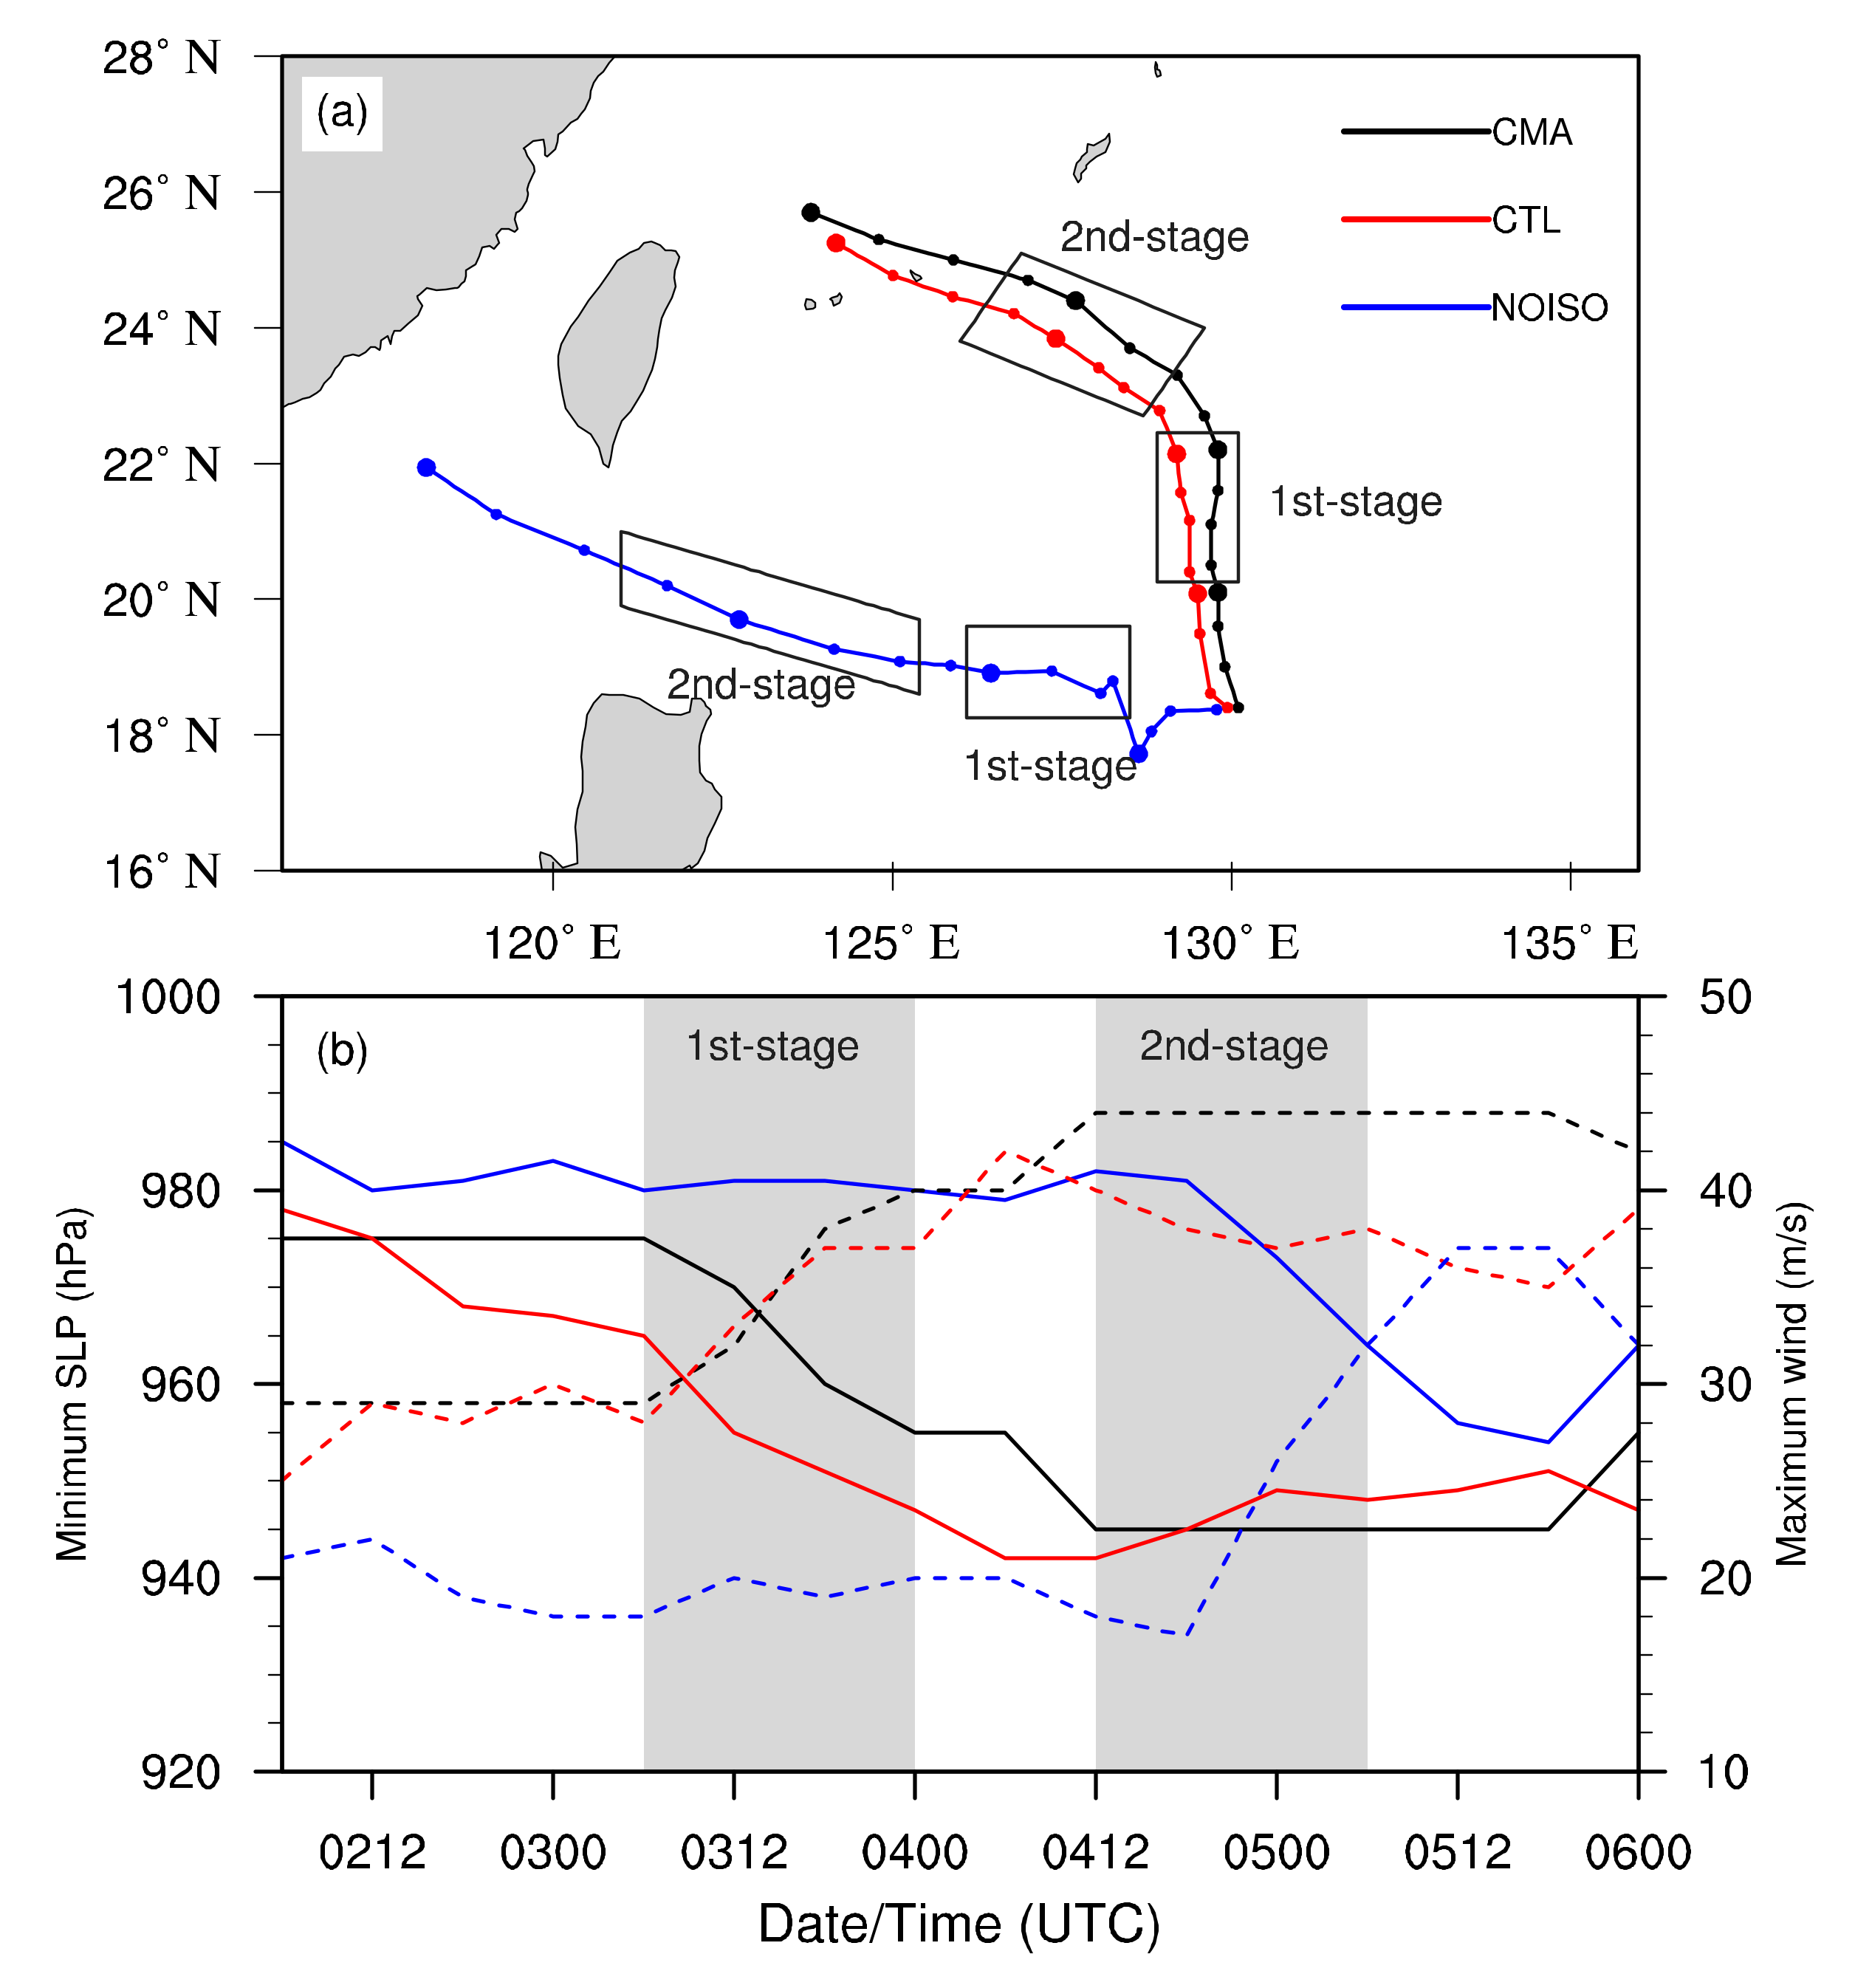
In CTL, the TC continuously moves poleward and intensifies progressively in the first two days until the TC experiences abrupt anticlockwise turning at around 23° N. Subsequently, the TC maintains intensity and west–northwestward motion (Figure 7). Compared with the best track, the simulation reasonably reproduces the unique feature of the westward track deflection with the track errors are less than 100 km during the whole simulation. Additionally, the intensity in CTL in terms of the minimum sea level pressure and maximum wind is fairly close to the TC best-track dataset.
Furthermore, the removal of ISO-related components causes the TC to move northwestward directly after an initial short zigzagging track in the NOISO experiment (blue line in Figure 7a). Meanwhile, the TC does not intensify until entering the South China Sea and develops much later and weaker than the observed and CTL intensity (Figure 7b). The corresponding simulated TC in NOISO display the similar track and intensity to those in previous studies for other TC cases over the WNP basin [2,39], in which TCs move straight westward under the uniform background without the effect from ISO-scale fluctuation.
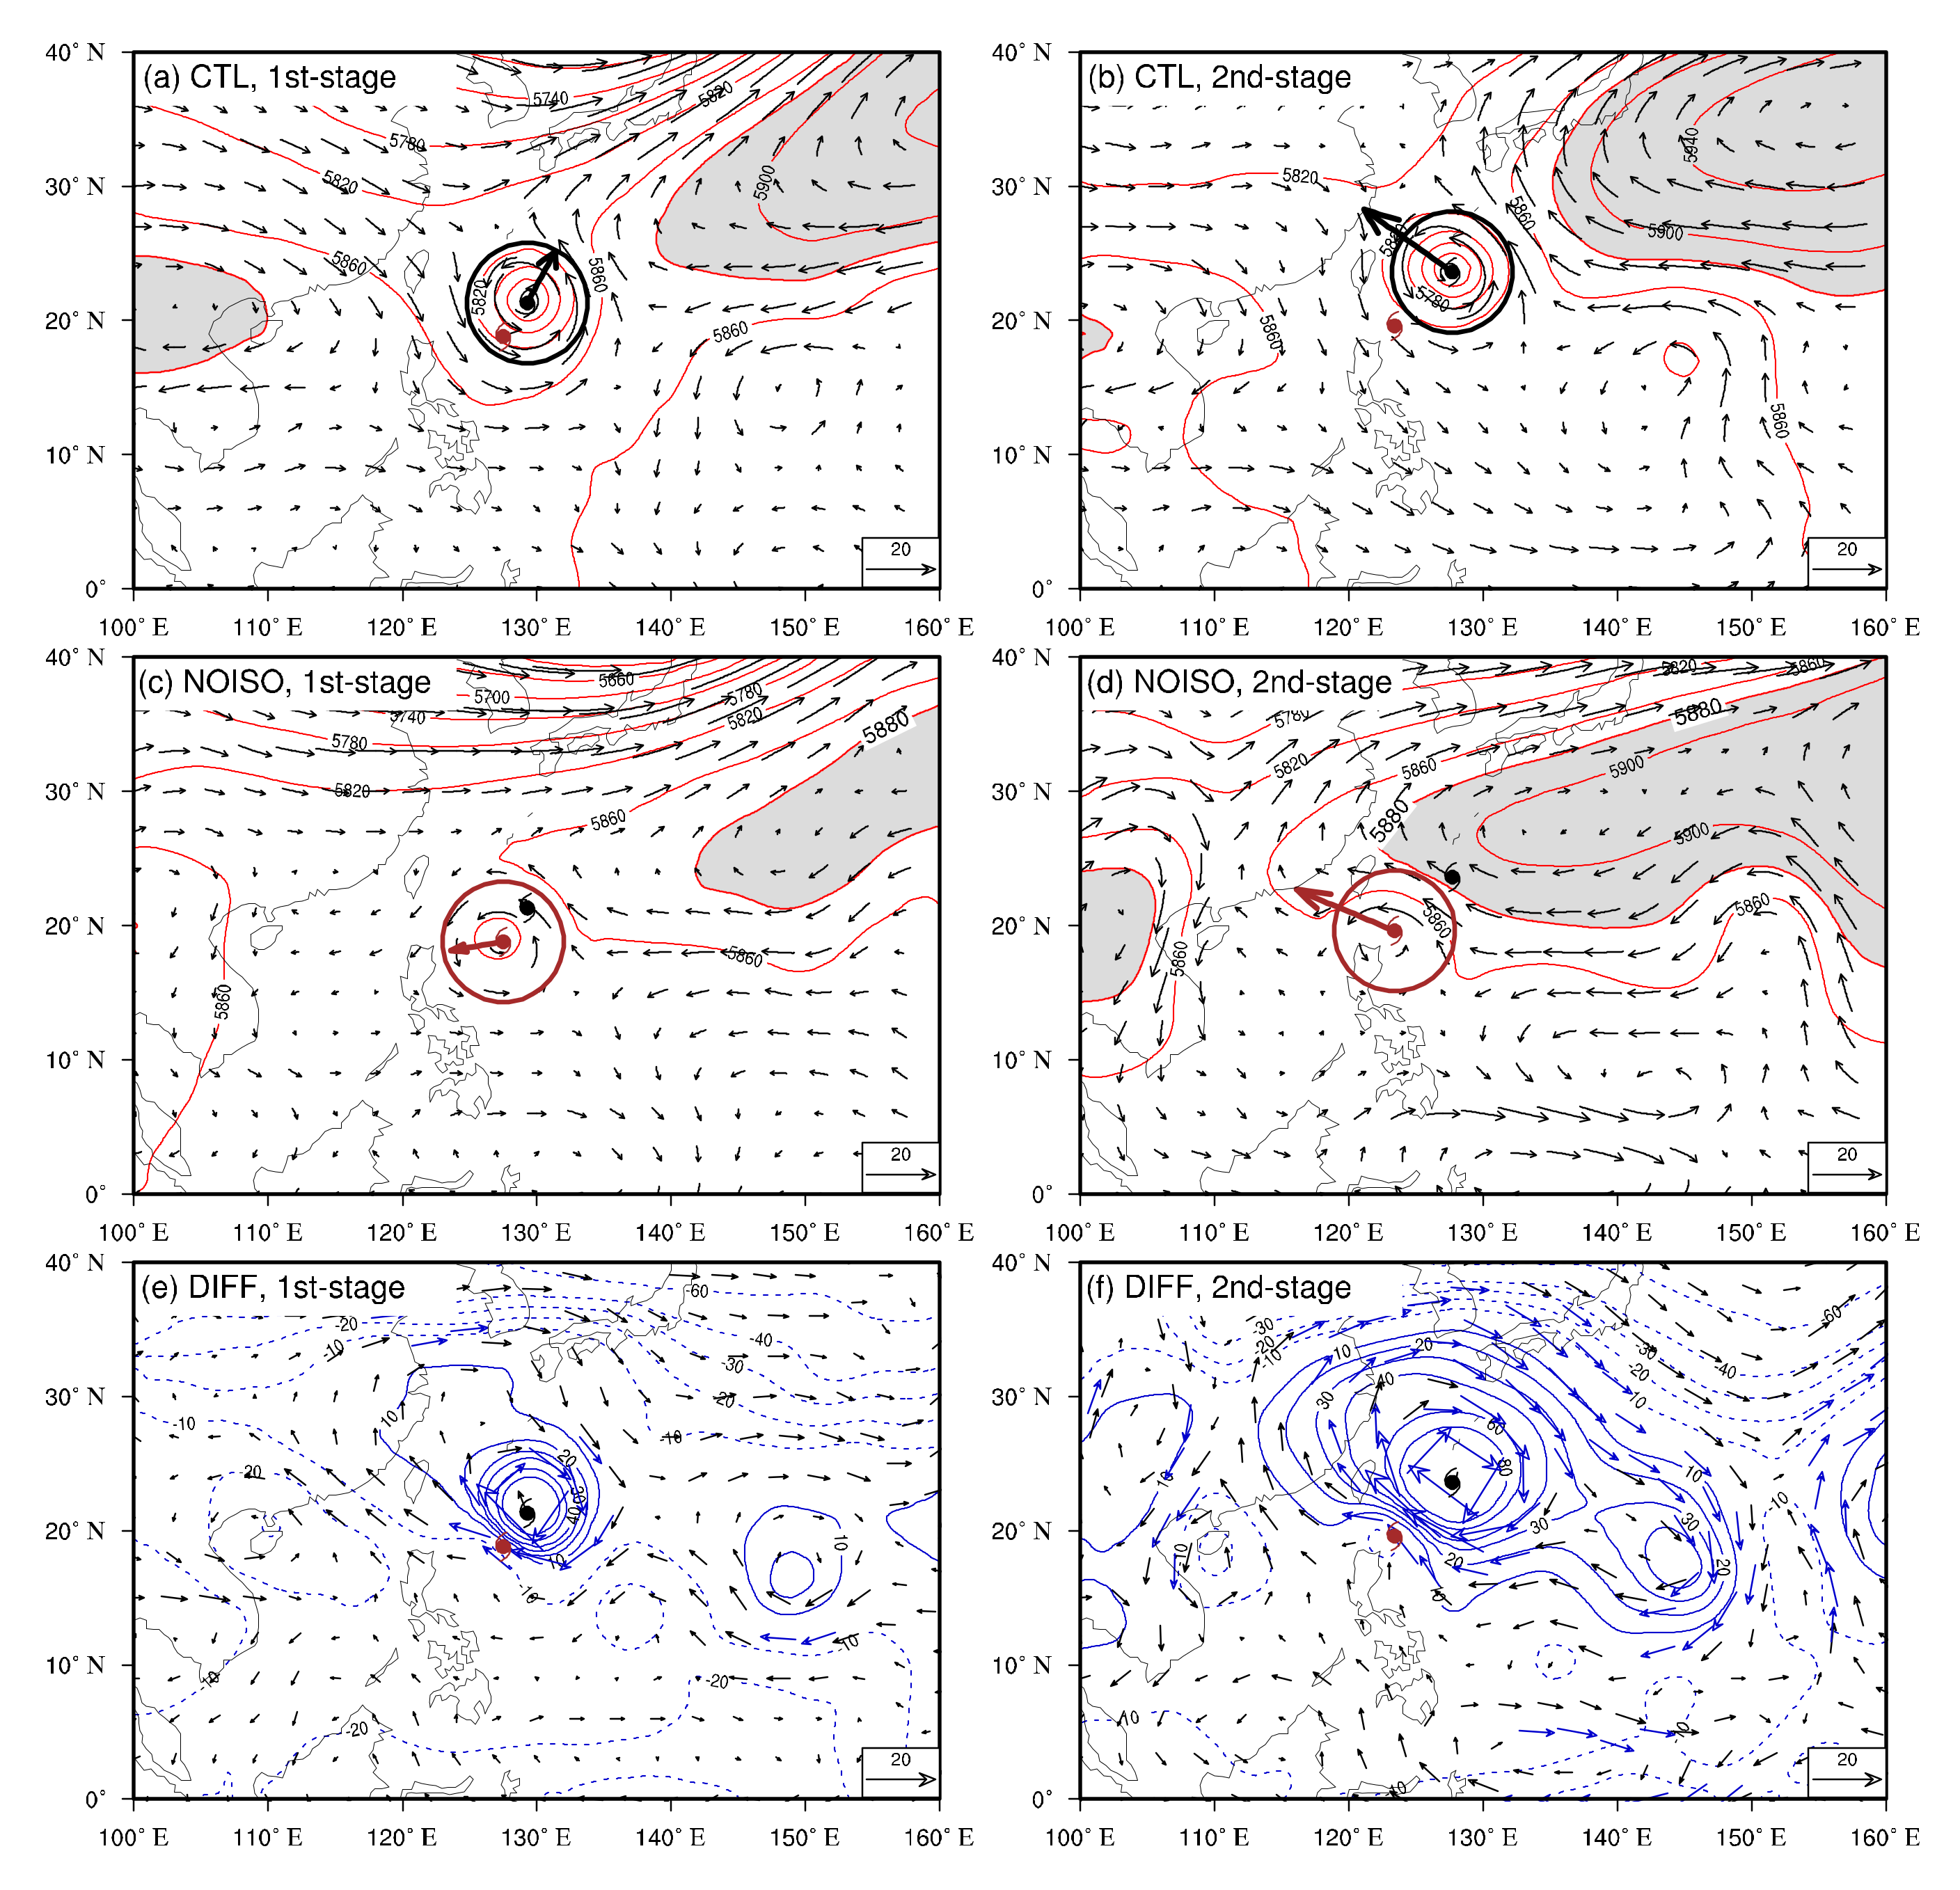
We further analyze the related large-scale circulation and steering flow in CTL and NOISO. As shown in Figure 7a, Typhoon Fitow in the CTL experiences two distinct stages; specifically, the first covers a part of the northward track from 0600 UTC 3 October to 0000 UTC 4 October, and the second begins from 1200 UTC 4 October to 0600 UTC 5 October during which the unusual westward track deflection occurs. Figure 8 presents the simulated large-scale environmental fields in CTL and NOISO averaged over the two stages, respectively. The TC in CTL (Figure 8a,b) is embedded within the circulation similar to the observation indicated in Figure 2. The northward-retreating mid-latitude trough and the westward-extending subtropical high at the north of 20° N are both simulated well before and after TC deflection. The calculated steering vectors also agree better with the simulated TC movement and westward track deflection. In contrast, when the ISO-related components are removed before the track deflection happens, it is clear that the mid-latitude trough in the first stage of NOISO is much shallower than that in CTL, a weaker TC maintains a westward track during the whole simulation (Figure 8c,d). This discrepancy in the TC track between CTL and NOISO can be elucidated by the differences in deep-layer mean winds and 500 hPa geopotential height between these two simulations (Figure 8e,f). The positive geopotential height anomalies and the anomalous anticyclonic circulations are pronounced at 20° N~30° N in the vicinity of the TC center, which weakens the intensity of the mid-latitude trough. Hence, the northward environmental wind is obviously reduced in the first stage of NOISO. Furthermore, the anomalous easterlies in the southern flank of this anticyclone facilitate the straight westward movement of the TC, which occurs with westward stretching and development of the subtropical high. These confirm that removing the ISO fluctuation can affect the large-scale circulation patterns and thus modify the movement of the TC.
4.2. Sensitivity of TC Track Deflection to the Zonal Propagation of ISO
It is noted that the whole ISO band consists of westward- and eastward-propagating components, in which ER and MJO are major modes, respectively. In order to evaluate their relative roles in the unusual track deflection of Typhoon Fitow, it is necessary to further filter out these two components for comparison.
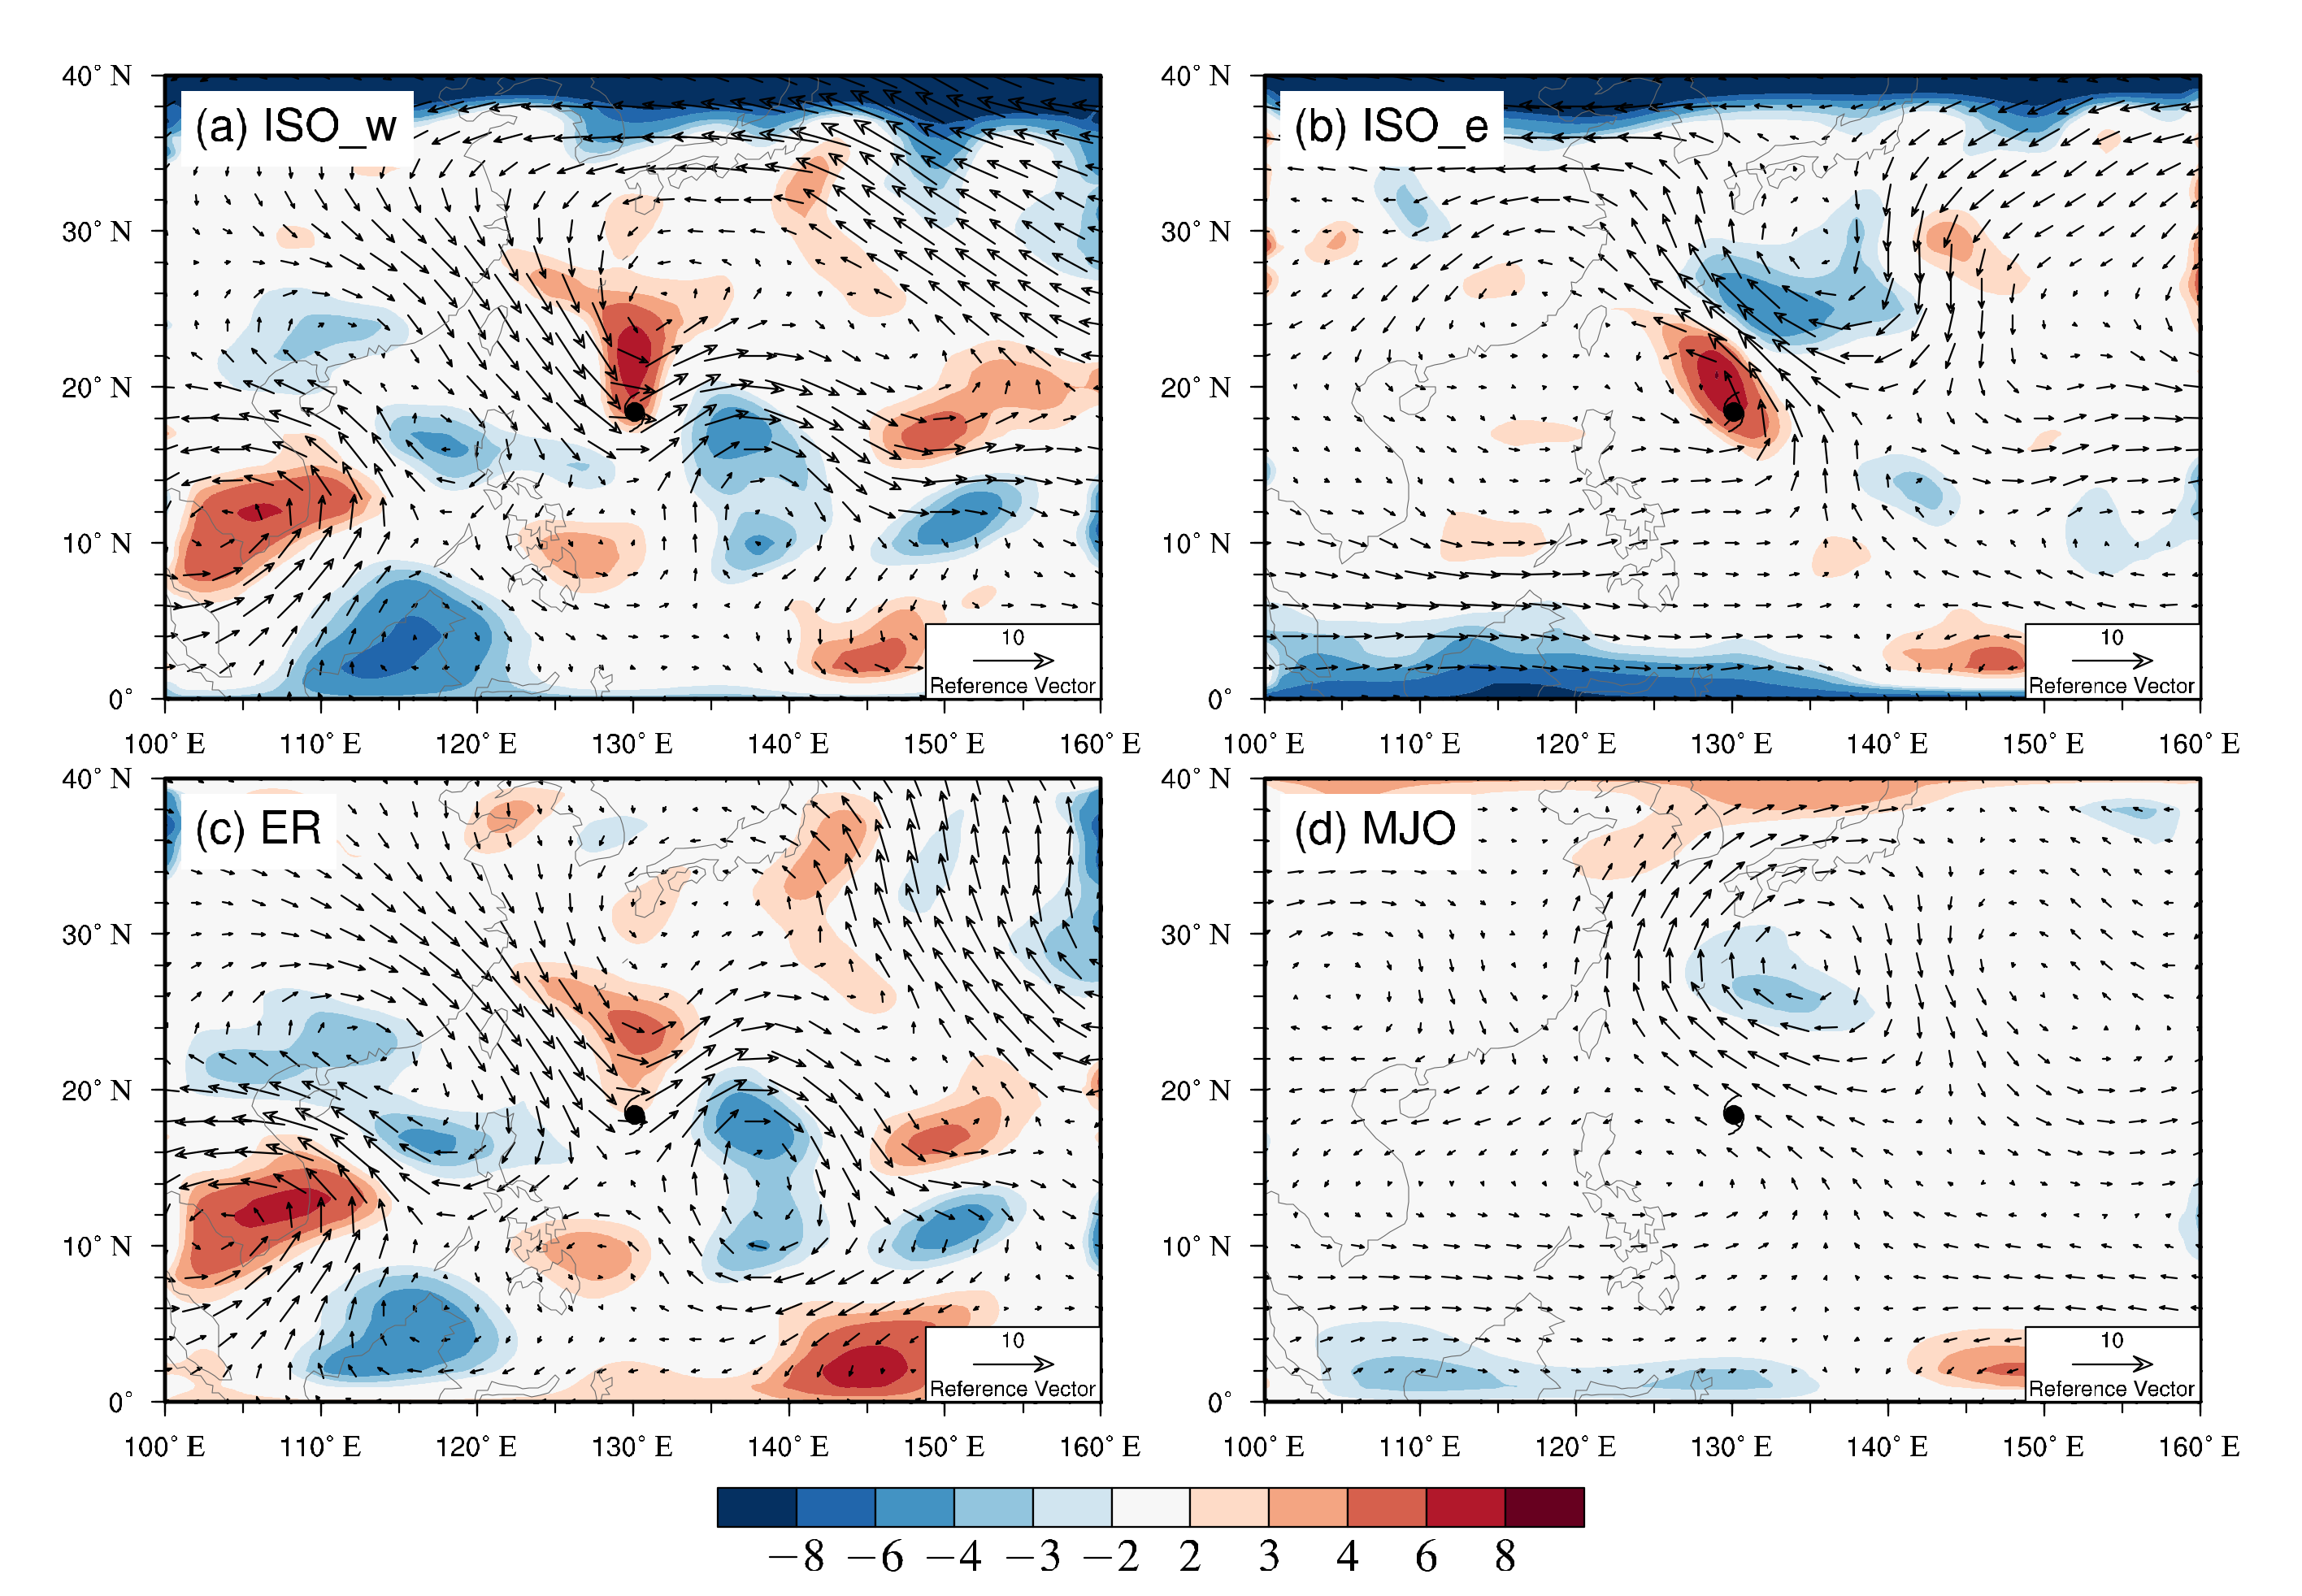
The space–time filtered disturbances associated with westward- and eastward-propagating ISO components, ER and MJO modes at the initial time of simulation, are presented in Figure 9. Note that Typhoon Fitow is embedded within the distinct large-scale ISO circulations with different propagation directions. The westward-propagating ISO and ER fields reveal a similar circulation structure (Figure 9a,c), the TC center is located at the bottom of a westward-propagating ISO- and ER-related cyclonic circulation, surrounded by strong easterly anomalies. It reflects that the westward-propagating ISO component is dominated by the westward-propagating ER wave, which has been found to be responsible for TC activity [40,41,42,43]. Additionally, the MJO fluctuation is generally considered as a dominant eastward-propagating mode in the ISO scale and significantly modulates TC activity over the WNP [44,45]. In this case, as indicated by the eastward-propagating component among the ISO-scale wave mode (Figure 9b,d), Typhoon Fitow is embedded within the anomalous southeasterly flows flanked by a southwest–northeast-oriented circulation dipole.
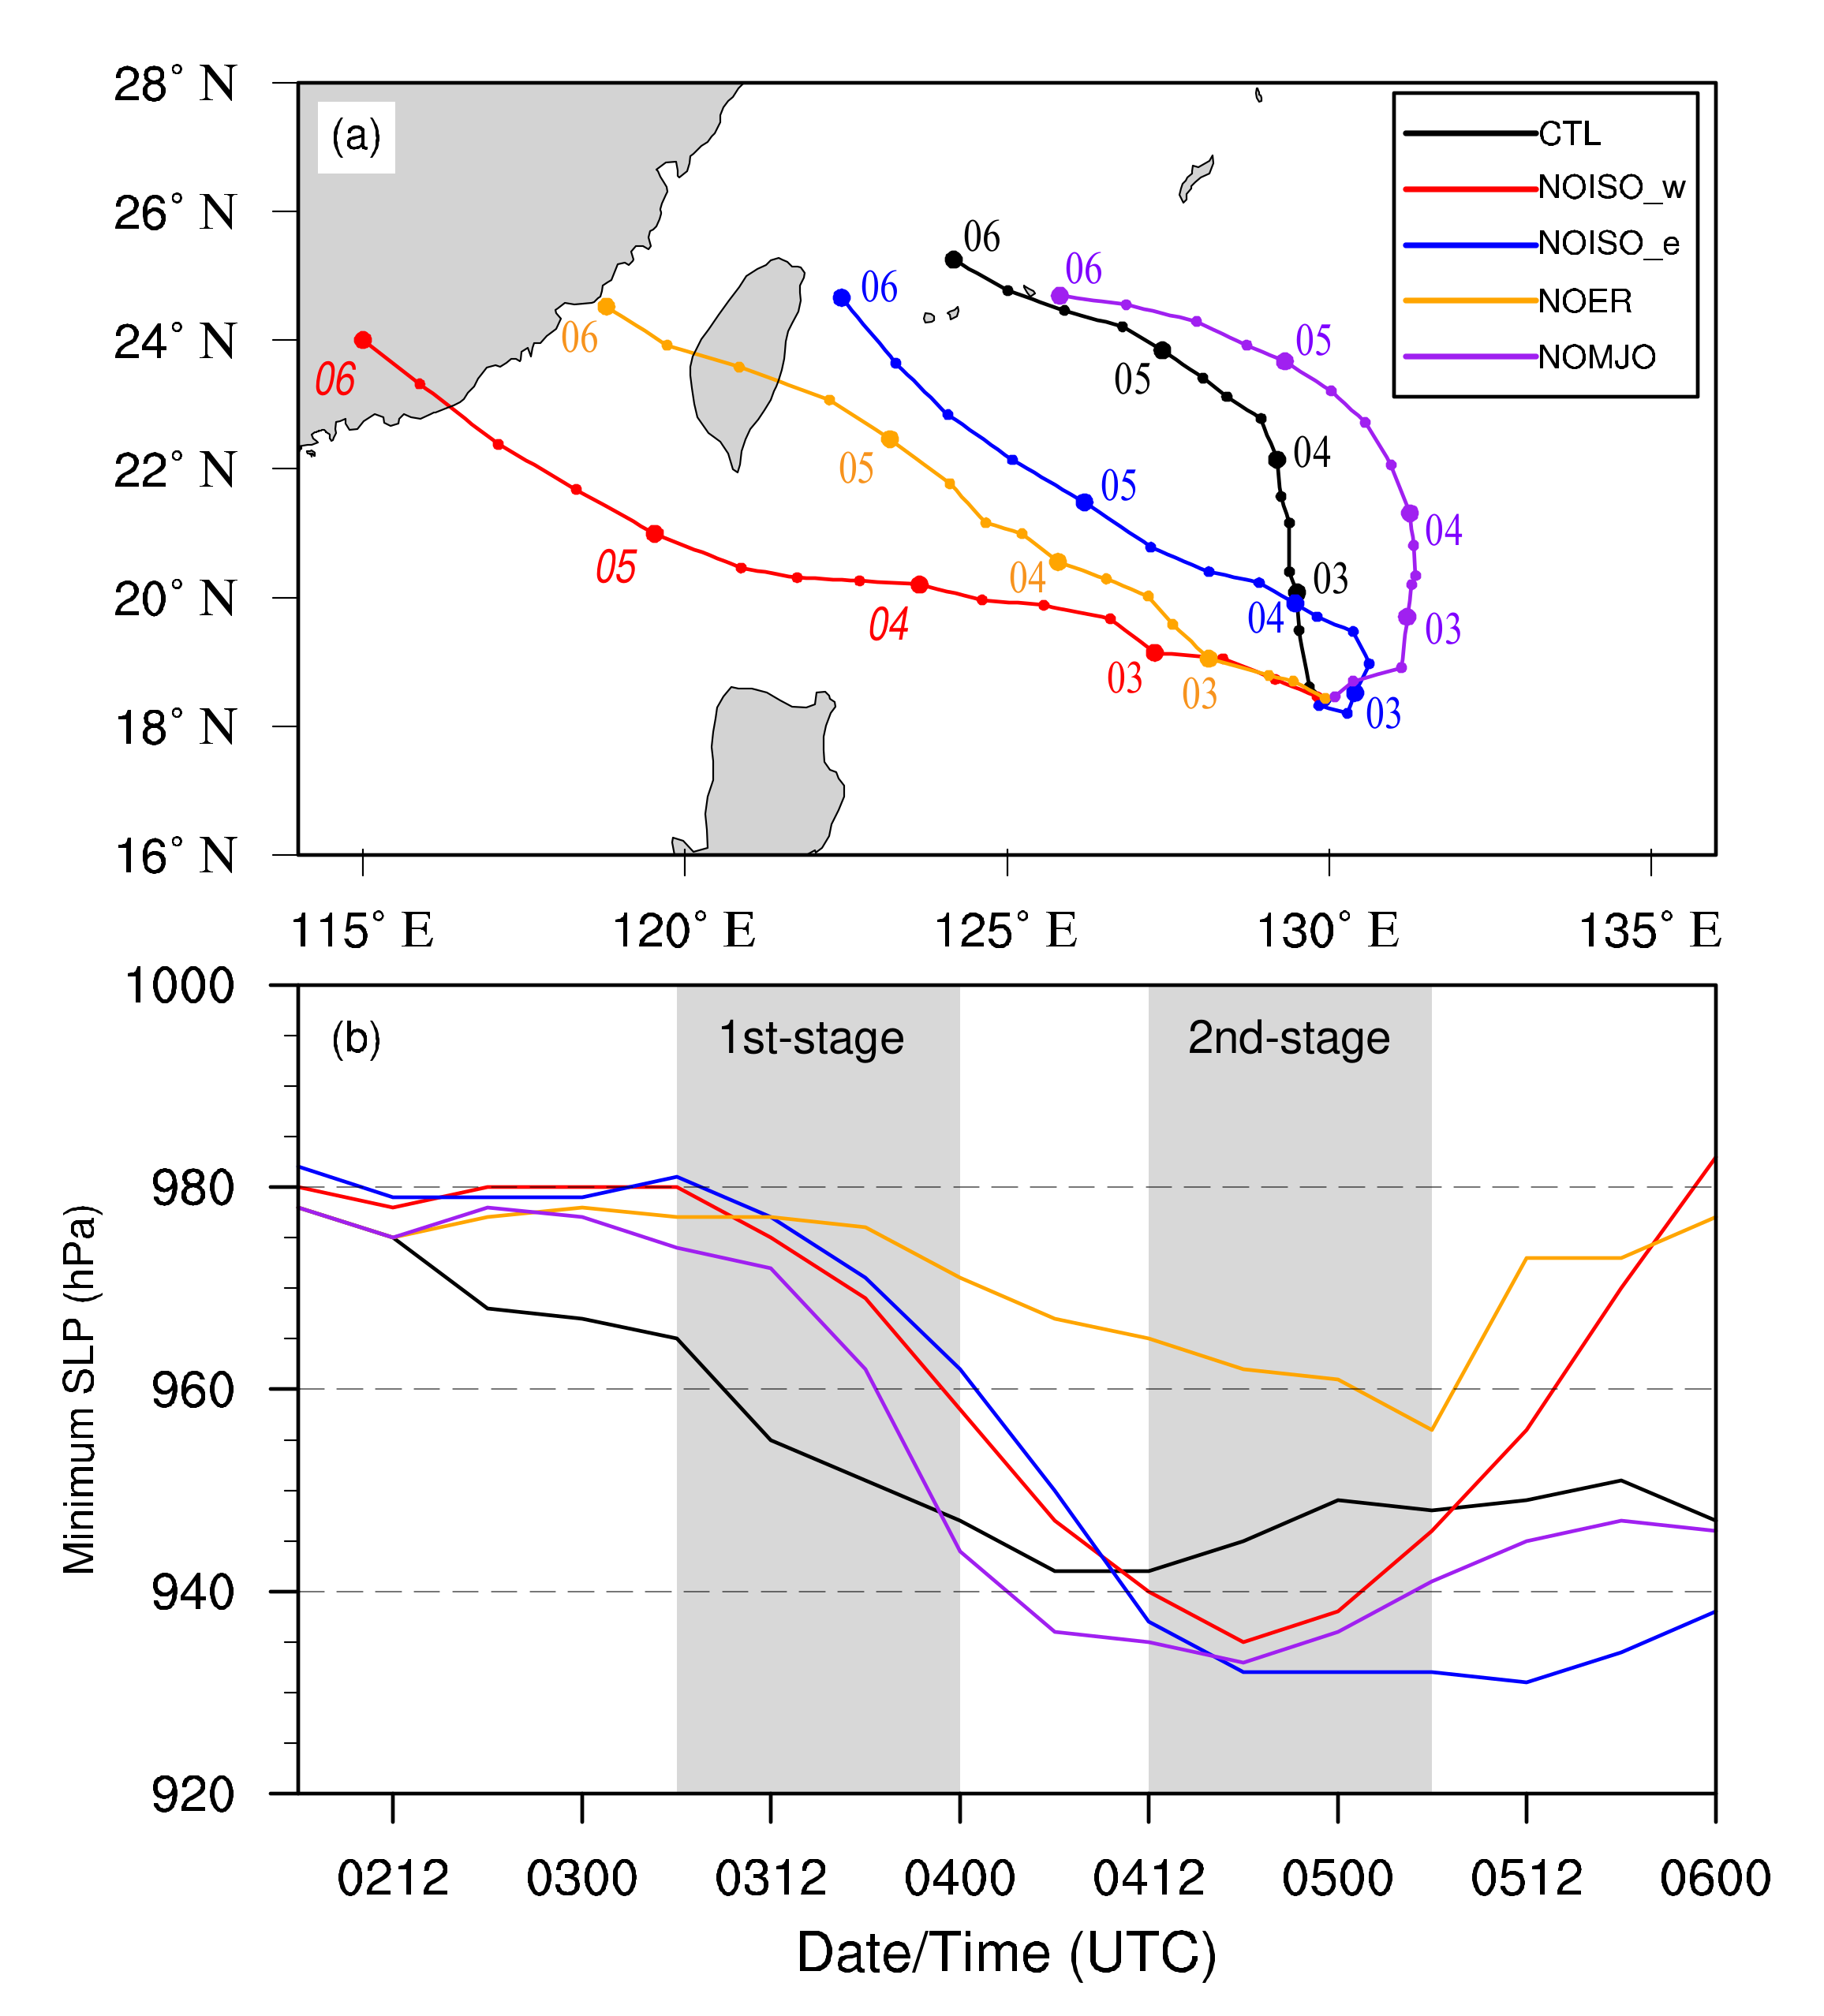
The individual influences of various ISO modes on the development and movement of Typhoon Fitow are investigated in a series of sensitivity experiments, in which the corresponding ISO components are removed. Figure 10 presents the TC simulated tracks and intensities in the four sensitivity experiments. Compared with CTL, the TC in these simulations generally takes on two types of movement scenario. Specifically, when the westward-propagating ISO components are filtered out in NOISO_w and NOER, Fitow is found to maintain the stable northwestward motion without any track deflection (Figure 10a). This track is similar to the NOISO experiment (Figure 7a), which reflects the westward-propagating component that has a dominant role in influencing ISO on the unusual track. However, the TC in the NOISO_w has a more southward track with a large translation speed in comparison with that for the NOER. Furthermore, in terms of intensity, the TC in NOISO_w gradually strengthens, and then decays swiftly prior to its landfall, while the TC in NOER has the weakest intensity among all experiments (Figure 10b).
In contrast, if subtracting the eastward-propagating ISO modes from the original fields, the TCs in NOISO_e and NOMJO both experience the recurving tracks as the occurrence in CTL (Figure 10a). In NOISO_e, the TC track shifts in a counterclockwise direction that happens earlier than that in CTL, and takes a sharp cyclonic turning to keep northwestward movement. In contrast, the track recurvature in NOMJO is gentler and smoother than that in CTL, and moreover, the centers are located to the east of those in CTL. The TCs in NOISO_e and NOMJO have the intensity change similar to that in CTL (Figure 10b). Therefore, the sensitivity experiments indicate that the westward-propagating ISO waves have substantial influence on the unusual track deflection of Fitow, rather than the eastward-propagating ISO waves.
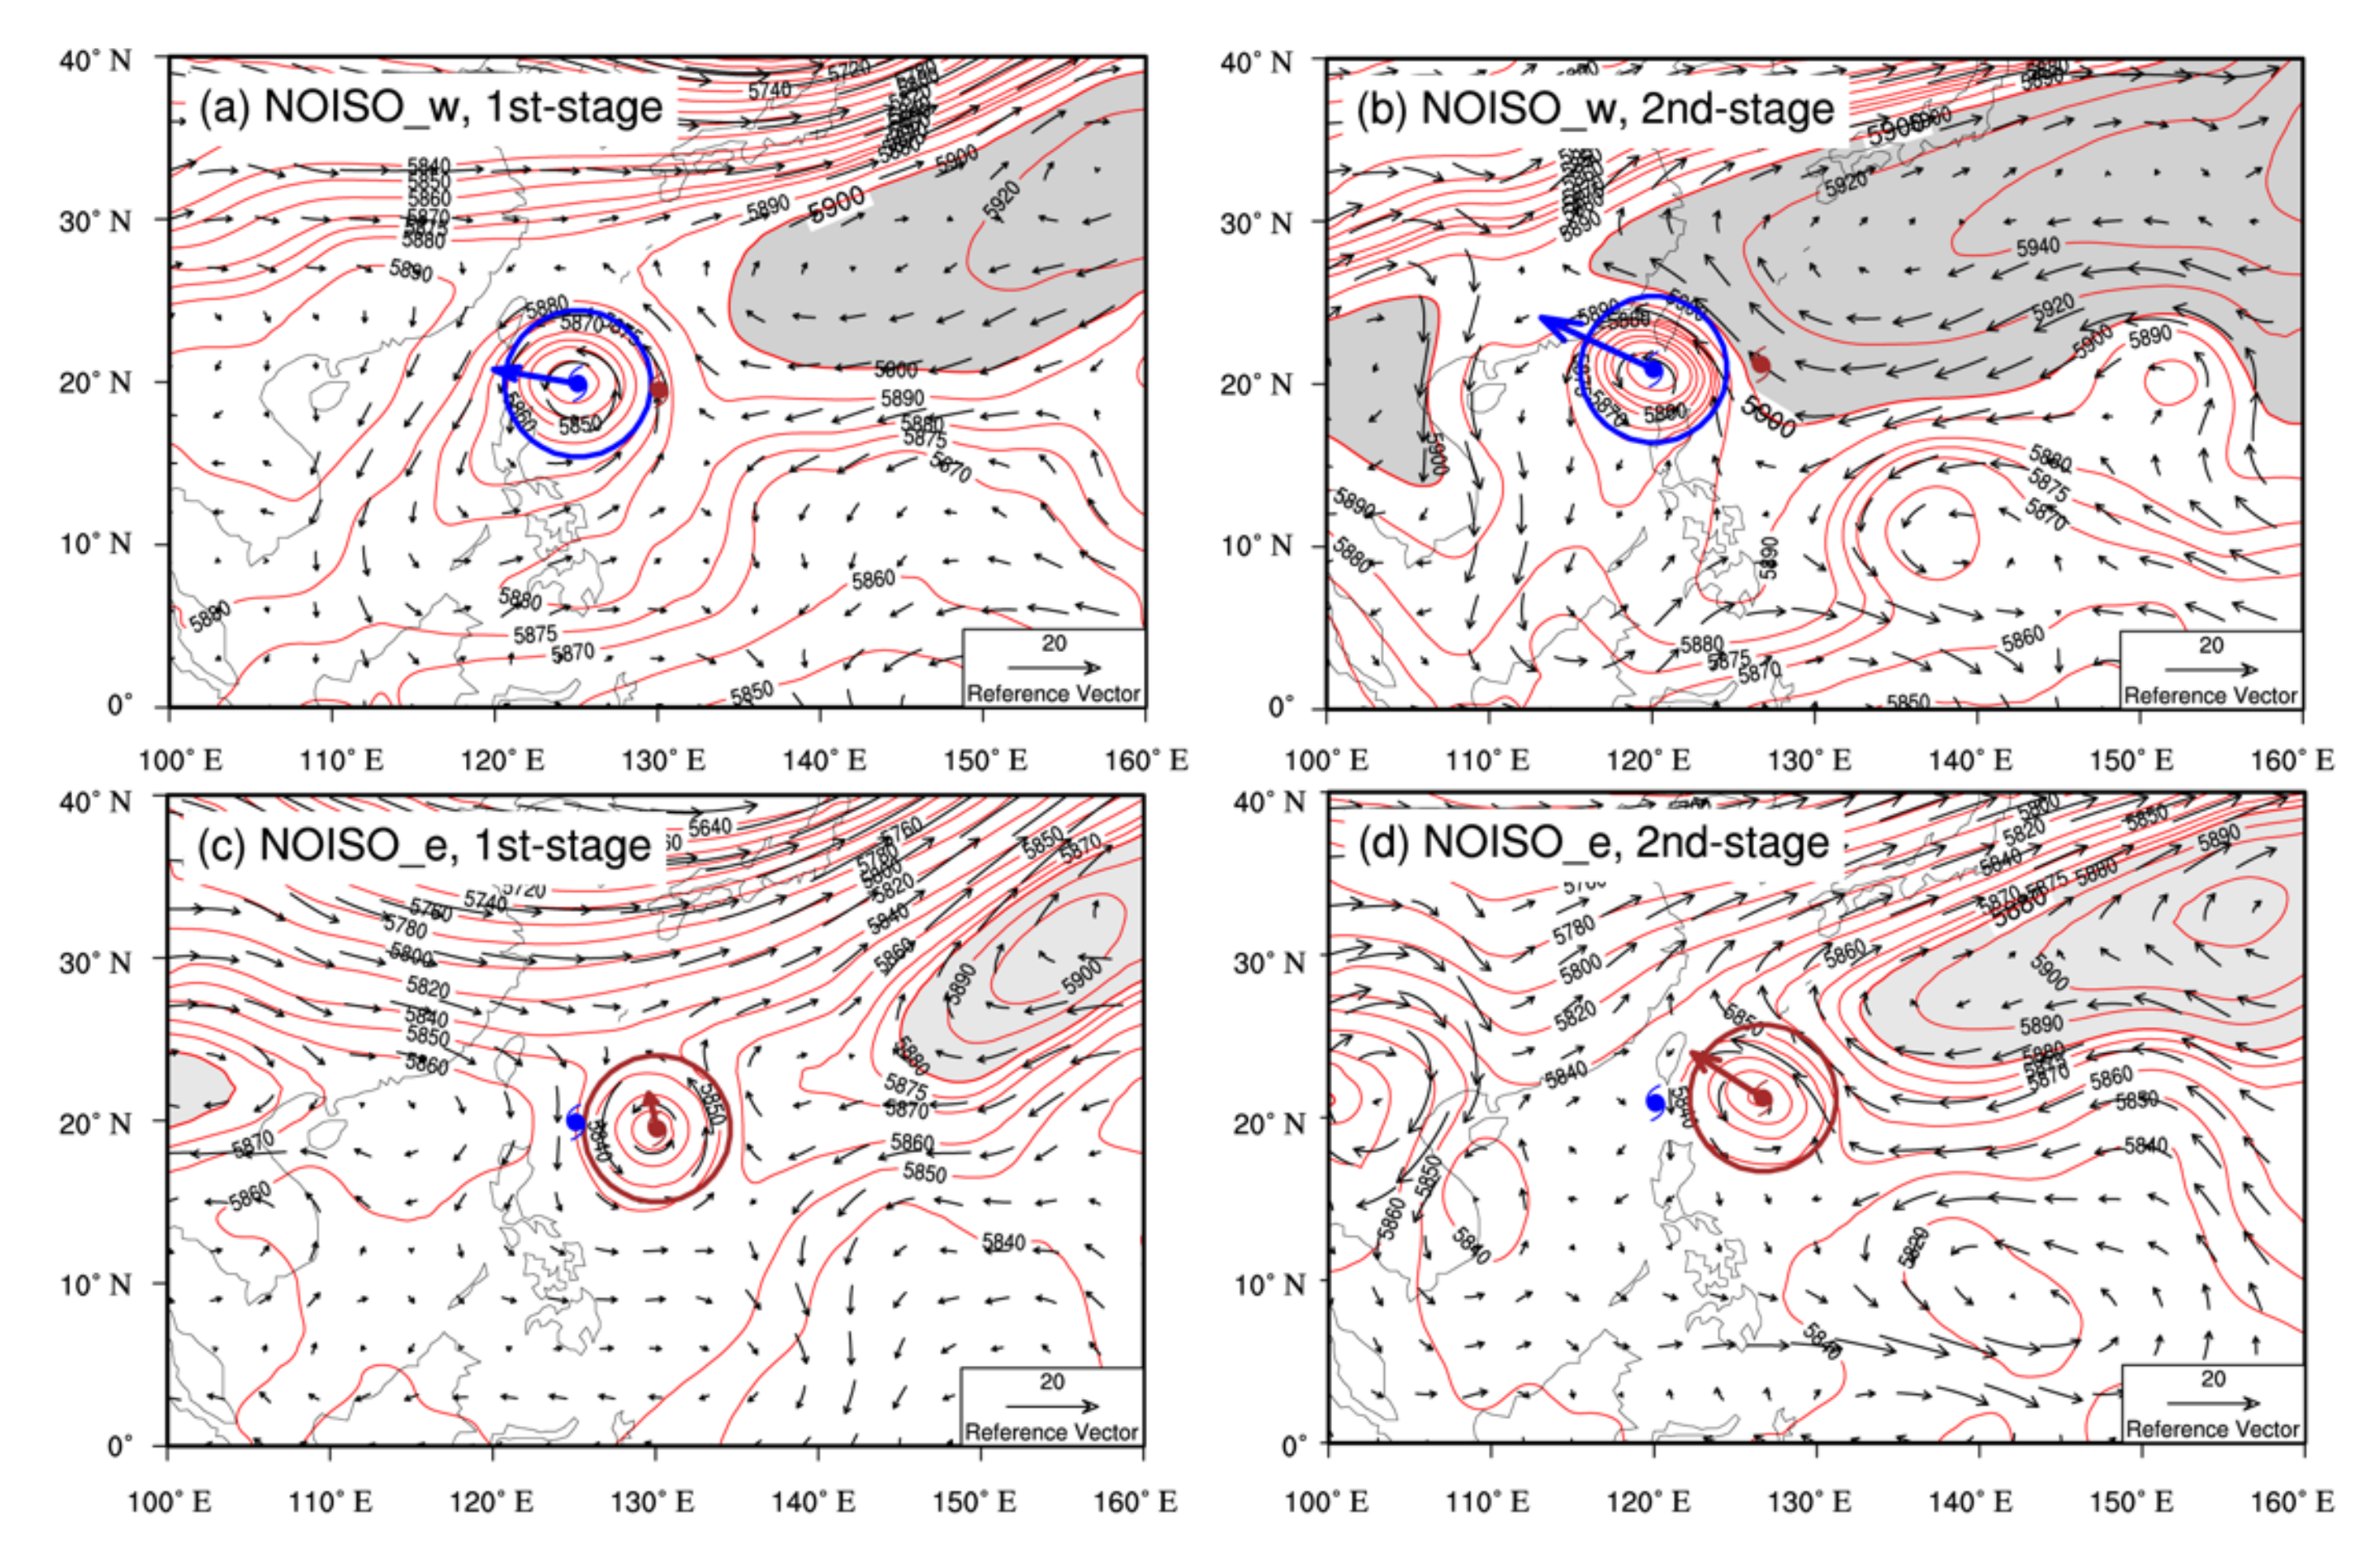
In order to evaluate the relative contribution to TC track deflection from the westward- and eastward-propagating ISO modes during two critical periods around westward-turning occurrence in CTL, the simulated atmospheric circulations in NOISO_w and NOISO_e are demonstrated by Figure 11. As dominant modes in the westward- and eastward-propagating ISO, ER and MJO waves have the impact on the TC track analogous to the corresponding parent ISO. For the sake of brevity, the results of NOER and NOMJO are not shown. In NOISO_w, the TC moves westward within the monsoon gyre circulation with the subtropical high to the northeast during the first stage (Figure 11a). Subsequently, the subtropical high is strengthened and extends westward with the westernmost point of the subtropical ridge (indicated by the 5900 gpm contour) reaching near 115° E, driving the TC northwestward by the enhanced southeasterly steering flows (Figure 11b). In sharp contrast to CTL (Figure 8a,b), the large-scale environmental field in NOISO_w indicates that the monsoon gyre in lower latitude and the northern subtropical high steadily develop, while the mid-latitude trough decays notably. Hence, the TC is steered straight westward by the dominant zonal environment flows. Furthermore, the distinct difference between CTL and NOISO_w can be attributed to the circulation anomaly shown in Figure 9a. The TC center in CTL is located in the southwest of a positive vorticity related to the westward-propagating ISO, which provides significantly anomalous southwesterly flows responsible for the early meridional movement of Fitow. After removing the wave-like circulation anomalies, the motion of the TC in NOISO_w is mainly influenced by the easterly flows.
The NOISO_e also presents distinct flow characteristics. During the first stage of poleward migration (Figure 11c), the TC is located between two broken high-pressure bands and at the bottom of a shallow mid-latitude trough system, with the asymmetric southerly flows on the eastern side. Additionally, slowing of the TC translation speed in early stage may be related to this saddle circulation pattern. In the following stage, the anticyclonic circulation on the northeast flank of the TC extends westward, leading to a northwestward track change (Figure 11d). Compared with CTL (Figure 8a), the large-scale synoptic circulations show similar configuration but become slightly weakened after the removal of eastward-propagating ISO wave. Therefore, in NOISO_e, the shallow mid-latitude trough and westward-extending ridge of subtropical high jointly contribute to the track recurvature similar to that in CTL. As shown in Figure 9b, the dipole circulation anomaly associated with the eastward-propagating ISO in the vicinity of the TC provides the anomalous southeasterly steering flow in the initial field. Subtracting these circulation anomalies from NOISO_e experiment causes the TC to have an eastward movement at first. However, the removal of northern negative vorticity anomaly is beneficial to sustain the development of the mid-latitude trough and subtropical high systems, and thus causing the following process of the TC’s westward track deflection.
4.3. Piecewise PV Inversion Diagnosis
Through the previous series of analyses and discussions, the ISO fluctuation and its wave components with different propagation directions have been indicated to play distinct roles in the abnormal westward turning of Typhoon Fitow during the poleward movement. In this section, we utilize the piecewise PV inversion method to explain the dynamical mechanism associated with atmospheric ISO during the TC track deflection from a quantitative perspective.
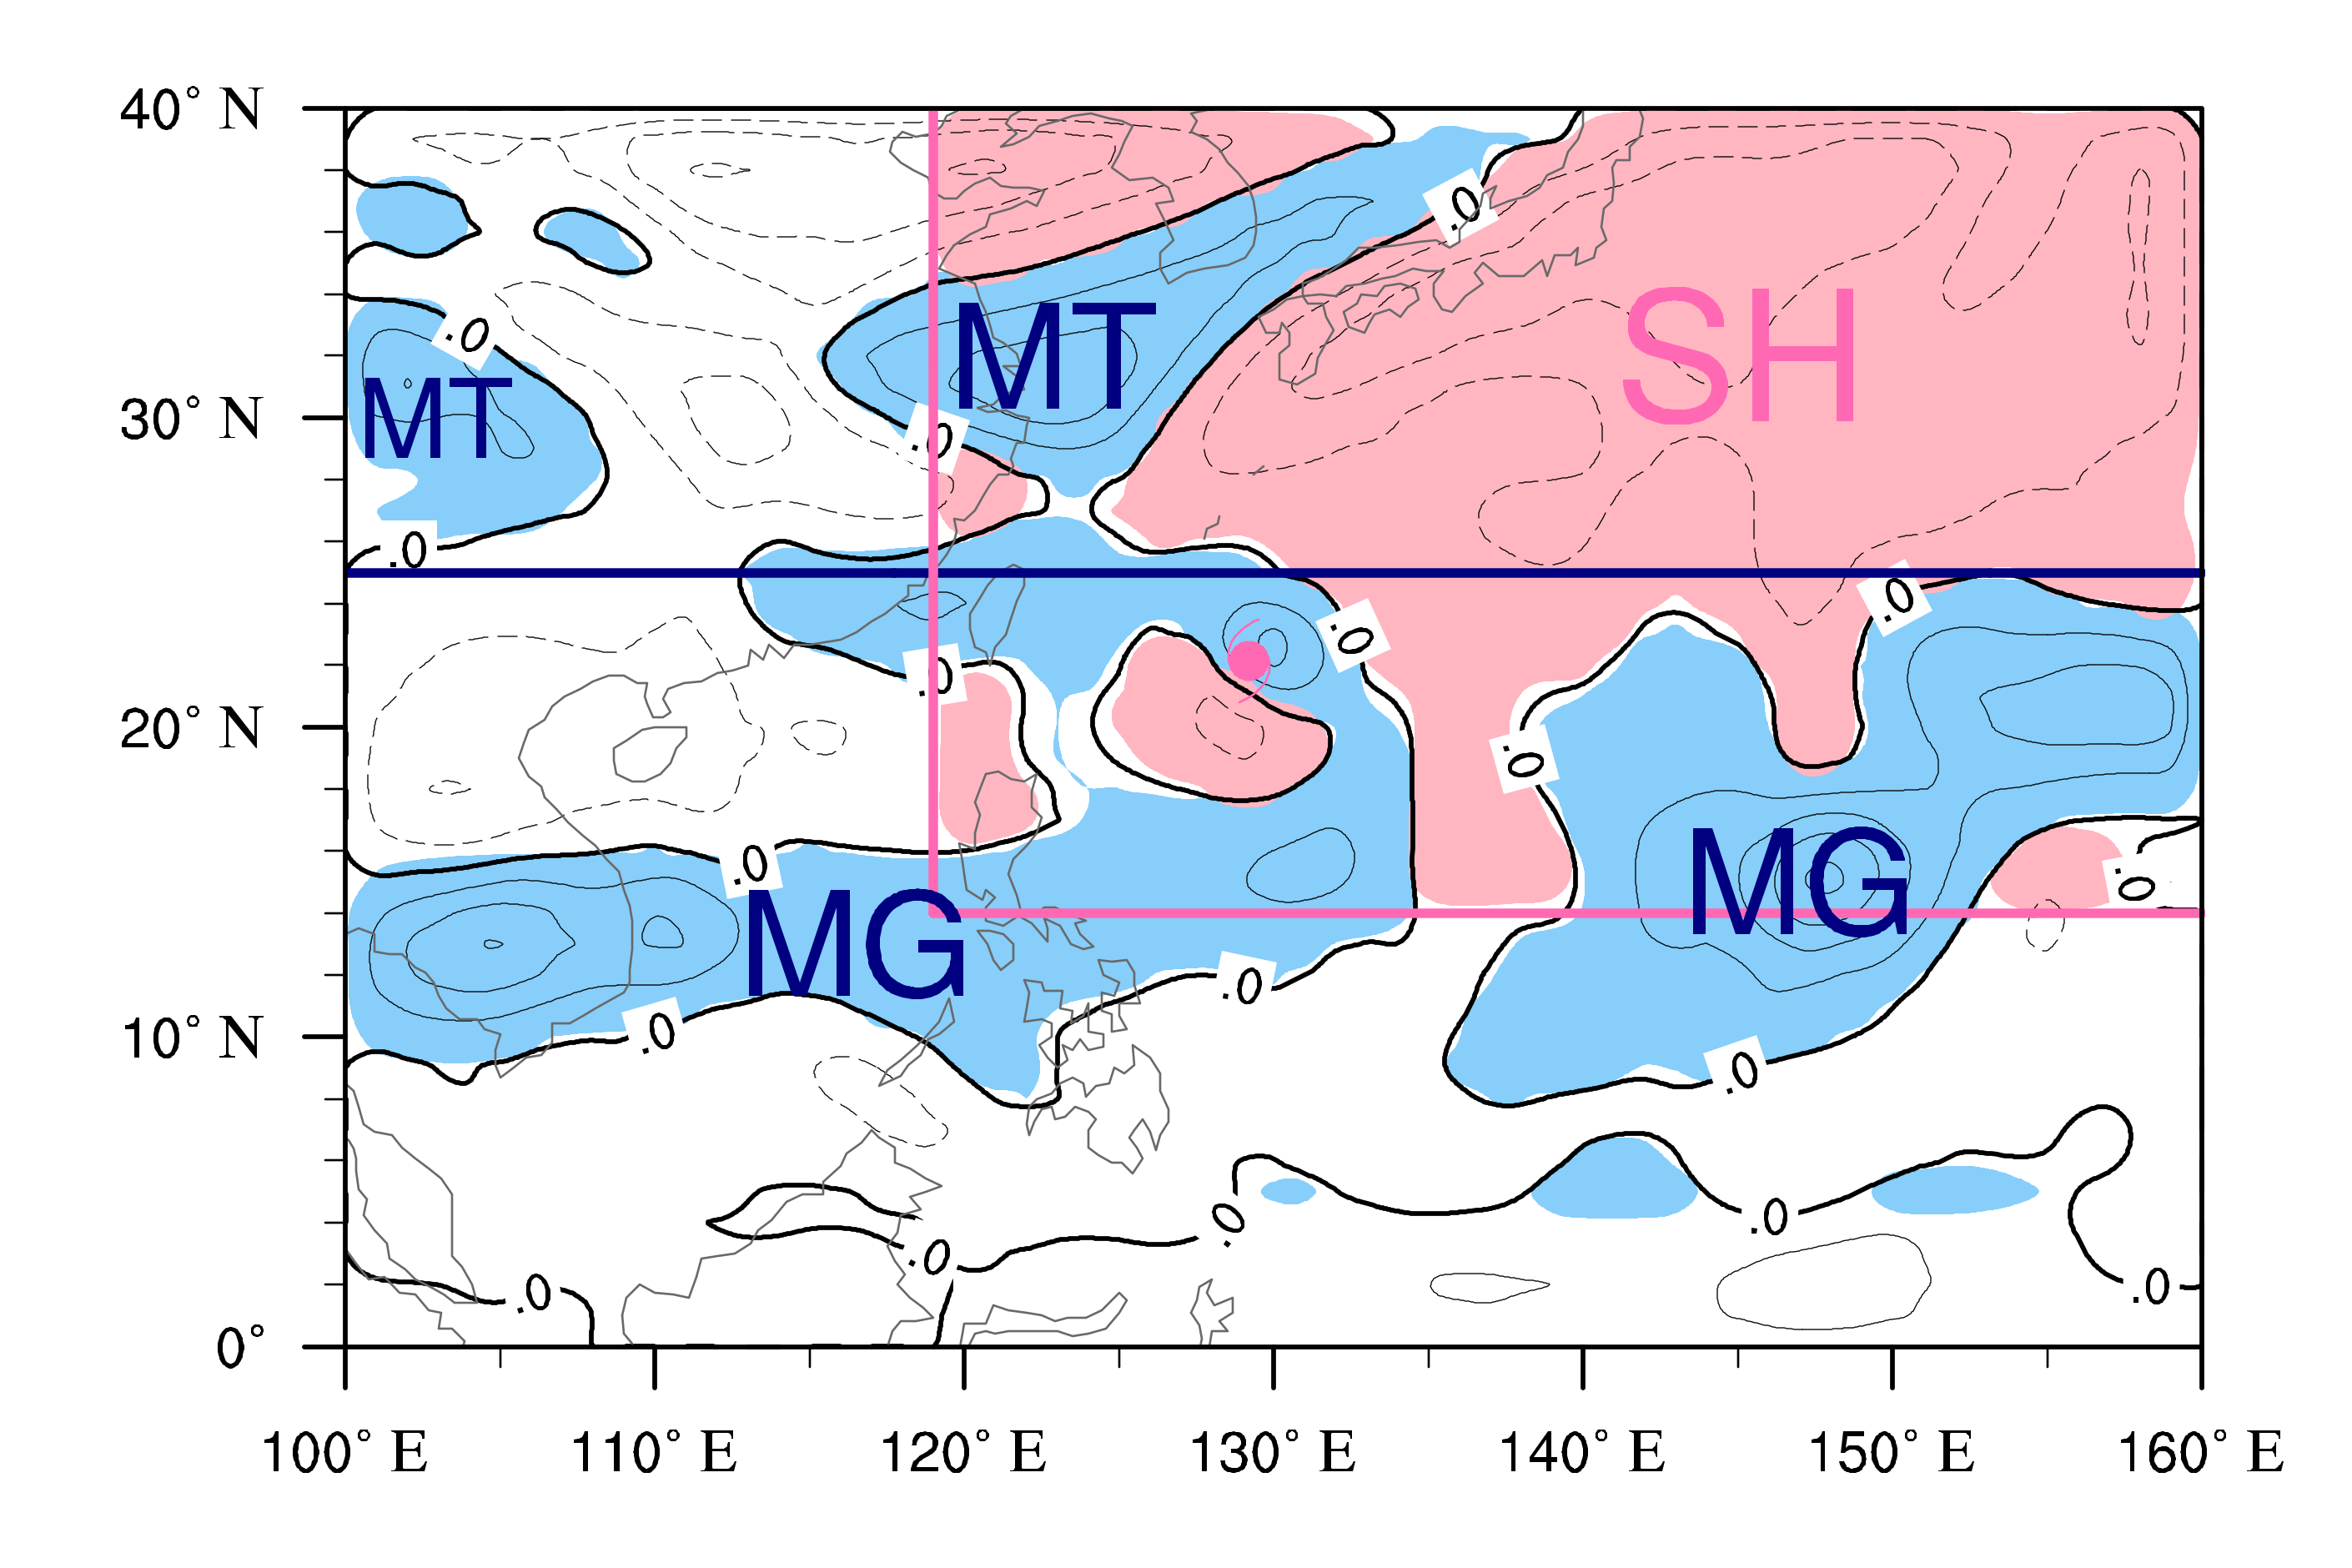
Considering the conservation and invertibility of PV, the piecewise PV inversion diagnostic have been widely applied for interpreting the evolution of multiscale ambient systems, in which the quantitative steering contributions in response to prescribed PV anomalies can be calculated given a mean reference state [46,47,48,49,50]. The total PV field can be decomposed into the azimuthally averaged PV and perturbation PV following Shapiro [51]. Then, the total perturbed PV is partitioned into different positive and negative PV patches corresponding to major synoptic systems, similar to the past studies [18,20,52]. Taking the total PV perturbation in CTL as an example, three major synoptic systems are bounded by the blue and pink thick solid lines shown in Figure 12, that is, two positive PV perturbations for mid-latitude trough and monsoon gyre, and one negative PV perturbation for subtropical high. The perturbed PVs are similarly decomposed at other times. The effects of the residual PV perturbations are negligible in this case.
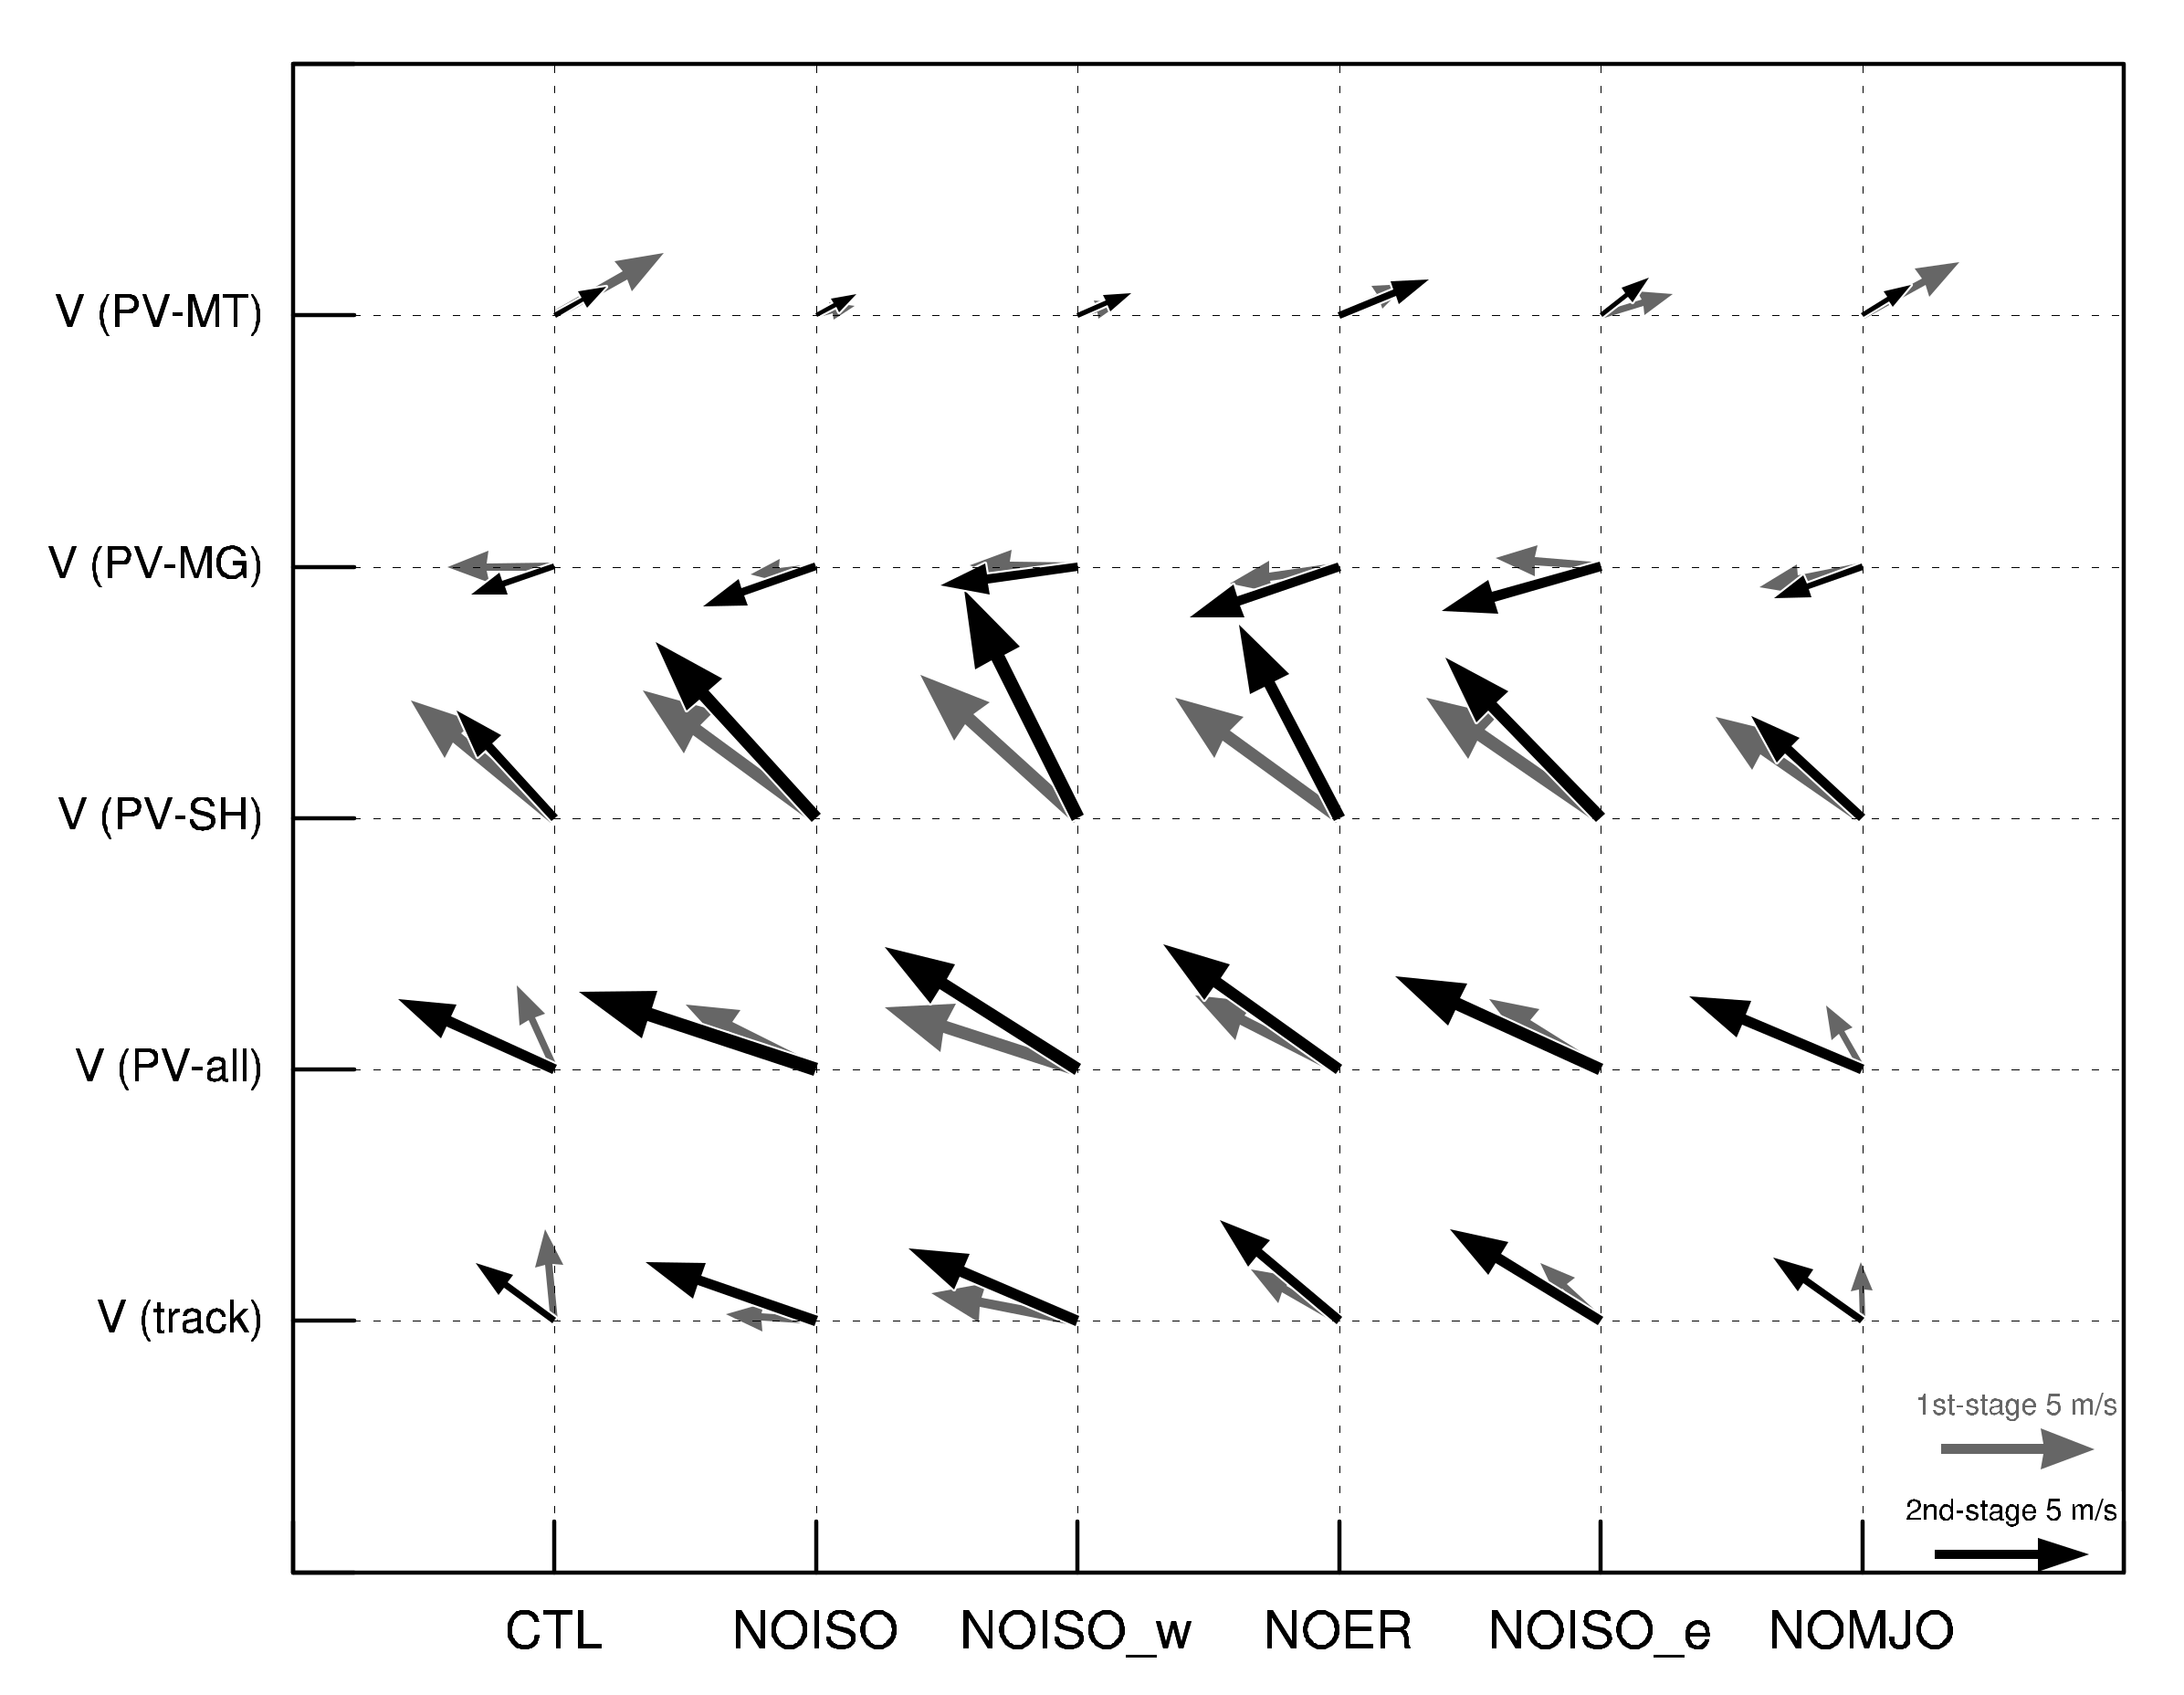
After the PV perturbations associated with three synoptic systems of interest are identified from the simulation outputs, the corresponding balanced steering flows inverted from these PV perturbations during the two stages of Typhoon Fitow’s track turning are plotted in Figure 13. The TC actual motion vectors (Vtrack) and the inverted steering vectors from the total PV perturbation (VPV-all) are demonstrated in the lowest two rows of Figure 13. It can be seen that the TC steering vectors derived from the piecewise PV inversion are in good approximation to the actual motions in CTL and five sensitivity experiments in terms of the direction and magnitude. The track changes of the TC during the two different stages are reproduced well by the total PV perturbations. Therefore, the steering flows inverted from the PV patches can be calculated to evaluate the individual effects of different ISO wave modes on Fitow’s unusual track.
The steering vectors inverted from the PV perturbations of subtropical high, monsoon gyre, and mid-latitude trough are displayed at the upper three rows of Figure 13 (VPV-SH; VPV-MG; VPV-MT). In CTL, the subtropical high and mid-latitude trough contribute to steer the TC northward at the first stage (gray vectors). During the second stage, the northeastward steering wind (Figure 8b) is diminished by half due to the weakened mid-latitude trough, and the influence from the subtropical high stands out with about 5 m s−1 easterly flow, leading to the following westward track deflection (black vectors). In NOISO, the steering flows associated with mid-latitude trough and monsoon gyre are weakened in the early period, and thus the TC is advected northwestward directly by the robust subtropical high, resulting in the absence of abrupt track change.
In NOISO_w and NOER, the steering flows associated with three major systems change apparently in contrast to CTL. On one hand, the northward wind component associated with mid-latitude trough is greatly reduced, while the enhanced westward steering flow from monsoon gyre with the magnitude of about 4–5 m s−1 is conducive to straight northwestward motion of the TC. On the other hand, the PV perturbation of subtropical high also provides a predominantly northwestward steering flow (about 7–8 m s−1) during the two stages, which differs from the track deflection in CTL.
Lastly, the potential impacts associated with the eastward-propagating ISO components on TC motion are diagnosed in NOISO_e and NOMJO. In NOISO_e, the TC track takes a swift counterclockwise turning in the early stage (Figure 10a), so that the poleward steering effect from these synoptic systems is not captured well because of the time average. However, it is doubtless that the differences in steering vector between NOISO_e and CTL are not obvious. The steering flows inverted from the piecewise PV inversion in NOMJO are also in good agreement with the counterparts in CTL, suggesting that the eastward-propagating ISO wave modes play a minor role in the TC track deflection.
5. Summary
Typhoon Fitow (2013) originally moved poleward straight and intensified over the WNP, followed by an unusual westward track deflection at middle latitude toward the eastern coast of China. In this study, the possible dynamical influences from the different ISO modes are examined based on observational analysis, model simulation, and PV diagnosis.
Based on the FNL analysis, the northward movement of Typhoon Fitow in the early stage is attributed to the combined steering effect of a strong mid-latitude trough and eastern subtropical high, and then the enhanced easterly flows associated with the westward-stretching subtropical high to the north of the TC are essential for westward track turning in the later stage. The large-scale steering flows surrounding the TC experience a pronounced transition from meridional to zonal, which is intimately related to the ISO mode with a period of 10–90 days.
The impact of ISO on the abrupt westward turning of Typhoon Fitow is further investigated using the WRF model. In the CTL, the simulation reproduces well the TC environmental characteristics and the track deflection. In the other five sensitivity experiments, the removal of the total ISO wave, the westward-propagating ISO, the eastward-propagating ISO, the westward-propagating ER, and the eastward-propagating MJO were carried out by a space-time filtering method. The TC is found to move westward or northwestward continually without track deflection in NOISO, NOISO_w, and NOER, while the TC sustains the recurving track in the NOISO_e and NOMJO experiments, which suggests that the westward-propagating ISO and ER play a more significant role in track change in contrast to the eastward-propagating ISO and MJO.
The TC in NOISO keeps westward movement under the background flow provided by the northern subtropical high system. Both the mid-latitude trough and monsoon gyre circulation associated with the ISO wave become weakened significantly, hindering the meridional movement of Fitow in the early stage. Similarly, the TC does not experience track turning in the absence of the key west-propagating ISO (i.e., NOISO_w and NOER). Based on the piecewise PV inversion analysis, the mid-latitude trough circulation of NOISO_w is obviously decayed and the associated northward wind components are decreased to 1–2 m s−1 in the early stage. Meanwhile, the low-latitude monsoon gyre and the zonally-elongated subtropical high system are both enhanced and contribute to steer the TC directly northwestward.
Moreover, the eastward-propagating ISO is featured by a loose southwest–northeast-oriented dipole circulation in the vicinity of the TC. In contrast to the westward-propagating ISO, the weaker convection anomalies have less significant impact on the TC track and the large-scale ambient circulation. Hence, TCs in NOISO_e and NOMJO maintain the counterclockwise recurving track as in CTL. A sudden cyclonic track turning in NOISO_e occurs at the first stage due to the sustained shallow mid-latitude trough and westward-extending subtropical high circulation. The TC movement in NOMJO is the most analogous to that in CTL due to the least-modified steering flows.
Overall, the observational analysis, piecewise PV inversion diagnosis, and sensitivity experiments explain the dynamic mechanism for the unusual track deflection of Typhoon Fitow. It indicates that a good representation of impact systems and the multiscale atmospheric variabilities in the tropics and middle latitude over the WNP is crucial for improving operational forecast and numerical simulation of the unusual track change observed for the TC.
Author Contributions
X.B., G.C., and W.Z. contributed to conception and design of the study. X.B. organized the database and performed the relevant analysis. X.B. wrote the first draft of the manuscript. G.C. contributed to manuscript revision. All authors have read and agreed to the published version of the manuscript.
Funding
This research was funded by the National Natural Science Foundation of China (Grants 41975071, 42175073).
Institutional Review Board Statement
Not applicable.
Informed Consent Statement
Not applicable.
Data Availability Statement
Publicly available datasets were analyzed in this study. These data can be found at: https://rda.ucar.edu/datasets/ds083.2/#!access (accessed on 1 May 2021), https://psl.noaa.gov/data/gridded/data.olrcdr.interp.html (accessed on 1 May 2021), http://tropic.ssec.wisc.edu/archive (accessed on 1 May 2021), and https://tcdata.typhoon.org.cn/en/zjljsjj_zlhq.html (accessed on 1 May 2021).
Acknowledgments
The authors thank all crew members who were involved in the program. We thank the reviewers for their comments, which helped to improve our paper. We also thank the editors for their editing assistances.
Conflicts of Interest
The authors declare no conflict of interest.
References
- Zhang, X.; Li, Y.; Zhang, D.L.; Chen, L. A 65-yr Climatology of Unusual Tracks of Tropical Cyclones in the Vicinity of China’s Coastal Waters during 1949–2013. J. Appl. Meteorol. Climatol. 2018, 57, 155–170. [Google Scholar] [CrossRef]
- Bi, M.; Li, T.; Peng, M.; Shen, X. Interactions between Typhoon Megi (2010) and a Low-Frequency Monsoon Gyre. J. Atmos. Sci. 2015, 72, 2682–2702. [Google Scholar] [CrossRef]
- Carr, L.E.; Elsberry, R.L. Monsoonal Interactions Leading to Sudden Tropical Cyclone Track Changes. Mon. Weather. Rev. 1995, 123, 265–289. [Google Scholar] [CrossRef] [Green Version]
- Lin, Y.F.; Wu, C.C.; Yen, T.H.; Huang, Y.H.; Lien, G.Y. Typhoon Fanapi (2010) and Its Interaction with Taiwan Terrain–Evaluation of the Uncertainty in Track, Intensity and Rainfall Simulations. J. Meteorol. Soc. Jpn. 2020, 98, 93–113. [Google Scholar] [CrossRef] [Green Version]
- Liu, Q.; Zhou, W.; Peng, M.; Li, T. Factors Controlling Northward and North-eastward Moving Tropical Cyclones Near the Coast of East Asia. Front. Earth Sci. 2019, 13, 778–790. [Google Scholar] [CrossRef]
- Shi, W.; Fei, J.; Huang, X.; Cheng, X.; Ding, J.; He, Y. A Numerical Study on the Combined Effect of Midlatitude and Low-latitude Systems on the Abrupt Track Deflection of Typhoon Megi (2010). Mon. Weather. Rev. 2014, 142, 2483–2501. [Google Scholar] [CrossRef]
- Wu, C.C.; Chen, S.G.; Chen, J.H.; Chou, K.H.; Lin, P.H. Interaction of Typhoon Shanshan (2006) with the Midlatitude Trough from Both Adjoint-derived Sensitivity Steering Vector and Potential Vorticity Perspectives. Mon. Weather. Rev. 2009, 137, 852–862. [Google Scholar] [CrossRef] [Green Version]
- Wu, L.; Liang, J.; Wu, C.C. Monsoonal Influence on Typhoon Morakot (2009). Part II: Observational Analysis. J. Atmos. Sci. 2011, 68, 2208–2221. [Google Scholar] [CrossRef]
- Ge, X.; Yan, Z.; Peng, M.; Bi, M.; Li, T. Sensitivity of Tropical Cyclone Track to the Vertical Structure of a Nearby Monsoon Gyre. J. Atmos. Sci. 2018, 75, 2017–2028. [Google Scholar] [CrossRef]
- Ito, K.; Wu, C.C.; Chan, K.T.F.; Toumi, R.; Davis, C. Recent Progress in the Fundamental Understanding of Tropical Cyclone Motion. J. Meteorol. Soc. Jpn. 2020, 98, 5–17. [Google Scholar] [CrossRef] [Green Version]
- Yang, M.J.; Zhang, D.L.; Huang, H.L. A Modeling Study of Typhoon Nari (2001) at Landfall. Part I: Topographic Effects. J. Atmos. Sci. 2008, 65, 3095–3115. [Google Scholar] [CrossRef] [Green Version]
- Jian, G.J.; Wu, C.C. A Numerical Study of the Track Deflection of Supertyphoon Haitang (2005) Prior to Its Landfall in Taiwan. Mon. Weather. Rev. 2008, 136, 598–615. [Google Scholar] [CrossRef]
- Wang, C.C.; Chen, Y.H.; Kuo, H.C.; Huang, S.Y. Sensitivity of Typhoon Track to Asymmetric Latent Heating/Rainfall Induced by Taiwan Topography: A Numerical Study of Typhoon Fanapi (2010). J. Geophys. Res. Atmos. 2013, 118, 3292–3308. [Google Scholar] [CrossRef]
- Li, D.Y.; Huang, C.Y. The Influences of Orography and Ocean on Track of Typhoon Megi (2016) Past Taiwan as Identified by HWRF. J. Geophys. Res. Atmos. 2018, 123, 11,492–11,517. [Google Scholar] [CrossRef]
- Wu, C.C.; Li, T.H.; Huang, Y.H. Influence of Mesoscale Topography on Tropical Cyclone Tracks: Further Examination of the Channeling Effect. J. Atmos. Sci. 2015, 72, 3032–3050. [Google Scholar] [CrossRef]
- Huang, K.C.; Wu, C.C. The Impact of Idealized Terrain on Upstream Tropical Cyclone Track. J. Atmos. Sci. 2018, 75, 3887–3910. [Google Scholar] [CrossRef]
- Wu, C.C.; Huang, T.S.; Huang, W.P.; Chou, K.H. A New Look at the Binary Interaction: Potential Vorticity Diagnosis of The Unusual Southward Movement of Tropical Storm Bopha (2000) and Its Interaction with Supertyphoon Saomai (2000). Mon. Weather. Rev. 2003, 131, 1289–1300. [Google Scholar] [CrossRef]
- Yang, C.C.; Wu, C.C.; Chou, K.H.; Lee, C.Y. Binary Interaction between Typhoons Fengshen (2002) and Fungwong (2002) Based on the Potential Vorticity Diagnosis. Mon. Weather. Rev. 2008, 136, 4593–4611. [Google Scholar] [CrossRef] [Green Version]
- Xian, Z.; Chen, K. Numerical Analysis on the Effects of Binary Interaction between Typhoons Tembin and Bolaven in 2012. Adv. Meteorol. 2019, 2019, 7529263. [Google Scholar] [CrossRef] [Green Version]
- Wu, C.C.; Chen, S.G.; Yang, C.C.; Lin, P.H.; Aberson, S.D. Potential Vorticity Diagnosis of the Factors Affecting the Track of Typhoon Sinlaku (2008) and the Impact from Dropwindsonde Data during T-PARC. Mon. Weather. Rev. 2012, 140, 2670–2688. [Google Scholar] [CrossRef]
- Liang, J.; Wu, L. Sudden Track Changes of Tropical Cyclones in Monsoon Gyres: Full-Physics, Idealized Numerical Experiments. J. Atmos. Sci. 2015, 72, 1307–1322. [Google Scholar] [CrossRef]
- Hua, T.; Li, C.Y. Further Study of Typhoon Tracks and the Low-frequency (30–60 days) Wind-field Pattern at 850 hPa. Atmos. Ocean. Sci. Lett. 2010, 3, 319–324. [Google Scholar] [CrossRef]
- Bi, X.; Chen, G.; Shi, D.; Wang, K.; Zhou, W. A Statistical Analysis of the Influences of Multi-Timescale Waves on Tropical Cyclone Sudden Track Changes Over the Western North Pacific. Front. Earth Sci. 2020, 8, 309. [Google Scholar] [CrossRef]
- Ching, L.; Sui, C.-H.; Yang, M.-J.; Lin, P.-L. A Modeling Study on the Effects of MJO and Equatorial Rossby Waves on Tropical Cyclone Genesis over the Western North Pacific in June 2004. Dyn. Atmos. Ocean. 2015, 72, 70–87. [Google Scholar] [CrossRef]
- Bao, X.; Davidson, N.E.; Yu, H.; Hankinson, M.C.; Sun, Z.; Rikus, L.J.; Liu, J.; Yu, Z.; Wu, D. Diagnostics for An Extreme Rain Event Near Shanghai during the Landfall of Typhoon Fitow (2013). Mon. Weather. Rev. 2015, 143, 3377–3405. [Google Scholar] [CrossRef]
- Dong, M.; Ji, C.; Chen, F.; Wang, Y. Numerical Study of Boundary Layer Structure and Rainfall after Landfall of Typhoon Fitow (2013): Sensitivity to Planetary Boundary Layer Parameterization. Adv. Atmos. Sci. 2019, 36, 431–450. [Google Scholar] [CrossRef]
- Lou, L.; Li, X. Radiative Effects on Torrential Rainfall during the Landfall of Typhoon Fitow (2013). Adv. Atmos. Sci. 2016, 33, 101–109. [Google Scholar] [CrossRef]
- Yu, Z.; Chen, Y.; Wu, D.; Chen, G.; Bao, X.; Yang, Q.; Yu, R.; Zhang, L.; Tang, J.; Xu, M. Overview of Severe Typhoon Fitow and Its Operational Forecasts. Trop. Cyclone Res. Rev. 2014, 3, 22–34. [Google Scholar] [CrossRef]
- Kurihara, Y.; Bender, M.A.; Ross, R.J. An Initialization Scheme of Hurricane Models by Vortex Specification. Mon. Weather. Rev. 1993, 121, 2030–2045. [Google Scholar] [CrossRef] [Green Version]
- Kurihara, Y.; Bender, M.A.; Tuleya, R.E.; Ross, R.J. Improvements in the GFDL Hurricane Prediction System. Mon. Weather. Rev. 1995, 123, 2791–2801. [Google Scholar] [CrossRef] [Green Version]
- Skamarock, W.C.; Klemp, J.B.; Dudhia, J.; Gill, D.O.; Barker, D.M.; Wang, W.; Powers, J.G. A Description of the Advanced Research WRF Version 3; NCAR Technical Note No. NCAR/TN-475+STR; National Center for Atmospheric Research, University Corporation for Atmospheric Research: Boulder, CO, USA, 2008. [Google Scholar] [CrossRef]
- Hong, S.Y.; Dudhia, J.; Chen, S.H. A Revised Approach to Ice Microphysical Processes for the Bulk Parameterization of Clouds and Precipitation. Mon. Weather. Rev. 2004, 132, 103–120. [Google Scholar] [CrossRef]
- Mlawer, E.J.; Taubman, S.J.; Brown, P.D.; Iacono, M.J.; Clough, S.A. Radiative Transfer for Inhomogeneous Atmospheres: RRTM, a Validated Correlated-k Model for the Longwave. J. Geophys. Res. Atmos. 1997, 102, 16663–16682. [Google Scholar] [CrossRef] [Green Version]
- Dudhia, J. Numerical Study of Convection Observed during the Winter Monsoon Experiment Using a Mesoscale Two-dimensional Model. J. Atmos. Sci. 1989, 46, 3077–3107. [Google Scholar] [CrossRef]
- Hong, S.Y.; Noh, Y.; Dudhia, J. A New Vertical Diffusion Package with an Explicit Treatment of Entrainment Processes. Mon. Weather. Rev. 2006, 134, 2318–2341. [Google Scholar] [CrossRef] [Green Version]
- Noh, Y.; Cheon, W.; Hong, S.; Raasch, S. Improvement of the K-profile Model for the Planetary Boundary Layer Based on Large Eddy Simulation Data. Bound. Layer Meteorol. 2003, 107, 401–427. [Google Scholar] [CrossRef] [Green Version]
- Kain, J.S.; Fritsch, J.M. A One-dimensional Entraining/Detraining Plume Model and its Application in Convective Parameterization. J. Atmos. Sci. 1990, 47, 2784–2802. [Google Scholar] [CrossRef] [Green Version]
- Wheeler, M.; Kiladis, G.N. Convectively Coupled Equatorial Waves: Analysis of Clouds and Temperature in the Wavenumber–Frequency Domain. J. Atmos. Sci. 1999, 56, 374–399. [Google Scholar] [CrossRef]
- Liang, J.; Wu, L.; Ge, X.; Wu, C.C. Monsoonal Influence on Typhoon Morakot (2009). Part II: Numerical Study. J. Atmos. Sci. 2011, 68, 2222–2235. [Google Scholar] [CrossRef]
- Frank, W.M.; Roundy, P.E. The Role of Tropical Waves in Tropical Cyclogenesis. Mon. Weather. Rev. 2006, 134, 2397–2417. [Google Scholar] [CrossRef]
- Hsu, H.H.; Weng, C.H. Northwestward Propagation of the Intraseasonal Oscillation in the Western North Pacific during the Boreal Summer: Structure and Mechanism. J. Clim. 2001, 14, 3834–3850. [Google Scholar] [CrossRef]
- Ko, K.C.; Hsu, H.H. Sub-monthly Circulation Features associated with Tropical Cyclone Tracks over the East Asian Monsoon Area during July-August Season. J. Meteorol. Soc. Jpn. 2006, 84, 871–889. [Google Scholar] [CrossRef] [Green Version]
- Straub, K.H.; Kiladis, G.N. Interactions between the Boreal Summer Intraseasonal Oscillation and Higher-frequency Tropical Wave Activity. Mon. Weather. Rev. 2003, 131, 945–960. [Google Scholar] [CrossRef]
- Ding, L.; Li, T.; Xiang, B.; Peng, M. On the Westward Turning of Hurricane Sandy (2012): Effect of Atmospheric Intraseasonal Oscillations. J. Clim. 2019, 32, 6859–6873. [Google Scholar] [CrossRef]
- Ko, K.C.; Hsu, H.H. ISO Modulation on the Submonthly Wave Pattern and Recurving Tropical Cyclones in the Tropical Western North Pacific. J. Clim. 2009, 22, 582–599. [Google Scholar] [CrossRef]
- Davis, C.A. Piecewise Potential Vorticity Inversion. J. Atmos. Sci. 1992, 49, 1397–1411. [Google Scholar] [CrossRef] [Green Version]
- Davis, C.A. A Potential Vorticity Diagnosis of the Importance of Initial Structure and Condensational Heating in Observed Extratropical Cyclogenesis. Mon. Weather. Rev. 1992, 120, 2409–2428. [Google Scholar] [CrossRef] [Green Version]
- Davis, C.A.; Emanuel, K.A. Potential Vorticity Diagnostics of Cyclogenesis. Mon. Weather. Rev. 1991, 119, 1929–1953. [Google Scholar] [CrossRef] [Green Version]
- Wu, C.C.; Emanuel, K.A. Potential Vorticity Diagnostics of Hurricane Movement. Part I: A Case Study of Hurricane BOB (1991). Mon. Weather. Rev. 1995, 123, 69–92. [Google Scholar] [CrossRef]
- Wu, C.C.; Emanuel, K.A. Potential Vorticity Diagnostics of Hurricane Movement. Part II: Tropical Storm ANA (1991) and Hurricane ANDREW (1992). Mon. Weather. Rev. 1995, 123, 93–109. [Google Scholar] [CrossRef] [Green Version]
- Shapiro, L.J. The Motion of Hurricane Gloria: A Potential Vorticity Diagnosis. Mon. Weather. Rev. 1996, 124, 2497–2508. [Google Scholar] [CrossRef] [Green Version]
- Wu, C.C.; Huang, T.S.; Chou, K.H. Potential Vorticity Diagnosis of the Key Factors Affecting the Motion of Typhoon Sinlaku (2002). Mon. Weather. Rev. 2004, 132, 2084–2093. [Google Scholar] [CrossRef] [Green Version]
Figure 1.
(a) The best track of Typhoon Fitow (2013) obtained from China Meteorological Administration (CMA) with colors representing different intensities. (b) The 96 h forecast tracks at 0000 UTC 2 October 2013 from various operational agencies with different color lines; the best track is given by the black line.

Figure 2.
Unfiltered deep-layer mean (850–300 hPa) winds (vector; m s−1) and 500 hPa geopotential height (contour; gpm) for Typhoon Fitow (2013) daily averaged on (a) 2 October, (b) 3 October, (c) 4 October, and (d) 5 October. The areas with a 500 hPa geopotential height larger than 5880 gpm are shaded. Wind vectors (shown in red) represent wind speeds larger than 8 m s−1. The thick brown and orange arrows give the directions of the steering flow averaged within the 5° radius of tropical cyclone (TC) center (indicated by the brown circle) and TC actual motion vector calculated by best track positions, together with their relative magnitudes.

Figure 3.
Infrared satellite images, enhanced by the National Hurricane Center, at times (a) 1200 UTC 2 October, (b) 1200 UTC 3 October, (c) 1200 UTC 4 October, and (d) 1200 UTC 5 October. These images are derived from the University of Wisconsin–Madison Cooperative Institute for Meteorological Satellite Studies and obtained from http://tropic.ssec.wisc.edu/archive/, accessed on 1 May 2021.

Figure 4.
The wavelet power (105 W2m−4) spectrum of outgoing longwave radiation (OLR) with the dotted area exceeding 95% significance level. The straight line shows the turning time of 4 October 2013.
Figure 4.
The wavelet power (105 W2m−4) spectrum of outgoing longwave radiation (OLR) with the dotted area exceeding 95% significance level. The straight line shows the turning time of 4 October 2013.

Figure 5.
The 10–90-day filtered deep-layer mean (850–300 hPa) wind anomaly (streamline; m s−1) and the corresponding OLR anomaly (only negative values are shaded; W m−2) for Typhoon Fitow (2013) daily averaged on (a) 2 October, (b) 3 October, (c) 4 October, and (d) 5 October. The vectors shown in brown and orange indicate the intra-seasonal oscillation (ISO) steering flow (averaged within the brown circle) and TC actual motion vector, respectively.

Figure 6.
Model domain configuration. Domains 01, 02, and 03 have 27, 9, 3 km resolutions, respectively. The best track of Typhoon Fitow from CMA during the whole simulation period is plotted with the black line.
Figure 6.
Model domain configuration. Domains 01, 02, and 03 have 27, 9, 3 km resolutions, respectively. The best track of Typhoon Fitow from CMA during the whole simulation period is plotted with the black line.

Figure 7.
(a) The CMA best track of Typhoon Fitow (black) and the stimulated TC tracks from CTL (red) and NOISO (blue) experiments. (b) The observed and stimulated TC intensities in terms of minimum sea level pressure (SLP; colored solid line) and maximum center wind (colored dash line). The two stages are denoted by the gray shaded areas.

Figure 8.
The WRF model output deep-layer mean winds (vector; m s−1) and 500 hPa geopotential height (red contour; gpm) in CTL (top row) and NOISO (middle row) averaged over the first stage (a,c) and the second stage (b,d), respectively. The areas larger than 5880 gpm are shaded. The mean position of the TC center is plotted as the black (brown) typhoon symbol for the CTL (NOISO) experiment. The black and brown vector indicate the CTL and NOISO steering flow averaged within the 5° radius of TC center (indicated by the black and brown circle), respectively. Maps (e,f) give the corresponding geopotential height difference fields (contour; gpm; zero contour omitted; negative values are dashed) and deep-layer mean wind difference (vector; m s−1; blue vectors represent wind speeds larger than 10 m s−1) between the two simulations by NOISO minus CTL.

Figure 9.
Filtered deep-layer mean atmospheric circulation (vector; m s−1) and 600 hPa relative vorticity anomaly at the initial time (shading; 10−6 s−1) for (a) the westward-propagating component in the ISO wave mode, (b) the eastward-propagating ISO component, (c) the westward-propagating ER mode, and (d) the eastward-propagating MJO mode.

Figure 10.
(a) Stimulated TC tracks in CTL (black), NOISO_w (red), NOER (orange), NOISO_e (blue), and NOMJO (purple) with the 0000 UTC of each day labeled. (b) The evolution of minimum SLP. The two major stages of TC activity are shaded in gray.
Figure 10.
(a) Stimulated TC tracks in CTL (black), NOISO_w (red), NOER (orange), NOISO_e (blue), and NOMJO (purple) with the 0000 UTC of each day labeled. (b) The evolution of minimum SLP. The two major stages of TC activity are shaded in gray.

Figure 11.
The simulated deep-layer mean winds (streamline; m s−1) and 500 hPa geopotential height (red contour; gpm) in NOISO_w (top row) and NOISO_e (bottom row) averaged over the first stage (a,c) and the second stage (b,d), respectively. The areas larger than 5900 gpm are shaded. The mean position of TC center is plotted by the blue (brown) typhoon symbol in the NOISO_w (NOISO_e). The blue and brown vector indicate the NOISO_w and NOISO_e steering flow averaged within the 5° radius of TC center (indicated by the blue and brown circle), respectively.The blue and brown vectors indicate the NOISO_w and NOISO_e steering flows averaged in the circle, respectively.

Figure 12.
The total 500 hPa PV perturbations in CTL at 0000 UTC 4 October 2013 (black contour and shading; units: 10−2 PVU; 1 PVU = 10−6 m2 s−1 K kg−1). Negative PV perturbation values are dashed and zero bold lines are labelled. The areas with PV perturbation absolute values greater than 0.01 PVU are shaded, blue (pink) area represents the positive (negative) PV perturbation. The typhoon symbol indicates the TC center; MG represents the monsoon gyre; SH represents the Northwest Pacific subtropical high; MT represents the mid-latitude trough. The blue and pink thick solid lines give the boundaries of these synoptic systems.

Figure 13.
TC motion vectors (Vtrack), the steering vectors inverted from the total PV perturbation (VPV-all), and the individual PV perturbations associated with subtropical high, monsoon gyre and mid-latitude trough (VPV-SH; VPV-MG; VPV-MT), which are calculated from CTL and five sensitivity experiments averaged over Fitow’s first northward-moving stage (gray vectors) and second westward-moving stage (black vectors), respectively.


Table 1.
Model experiment descriptions.
| Experiment | Description of Initial Fields and Lateral Boundary Conditions |
|---|---|
| CTL | Interpolated from the FNL analysis data |
| NOISO | Same as control (CTL) experiment, except removing the ISO wave components with zonal wavenumbers of −50~50 and periods of 10–90 days; Negative (positive) wavenumber represents the westward (eastward) propagating component |
| NOISO_w | Same as CTL, except removing the westward-propagating ISO wave components with zonal wavenumbers of −50~0 and periods of 10–90 days |
| NOISO_e | Same as CTL, except removing the eastward-propagating ISO wave components with zonal wavenumbers of 0~50 and periods of 10–90 days |
| NOER | Same as CTL, except removing the westward-propagating equatorial Rossby (ER) wave components with zonal wavenumbers of −10~−1 and periods of 10–48 days |
| NOMJO | Same as CTL, except removing the eastward-propagating Madden–Julian oscillations (MJO) wave components with zonal wavenumbers of 1~4 and periods of 20–80 days |
Publisher’s Note: MDPI stays neutral with regard to jurisdictional claims in published maps and institutional affiliations. |
© 2022 by the authors. Licensee MDPI, Basel, Switzerland. This article is an open access article distributed under the terms and conditions of the Creative Commons Attribution (CC BY) license (https://creativecommons.org/licenses/by/4.0/).
Share and Cite
MDPI and ACS Style
Bi, X.; Chen, G.; Zhou, W. The Impact of Intra-Seasonal Oscillation on Westward Track Deflection of Super Typhoon Fitow (2013). Atmosphere 2022, 13, 474. https://0-doi-org.brum.beds.ac.uk/10.3390/atmos13030474
AMA Style
Bi X, Chen G, Zhou W. The Impact of Intra-Seasonal Oscillation on Westward Track Deflection of Super Typhoon Fitow (2013). Atmosphere. 2022; 13(3):474. https://0-doi-org.brum.beds.ac.uk/10.3390/atmos13030474
Chicago/Turabian StyleBi, Xinxin, Guanghua Chen, and Weican Zhou. 2022. "The Impact of Intra-Seasonal Oscillation on Westward Track Deflection of Super Typhoon Fitow (2013)" Atmosphere 13, no. 3: 474. https://0-doi-org.brum.beds.ac.uk/10.3390/atmos13030474
Note that from the first issue of 2016, this journal uses article numbers instead of page numbers. See further details here.