
Dual-Polarization Radar Observations of the Evolution of a Supercell Tornado and Analysis of the Echo Mechanisms


1
Collaborative Innovation Center on Forecast and Evaluation of Meteorological Disasters, Nanjing University of Information Science & Technology, Nanjing 210044, China
2
Huzhou Meteorological Bureau, Huzhou 313000, China
*
Author to whom correspondence should be addressed.
Atmosphere 2022, 13(5), 797; https://0-doi-org.brum.beds.ac.uk/10.3390/atmos13050797
Submission received: 17 March 2022
/
Revised: 27 April 2022
/
Accepted: 11 May 2022
/
Published: 13 May 2022
(This article belongs to the Section Atmospheric Techniques, Instruments, and Modeling)
Abstract
:To gain a deeper understanding of the structural and evolutionary characteristics of supercell tornadoes that occurred in eastern China on 14 May 2021, observations from the S-band dual-polarization radars, soundings and other instruments are used to investigate the evolutionary process of the tornado formation by the mergering and strengthening of supercell storms. The results are described as follows. The updraft by upper divergence and vertical thermal instability induced by the cold source at the tropopause provided the environmental conditions suitable for tornado formation. The tornado event involved three storm merger processes, each of which was associated with an increase in the echo intensity, vertical rising speed, and vertical vorticity of the supercell. Furthermore, during the last merger, the merging of the two vortices resulted in the reduction of the rotation radius of the new vortex, which also provided a favorable condition for tornadogenesis. A schematic was proposed to describe storm mergers. The characteristics of the velocity spectrum width were indicative of the occurrence and evolution of the tornado in this case. During the tornado stage, distinct polarimetric variable signatures (e.g., a tornado debris signature and a differential reflectivity arc) and radial velocity signatures (i.e., a tornadic vortex signature) were observed.
1. Introduction
Tornadoes are small-scale disastrous weather phenomena induced by convective clouds and can cause surface gusts with speeds up to 125–140 m s−1 [1]. China, a country with frequent tornadoes, experiences strong tornadoes primarily in regions with flat terrain, such as the Yangtze-Huaihe River basin, the Hunan-Hubei Plain, South China, Northeast China, and southern North China. Generally, there are two types of tornadoes—mesocyclone (or supercell) and non-mesocyclone (or non-supercell) tornadoes [2,3]. Currently, numerical weather prediction models can produce potential forecasts for severe convective weather events (with possible tornadogenesis) [4]. However, once a severe weather event (tornado) is triggered and formed, the focus shifts to its accurate monitoring, as well as the prediction of its evolutionary trend and possible impacts. Radar observation is currently one of the most effective methods to achieve these goals. Internationally, research dedicated to the radar observation and analysis of tornadoes has been underway for several decades [5,6,7,8,9,10,11,12] and has generated in-depth knowledge of tornado structures. Some of the relevant studies have analyzed tornadoes to determine their meso- and microscale dynamic structures and formation, as well as their maintenance mechanisms based on wind fields, retrieved from dual-Doppler radar data in conjunction with divergence and vorticity fields calculated based on these data [13,14]. The findings of these investigations provide a theoretical basis for the determination of the morphological and dynamic characteristics of tornadic storms.
Tornado outbreaks are frequently accompanied by interactions between storms, such as cell mergers [11]. A few studies have shown that continuous mergers play a crucial role in the process in which storm cells strengthen to form a supercell storm and that cell mergers and interactions may prompt tornadogenesis [15,16,17,18]. Some investigations also show that storm mergers may disrupt an ongoing tornado [13], or appear to slow or cease the tornado’s production [19]. Furthermore, a number of observational studies have investigated the relationship between storm mergers and the formation, development, and dissipation of a tornado [11,13,18,19,20]. Based on radar observations from non-tornadic storms in Illinois, Westcott and Kennedy (1989) described two storm merger types [21]. The first type was characterized by the development of a “bridging” updraft generated by two merging updrafts [13,22,23,24], and the second type was characterized by the differential motion between two storms, resulting in one storm overtaking another [25].
The advancement of dual-polarization technology has allowed polarimetric radars to obtain additional new polarimetric variables (e.g., differential reflectivity ZDR, specific differential phase shift KDP, and copolar correlation coefficient ρhv) that cannot be observed by conventional Doppler radar systems [26]. Moreover, dual-polarization systems can also be used to characterize storm updrafts and inflows [27] and have opened up the possibility of identifying the drivers of the evolution of storms and their microphysical structural features [4]. The dual-polarization signatures of supercells have long been the focus of many investigative efforts [4,27,28,29,30]. The intensification of supercell storms may lead to tornadogenesis, and tornadic debris signatures (TDSs) can be used to confirm and alert the forecasters about the presence of ongoing tornadoes [31,32], particularly on rainy days or at night, when tornadoes are difficult to observe [27]. Moreover, the ZDR arc provides information about the vertical wind shear via size-sorting associated with differential advection of hydrometeors of varying sizes [4,28,33]. The increases in ZDR and curvature of a ZDR arc in some cases may be related to tornadogenesis potential [34,35]. ZDR columns are indicative of strong updrafts [27,36,37] and change as tornadoes evolve [4,38]. The ZDR column area and the variation in the ZDR column height above the 0 °C level can be used to estimate the variation in updraft intensity [39]. In addition, there are some other dual-polarization signatures. For example, the KDP foot indicates the presence of strong precipitation downstream of the updraft region of a supercell, which may be the core region of the front-flank downdraft (FFD). To address the low success rate in issuing warnings on non-supercell tornadoes, Scott and Kumjian [40] examined a large number of non-supercell tornadic storms, based on their dual-polarization data. They found that size sorting leads to a separation between the lower-level high-KDP and high-ZDR regions. Moreover, they employed a new method to define the “separation vector”. Their preliminary results showed that the two high-value regions are separated primarily by approximately 3–4 km before and after tornadogenesis.
In this study, the formation and evolution of a supercell tornado, which was rated as EF3 by the Enhanced Fujita scale and occurred from Suzhou, Jiangsu, to Jiaxing, Zhejiang on 14 May 2021, are analyzed. Specifically, the characteristics of the dual-polarization echoes of the supercell tornado are analyzed, with a focus on the structural characteristics of the supercell at different stages, the mergers and interactions of the convective storms, and the formation and dissipation of the supercell tornado.
2. Data, Methodology and Study Area
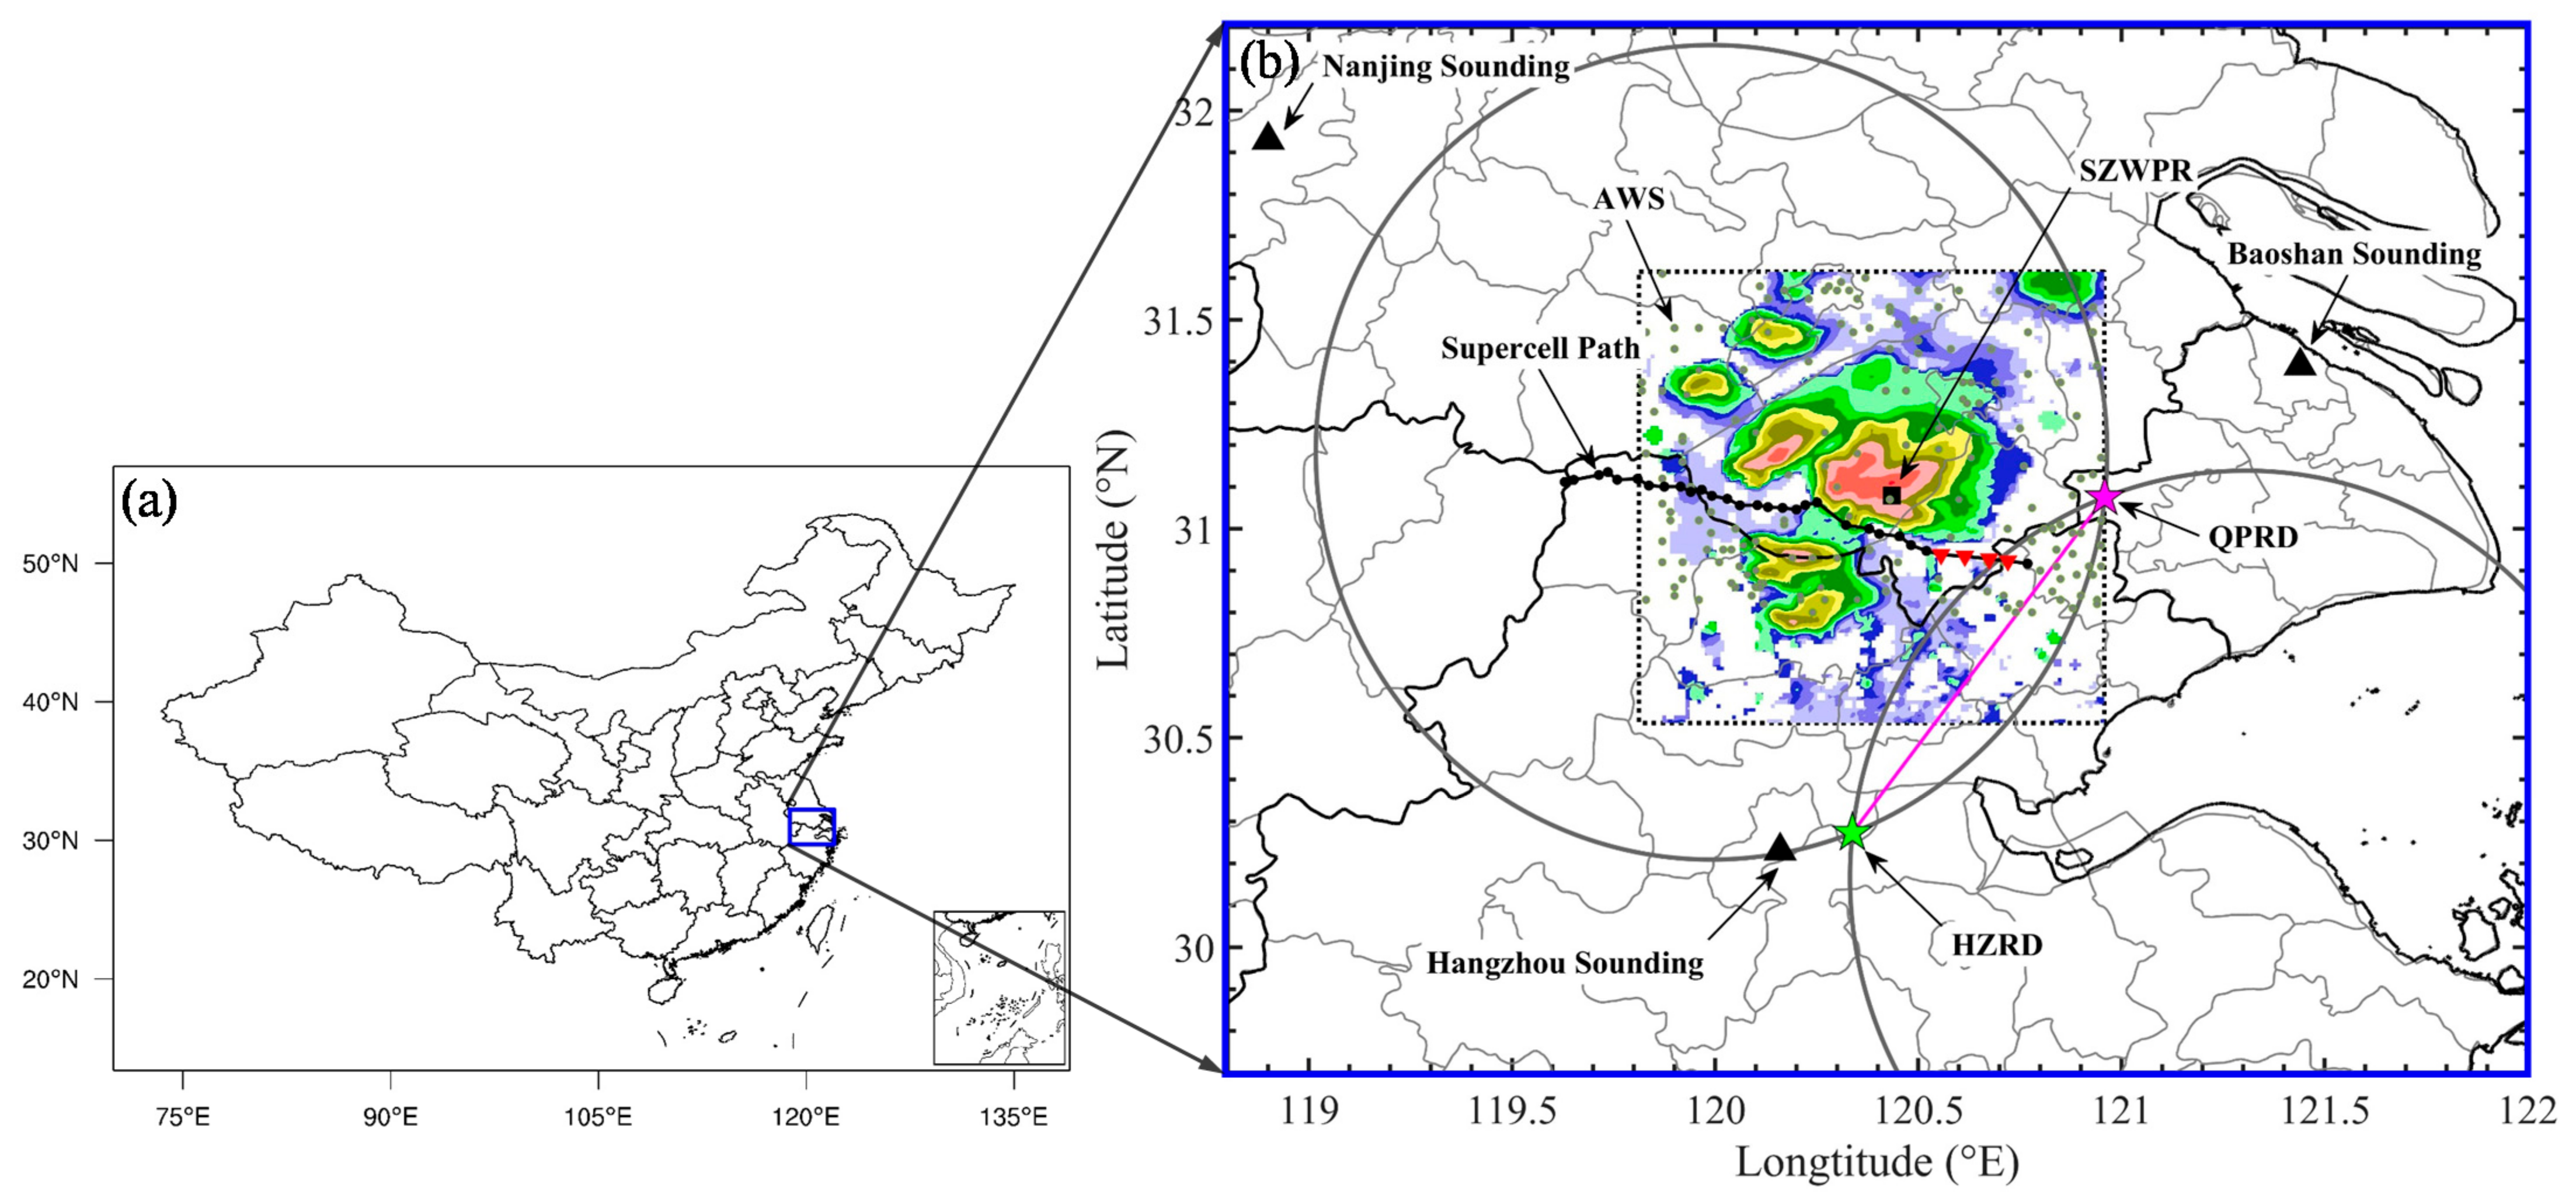
The main observational instruments involved in this study included the S-band dual-polarization weather radar instruments in Hangzhou and Qingpu (HZRD and QPRD, respectively), automatic surface weather stations (AWSs), and the wind profile radar instrument in Suzhou (SZWPR). Figure 1 shows the placement of the instruments, the locations of the sounding stations, and the study area.
The European Center for Medium-Range Weather Forecasts reanalysis version 5 (ERA5) data (time resolution: 1 h; spatial resolution: 0.25° × 0.25°) [41], Himawari-8 geostationary satellite data (brightness temperature and reflectivity products with spatial resolutions of 2 km × 2 km and 1 km × 1 km, respectively), sounding data (collected at the Hangzhou, Baoshan and Nanjing stations), and pressure measurements taken at intervals of 5 min at the AWSs within the study area were used in the analysis. The HZRD (located at 30.27° N and 120.34° E, as indicated by the green star in Figure 1) and QPRD (located at 31.07° N and 120.96° E, as indicated by the magenta star in Figure 1) operate in simultaneous transmission and reception mode, with each parameter calibrated strictly. Variables, including the reflectivity factor at horizontal polarization ZH, radial velocity Vr, velocity spectrum width SW, ZDR, ρhv, and KDP, can be derived from the HZRD and QPRD data. The QPRD operates in volume coverage pattern (VCP) 21 scanning mode and completes a scan (radial resolution: 250 m; azimuth resolution: 0.93°) at nine elevations in six minutes. The HZRD operates in intelligent observation mode. The replacement of the conventional average weight technique with radial restructuring, combined with data windowing, has enabled an increase in the azimuth resolution of data yielded by the HZRD from 1.0° to 0.5°, thereby making it suitable for detailed observations of heavy precipitation events. This radar system operates in VCP 26 mode and completes a scan (radial resolution: 62.5 m; azimuth resolution: 0.5°) at 14 elevations in 4 min.
Prior to the retrieval of the three-dimensional wind field from the dual-radar data, an automated dealiasing algorithm [42] is first employed on Vr, followed by 0.5 km horizontal and vertical interpolation of each measured variable to a Cartesian grid. The wind field within an area with a size of 120 km × 120 km × 20 km (as indicated by the dotted box in Figure 1) is retrieved from the radar data using the variational dual-Doppler wind analysis procedure [43,44]. In this paper, the mass continuity equation is vertically integrated taking advantage of both upward and downward integrations, using ground-level and upper-level boundary conditions [45]. At the upper-level boundary condition (the top of the atmosphere), the vertical velocity w = 0 is enforced, which is commonly called the impermeability condition [45,46]. The terminal velocity fall speeds (wt) of the hydrometeors used in the computation are obtained from the wt-Zobs relation [46,47]. Given that the advection of radial velocity is often highly spatially variable or non-synchronized in severe convective storms, we have implemented the advection correction method to correct the radial velocity data [44,48,49].
3. Synoptic and Mesoscale Environment
3.1. Synoptic Conditions and Disaster Description
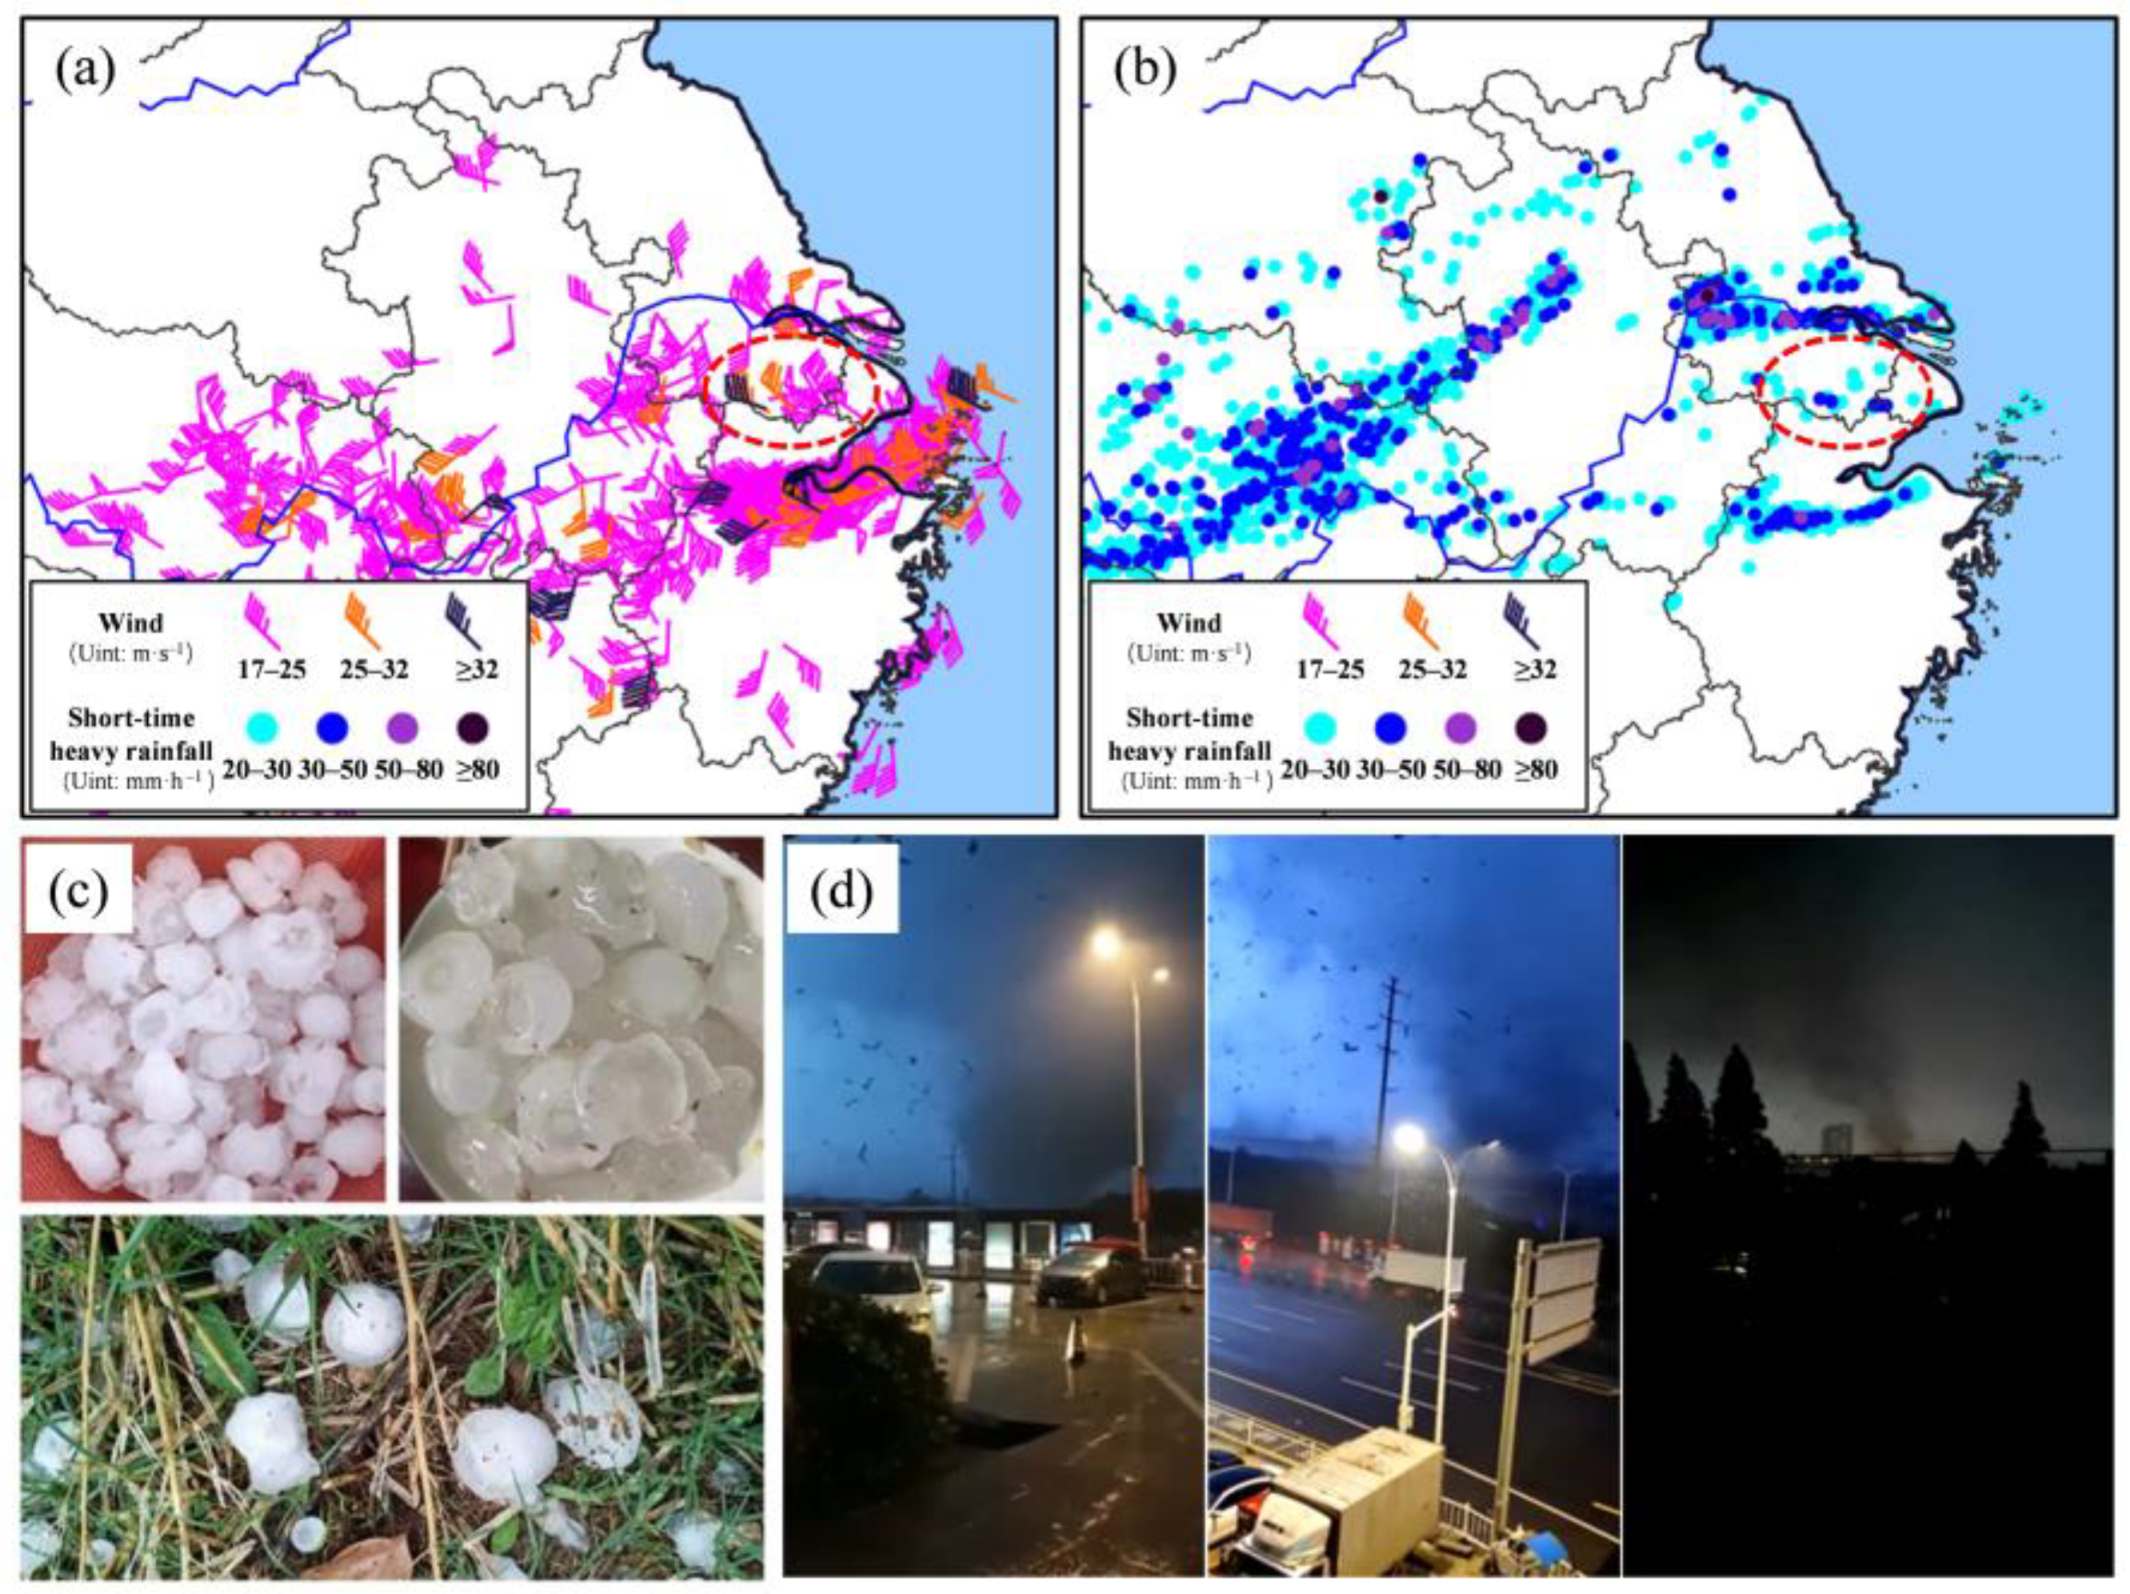
Severe convective weather events (e.g., thunderstorms with gales that reached 17 to 25 m s−1 and, in some local areas, exceeded 32 m s−1; severe thunder and lightning; hail; and short-term heavy precipitation) occurred in northern Zhejiang and along southern Jiangsu from noon through the night on 14 May 2021 (Figure 2a–c). An EF3 tornado occurred in the region tracking from Shengze Township, Wujian District, Suzhou, to Wangjiangjing Township, Xiuzhou District, Jiaxing, between 1848 and 1906 BT (UTC + 8 h), according to QPRD. The tornado formed near Hehua Village, Shengze Township, and subsequently moved eastward by south and reached Jiaxing at approximately 1900 BT. In the presence of the tornado, the maximum wind speed reached 31.9 m s−1. Figure 2d shows the photographs of the tornado funnel captured by eyewitnesses. Statistical data show that this tornado event caused 4 deaths and injured 149 individuals.
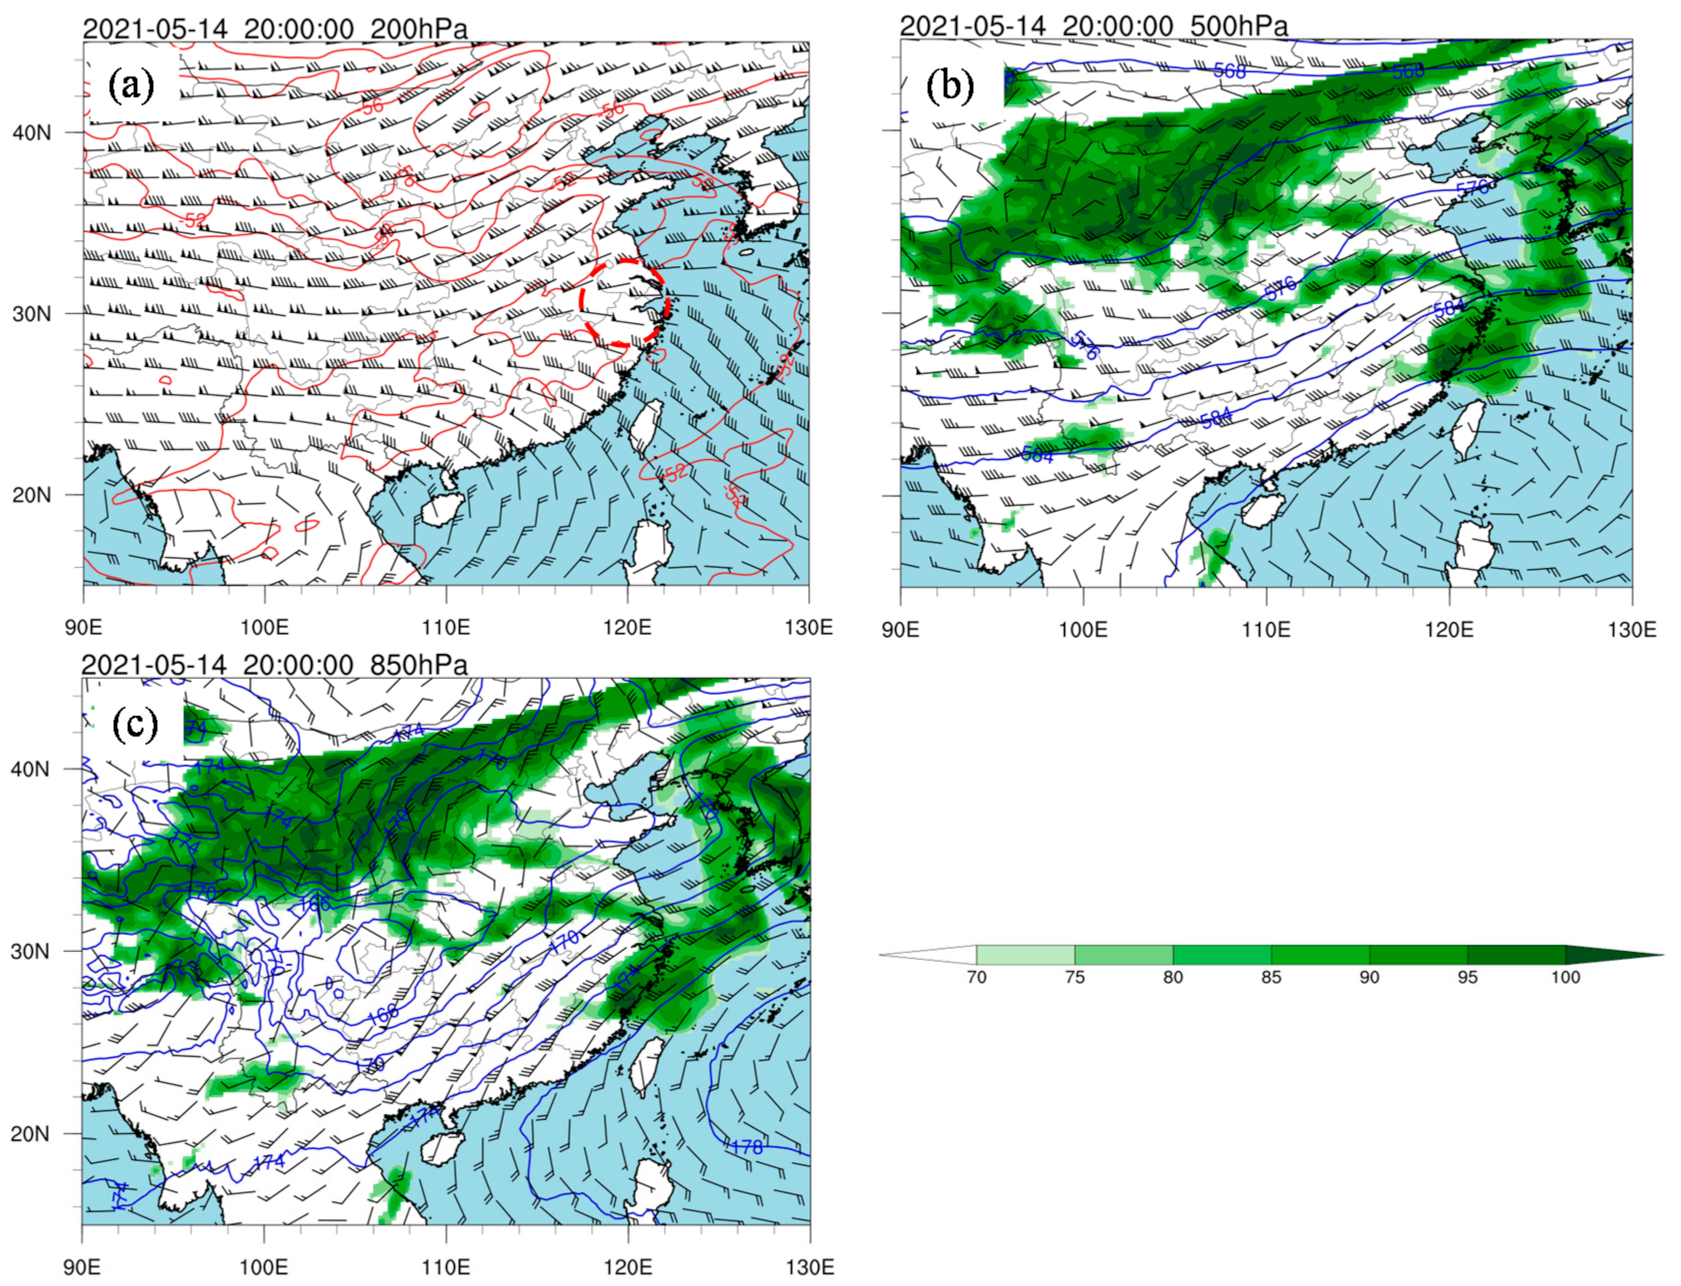
Figure 3 shows the synoptic maps for 2000 BT on 14 May 2021, produced using the ERA5 data. The analysis of the 200-hPa isobaric surface at 2000 BT reveals that the air pumping action of the upper divergence field resulted in the dynamic instability environmental condition of the northern Jiangnan region (as indicated by the red circle in Figure 3a). More critically, the divergence region was also very cold. The temperatures in the region within the red circle in Figure 3a were extremely low. The temperature in the upper atmosphere (200 hPa) near Suzhou ranged from –52 °C to –50 °C. The analysis of the plotted upper-level synoptic map and 500-hPha wind field map (not shown) for 0800 BT reveals a relatively strong subtropical high and that northern Zhejiang and southern Jiangsu were located near the 584-hPa contour on the margin of the subtropical high. At 0800 BT, the region extending from Central China to East China was beneath a wide trough, while the middle and lower reaches of the Yangtze River were beneath the positive-vorticity advection region downstream from the trough. In addition, there was a strong (24 m s−1) southwest jet stream over the northern Jiangnan region. At 2000 BT, the subtropical high further intensified, while the 588-hPa contour jumped northward from over the sea to the land, and the 500-hPa jet stream strengthened to some extent and jumped northward (Figure 3b). A southwest low-level jet stream was maintained and strengthened over the lower reaches of the Yangtze River. In addition, the 700-hPa (not shown) and 850-hPa levels were both affected by the low-level southwest jet stream, providing abundant water vapor and atmospheric instability, while a warm ridge was present over Suzhou, extending through Jiaxing (Figure 3c). The extremely cold upper-level temperatures and high surface temperatures collectively created a high temperature gradient in the vertical space, resulting in thermal instability. Therefore, three conditions—the water vapor and atmospheric instability provided by the lower-level jet stream, the air pumping action of upper divergence field and thermal instability at the upper level—all together promoted the rise of convection motions.
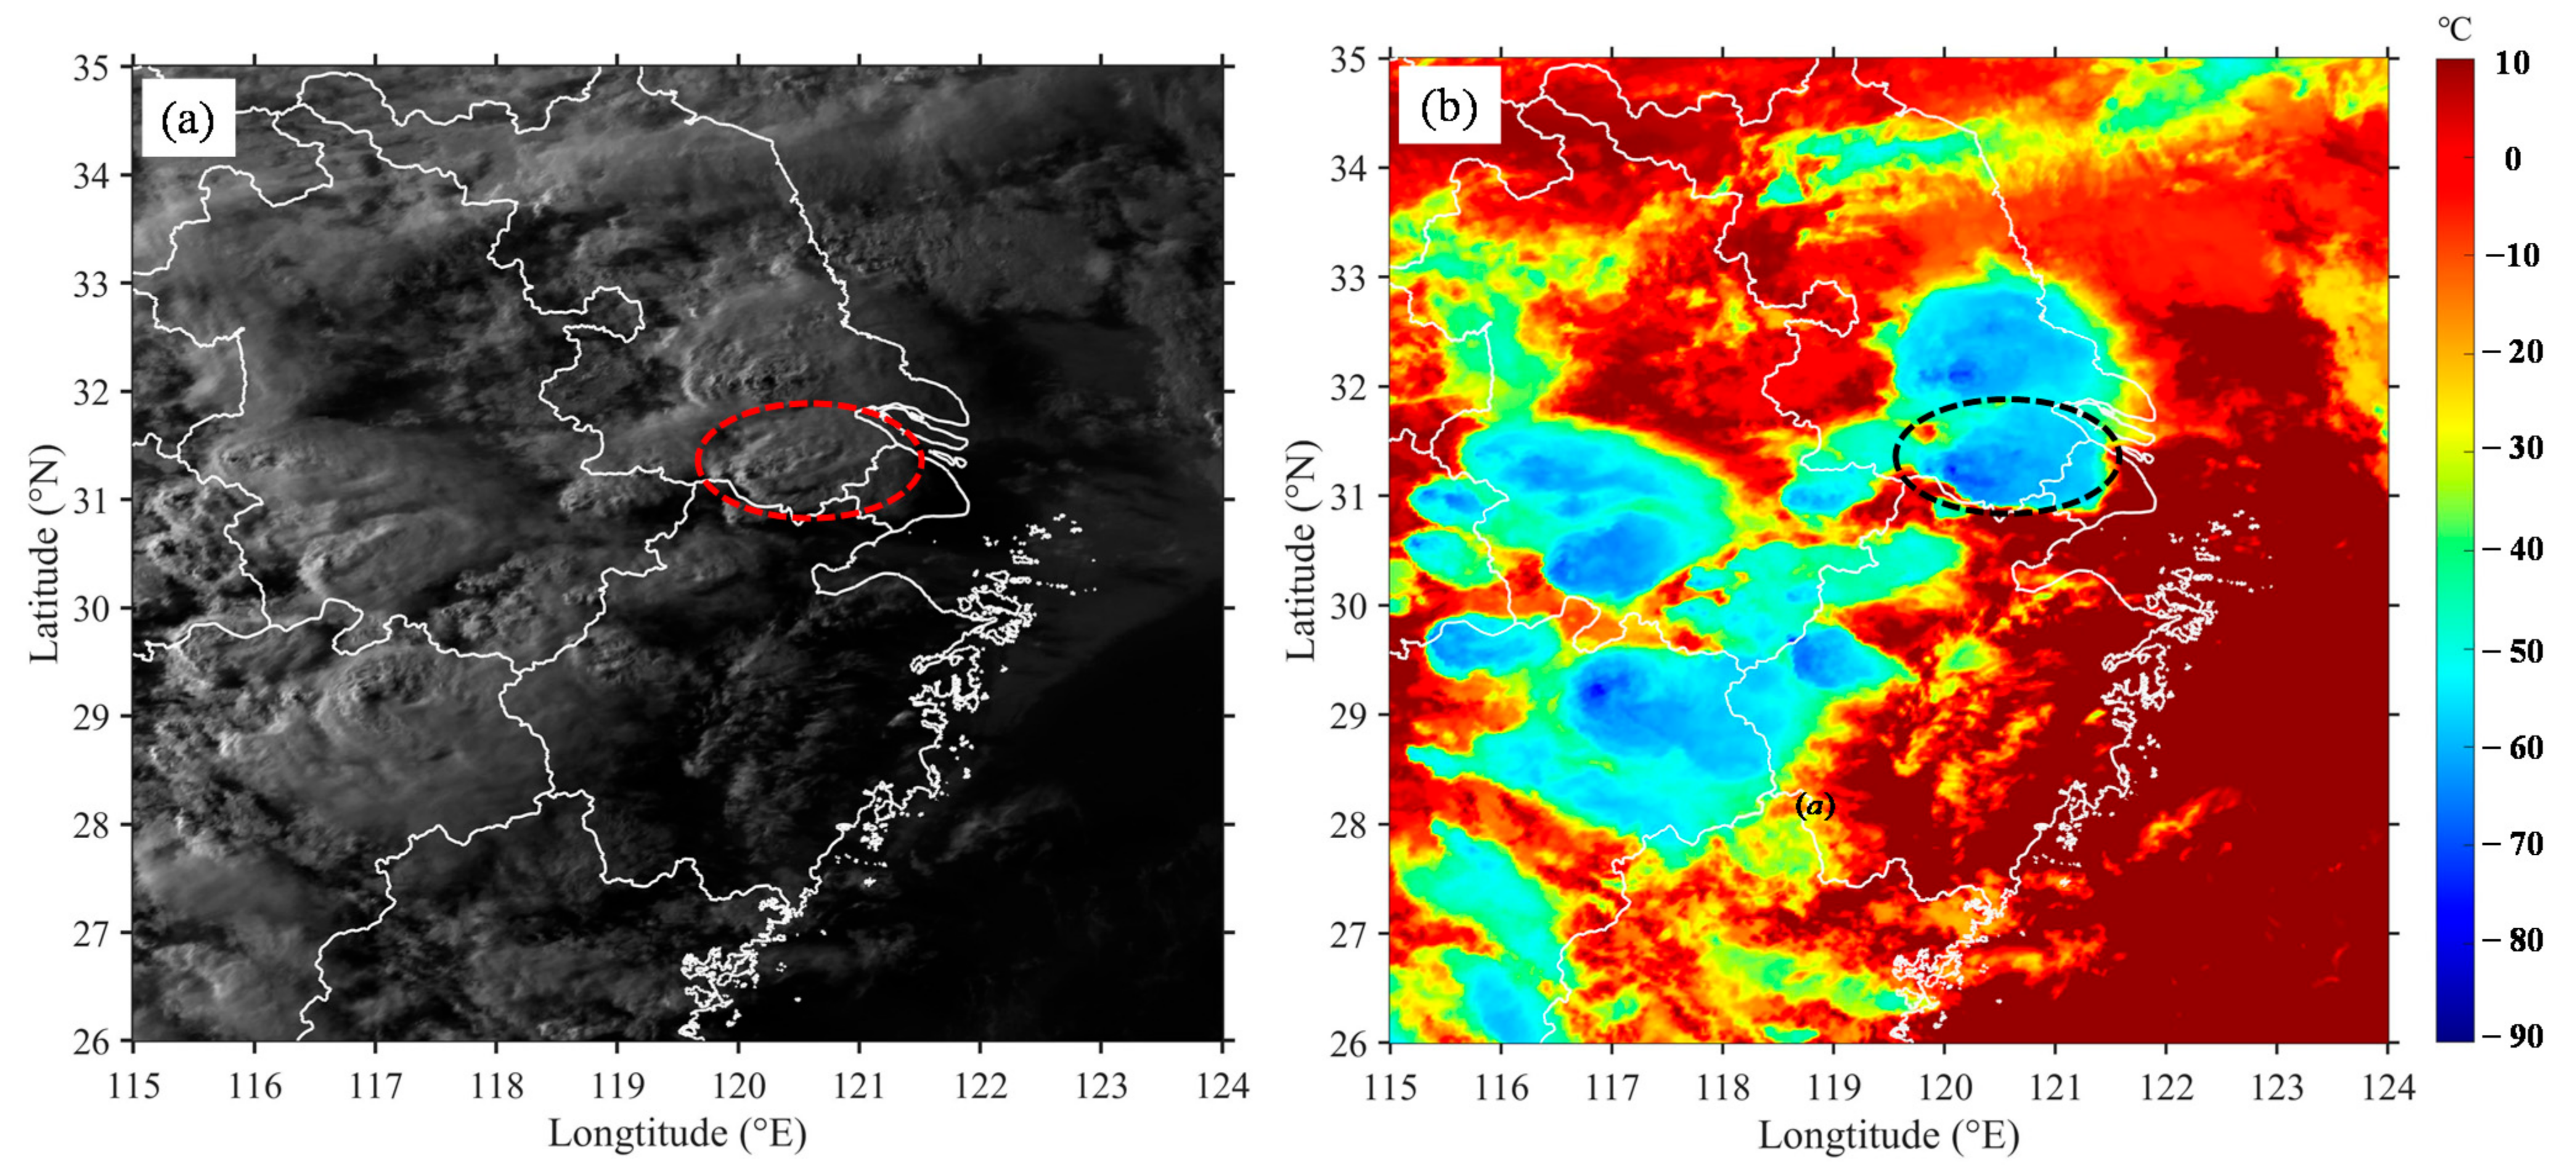
The analysis of the Himawari-8 satellite data for 1750 BT reveals that an oval convective cloud cluster, as indicated by the dashed red oval in the visible light image in Figure 4a, had formed over Lake Taihu, extending through Suzhou one hour before tornadogenesis. A very rough cloud top with distinct characteristics of an overshooting cloud top and its shadow can be observed. In addition, a marked boundary between the convective storm over Lake Taihu and the convection currents on its northern side can be distinguished. The minimum brightness temperature was approximately –90 °C, as indicated by the dashed black oval in Figure 4b, corresponding precisely to the 200-hPa extremely low temperature region in Figure 3, which provides favorable conditions for tornado occurrence.
3.2. Diagnosis of Local Atmospheric Physical Parameters
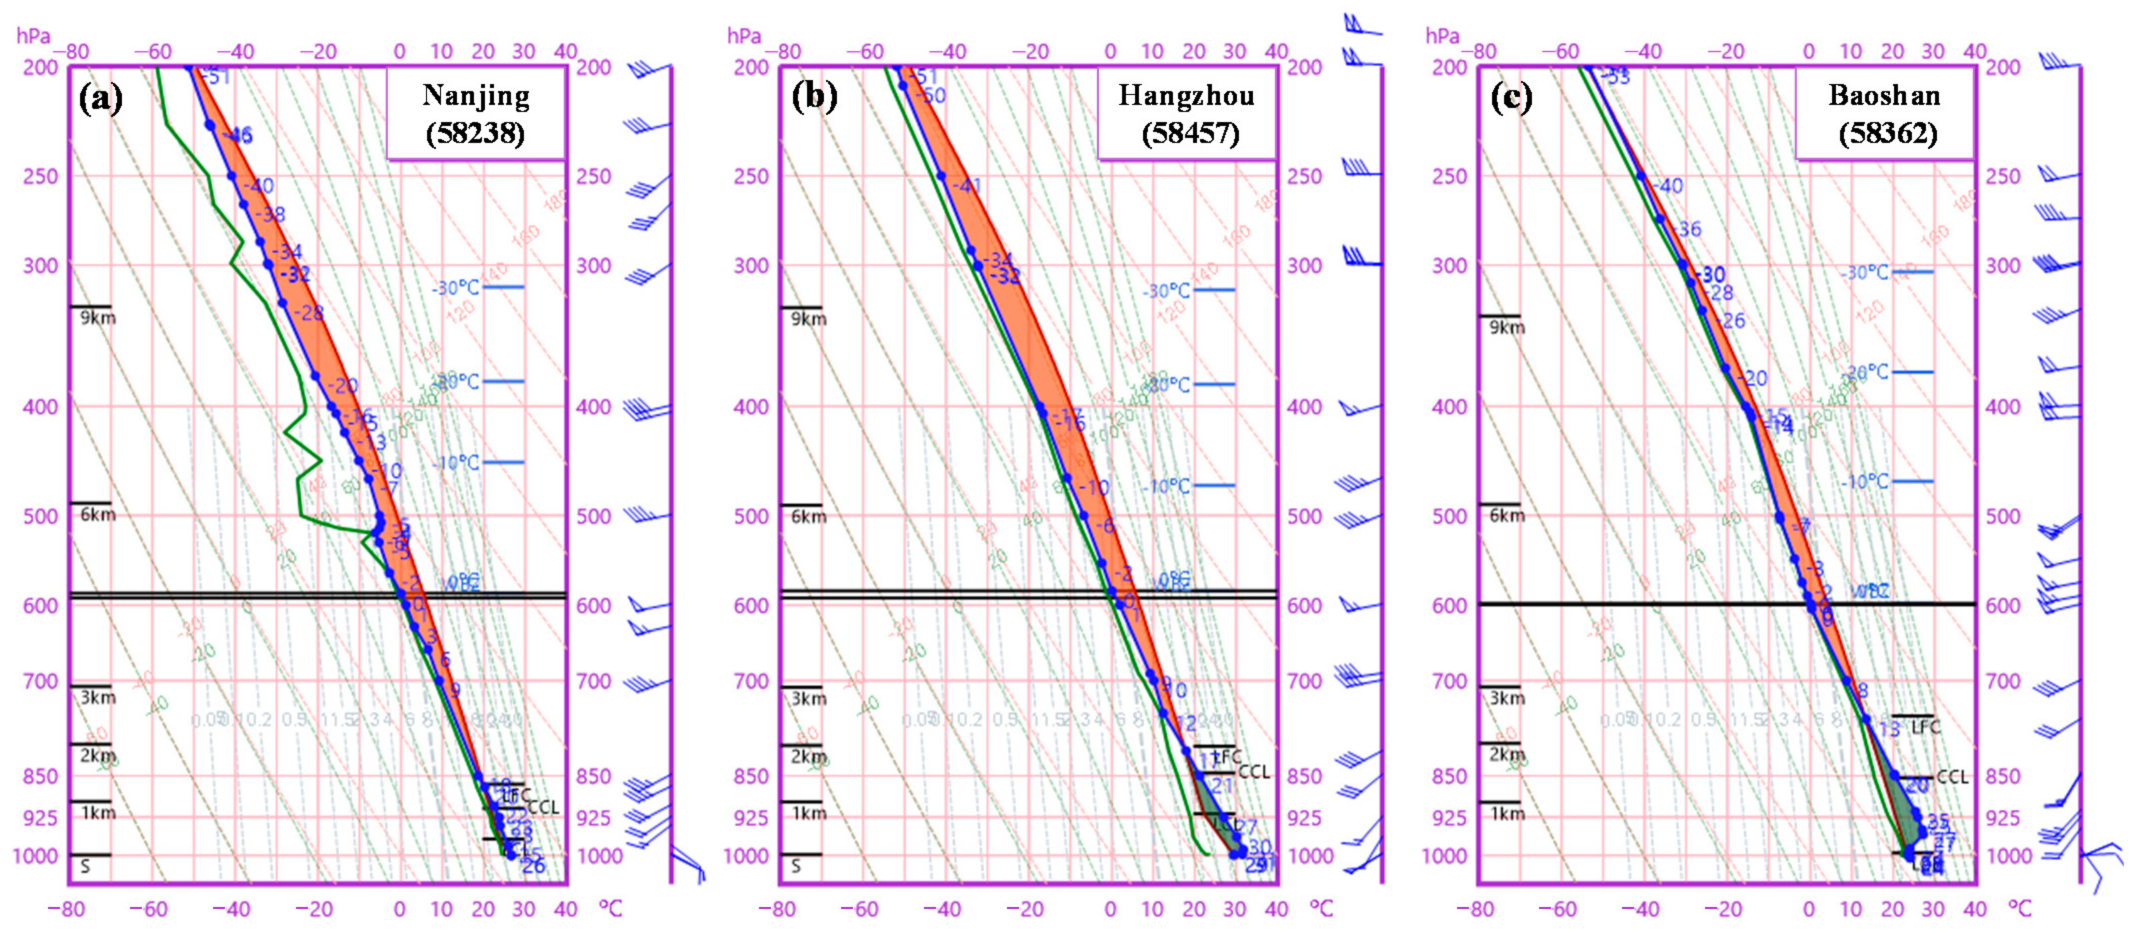
The analysis of the temperature–logarithm-of-pressure (T–logP) plots of the soundings taken at the Nanjing, Hangzhou and Baoshan stations reveals the following. At 2000 BT on 14 May, the convective available potential energy (CAPE) over each of the Nanjing and Hangzhou stations exceeded 2000 J kg−1 (Figure 5a,b). A distinct unstable stratification with dry and humid air at the upper and lower levels, respectively, was present over the Nanjing station, while the entire layer over the Baoshan stations was highly humid (Figure 5c).
A low lifting condensation level (LCL) and a large lower-level (0–1 km) vertical wind shear (S) are two conditions favorable for the formation of tornadoes, especially significant tornadoes [50,51]. Table 1 summarizes the storm environmental parameters approximately one hour after tornadogenesis. At 2000 BT on 14 May, the LCL over the Baoshan station was 994.7 hPa (94 m). In addition, the S over the Nanjing and Baoshan stations reached 13.9 and 10.9 m s−1 at 0–1 km, respectively, and 19.2 and 17.4 m s−1 at 0–3 km, respectively, suggesting a moderate or relatively high S level. In contrast, the 0–6 km S over the Baoshan station reached 23 m s−1, suggesting a high S level. These two factors were conducive to the formation of a highly organized supercell storm. In addition, the K indices for all three stations exceeded 40 °C and Showalter indices ranged from –2.21 to –3.46, suggesting a highly unstable atmospheric stratification at this time.
3.3. Wind Vector–Potential Temperature (V–3θ) Plots
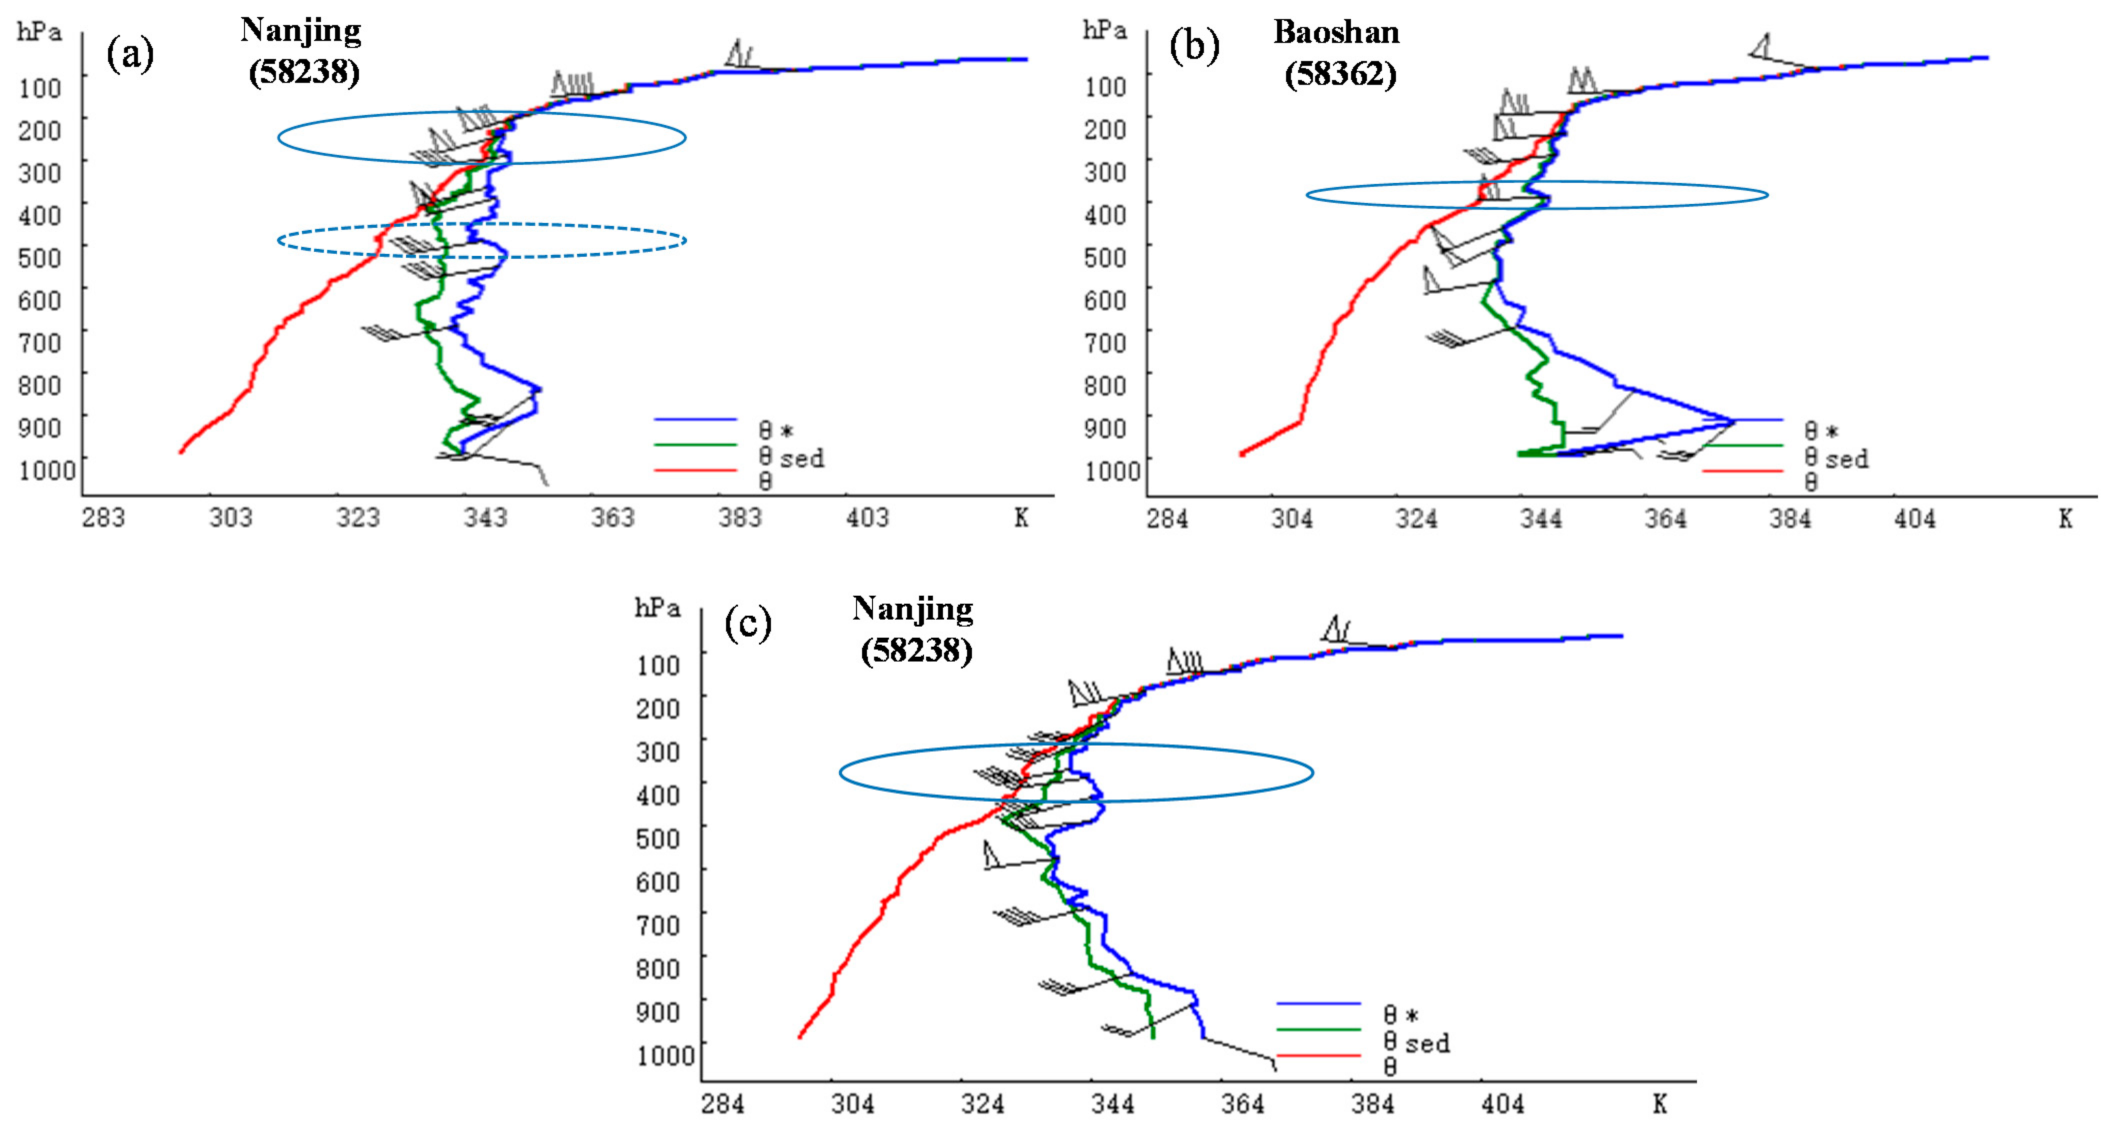
V–3θ plots can be used to analyze the vertical structure of a local atmospheric potential temperature. These plots are vertical potential temperature profiles produced based on the information on the characteristic layers contained in sounding data (V represents the horizontal wind direction and speed in the sounding data; 3θ represents the potential temperature of dry air θ, the pseudoequivalent potential temperature θse, and the potential temperature of saturated air θ*). The x- and y-axes of a V–3θ plot represent the temperature (K) and pressure (height), respectively. V–3θ plots are advantageous over T–logP plots because potential temperature is more reflective than temperature of the unstable energy structure of air masses and parcels [52].
The analysis of the V–3θ plot of the data taken at the Nanjing station at 0800 BT on 14 May (Figure 6a) reveals the presence of a distinct angular extremely low temperature structure (i.e., the cold source of the significant cooling process, as indicated by the solid blue oval) at the top of the troposphere (200 hPa), as well as cold stratus clouds (as indicated by the dotted blue oval) at the mid-level (400–500 hPa) that were dry throughout and contained a clockwise tumble consisting of a southeasterly wind in its lower part and a northwesterly wind in its upper part (i.e., a clockwise vertical circulation). This structure stimulated the air currents to rise and was conducive to the formation of severe convection. The analysis of the V–3θ plots of the data taken at the Baoshan (Figure 6b) and Nanjing (Figure 6c) stations at 2000 BT on 14 May (i.e., approximately 54 min after tornadogenesis) reveals notable cold stratus clouds (as indicated by the solid blue oval) and, similarly, a clockwise vertical circulation structure at the 300–400-hPa level. In addition, as the southwest jet stream further strengthened and moved northward, the humidity throughout this level increased significantly. As a result, the atmospheric stratification over the northern Jiangnan region became extremely unstable, which was conducive to the formation of severe convection.
4. Echo Characteristics and Structural Evolution of the Supercell
4.1. Mechanism of Interaction between Convective Storms during Mergers
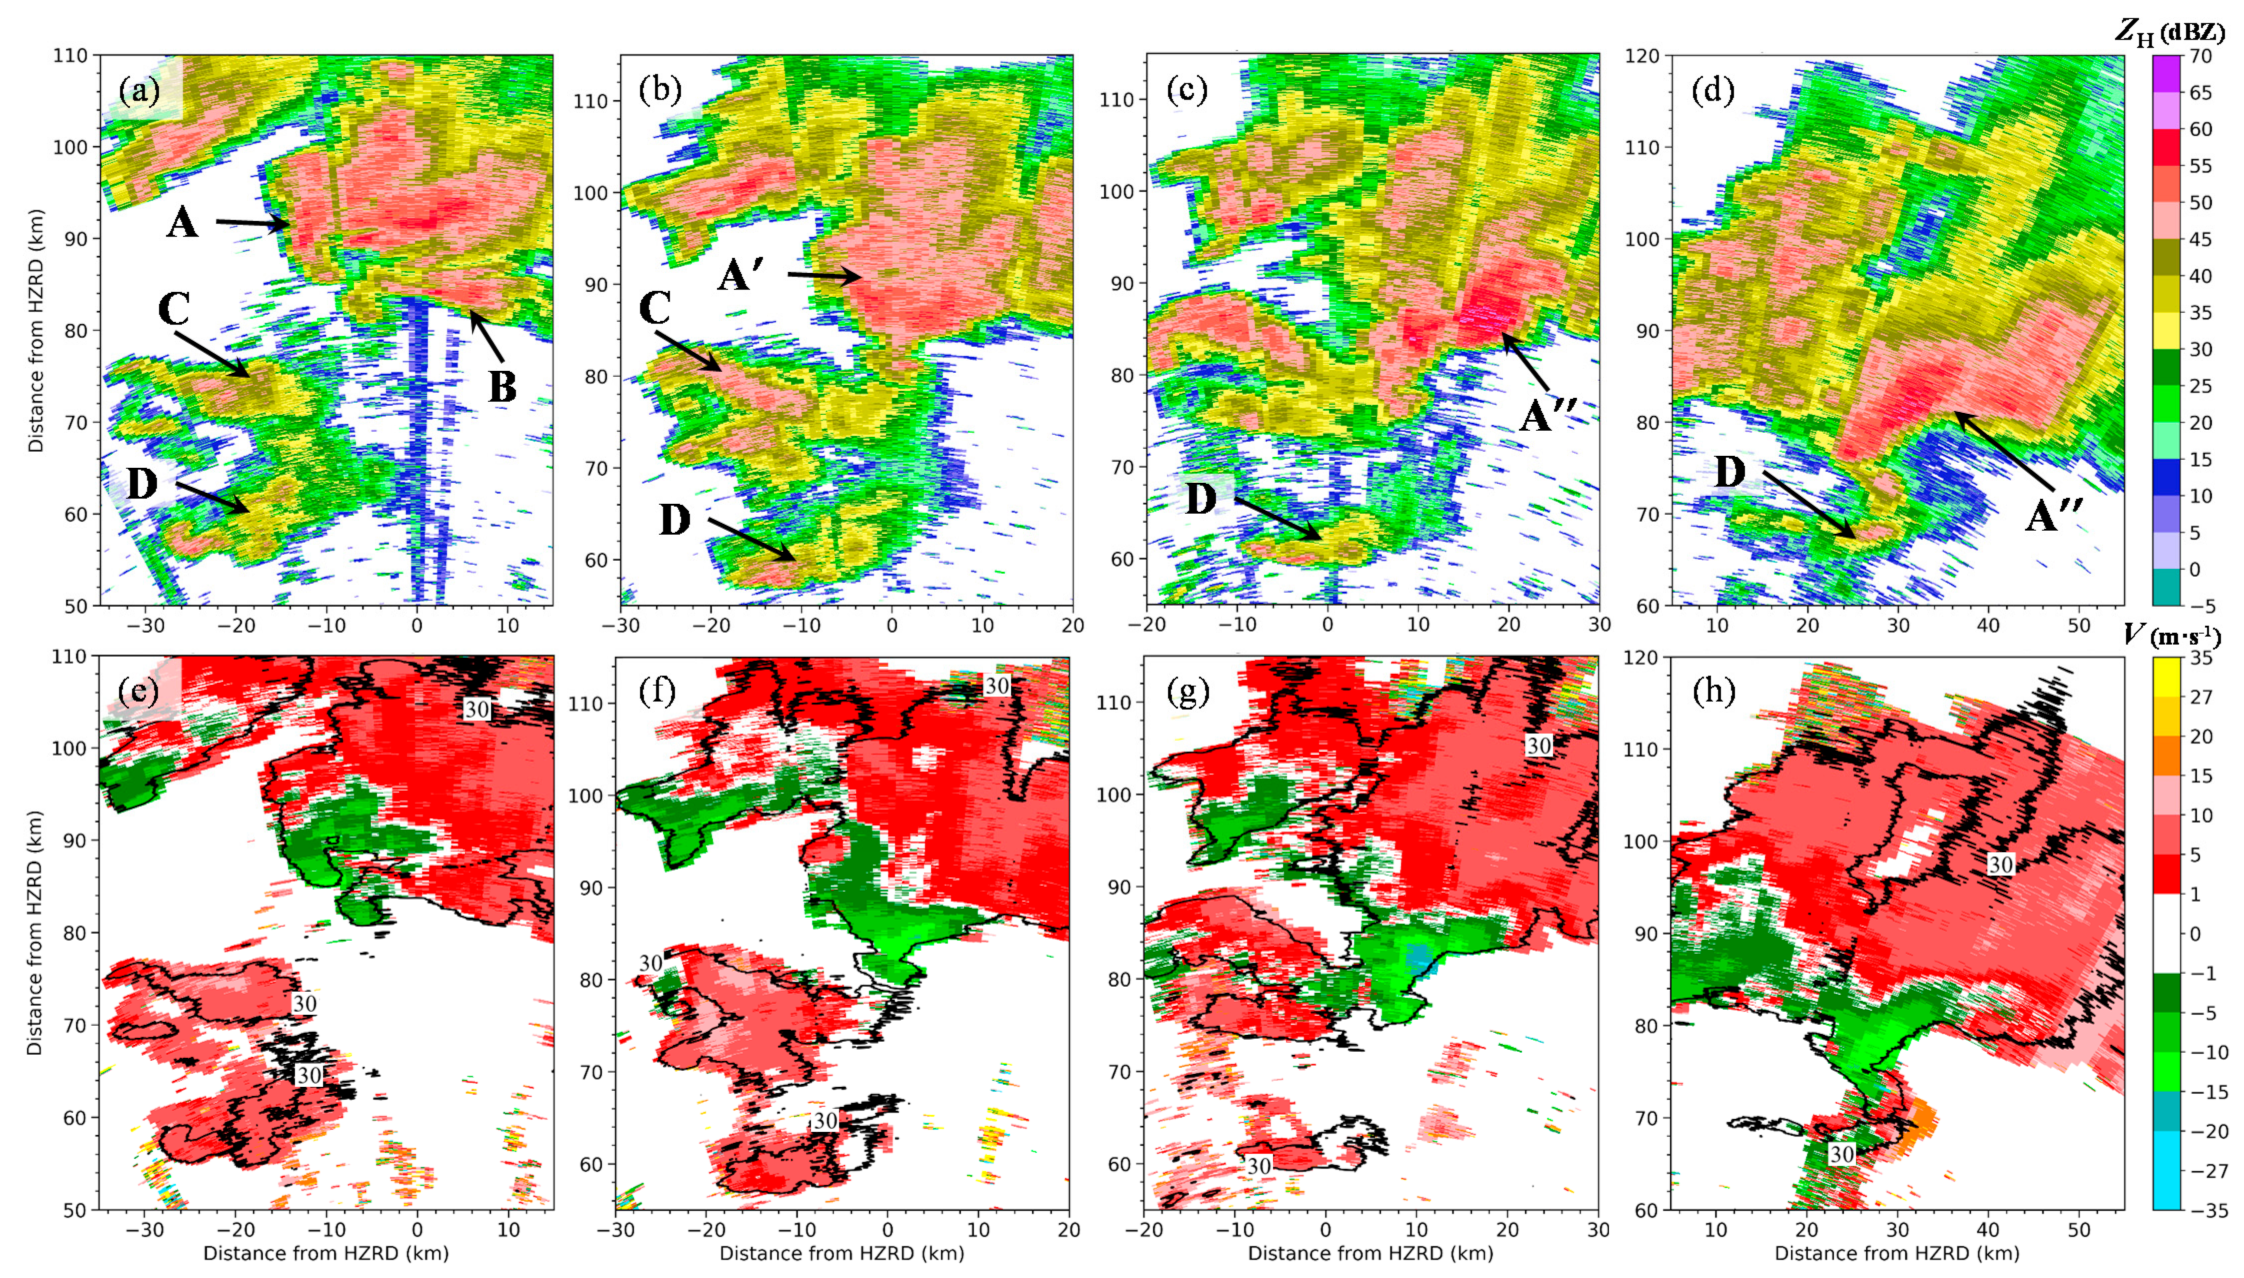
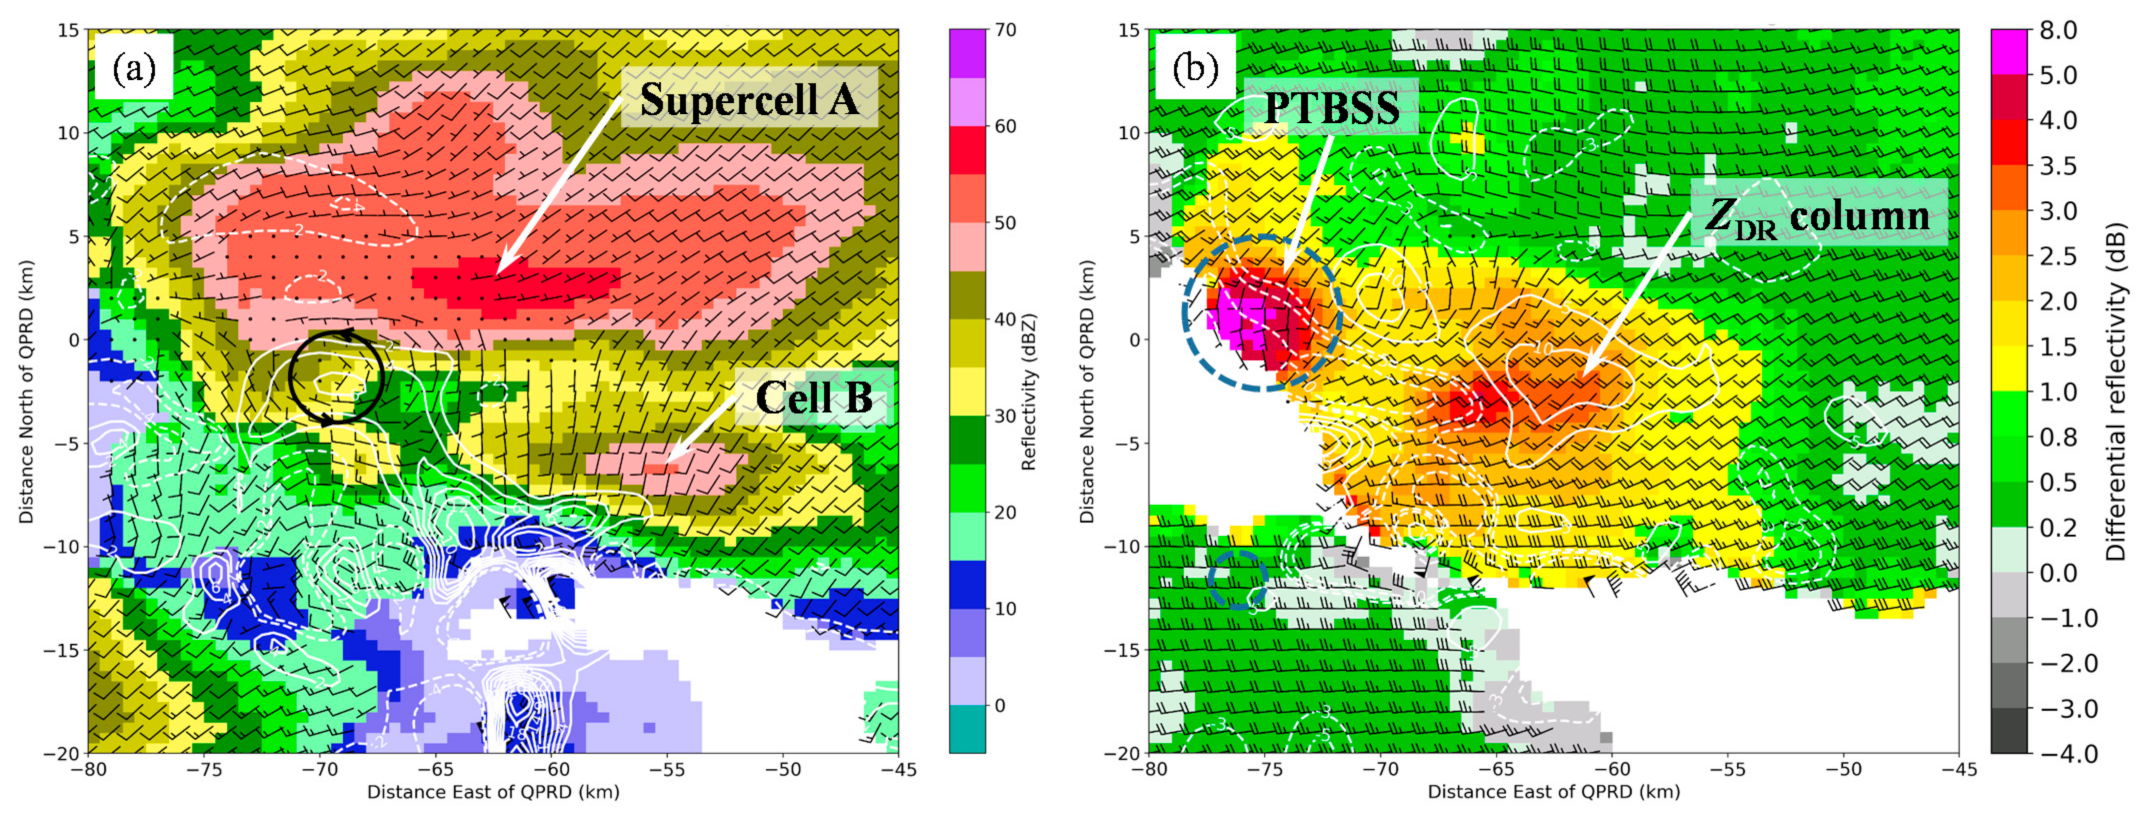
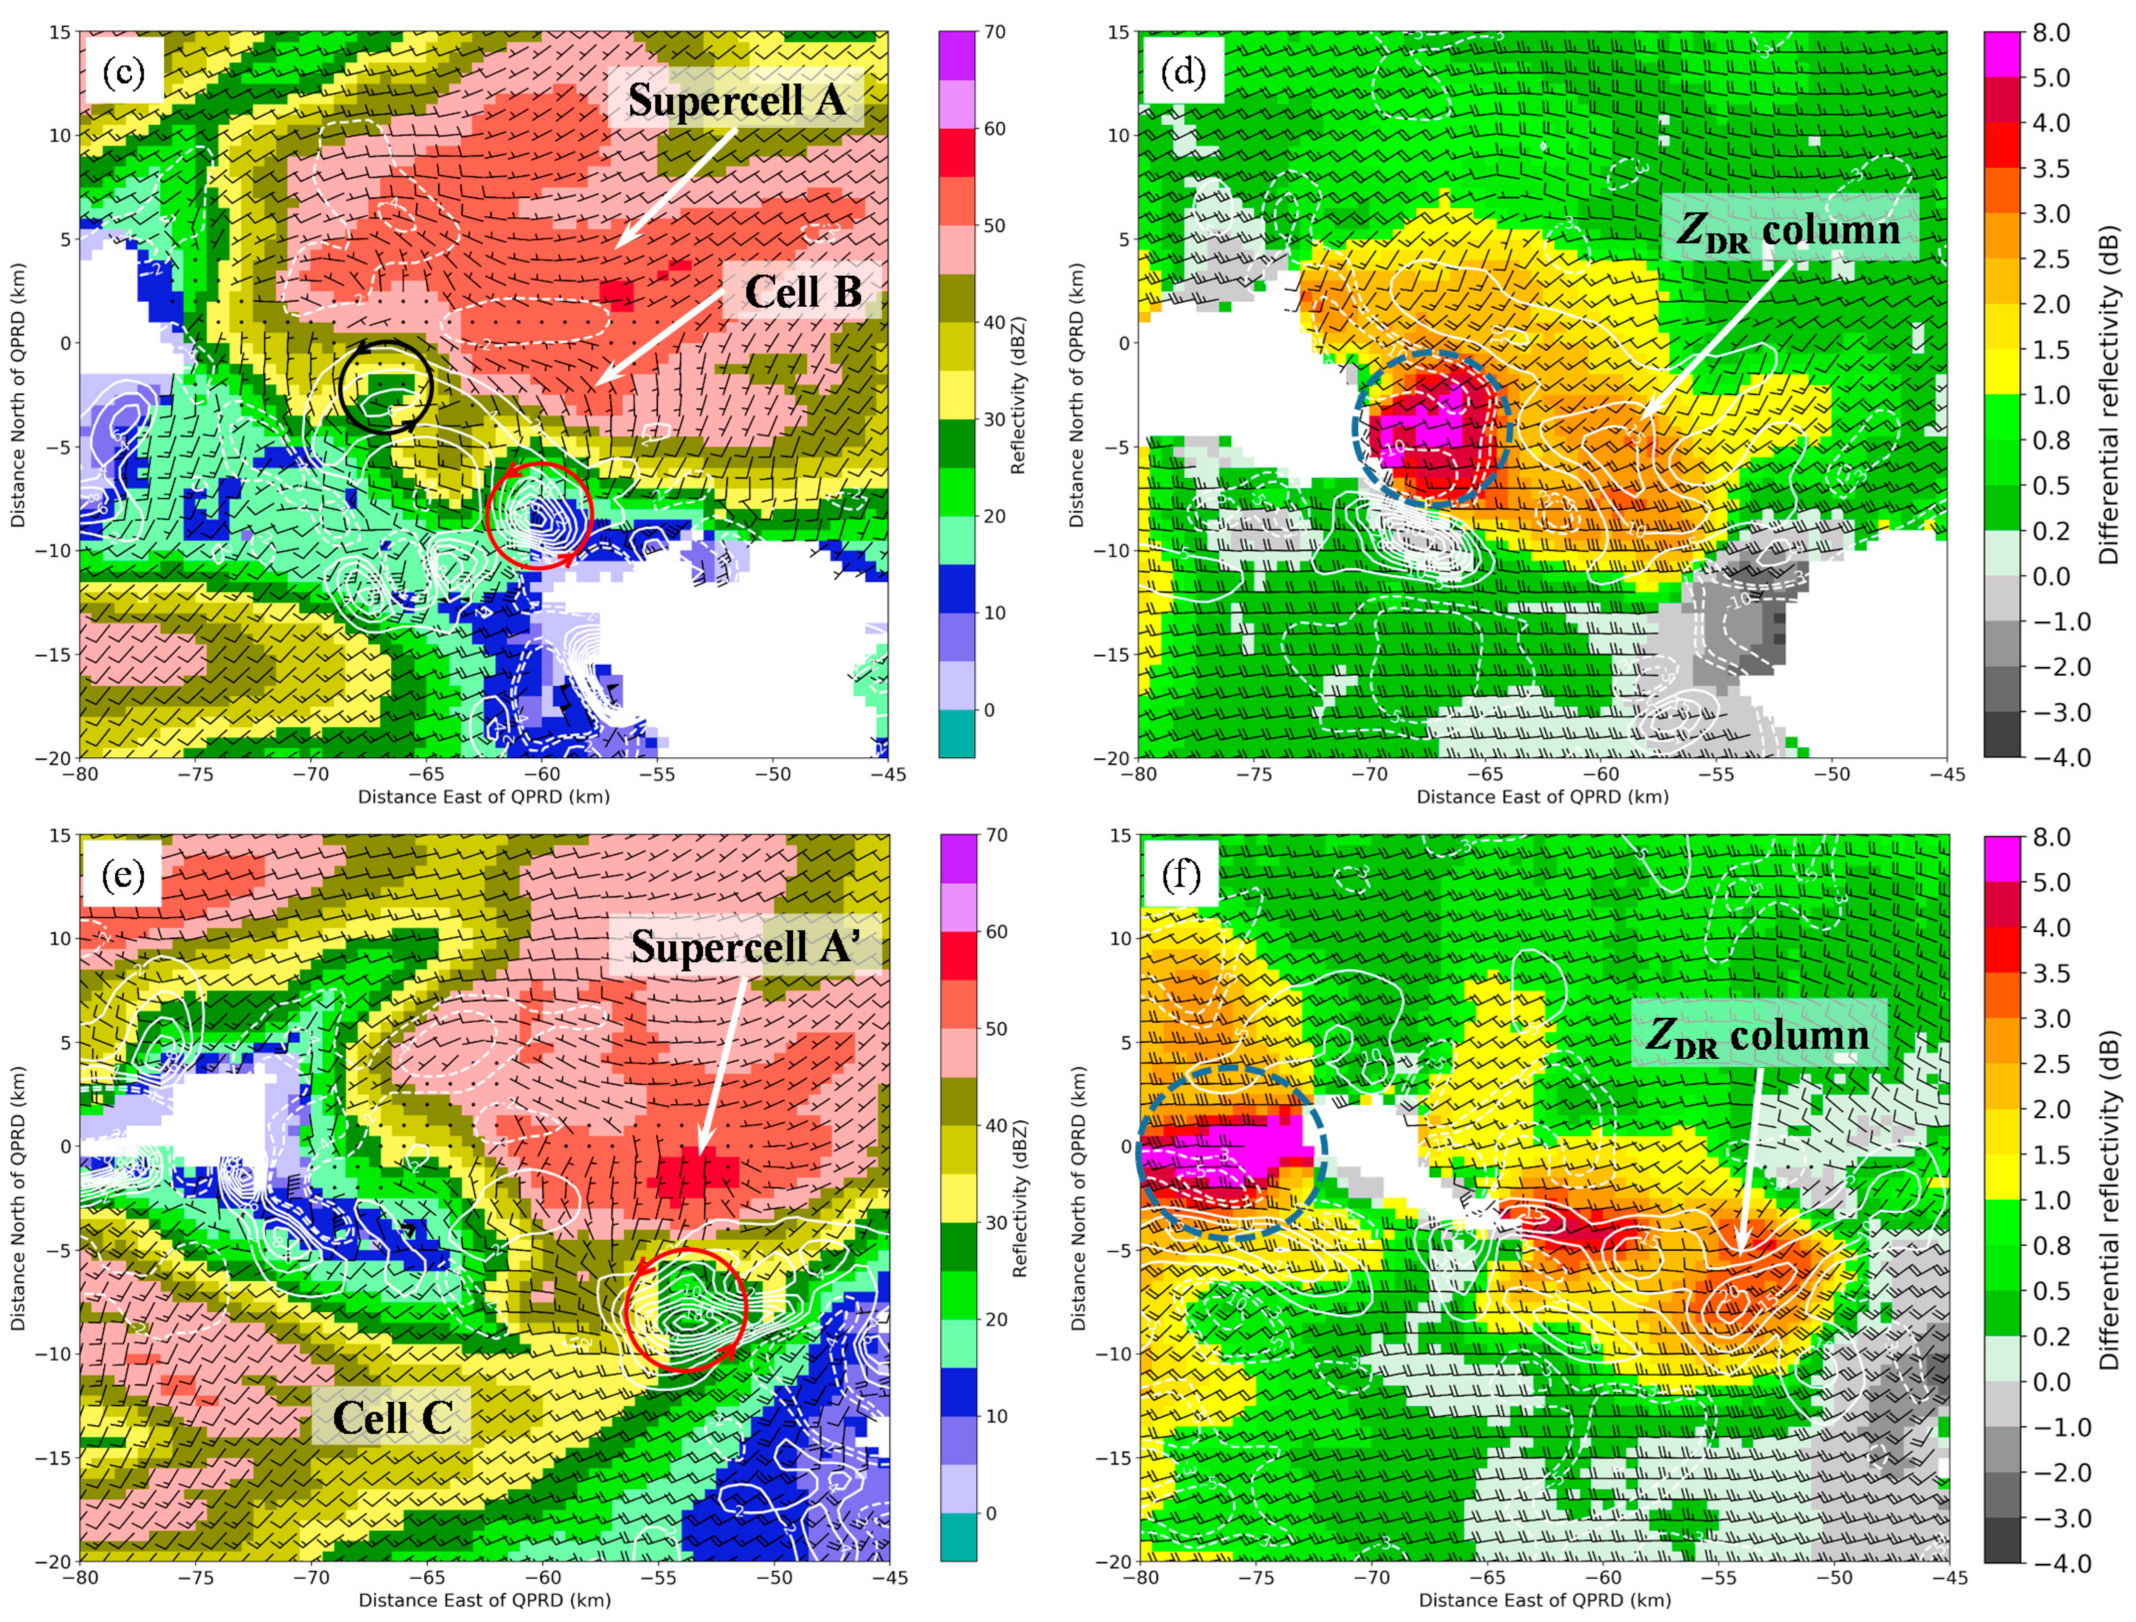
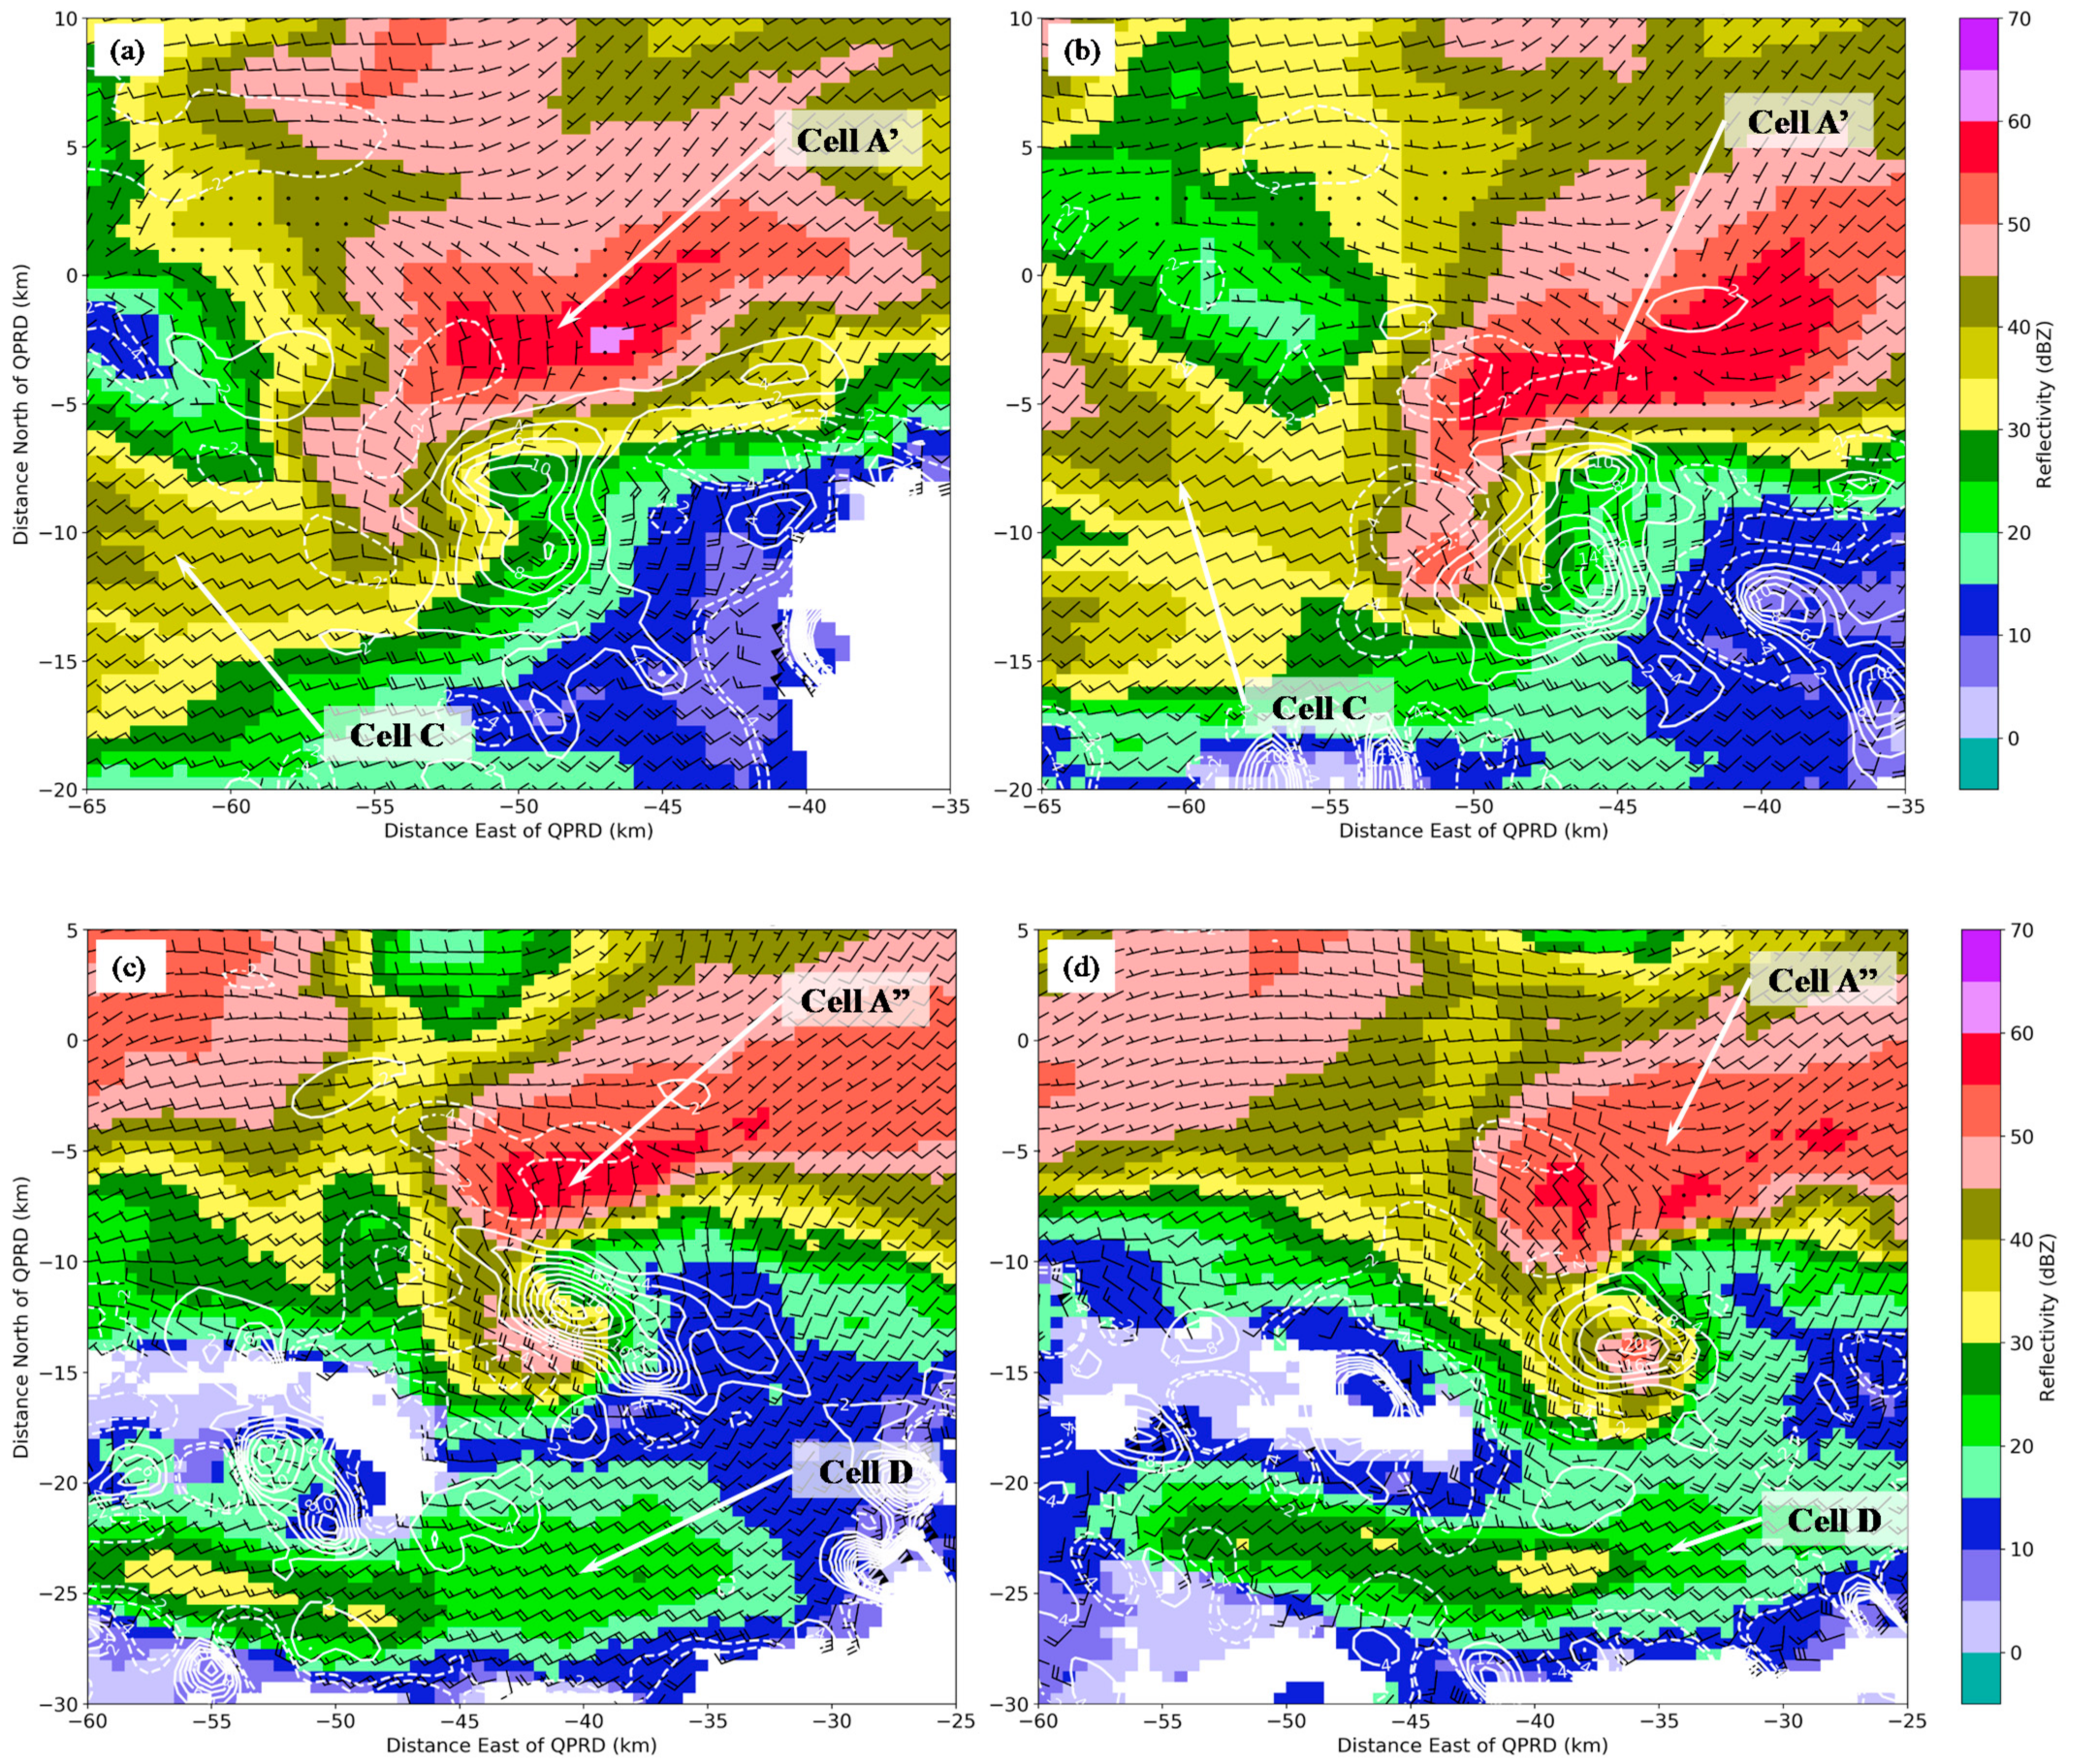
Figure 7 shows the time series of cell mergers on the plan position indicator (PPI) scan of ZH at an elevation of 0.5° from the HZRD, during 1804–1850 BT on 14 May. The tornado examined in this study was formed after the merger of supercell A with storm cells B, C, and D in turn (Figure 7a). Between 1804 and 1815 BT, supercell A merged with cell B, forming supercell A’ (Figure 7b). Between 1816 and 1825 BT, supercell A’ merged with cell C, forming supercell A” with a strong vortex and a hook structure (Figure 7c). Tornadogenesis occurred shortly after supercell A” merged with cell D, a process which likely played a role in generating the necessary conditions for tornado formation (Figure 7d). A marked tornadic vortex signature (TVS) can be observed at X = 28 to 30 km and Y = 72 to 74 km over Shengze Township at approximately 1850 BT, according to the HZRD (Figure 7h). The tornado then moved to the northern Xiuzhou District, Jiaxing between 1900 and 1906 BT and lasted for approximately 18 min. A post-disaster investigation found a narrow tornado-affected banded region approximately 100 m in width.
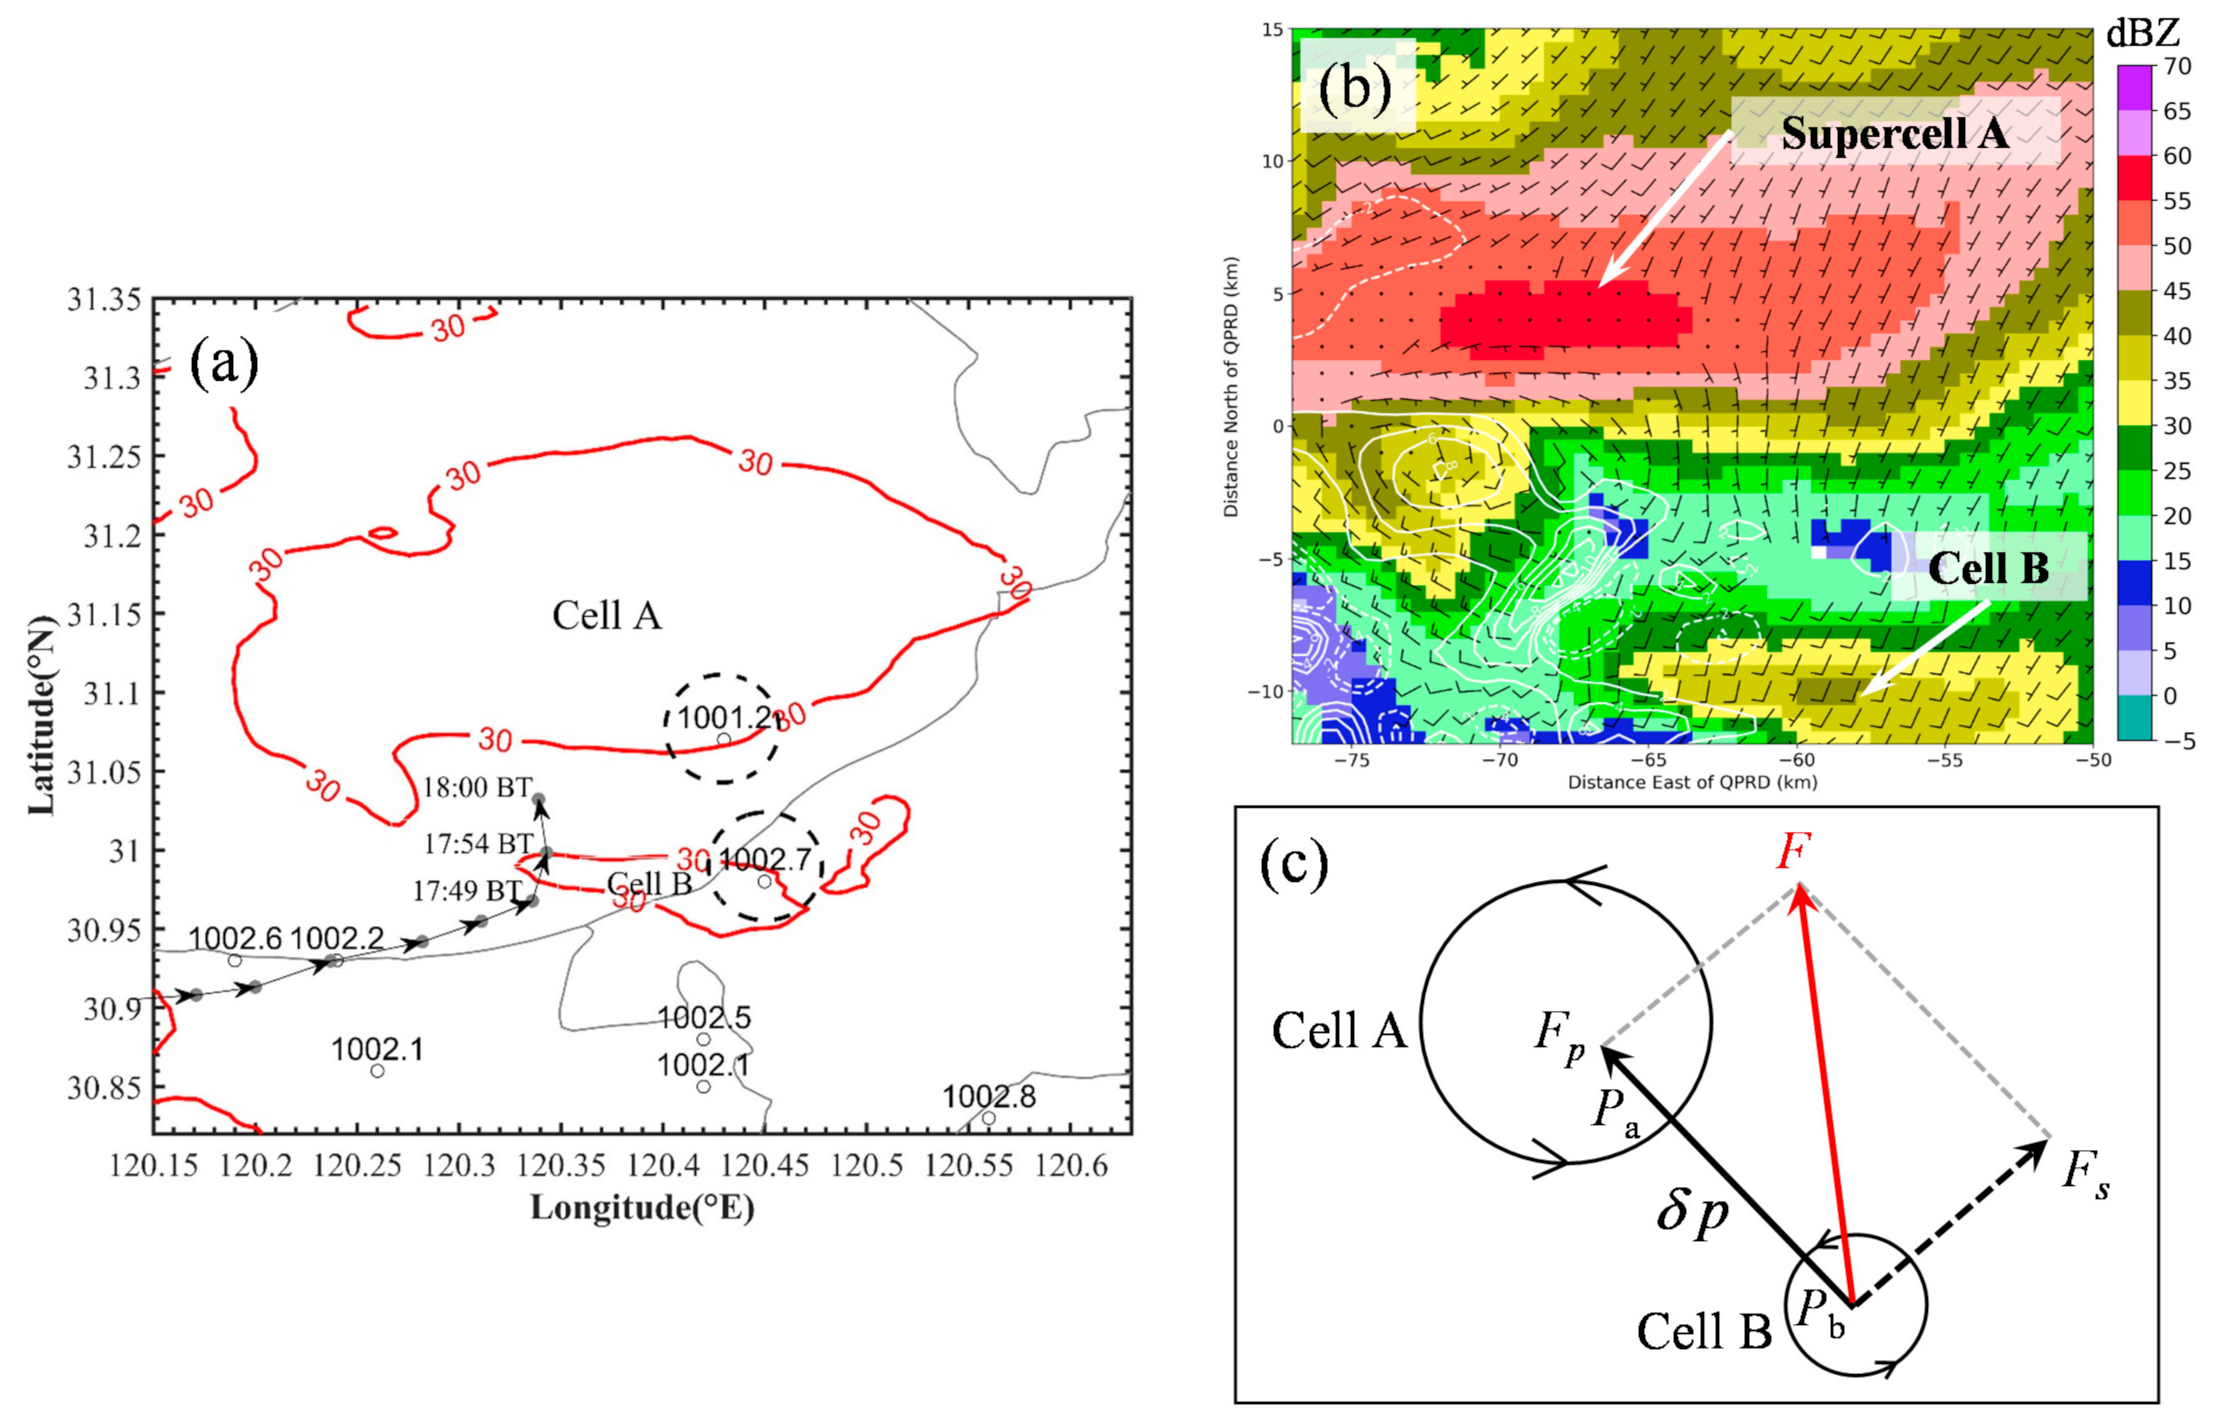
The storm-cell merger process likely played a role in generating the necessary conditions for tornado formation [11,18]. For two storm cells that gradually approach each other, the mechanisms of their interaction and respective morphological changes may be highly complex and are yet to be fully understood. The tornado event examined in this study involved three cell merger and intensification processes. In the first process, supercell A, during its eastward propagation, encountered and merged with storm cell B, forming supercell A’, which then rapidly evolved and intensified. Usually, a supercell tends to deviate to the right of the moving direction during its movement because of the Magnus force, which comes from the Bernoulli effect. Before supercell A merged with cell B, supercell A moved eastward, while cell B moved eastward by north (not shown). However, when the two cells approached, the northward component of cell B increased significantly. The analysis of the storm track information product of HZRD reveals that cell B moved eastward by north before 1749 BT, but suddenly turned north between 1749 and 1800 BT (as indicated by the solid black arrowed line in Figure 8a) and completely entered supercell A at 1815 BT. Here, the cause of the sudden change in the path of cell B is analyzed. Supercell A and cell B can be thought of as two rotating columns of air and the analysis of the CAPPI scan of ZH at a height of 1 km, overlaid with the distribution of the horizontal wind field and vertical vorticity contours (Figure 8b), reveals that the horizontally rotating velocity of supercell A was larger than cell B and that the vertical vorticity of supercell A was 0.8 × 10⁻² s–1 near the hook, compared to a near-zero vorticity for cell B. According to the Bernoulli equation of fluid mechanics [53],
where is the pressure, is the density, is the wind velocity, g is the gravitational acceleration, and h is the height of the point of interest. In other words, at the same geopotential height, the within an air mass is inversely proportional to its rotational velocity (i.e., ). A high results in a low . A difference of 5–20 m s−1 can lead to a difference of over 2 hPa [54]. The AWS data show values of 1001.2 and 1002.7 hPa pressure within supercell A and convective cell B, respectively, at 1755 BT, which translates to a difference of 1.5 hPa (as indicated by the dotted black rings in Figure 8a). These observations also confirm that the within supercell A was lower than that within cell B, which led to the formation of a local pressure gradient force Fp. In addition, cell B was subject to the force from the mean environmental wind, Fs. Under the action of the resulting force F, cell B was absorbed by supercell A, which explains the abrupt northward turn of cell B as it approached supercell A. This process is illustrated in Figure 8c.
Some research and literature show that ZH and vertical updraft strength can be used to characterize the mergers and intensification of convective storms [17,55]. The analysis of the CAPPI scan of ZH at a height of 1.5 km, overlaid with the horizontal wind field and vertical vorticity at 1800 BT (Figure 9a), shows the initiation of the 30-dBZ echo merger and the presence of a mesocyclone with a vertical vorticity up to 0.6 × 10⁻² s–1 (as indicated by the black circle) near the hook echo of supercell A. The maximum vertical ascending velocity corresponding to the ZDR column on the CAPPI of the 5 km ZDR was 10 m s−1 (Figure 9b). At 1806 BT (Figure 9c), the main body of cell B entered supercell A. During the merger process, cell B intensified and became similar to a mini-supercell with a distinct hook structure, while a vortex formed within it (as indicated by the red circle). Consequently, the maximum vertical vorticity of cell B increased to 1.6 × 10⁻² s–1, and the maximum vertical ascending velocity corresponding to the ZDR column increased to 15 m s−1 (Figure 9d). This intensification process may have been caused by the interaction between the RFD boundary of supercell A and the outflow of cell B [17,56]. At 1812 BT (Figure 9e), supercell A and cell B finally merged, forming supercell A’. During the merger process, the vortex of supercell A (as indicated by the black circle in Figure 9c) combined with that of cell B (as indicated by the red circle in Figure 9c) and formed a stronger vortex (as indicated by the red circle in Figure 9e), resulting in a rapid intensification of the front-flank inflow, an increase in the vertical vorticity to 1.8 × 10⁻² s–1, and an increase in the maximum ascending velocity corresponding to the ZDR column to 20 m s−1 (Figure 9f). At this time, the weak echo region on the east side of cell C, located on the southwest side of supercell A’, also began to approach and merge with the hook echo of supercell A’. The analysis of the CAPPI of the 5 km ZDR, overlaid with the horizontal wind field and vertical velocity at each time, reveals an increase in the vertical ascending velocity on the south side of the high-ZH region and the height of the corresponding ZDR column during the merger process, which further corroborates the earlier finding that the storm cells intensified during the merger process. It must be noted that the region with a descending velocity within the dotted blue ring in Figure 9b,d,f is not the ZDR column, but rather the polarimetric three-body scattering signature (PTBSS) [57,58].
4.2. Evolutionary Characteristics of SW
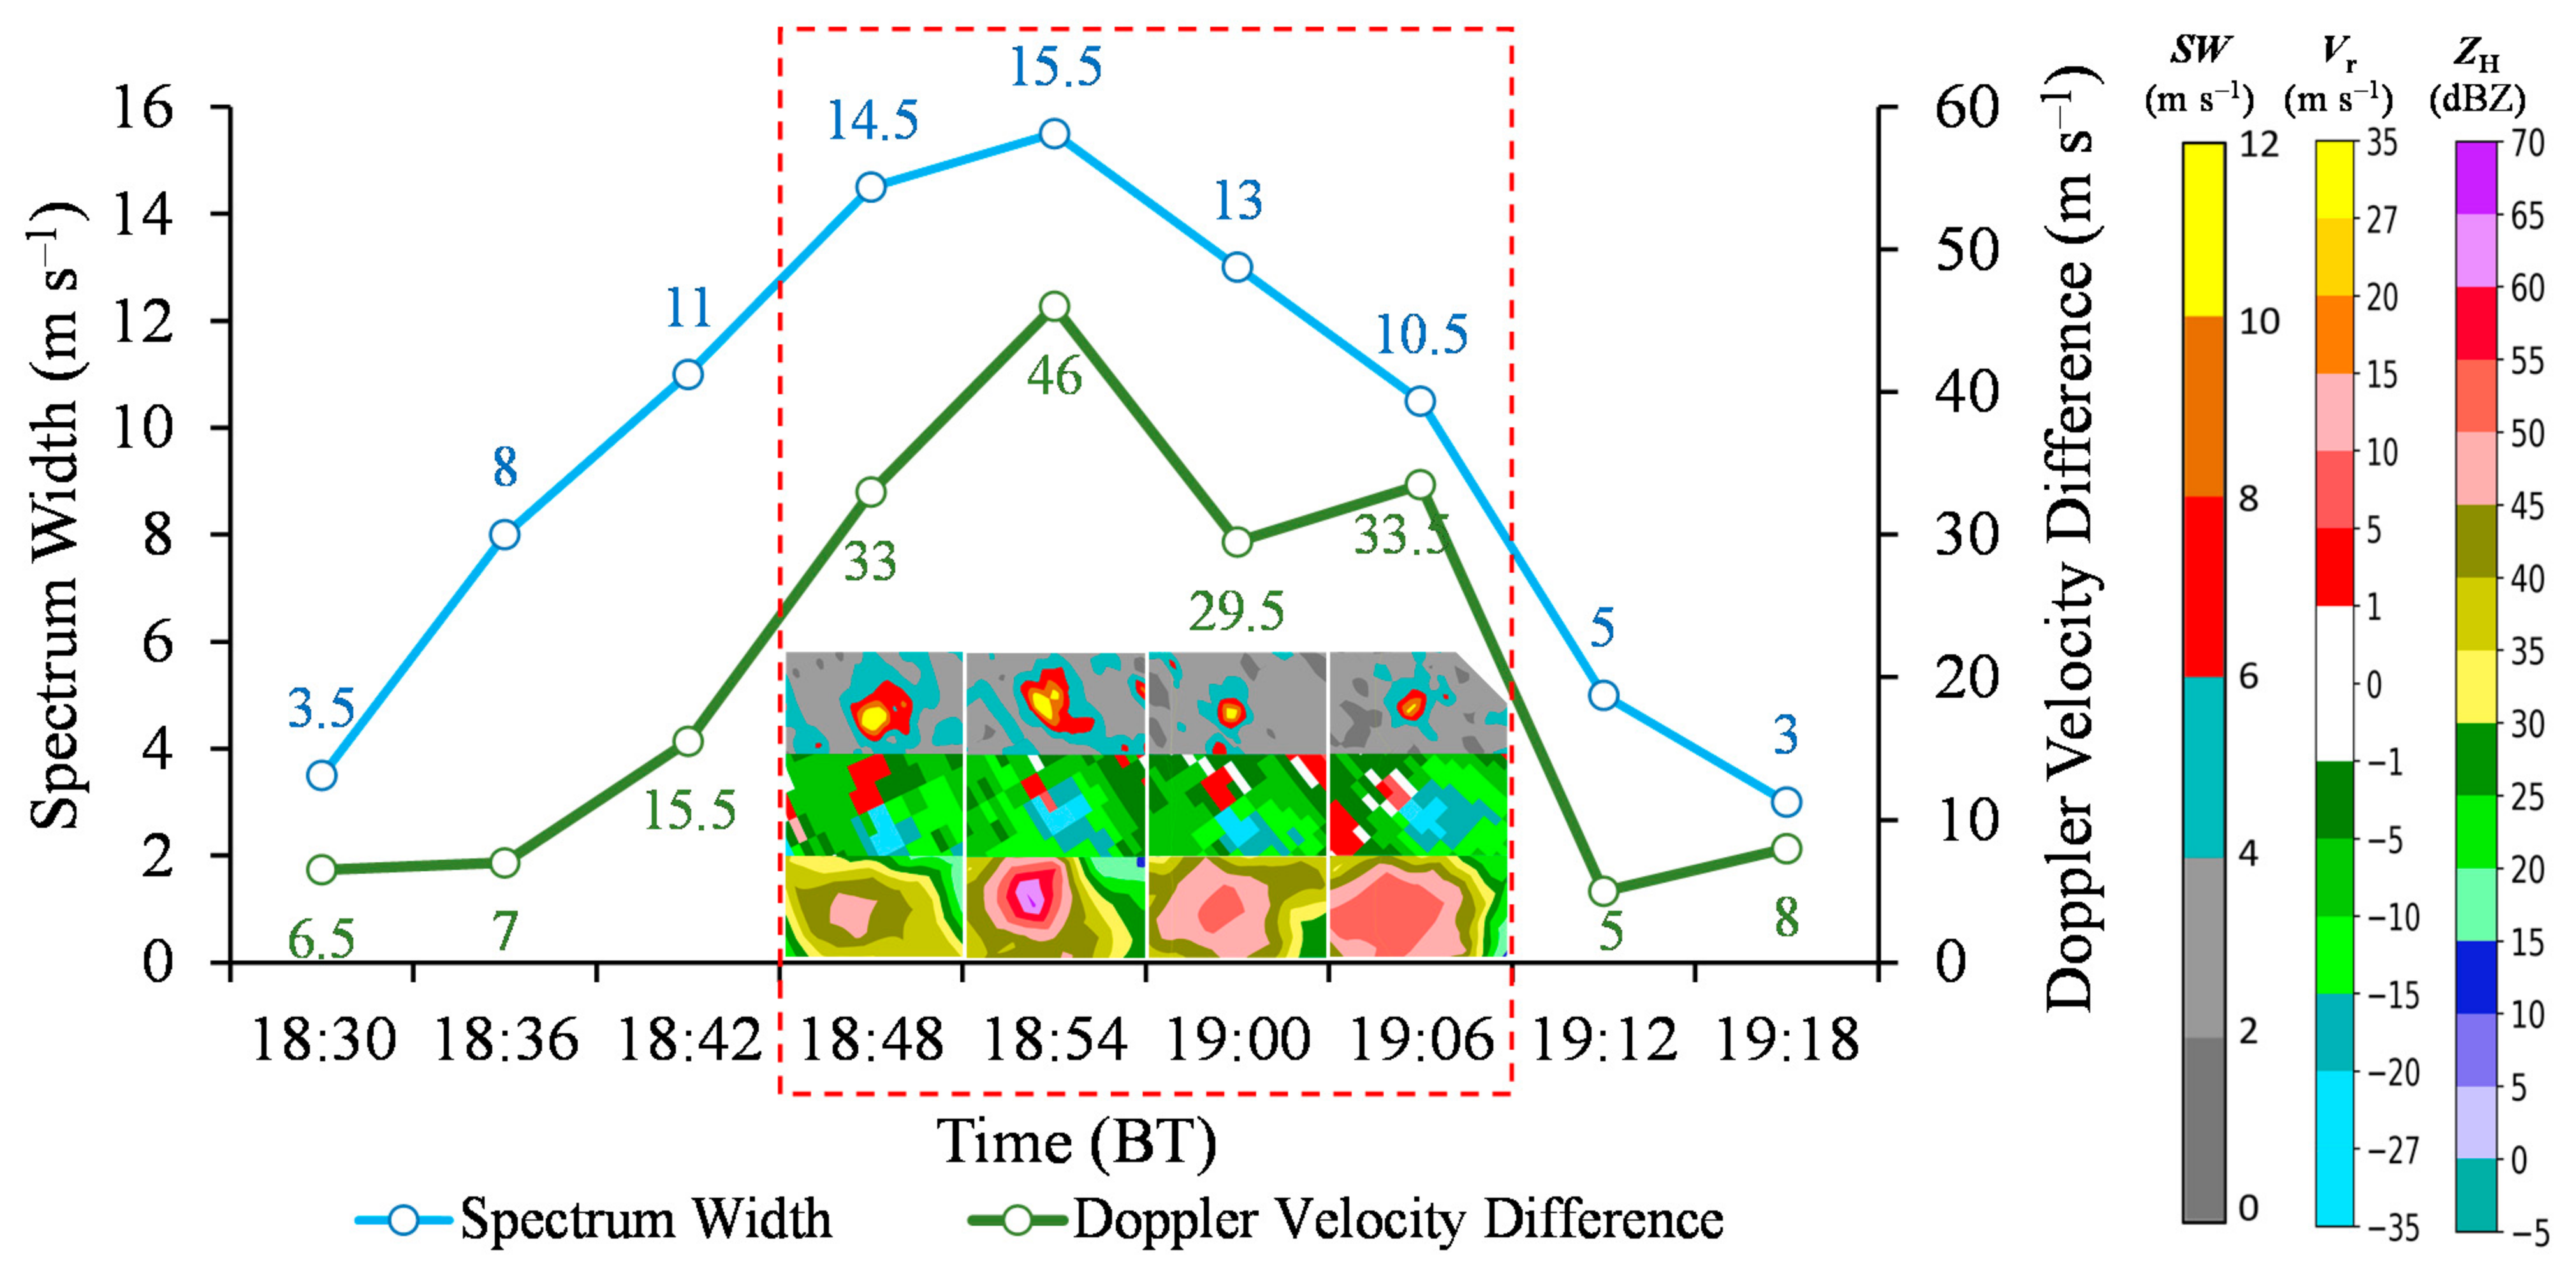
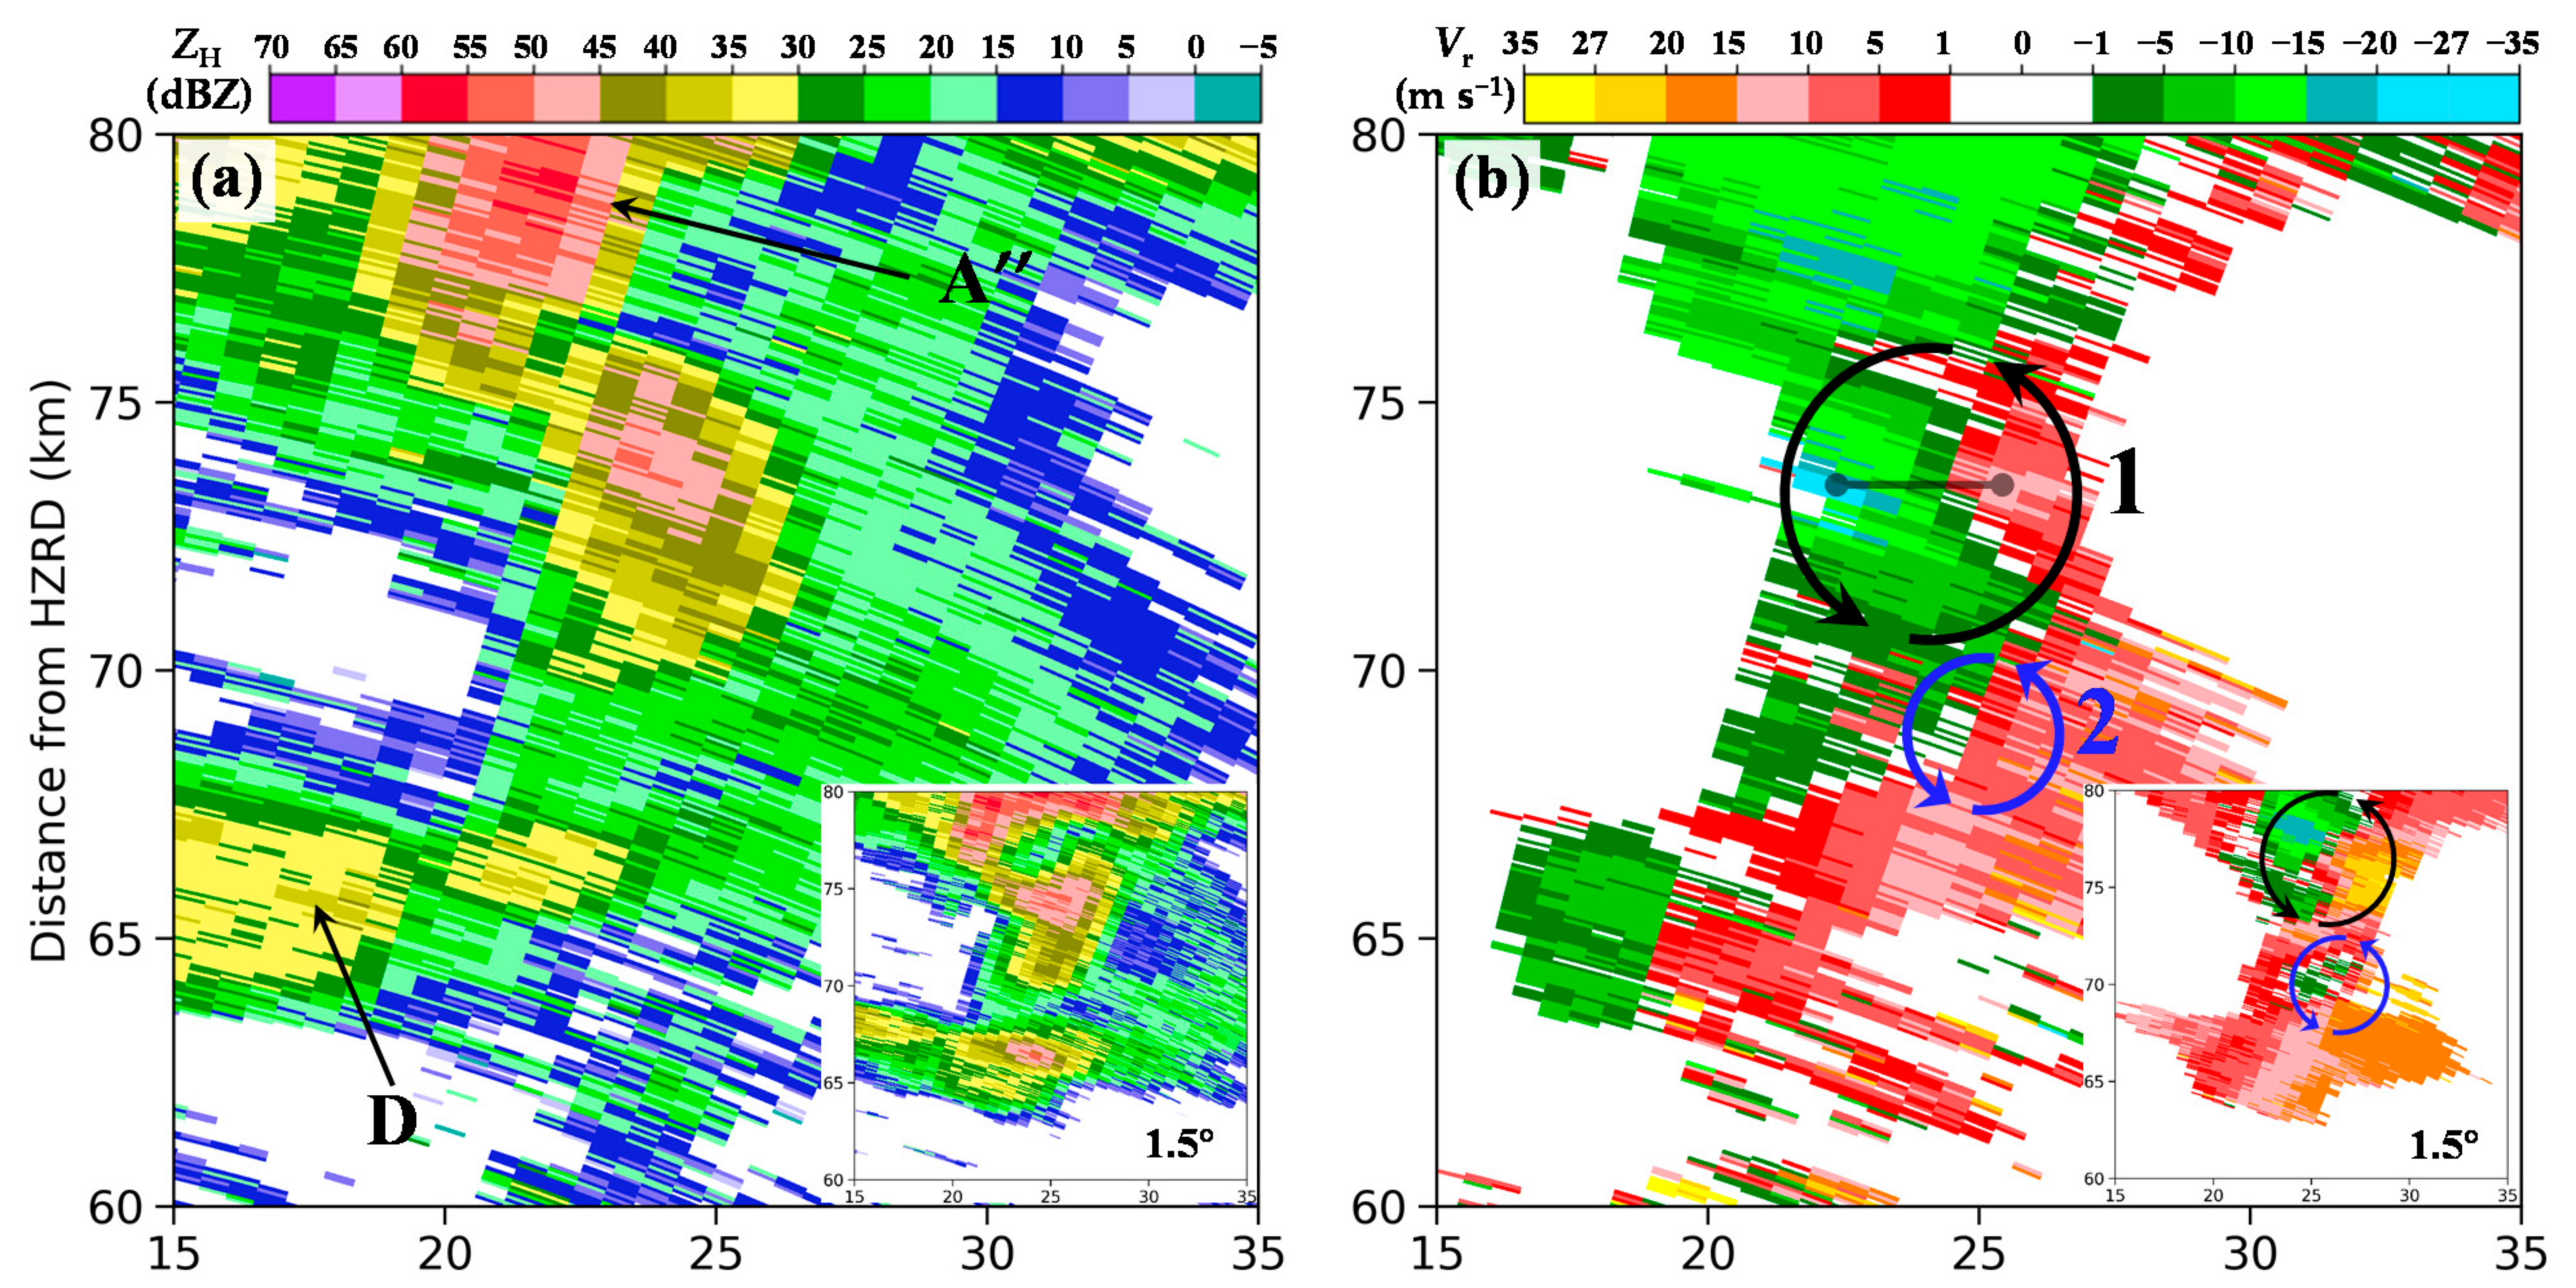
SW can reflect the variation in atmospheric turbulence, while turbulence can reflect the characteristics of abrupt changes in the temperature, humidity, and pressure of the atmosphere [59]. Figure 10 shows the evolution of the maximum SW and the Vr difference in the mesocyclonic region of the supercell at an elevation of 0.5°, between 1830 and 1918 BT. At 1830 BT (i.e., 18 min before tornadogenesis), the maximum ZH near the mesocyclone of the supercell was only approximately 26 dBZ, corresponding to a SW of 3.5 m s−1. The intensification of the supercell between 1836 and 1842 BT led to an increase in the SW from 8 to 11 m s−1. The velocity diagram (not shown) shows a notable mesocyclone but no TVS. At 1848 BT, when the tornado formed, the large-SW (>10 m s−1) region suddenly expanded, and the maximum SW increased to 14.5 m s−1. In addition, the location of the large-SW region was consistent with that of the TVS and the apex of the hook echo. The rotational velocity (i.e., the difference between the positive and negative velocities) of the TVS was 33 m s−1. Using the method introduced by Wurman et al. [13] to estimate the vertical vorticity (i.e., twice the Doppler difference divided by the distance across the measured core flow region), the calculated vorticity at this time was 2.6 × 10⁻² s–1. At 1854 BT, the tornado matured. At this time, the maximum SW reached 15.5 m s−1, while the rotational radius of the TVS decreased and its rotational velocity increased to 46 m s−1. The corresponding vorticity reached 8.4 × 10⁻² s–1, and the ZH at this location reached 66 dBZ. During the tornado maintenance and weakening stage (i.e., between 1900 and 1906 BT), there was a gradual decrease in SW and in the size of the large-SW region. At 1900 BT, the rotational radius of the TVS was slightly larger than during the immediately preceding time, while its rotational velocity decreased to 29.5 m s−1. The corresponding vorticity and ZH were 3.4 × 10⁻² s–1 and 51.5 dBZ, respectively. At 1906 BT, the rotational radius of the TVS decreased, while its rotational velocity gradually increased to 33.5 m s−1. The vorticity increased to 5.1 × 10⁻² s–1, and the ZH at this location was 55 dBZ. The tornado dissipated between 1906 and 1912 BT, during which time the large-SW region disappeared, and the maximum spectrum width decreased to 5 m s−1.
The above analysis shows that SW is indicative of tornadogenesis in this case study. (1) A large-SW region appeared 6 min earlier than the tornado. The appearance of a large-SW region can be treated as a precursor of tornadogenesis. (2) During the tornadogenesis and tornado development stages, an increase in SW indicates an increase in the intensity of the tornado. During the tornado maintenance stage, a decrease in SW indicates a decrease in the intensity of the tornado.
5. Dual-Polarization Signatures of the Supercell Tornado
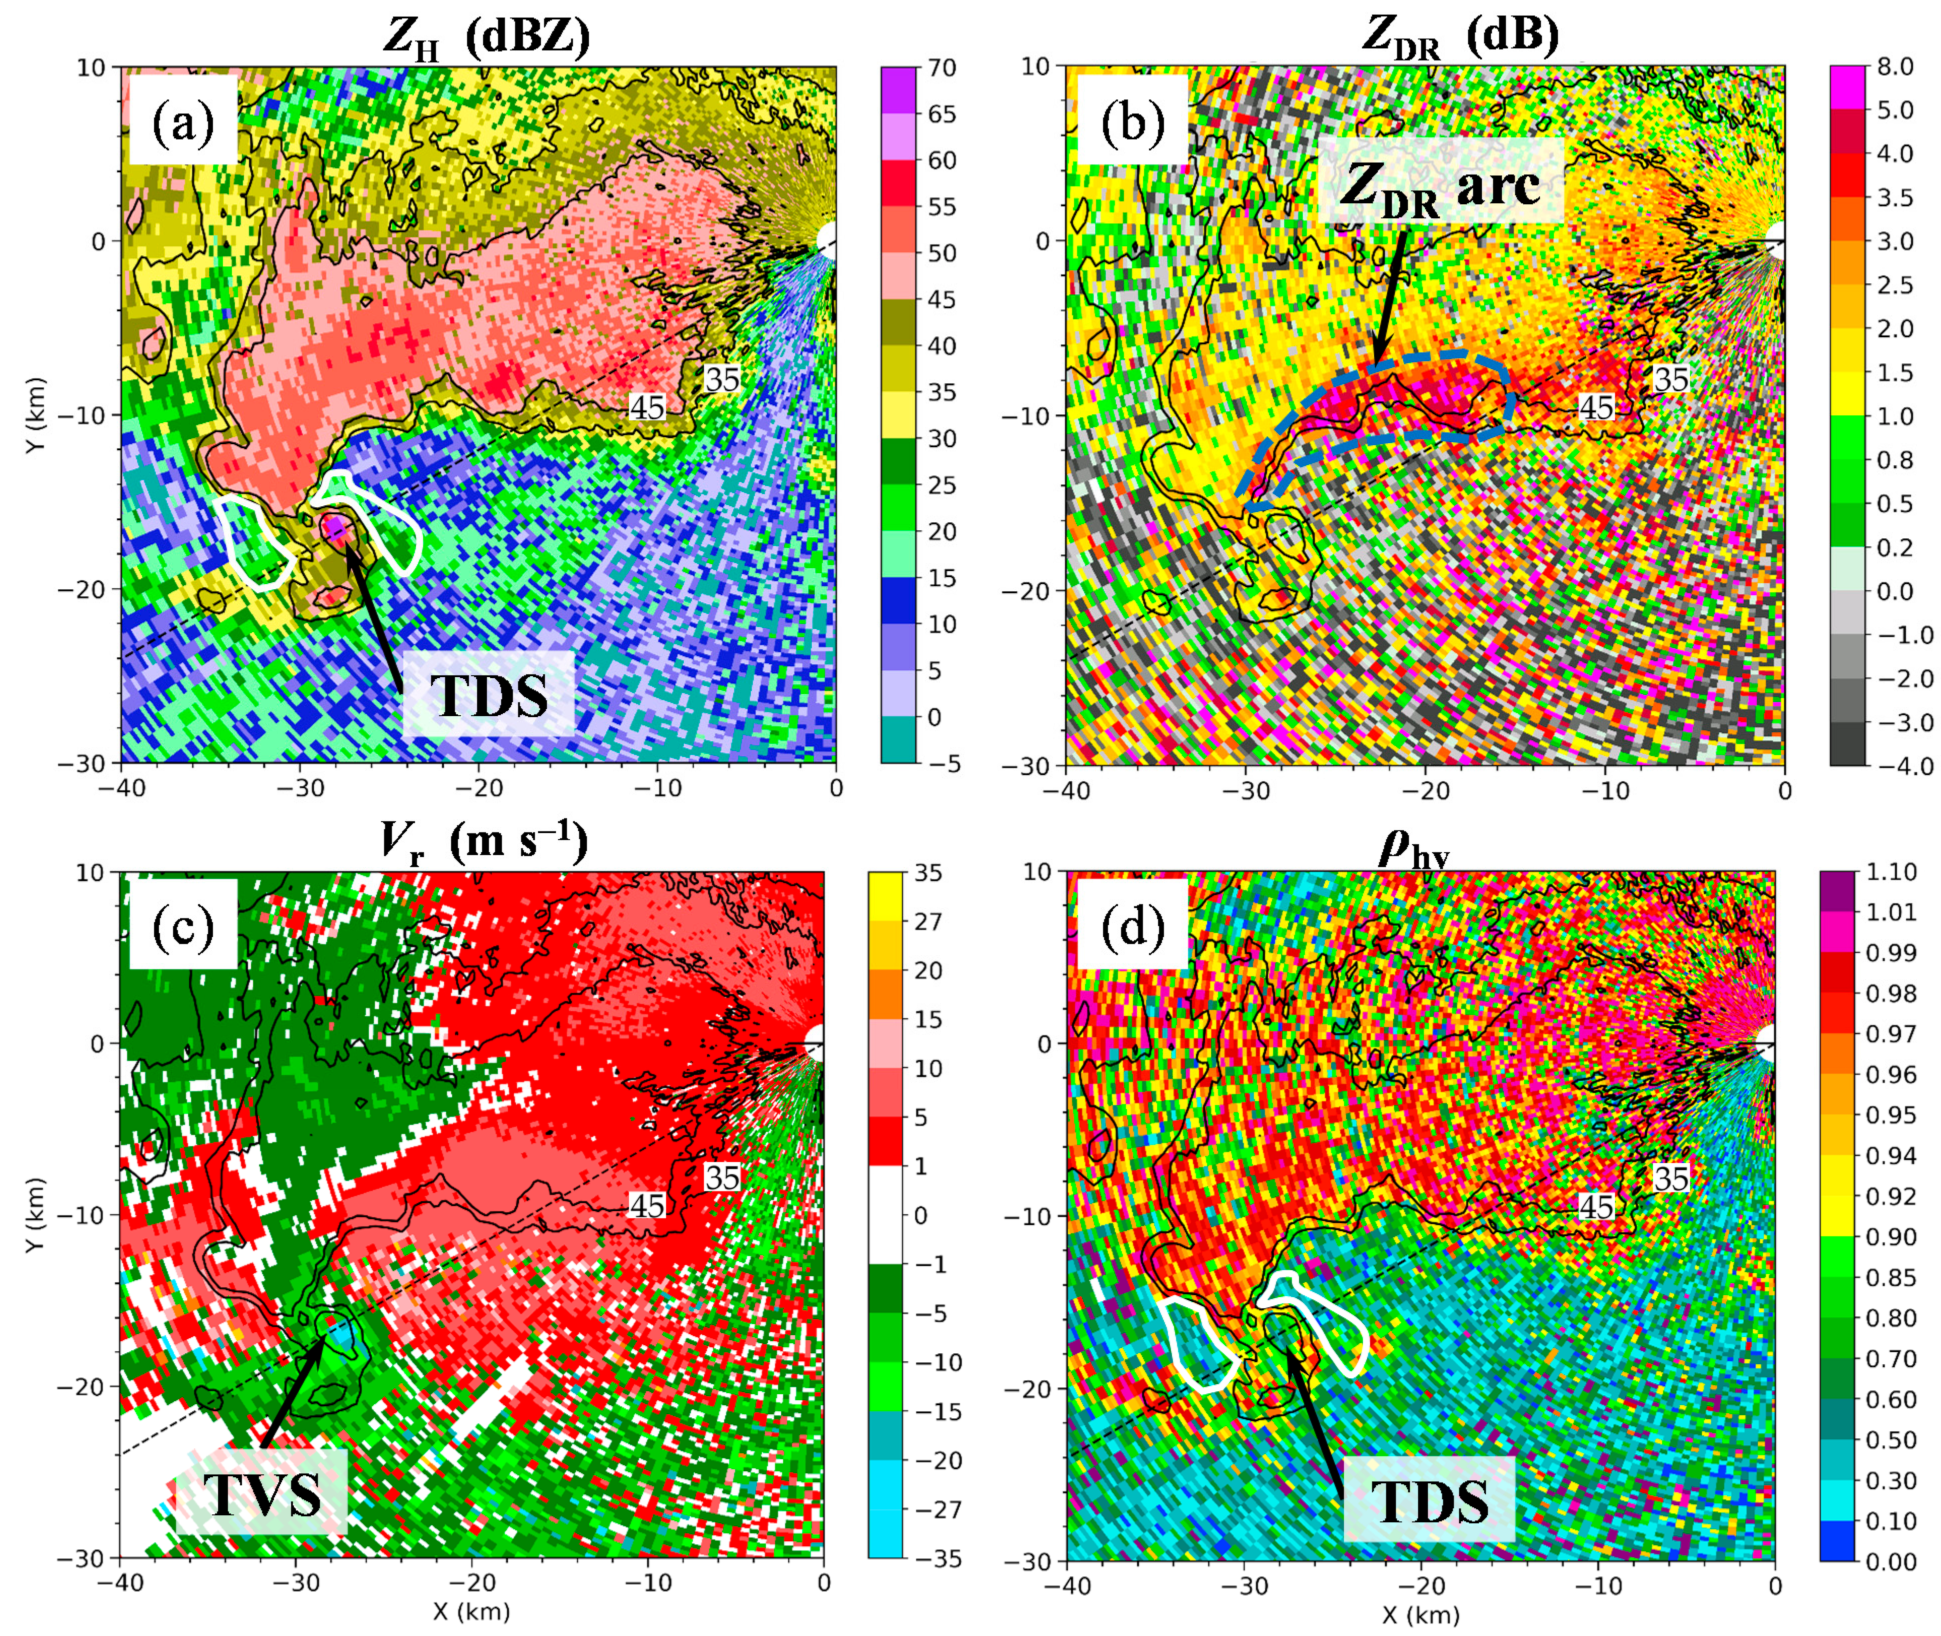
Based on the stages of the life cycle of a tornado defined by Kessler [60], the life of the tornado examined in this study is divided into three stages, namely, the development stage, the mature stage, and the weakening stage. The QPRD data were used to analyze the dual-polarization signatures during the mature stage of the tornado in more detail. At 1854 BT, the tornado was located within Shengze Township, Suzhou, approximately 32 km from the Qingpu radar station. Figure 11 shows the PPI scans of ZH, ZDR, Vr, and ρhv at an elevation of 0.5° at 1854 BT. Despite the significant effects of ground clutter on echoes at the low elevation, a notable hook echo and a marked ZDR arc are visible in the PPI scans of ZH and ZDR, respectively, which can be primarily ascribed to size sorting [61]. The very short distance between the tornado and the QPRD at this time led to a clear TVS in the PPI scan of Vr. The maximum rotational velocity near the TVS was calculated to be 23 m s−1, suggesting the presence of a strong mesocyclone [62]. Moreover, a notable TDS, characterized by ZH values exceeding 65 dBZ and considerably reduced corresponding ZDR (–2–0 dB) and ρhv (0.3–0.8) values, can also be observed at X = –29 to –27 km and Y = –18 to –16 km, suggesting that the strong updraft lofted surface debris (e.g., grass, leaves, and scrap metal) into the air and that the surface debris and hydrometeors coexisted within the sampling volume of the radar. Furthermore, an inflow signature [27] (i.e., very low ZH (<20 dBZ) and ρhv (<0.8)) can be observed in the inflow and updraft regions (as indicated by the closed solid white lines), suggesting no-nmeteorological echoes within these regions, which may be attributed to the lofting of light debris (e.g., grass and tree leaves) and turbulent flow into the vertical airflow of the storm by the near-surface strong winds. The mechanism of formation of an inflow signature is similar to that of a TDS [61] (p. 292).
6. Discussion
After the first merger, supercell A’ encountered and merged with cell C near its hook structure between 1812 and 1818 BT (Figure 12a). The analysis of the retrieved 1.5 km wind field at 1824 BT (Figure 12b) reveals that ZH in the merger region increased from 45–50 dBZ (at 1818 BT) to 50–55 dBZ (at 1824 BT), that the vertical vorticity near the hook increased from 1.0 × 10⁻² to 1.4 × 10⁻² s–1, and that the inflow in front of the hook also intensified to some extent (Figure 12b). At 1836 BT (12 min before tornadogenesis), cell D gradually approached supercell A” from its south side (Figure 12c). They began to merge with one another at 1842 BT (Figure 12d). This merger process, similar to the previous processes, increased the vertical vorticity near the hook from 1.8 × 10⁻² (at 1836 BT) to 2.0 × 10⁻² s–1 (at 1842 BT), increased the ZH at the center of vorticity, and strengthened the RFD to some extent. The temperatures at the AWSs in the path of the tornado were reduced by 2–3 °C, suggesting a moderate cold-pool intensity, which was favorable to the maintenance of a relative balance between the front-flank wet and humid inflow and the RFD [54,63]. A comprehensive analysis of the latter two merger processes clearly indicates that they both occurred near the vortex area of the hook echo of the supercell and that each merger increased the ZH and vertical vorticity and intensified the front-flank inflows and RFD.
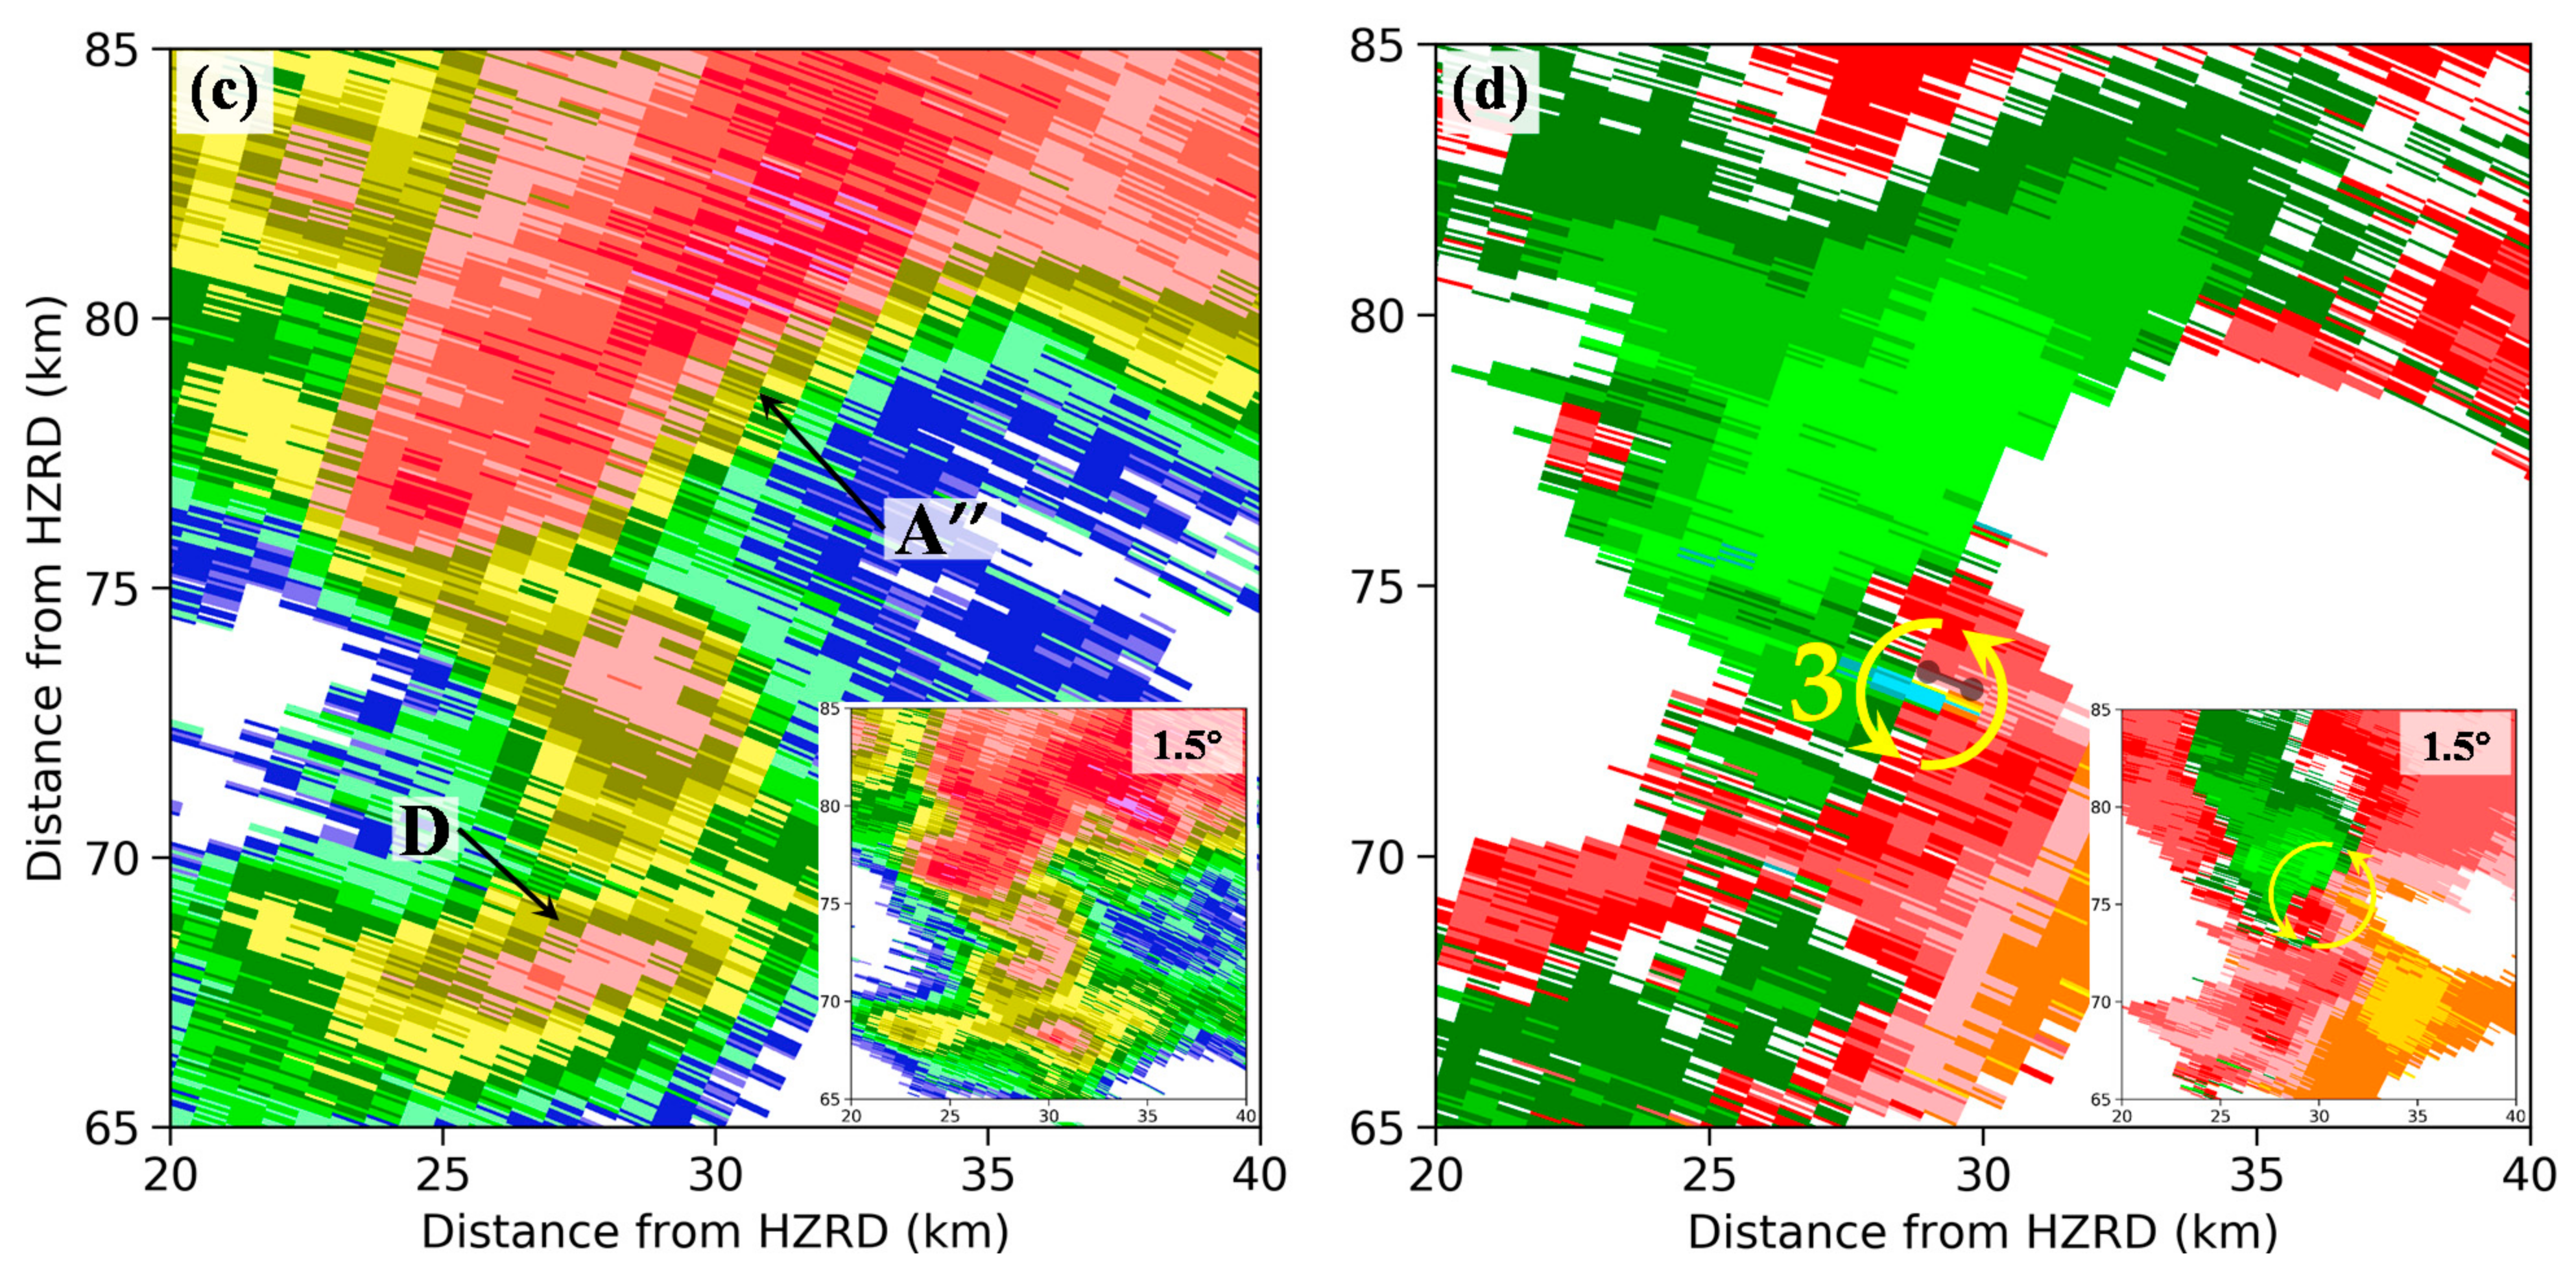
Figure 13 shows the ZH and Vr evolution of supercell A” and cell D before and during the tornado. At 1845 BT, during the supercell A” and cell D merging process (Figure 13a), vortex 1 of supercell A” (circled in black) and vortex 2 on the north side of cell D (circled in blue) can be observed from the Vr (Figure 13b). The distance between the positive and negative velocity pairs of vortex 1 (i.e., diameter of vortex, as indicated by the black line segment in Figure 13b) was about 3.2 km. At 1850 BT, vortex 1 and vortex 2 merged, forming a stronger vortex 3 (as indicated by the yellow circle in Figure 13d), resulting in a rapid intensification of ZH (Figure 13c), an increase in the rotation velocity and a decrease in the rotation radius (Figure 13d). According to the angular momentum conservation and centrifugal instability principle [54], when the rotational speed increases, the radius of rotation decreases. Therefore, the increase in rotational speed caused by the merger of storm cells reduce the radius of vortex, which is a favorable condition for tornadogenesis. The theoretical result is consistent with the observation result of the radar Doppler radial velocity (as indicated by the black line segment in Figure 13d). The aforementioned inflow near the ground and the convergence of outflows increase the low-level vortices, which are advected upward and stretched. In addition, vortices merge may stretch vorticity to tornadic strength [54,64], which appears to be the catalyst for tornadogenesis production. Furthermore, between 1700 and 1800 BT, before the passage of the supercell through the study area, the 0–3 km storm-relative helicity (calculated based on SZWPR data) exceeded 200 m2 s–2, and notable upper- and lower-level jet streams were present (Figure 3), which also provided a favorable environment associated with forcing and deep-layer shear for tornadogenesis [51]. In this case study, an increase in SW at low-levels is associated with tornadogenesis, which is also associated with low-level convergence and possible spin-up of vorticity through stretching [65].
However, the results of storm mergers differ from one another. Due to the limitations of the temporal resolution of current China operational radar observations, we need to further understand the formation mechanism of this tornado process. In future studies, high-temporal resolution polarimetric radar and multisource high-spatiotemporal-resolution data are needed to clarify the mechanisms responsible for the deep connection between the multiple storm merger processes and tornadogenesis.
7. Conclusions
In this study, multisource observation data are used to analyze the evolution of supercell A, which formed and developed over the northwestern corner of Changxing County, Huzhou, merged and interacted with three storm cells after passing over Lake Taihu and eventually intensified to form a supercell tornado. The main conclusions of this study are summarized below.
- The extremely cold tropopause temperatures and high surface temperatures produced a high temperature gradient along the vertical profile. The updraft by upper divergence and vertical thermal instability in the atmosphere over Suzhou collectively promoted the formation and development of convection. In addition, the low LCL and strong lower-level (0–1 km) vertical wind shear provided propitious conditions for tornadogenesis.
- In this case, based on the analysis of the mergers and interactive mechanisms of convective storms, a schematic is developed to describe the mergers of storm cells of this type. Each of the three storm-cell mergers were associated with an increase in the echo intensity, vertical ascending velocity, and vertical vorticity of the storm cell. During the last merger, the merging of the two vortices resulted in the reduction in the rotation radius of the new vortex, which also provided a favorable condition for tornadogenesis. The characteristics of SW were indicative of the formation and evolution of the tornado.
- The dual-polarization signatures at the mature stage of the tornado are analyzed. A notable TDS and ZDR arc can be observed in the PPI scans, while a distinct TVS is visible in the PPI scan of Vr. In addition, an inflow signature is present.
Author Contributions
Conceptualization, B.W.; methodology, B.W. and Y.L.; data curation, Y.L.; formal analysis, B.W.; supervision, M.W.; validation, M.W.; visualization, B.W. and Y.L.; writing—original draft, B.W.; writing—review and editing, M.W. All authors have read and agreed to the published version of the manuscript.
Funding
This research was funded by the National Natural Science Foundation of China (Grant No. 41675029), the Postgraduate Research & Practice Innovation Program of Jiangsu Province (No. KYCX18_0998), the Science and Technology Program of Huzhou (No. 2021GZ14), the Meteorological Science and Technology Program of Zhejiang Province (No. 2021ZD27), and the Natural Science Foundation of Shandong Province (Nos. ZR2020MD052 and ZR2020MD053).
Institutional Review Board Statement
Not applicable.
Informed Consent Statement
Not applicable.
Data Availability Statement
ERA5 data are available at https://www.ecmwf.int/en/forecasts/datasets/reanalysis-datasets/era5 (accessed on 20 June 2021). Himawari-8 satellite data are available at https://www.eorc.jaxa.jp/ptree/?tdsourcetag=s_pcqq_aiomsg (accessed on 20 July 2021).
Conflicts of Interest
The authors declare no conflict of interest.
References
- Davies-Jones, R.; Trapp, R.J.; Bluestein, H.B. Tornadoes and Tornadic Storms. Meteorol. Monogr. 2001, 50, 167–222. [Google Scholar] [CrossRef]
- Johns, R.H.; Doswell, C.A. Severe Local Storms Forecasting. Weather Forecast. 1992, 7, 588–612. [Google Scholar] [CrossRef] [Green Version]
- Moller, A.R. Severe Local Storms Forecasting. Meteorol. Monogr. 2001, 28, 433–480. [Google Scholar] [CrossRef]
- Van Den Broeke, M.S. Polarimetric Radar Metrics Related to Tornado Life Cycles and Intensity in Supercell Storms. Mon. Weather Rev. 2017, 145, 3671–3686. [Google Scholar] [CrossRef]
- Lemon, L.R.; Doswell, C.A. Severe Thunderstorm Evolution and Mesocyclone Structure as Related to Tornadogenesis. Mon. Weather Rev. 1979, 107, 1184–1197. [Google Scholar] [CrossRef]
- Carbone, R.E.; Carpenter, M.J.; Burghart, C.D. Doppler Radar Sampling Limitations in Convective Storms. J. Atmos. Oceanic Technol. 1985, 2, 357–361. [Google Scholar] [CrossRef] [Green Version]
- Bluestein, H.B.; Weiss, C.C.; Pazmany, A.L. Mobile Doppler Radar Observations of a Tornado in a Supercell near Bassett, Nebraska, on 5 June 1999. Part I: Tornadogenesis. Mon. Weather Rev. 2003, 131, 2954–2967. [Google Scholar] [CrossRef]
- Trapp, R.J.; Mitchell, E.D.; Tipton, G.A.; Effertz, D.W.; Watson, A.I.; Andra, D.L.; Magsig, M.A. Descending and nondescending tornadic vortex signatures detected by WSR-88Ds. Weather Forecast. 1999, 14, 625–639. [Google Scholar] [CrossRef]
- Markowski, P.M.; Straka, J.M.; Rasmussen, E.N. Direct surface thermodynamic observations within the rear-flank downdrafts of nontornadic and tornadic supercells. Mon. Weather Rev. 2002, 130, 1692–1721. [Google Scholar] [CrossRef]
- Michael, M.F.; Bluestein, H.B.; Dowell, D.C.; Wicker, L.J.; Kramar, M.R.; Pazmany, A.L. High-Resolution, Mobile Doppler Radar Observations of Cyclic Mesocyclogenesis in a Supercell. Mon. Weather Rev. 2008, 136, 4997–5016. [Google Scholar] [CrossRef] [Green Version]
- Tanamachi, R.L.; Heinselman, P.L.; Wicker, L.J. Impacts of a Storm Merger on the 24 May 2011 El Reno, Oklahoma, Tornadic Supercell. Weather Forecast. 2015, 30, 501–524. [Google Scholar] [CrossRef]
- Tanamachi, R.L.; Heinselman, P.L. Rapid-Scan, Polarimetric Observations of Central Oklahoma Severe Storms on 31 May 2013. Weather Forecast. 2016, 31, 19–42. [Google Scholar] [CrossRef]
- Wurman, J.; Richardson, Y.; Alexander, C.; Weygandt, S.; Zhang, P.F. Dual-Doppler and Single-Doppler Analysis of a Tornadic Storm Undergoing Mergers and Repeated Tornadogenesis. Mon. Weather Rev. 2007, 135, 736–758. [Google Scholar] [CrossRef]
- Kurdzo, J.M.; Bodine, D.J.; Cheong, B.L.; Palmer, R.D. High-Temporal Resolution Polarimetric X-Band Doppler Radar Observations of the 20 May 2013 Moore, Oklahoma, Tornado. Mon. Weather Rev. 2015, 143, 2711–2735. [Google Scholar] [CrossRef] [Green Version]
- Li, Z.C.; Zhu, J.J.; Zhang, C.A.; Sun, J.; Wang, Y. Analysis of Dual Polarization Radar Detection of Tornado Typhoon Rainband in Danzhou and Tunchang in Hainan Province. Meteor. Mon. 2021, 47, 1086–1098. (In Chinese) [Google Scholar] [CrossRef]
- Zhu, J.S.; Liu, J.; Bian, Z.; Fu, C.J. Analysis of cell merger and vortex signature during generation of tornado in Anhui based on Doppler radar observation. Meteor. Mon. 2015, 41, 182–191. (In Chinese) [Google Scholar] [CrossRef]
- Lee, B.D.; Jewett, B.F.; Wilhelmson, R.B. The 19 April 1996 Illinois Tornado Outbreak. Part I: Cell Evolution and Supercell Isolation. Weather Forecast. 2006, 21, 433–448. [Google Scholar] [CrossRef]
- Lee, B.D.; Jewett, B.F.; Wilhelmson, R.B. The 19 April 1996 Illinois Tornado Outbreak. Part II: Cell Mergers and Associated Tornado Incidence. Weather Forecast. 2006, 21, 449–464. [Google Scholar] [CrossRef]
- Lindsey, D.T.; Bunkers, M.J. Observations of a Severe, Left-Moving Supercell on 4 May 2003. Weather Forecast. 2005, 20, 15–22. [Google Scholar] [CrossRef] [Green Version]
- Van Den Broeke, M. Polarimetric Radar Characteristics of Tornadogenesis Failure in Supercell Thunderstorms. Atmosphere 2021, 12, 581. [Google Scholar] [CrossRef]
- Westcott, N.E.; Kennedy, P.C. Cell Development and Merger in an Illinois Thunderstorm Observed by Doppler Radar. J. Atmos. Sci. 1989, 46, 117–131. [Google Scholar] [CrossRef] [Green Version]
- Simpson, J. Downdrafts as Linkages in Dynamic Cumulus Seeding Effects. J. Appl. Meteorol. Climatol. 1980, 19, 477–487. [Google Scholar] [CrossRef] [Green Version]
- Tao, W.-K.; Simpson, J. Cloud Interactions and Merging: Numerical Simulations. J. Atmos. Sci. 1984, 41, 2901–2917. [Google Scholar] [CrossRef] [Green Version]
- Wang, X.M.; Yu, X.D. A study on the physical process involved in the genesis of a severe tropical tornado. Acta Meteorol. Sin. 2019, 77, 387–404. (In Chinese) [Google Scholar] [CrossRef]
- Bluestein, H.B.; Parker, S.S. Modes of Isolated, Severe Convective Storm Formation along the Dryline. Mon. Weather Rev. 1993, 121, 1354–1372. [Google Scholar] [CrossRef] [Green Version]
- Bringi, V.N.; Chandrasekar, V. Polarimetric Doppler Weather Radar: Principles and Applications; Cambridge University Press: Cambridge, UK, 2001. [Google Scholar]
- Kumjian, M.R.; Ryzhkov, A.V. Polarimetric signatures in supercell thunderstorms. J. Appl. Meteorol. Climatol. 2008, 47, 1940–1961. [Google Scholar] [CrossRef]
- Dawson, D.T.; Mansell, E.R.; Jung, Y.; Wicker, L.J.; Kumjian, M.R.; Xue, M. Low-Level ZDR Signatures in Supercell Forward Flanks: The Role of Size Sorting and Melting of Hail. J. Atmos. Sci. 2014, 71, 276–299. [Google Scholar] [CrossRef]
- French, M.M.; Burgess, D.W.; Mansell, E.R.; Wicker, L.J. Bulk Hook Echo Raindrop Sizes Retrieved Using Mobile, Polarimetric Doppler Radar Observations. J. Appl. Meteorol. Climatol. 2015, 54, 423–450. [Google Scholar] [CrossRef]
- Snyder, J.C.; Bluestein, H.B.; Venkatesh, V.; Frasier, S.J. Observations of Polarimetric Signatures in Supercells by an X-Band Mobile Doppler Radar. Mon. Weather Rev. 2013, 141, 3–29. [Google Scholar] [CrossRef]
- Griffin, C.B.; Bodine, D.J.; Palmer, R. Polarimetric Radar Observations of Simultaneous Tornadoes on 10 May 2010 near Norman, Oklahoma. Mon. Weather Rev. 2020, 148, 477–497. [Google Scholar] [CrossRef]
- Ryzhkov, A.V.; Schuur, T.J.; Burgess, D.W.; Zrnic, D.S. Polarimetric Tornado Detection. J. Appl. Meteorol. 2005, 44, 557–570. [Google Scholar] [CrossRef]
- Dawson, D.T.; Mansell, E.R.; Kumjian, M.R. Does Wind Shear Cause Hydrometeor Size Sorting? J. Atmos. Sci. 2015, 72, 340–348. [Google Scholar] [CrossRef]
- Crowe, C.C.; Schultz, C.J.; Kumjian, M.R.; Carey, L.D.; Petersen, W.A. Use of dual-polarization signatures in diagnosing tornadic potential. Electron. J. Oper. Meteorol. 2012, 13, 57–78. [Google Scholar]
- Palmer, R.D.; Bodine, D.; Kumjian, M.; Cheong, B.; Wang, Y. Observations of the 10 may 2010 tornado outbreak using OU-PRIME: Potential for new science with high-resolution polarimetric radar. Bull. Am. Meteorol. Soc. 2011, 92, 871–891. [Google Scholar] [CrossRef] [Green Version]
- Kumjian, M.R.; Ryzhkov, A.V.; Melnikov, V.M.; Schuur, T.J. Rapid-Scan Super-Resolution Observations of a Cyclic Supercell with a Dual-Polarization WSR-88D. Mon. Weather Rev. 2010, 138, 3762–3786. [Google Scholar] [CrossRef]
- Kumjian, M.R.; Khain, A.P.; Benmoshe, N.; Ilotoviz, E.; Ryzhkov, A.V.; Phillips, V.T.J. The Anatomy and Physics of ZDR Columns: Investigating a Polarimetric Radar Signature with a Spectral Bin Microphysical Model. J. Appl. Meteorol. Climatol. 2014, 53, 1820–1843. [Google Scholar] [CrossRef]
- Wilson, M.B.; Van Den Broeke, M.S. An Automated Python Algorithm to Quantify ZDR Arc and KDP–ZDR Separation Signatures in Supercells. J. Atmos. Ocean. Technol. 2021, 38, 371–386. [Google Scholar] [CrossRef]
- Van Den Broeke, M.S. Polarimetric Variability of Classic Supercell Storms as a Function of Environment. J. Appl. Meteorol. Climatol. 2016, 55, 1907–1925. [Google Scholar] [CrossRef]
- Loeffler, S.D.; Kumjian, M.R. Quantifying the Separation of Enhanced ZDR and KDP Regions in Nonsupercell Tornadic Storms. Weather Forecast. 2018, 33, 1143–1157. [Google Scholar] [CrossRef]
- Hersbach, H.; Bell, B.; Berrisford, P.; Biavati, G.; Horányi, A.; Muñoz Sabater, J.; Nicolas, J.; Peubey, C.; Radu, R.; Rozum, I.; et al. ERA5 Hourly Data on Single Levels from 1979 to Present; Copernicus Climate Change Service (C3S) Climate Data Store (CDS): Reading, UK, 2018. [Google Scholar] [CrossRef]
- Zhang, J.; Wang, S.X. An automated 2D multipass Doppler radar velocity dealiasing scheme. J. Atmos. Ocean. Technol. 2006, 23, 1239–1248. [Google Scholar] [CrossRef]
- Shapiro, A.; Potvin, C.K.; Gao, J. Use of a Vertical Vorticity Equation in Variational Dual-Doppler Wind Analysis. J. Atmos. Ocean. Technol. 2008, 26, 2089–2106. [Google Scholar] [CrossRef]
- Potvin, C.K.; Shapiro, A.; Xue, M. Impact of a Vertical Vorticity Constraint in Variational Dual-Doppler Wind Analysis: Tests with Real and Simulated Supercell Data. J. Atmos. Ocean. Technol. 2011, 29, 32–49. [Google Scholar] [CrossRef]
- Protat, A.; Zawadzki, I. A Variational Method for Real-Time Retrieval of Three-Dimensional Wind Field from Multiple-Doppler Bistatic Radar Network Data. J. Atmos. Ocean. Technol. 1999, 16, 432–449. [Google Scholar] [CrossRef]
- Potvin, C.K.; Betten, D.; Wicker, L.J.; Elmore, K.L.; Biggerstaff, M.I. 3DVAR versus Traditional Dual-Doppler Wind Retrievals of a Simulated Supercell Thunderstorm. Mon. Weather Rev. 2012, 140, 3487–3494. [Google Scholar] [CrossRef]
- Potvin, C.K.; Wicker, L.J.; Shapiro, A. Assessing Errors in Variational Dual-Doppler Wind Syntheses of Supercell Thunderstorms Observed by Storm-Scale Mobile Radars. J. Atmos. Ocean. Technol. 2012, 29, 1009–1025. [Google Scholar] [CrossRef]
- Shapiro, A.; Willingham, K.M.; Potvin, C.K. Spatially Variable Advection Correction of Radar Data. Part I: Theoretical Considerations. J. Atmos. Sci. 2010, 67, 3445–3456. [Google Scholar] [CrossRef] [Green Version]
- Shapiro, A.; Willingham, K.M.; Potvin, C.K. Spatially Variable Advection Correction of Radar Data. Part II: Test Results. J. Atmos. Sci. 2010, 67, 3457–3470. [Google Scholar] [CrossRef] [Green Version]
- Craven, J.P.; Brooks, H.E.; Hart, J.A.; Thunder, N. Baseline climatology of sounding derived parameters associated with deep, moist convection. Natl. Wea. Dig. 2004, 28, 13–24. [Google Scholar]
- Thompson, R.L.; Edwards, R.; Hart, J.A.; Elmore, K.L.; Markowski, P. Close Proximity Soundings within Supercell Environments Obtained from the Rapid Update Cycle. Weather Forecast. 2003, 18, 1243. [Google Scholar] [CrossRef] [Green Version]
- OuYang, S.C.; McNeil, D.; Lin, Y. Entering Irregularity; Meteorological Press: Beijing, China, 2002; pp. 219–221. [Google Scholar]
- Bernoulli, D.; Bernoulli, J. Hydrodynamica: Danielis Bernoulli, Hydrodynamica siva de viribus et motibus fluidorum comment arii (1738). Ned. Tijdschr. Voor Nat. 2016, 82, 218–220. [Google Scholar]
- Markowski, P.; Richardson, Y. Mesoscale Meteorology in Midlatitudes; Wiley-Blackwell: West Sussex, UK, 2010; pp. 48–49. [Google Scholar] [CrossRef]
- Fierro, A.O.; Gilmore, M.S.; Mansell, E.R.; Wicker, L.J.; Straka, J.M. Electrification and Lightning in an Idealized Boundary-Crossing Supercell Simulation of 2 June 1995. Mon. Weather Rev. 2006, 134, 3149–3172. [Google Scholar] [CrossRef] [Green Version]
- Lee, B.D.; Finley, C.A.; Karstens, C.D. The Bowdle, South Dakota, Cyclic Tornadic Supercell of 22 May 2010: Surface Analysis of Rear-Flank Downdraft Evolution and Multiple Internal Surges. Mon. Weather Rev. 2012, 140, 3419–3441. [Google Scholar] [CrossRef]
- Hubbert, J.C.; Bringi, V.N. The Effects of Three-Body Scattering on Differential Reflectivity Signatures. J. Atmos. Ocean. Technol. 2000, 17, 51–61. [Google Scholar] [CrossRef] [Green Version]
- Picca, J.; Ryzhkov, A. A Dual-Wavelength Polarimetric Analysis of the 16 May 2010 Oklahoma City Extreme Hailstorm. Mon. Weather Rev. 2012, 140, 1385–1403. [Google Scholar] [CrossRef] [Green Version]
- Wang, B.Y.; Wei, M.; Fan, G.Z.; Du, A.J. The evolution and Mechanism of Tornadic Supercells in the Outer Rainbands of Strong Typhoon Mujigae (1522). Part I: Spectrum width and mesocyclone speed. J. Trop. Meteorol. 2018, 34, 472–480. (In Chinese) [Google Scholar] [CrossRef]
- Kessler, E. Thunderstorm Morphology and Dynamics; University of Oklahoma Press: Norman, OK, USA, 1986. [Google Scholar]
- Ryzhkov, A.V.; Zrni´c, D. Radar Polarimetry for Weather Observations; Springer International Publishing: Cham, Switzerland, 2019; p. 292. [Google Scholar] [CrossRef]
- Lee, R.R.; White, A. Improvement of the WSR-88D Mesocyclone Algorithm. Weather Forecast. 1998, 13, 341–351. [Google Scholar] [CrossRef]
- Schultz, D.M.; Richardson, Y.P.; Markowski, P.M.; Doswell, C.A. Tornadoes in the Central United States and the “Clash of Air Masses”. Bull. Am. Meteorol. Soc. 2014, 95, 1704–1712. [Google Scholar] [CrossRef] [Green Version]
- Trapp, R.J.; Weisman, M.L. Low-Level Mesovortices within Squall Lines and Bow Echoes. Part II: Their Genesis and Implications. Mon. Weather Rev. 2003, 131, 2804–2823. [Google Scholar] [CrossRef] [Green Version]
- Wang, C.; Wei, M. Analysis of Formation Mechanism and Echo Evolution of Gaoyou Tornado on 12 June 2020 in Northern Jiangsu. J. Trop. Meteorol. 2021, 37, 812–823. (In Chinese) [Google Scholar] [CrossRef]
Figure 1.
(a) Map of China showing the domain for this study (blue box). (b) Locations of the observation instruments and stations. The dotted gray box indicates the wind-field retrieval area. The green and magenta stars indicate the positions of the HZRD and QPRD, respectively, which are 107 km apart. The magenta line connecting the two radar instruments represents their baseline. The areas within the two gray circles (excluding the overlap) represent the 30° dual-Doppler lobes for the two radar instruments. The solid black square indicates the location of the SZWPR. The solid black triangles indicate the locations of the sounding stations in Hangzhou, Baoshan, and Nanjing. The small solid gray dots indicate the positions of the regional automatic stations. The solid black dots and the solid black line connecting them indicate the path of the supercell. The solid red inverted triangles indicate the locations of the tornado. The map is colored based on the constant-altitude plan position indicator (CAPPI) scan of ZH at an altitude of 1 km from the QPRD at 1805 Beijing Time (BT).

Figure 2.
Disaster description in East China between 0800 BT on 14 May 2021, and 0800 BT on 15 May 2021. (a) Maximum wind speeds and (b) short-term heavy rainfalls at the automatic stations. (c) Photographs captured by eyewitnesses showing the hailstones that they collected. (d) Photographs of the tornado funnel. The red dashed circles in (a,b) represent the areas of primary influence of the supercell.

Figure 3.
Synoptic maps from ERA5 data for 2000 BT on 14 May 2021. (a) The wind fields (black barbs, unit: m s−1) and temperature (red contours, unit: °C) at 200 hPa. (b,c) The geopotential height (solid blue contours, unit: hPa), relative humidity (green shades, unit: %), and wind fields at 500- and 850-hPa, respectively.

Figure 4.
Himawari-8 geostationary satellite images for 1750 BT on 14 May 2021. (a) Visible light albedos (wavelength: 0.47 µm). (b) Infrared cloud-top brightness temperatures (wavelength: 13.3 µm).
Figure 4.
Himawari-8 geostationary satellite images for 1750 BT on 14 May 2021. (a) Visible light albedos (wavelength: 0.47 µm). (b) Infrared cloud-top brightness temperatures (wavelength: 13.3 µm).

Figure 5.
T–logP plots of the soundings taken at the (a) Nanjing, (b) Hangzhou, and (c) Baoshan stations at 2000 BT on 14 May 2021.
Figure 5.
T–logP plots of the soundings taken at the (a) Nanjing, (b) Hangzhou, and (c) Baoshan stations at 2000 BT on 14 May 2021.

Figure 6.
V–3θ plots for 14 May 2021. (a) Nanjing station at 0800 BT. (b) Baoshan station at 2000 BT. (c) Nanjing station at 2000 BT.
Figure 6.
V–3θ plots for 14 May 2021. (a) Nanjing station at 0800 BT. (b) Baoshan station at 2000 BT. (c) Nanjing station at 2000 BT.

Figure 7.
Scan at 0.5° elevation angle from the HZRD showing reflectivity (dBZ) at (a) 1804, (b) 1815, (c) 1825, and (d) 1850 BT, and Vr (m s−1) at (e) 1804, (f) 1815, (g) 1825, and (h) 1850 BT. The solid black lines indicate the 30-dBZ reflectivity contours.
Figure 7.
Scan at 0.5° elevation angle from the HZRD showing reflectivity (dBZ) at (a) 1804, (b) 1815, (c) 1825, and (d) 1850 BT, and Vr (m s−1) at (e) 1804, (f) 1815, (g) 1825, and (h) 1850 BT. The solid black lines indicate the 30-dBZ reflectivity contours.

Figure 8.
(a) AWS-measured pressures (unit: hPa) overlaid with the storm cell identification and tracking product of the HZRD (the solid gray circles indicate the centroid of cell B at different times; the arrows indicate the path of movement of cell B and CAPPI scan of the 30-dBZ ZH contours at a height of 1 km from the QPRD (1754 BT on 14 May 2021). (b) CAPPI of 1 km ZH overlaid with the horizontal wind field and vertical vorticity (1754 BT on 14 May 2021). (c) Schematic of cell merger in this case.

Figure 9.
CAPPI of the 1.5 km ZH (shaded colors) from the QPRD overlaid with horizontal wind field (black bars) and vertical vorticity (white isolines) data for (a) 1800, (c) 1806, and (e) 1812 BT on 14 May 2021. CAPPI scans of the 5 km ZDR (shadedcolors) from the QPRD overlaid with horizontal wind field and vertical velocity (white isolines) data for (b) 1800, (d) 1806, and (f) 1812 BT on 14 May 2021.


Figure 10.
Evolution of the SW and the Vr difference before and after the formation of the supercell tornado. The dotted red box indicates the tornado period. The images below the radial-velocity difference curve are the 0.5° PPI scans of SW (top), Vr (TVS) (middle), and ZH (bottom) from the QPRD.
Figure 10.
Evolution of the SW and the Vr difference before and after the formation of the supercell tornado. The dotted red box indicates the tornado period. The images below the radial-velocity difference curve are the 0.5° PPI scans of SW (top), Vr (TVS) (middle), and ZH (bottom) from the QPRD.

Figure 11.
PPI scans of (a) ZH, (b) ZDR, (c) Vr, and (d) ρhv at an elevation of 0.5° from the QPRD at 1854 BT on 14 May 2021. The dotted black line indicates the direction of an azimuth of 239°. The solid black lines indicate the 35- and 45-dBZ ZH contours. The closed dashed blue line indicates a ZDR arc. The closed solid white line indicates an inflow signature.

Figure 12.
CAPPI of ZH (shaded colors) overlaid with horizontal wind field (black bars) and vertical vorticity (white isolines) data for (a) 1818, (b) 1824, (c) 1836, and (d) 1842 BT on 14 May 2021.
Figure 12.
CAPPI of ZH (shaded colors) overlaid with horizontal wind field (black bars) and vertical vorticity (white isolines) data for (a) 1818, (b) 1824, (c) 1836, and (d) 1842 BT on 14 May 2021.

Figure 13.
Evolution of supercell A” and cell D before and during tornado. PPI scan at a 0.5° elevation angle from the HZRD showing (a) ZH and (b) Vr for 18:45 BT 14 May 2021. (c,d) are the same as (a,b), respectively, but for 18:50 BT. The insets in the right corner show the ZH (a,c) and Vr (b,d) at a 1.5° elevation angle. Vortices are circled in black, bule and yellow on the velocity panels. The black line segment represents the vortex diameter.


Table 1.
Environmental parameters for the Hangzhou, Nanjing, and Baoshan stations at 2000 BT on 14 May 2021.
Table 1.
Environmental parameters for the Hangzhou, Nanjing, and Baoshan stations at 2000 BT on 14 May 2021.
| Environmental Parameter | Hangzhou Station | Nanjing Station | Baoshan Station |
|---|---|---|---|
| CAPE (J kg−1) | 2385.2 | 2056.2 | 895.9 |
| LCL (hPa) | 918.4 | 967 | 994.7 |
| K index (°C) | 41.3 | 40.2 | 42.3 |
| Showalter Index (SI) | −3.46 | −2.21 | −3.34 |
| Storm-relative helicity (SRH) | 204.5 | 104.6 | 199.7 |
| Best lifting index (BLI) | −6.2 | −4.6 | −5.4 |
| 0–1 km S (m s−1) | 7.7 | 13.9 | 10.9 |
| 0–3 km S (m s−1) | 13.8 | 19.2 | 17.4 |
| 0–6 km S (m s−1) | 16.7 | 19.6 | 23.0 |
Publisher’s Note: MDPI stays neutral with regard to jurisdictional claims in published maps and institutional affiliations. |
© 2022 by the authors. Licensee MDPI, Basel, Switzerland. This article is an open access article distributed under the terms and conditions of the Creative Commons Attribution (CC BY) license (https://creativecommons.org/licenses/by/4.0/).
Share and Cite
MDPI and ACS Style
Wu, B.; Wei, M.; Li, Y. Dual-Polarization Radar Observations of the Evolution of a Supercell Tornado and Analysis of the Echo Mechanisms. Atmosphere 2022, 13, 797. https://0-doi-org.brum.beds.ac.uk/10.3390/atmos13050797
AMA Style
Wu B, Wei M, Li Y. Dual-Polarization Radar Observations of the Evolution of a Supercell Tornado and Analysis of the Echo Mechanisms. Atmosphere. 2022; 13(5):797. https://0-doi-org.brum.beds.ac.uk/10.3390/atmos13050797
Chicago/Turabian StyleWu, Bin, Ming Wei, and Yanfang Li. 2022. "Dual-Polarization Radar Observations of the Evolution of a Supercell Tornado and Analysis of the Echo Mechanisms" Atmosphere 13, no. 5: 797. https://0-doi-org.brum.beds.ac.uk/10.3390/atmos13050797
Note that from the first issue of 2016, this journal uses article numbers instead of page numbers. See further details here.