Article

Analysis of Particulate Matter Concentration Changes before, during, and Post COVID-19 Lockdown: A Case Study from Victoria, Mexico

by
Bárbara A. Macías-Hernández
and
Edgar Tello-Leal
*
Faculty of Engineering and Science, Autonomous University of Tamaulipas, Victoria 87000, Mexico
*
Author to whom correspondence should be addressed.
Submission received: 11 April 2022 / Revised: 7 May 2022 / Accepted: 17 May 2022 / Published: 18 May 2022
(This article belongs to the Section Air Quality)

Abstract

:
The lockdown measures implemented due to the SARS-CoV-2 pandemic to reduce the epidemic curve, in most cases, have had a positive impact on air quality indices. Our study describes the changes in the concentration levels of PM 2.5 and PM 10 during the lockdown and post-lockdown in Victoria, Mexico, considering the following periods: before the lockdown (BL) from 16 February to 14 March, during the lockdown (DL) from 15 March to 2 May, and in the partial lockdown (PL) from 3 May to 6 June. When comparing the DL period of 2019 and 2020, we document a reduction in the average concentration of PM 2.5 and PM 10 of −55.56% and −55.17%, respectively. Moreover, we note a decrease of −53.57% for PM 2.5 and −51.61% for PM 10 in the PL period. When contrasting the average concentration between the DL periods of 2020 and 2021, an increase of 91.67% for PM 2.5 and 100.00% for PM 10 was identified. Furthermore, in the PL periods of 2020 and 2021, an increase of 38.46% and 31.33% was observed for PM 2.5 and PM 10 , respectively. On the other hand, when comparing the concentrations of PM 2.5 in the three periods of 2020, we found a decrease between BL and DL of −50.00%, between BL and PL a decrease of −45.83%, and an increase of 8.33% between DL and PL. In the case of PM 10 , a decrease of −48.00% between BL and DL, −40.00% between BL and PL, and an increase of 15.38% between the DL and PL periods were observed. In addition, we performed a non-parametric statistical analysis, where a significant statistical difference was found between the DL-2020 and DL-2019 pairs ( x 2 = 1.204) and between the DL-2021 and DL-2019 pairs ( x 2 = 0.372), with a p < 0.000 for PM 2.5 , and the contrast between pairs of PM 10 (DL) showed a significant difference between all pairs with p < 0.01 .

1. Introduction

The World Health Organization (WHO) declared a global public health emergency due to the identification and spread of the SARS-CoV-2 virus in January 2020, causing the COVID-19 pandemic [1]. The WHO issued a set of recommendations on the restrictions to be implemented, in which social distancing and lockdown policies are highlighted, in order to avoid the massive spread of the virus [2] and with a goal of epidemiological control [3]. Social distancing restrictions varied in their implementation and duration in each country. The restrictions can be summarized as isolation at home, schools and universities shut down, economic and industrial activities reduced to the essentials, commercial activities suspended except for the essential businesses required during the confinement, travel within the country suspended, and, in some cases, international travel conditioned to priority activities [4,5]. After the first few weeks of lockdown, various studies reported a positive effect on air quality by reducing pollution levels due to restrictions on people, businesses, and industry [6,7,8,9].
Most of these studies have focused on analyzing pollutants such as particulate matter, specifically coarse and fine particles with aerodynamic diameters less than 10 μ m (PM 10 ) and less than 2.5 μ m (PM 2.5 ), carbon monoxide (CO), ozone (O 3 ), black carbon (BC), or nitrogen dioxide (NO 2 ) between different periods considering previous values and during the period of restrictions derived from the pandemic [10,11,12,13]. Variations in the concentrations of pollutants have been evaluated using data at the local, city, regional, or country level, considering each location’s characteristics, because air pollution levels can be characterized according to the locality and its meteorological conditions [14]. Analysis of pollution levels during the pandemic period has been estimated using the air quality index (AQI) [15], a mass concentration [11,13,14,16,17], modeling programs [6,17,18,19,20], and data collection through low-cost sensors [21], mapped using satellite data [22,23], and predicting pollution levels using machine learning techniques [24].
Therefore, during the approximate 15 months of partial lockdown due to the COVID-19 pandemic, different restriction stages influenced the pollution level in cities. In this sense, the decrease in activities, as a consequence of the reduction in vehicular traffic, has made it possible to identify the levels of pollution caused by domestic and industrial sources [12,13,16]. Motor-vehicle emissions are one of the principal sources of PM 2.5 [10], and a correlation has been demonstrated between PM 2.5 and sulfur dioxide (SO 2 ), and between PM 10 and NO 2 , under certain conditions, which allows us to assume that the principal source of particulate matter is vehicular traffic emissions [6,18]. In recent studies, the effects of meteorological parameters and pollutant concentrations in the air have been linked to the spread of COVID-19 [25,26,27,28,29,30,31]. In this sense, long-term exposure to particulate matter pollution is related to respiratory, cerebrovascular, and chronic pulmonary diseases, schematic heart disease, lung cancer, and mortality [32,33,34,35]. Particulate matter consists of a heterogeneous mixture of organic and inorganic material, solid and liquid, suspended in the air. The primary sources of emissions of particulate matter in Victoria City (Mexico) are paved roads and unpaved roads for both PM 2.5 and PM 10 and domestic combustion for PM 2.5 [36]. The official standard of reference values in Mexico defines 30 μ g/m3 for PM 2.5 and 50 μ g/m3 for PM 10 for a 24 h average, published by the Ministry of Health of the Government of Mexico in the environmental health norm [37].
In Mexico, the confinement policies, in the first stage, were defined by the federal government for their application in each state, generating a COVID-19 traffic light monitoring system (a color-coded mechanism) at the state level. This monitoring system determines which activities are safe to resume and with which restrictions they can be implemented. Following a second stage, this responsibility was transferred to the governments of the states, which defined the confinement, mobility, and business reopening policies by the municipality, publishing a COVID-19 traffic light monitoring system at the local level. These policies are defined and updated considering the total number of confirmed and suspected cases and deaths due to COVID-19 and the occupation of hospital services due to COVID-19 (total hospitalized patients, patients in intensive care unit, patients with artificial ventilation service), and other aspects. This pandemic management scheme has gradually allowed the local economy to reactivate at the local level and the coexistence between people. It is noted that the cumulative total of confirmed cases and deaths from the COVID-19 epidemic in Mexico is very high, over 5.5 million and 319 thousand, respectively, as of 28 February 2022.
Recent studies have been conducted to understand the effects of the pandemic and social distancing policies on air quality. In this sense, Zareba and Danek [38] analyzed air pollution migration during the COVID-19 lockdown in Poland. This study determines the migration of PM 10 according to the dominant wind direction, confirming the increase in the concentration levels of PM 10 at times when local vehicular traffic is very scarce. These episodes occurred at night and with low ambient temperature, which characterizes pollution generated by solid fuel heating emitted in neighboring municipalities. Rudke et al. [39] examine data on the concentration levels of primary and secondary pollutants and their relationship with urban mobility during the COVID-19 lockdown in five Brazilian states with high population levels. The concentration of air pollutants from the confinement period of 2020 was compared with the average concentrations from 2015 to 2019. PM 10 presented a reduction of −23.0% during the first 30 days of confinement. However, from the third month of confinement, an increase in the PM 10 concentration was observed compared to the levels recorded in the first few days of the pandemic. In this sense, ref. [40] report a decrease in the AQI value. In particular, PM 2.5 and PM 10 during the post-COVID-19 period decreased by −14.8% and −29.0%, respectively, compared to pollution levels recorded in the lockdown period of 2020. The improvement in air quality is related to the clean air policies implemented in the BTT region, China, and the favorable atmospheric conditions for the dispersion of pollutants. Furthermore, ref. [9] studied the concentration of PM 10 in the Eastern Province, Saudi Arabia, considering the pre-lockdown, during the lockdown, and a short post-lockdown (4 weeks between June and July 2020) periods. The recorded data come from eight monitoring stations (three in an industrial area and one on a high-traffic road) in six urban populations. A reduction in the concentration of PM 10 stands out only in four monitoring stations during the confinement period (−21.0% to −70.0%). In the post-COVID-19 period, the reduction in PM 10 levels was only maintained in two monitored areas (industrial and high traffic). In [17], the authors examine the PM 2.5 concentration throughout 129 monitoring stations in the United Kingdom during the four weeks of the lockdown period in 2020, when social distancing restrictions were at their highest degree. There was a 69% reduction in general traffic and a −16.5% PM 2.5 concentration decrease compared to the same period from 2017 to 2019. Similarly, in [12], the authors compare the concentrations of PM 2.5 and PM 10 recorded from March to May 2020 with the concentrations corresponding to the same period from 2017 to 2019 in the metropolitan area of Santiago, Chile. They report a decrease of −11.0% and −15.2% for PM 2.5 and PM 10 , respectively, and note that this reduction is related to changes in vehicle emission patterns during the pandemic. These studies show that the reduction in urban pollution levels is generally related to local activities [41]—that is, with the orientation of the business, service, and industrial activities of the locality or region analyzed—as well as the degree of the social distancing restrictions implemented, at different times of the pandemic.
This study aimed to investigate the changes in air pollution from particulate matter (PM 2.5 and PM 10 ) during the period of social distancing after the COVID-19 outbreak in Victoria City (Mexico), using air pollution data detected every hour in monitoring stations at the neighborhood (residential) level. In particular, we focused on air pollutants PM 2.5 and PM 10 related to industrial activities and traffic. We evaluated the variation per the period of these air pollutants at the local level between February 16 and June 6 of the years 2020 and 2021, and considered the periods of total and partial lockdown of the year 2020 (social distancing due to COVID-19 began on 15 March 2020), as well as the different periods of partial confinement of the year 2021. In addition, the difference in air pollution per period is compared to the same period in the previous year.

2. Materials and Methods

2.1. Area of Study

This study was conducted in Victoria (23°44 0 N 99°08 0 W), a city located in the State of Tamaulipas in Northeastern Mexico. Victoria City had a total population of 350,000 inhabitants in 2020, within an area of 200 Km2. The population density per Km2 in 2020 was 1845 inhabitants. The annual mean temperature (2020) was 26 °C, with a minimum and maximum temperature of 0 °C and 42 °C, respectively. Data on ambient air pollutants and meteorological factors were collected through the Air Quality IoT (AQ-IoT) station project of the Autonomous University of Tamaulipas. The stations were installed at the neighborhood level to monitor industrial, commercial, residential, downtown, and suburban areas, considering the topographic conditions of the city, because it is located next to a mountainous area (the Sierra Madre Oriental). The AQ-IoT-02 monitoring station is located in the western center of the city, 6 m from a street with heavy traffic and 100 m from a high-traffic flow boulevard that crosses the city from north to south and vice versa. In addition, parallel to this avenue is a railway track, where freight trains circulate four times a day. The AQ-IoT-03 station is located in the northeast of the city within a residential area with dense populations, 5 m from a street with medium traffic flow and 75 m from an avenue with high traffic flow, which connects two fast-traffic boulevards. This site is close to a new residential development where a large number of houses are under construction. The AQ-IoT-04 station is located in the southeast of the city (close to the government district and convention center) with dense populations, 6 m from a street with medium traffic flow, 50 m from a boulevard with high traffic flow, and 100 m from a boulevard with a high flow and public transport. The AQ-IoT-05 station is located northwest of the city (close to the mountainous area), 6 m from a highway with heavy traffic and 15 m from a street with public transport traffic.

2.2. Data Collection and Statistical Analysis

The environmental pollution data used in our experiment were obtained from February 16 to June 6 of the years 2019, 2020, and 2021. The data were obtained from four stations surrounded by residential areas and distributed in the city’s urban area, with a temporal resolution of 24 h/7 d. Raw data were downloaded from a private cloud over the Internet, in which values are transmitted directly from the stations in real time and stored automatically. Each monitoring station incorporates a 9387-P low-cost sensor (LCS) for particulate matter (Libelium Comunicaciones Distribuidas S.L., Zaragoza, Spain) marketed by Libelium based on the Alphasense OPC-N3 sensor (Alphasense Ltd, Great Notley, UK), which uses a laser beam to count the particles [42]. The OPC-N3 sensor measures particles from 0.35 μ m to 40 μ m and sorts them into 24 size bins, capable of measuring up to 2000 μ g/m3 (PM 2.5 ), with a max coincidence probability of 0.84% at 10,000,000 particles/L, and 0.24% at 500 particles/L [42]. The OPC-N3 calculates the respective PM values according to the method defined by European Standard EN 481. This sensor has achieved high performance under laboratory conditions [43]; in PM 2.5 and PM 10 measurements, it showed a very strong correlation with the reference instrument, with a determination coefficient of R 2 > 0.99, in a concentration range of 0–~300 μ g/m3 for PM 2.5 and 0–~200 μ g/m3 for PM 10 [44]. However, in field operation, LCS measurements can be affected by various meteorological factors [45]. Therefore, the manufacturer recommends (if necessary) calibrating the sensors with a reference instrument considering local meteorological factors. In our experiment, PM sensors were calibrated locally before each study ( R 2 = 0.86 for PM 2.5 and R 2 = 0.75 for PM 10 ). Meteorological factors such as temperature and relative humidity can vary slightly between monitoring station locations.
The mean and median levels of PM 2.5 , PM 10 , relative humidity, and temperature per hour and per day were calculated from the four stations selected in Victoria City. Considering the phases published on the COVID-19 website of the Secretariat of Public Health of the State Government of Tamaulipas for the contingency in 2020, we classified the measurement periods as before lockdown (BL) from 16 February to 14 March, during lockdown (DL) from 15 March to 2 May, and in the partial lockdown (PL) from 3 May to 6 June. Moreover, the changes in pollutant concentration between periods were calculated to estimate the relative change in air quality. A non-parametric Friedman test and Kruskal–Wallis test were performed for the statistical verification of the concentration differences between periods of the three years and among periods of the same year. When the differences were significant (p-value < 0.05) in the Friedman test, a pairwise comparison between two-period data was conducted to determine the significance values and further adjusted by the Bonferroni correction for multiple tests. In the Kruskal–Wallis test, the mean rank was implemented because there were differences between the distribution of the groups (periods), and the Mann–Whitney U test was used to verify differences between periods within the same phase. This method can test PM 2.5 and PM 10 concentration differences between detailed periods. In addition, a descriptive analysis was performed by calculating the median, interquartile range (IQR), minimum, and maximum values for the continuous variables of concentrations of air pollutants and meteorological factors.

2.3. COVID-19 Lockdown Phases
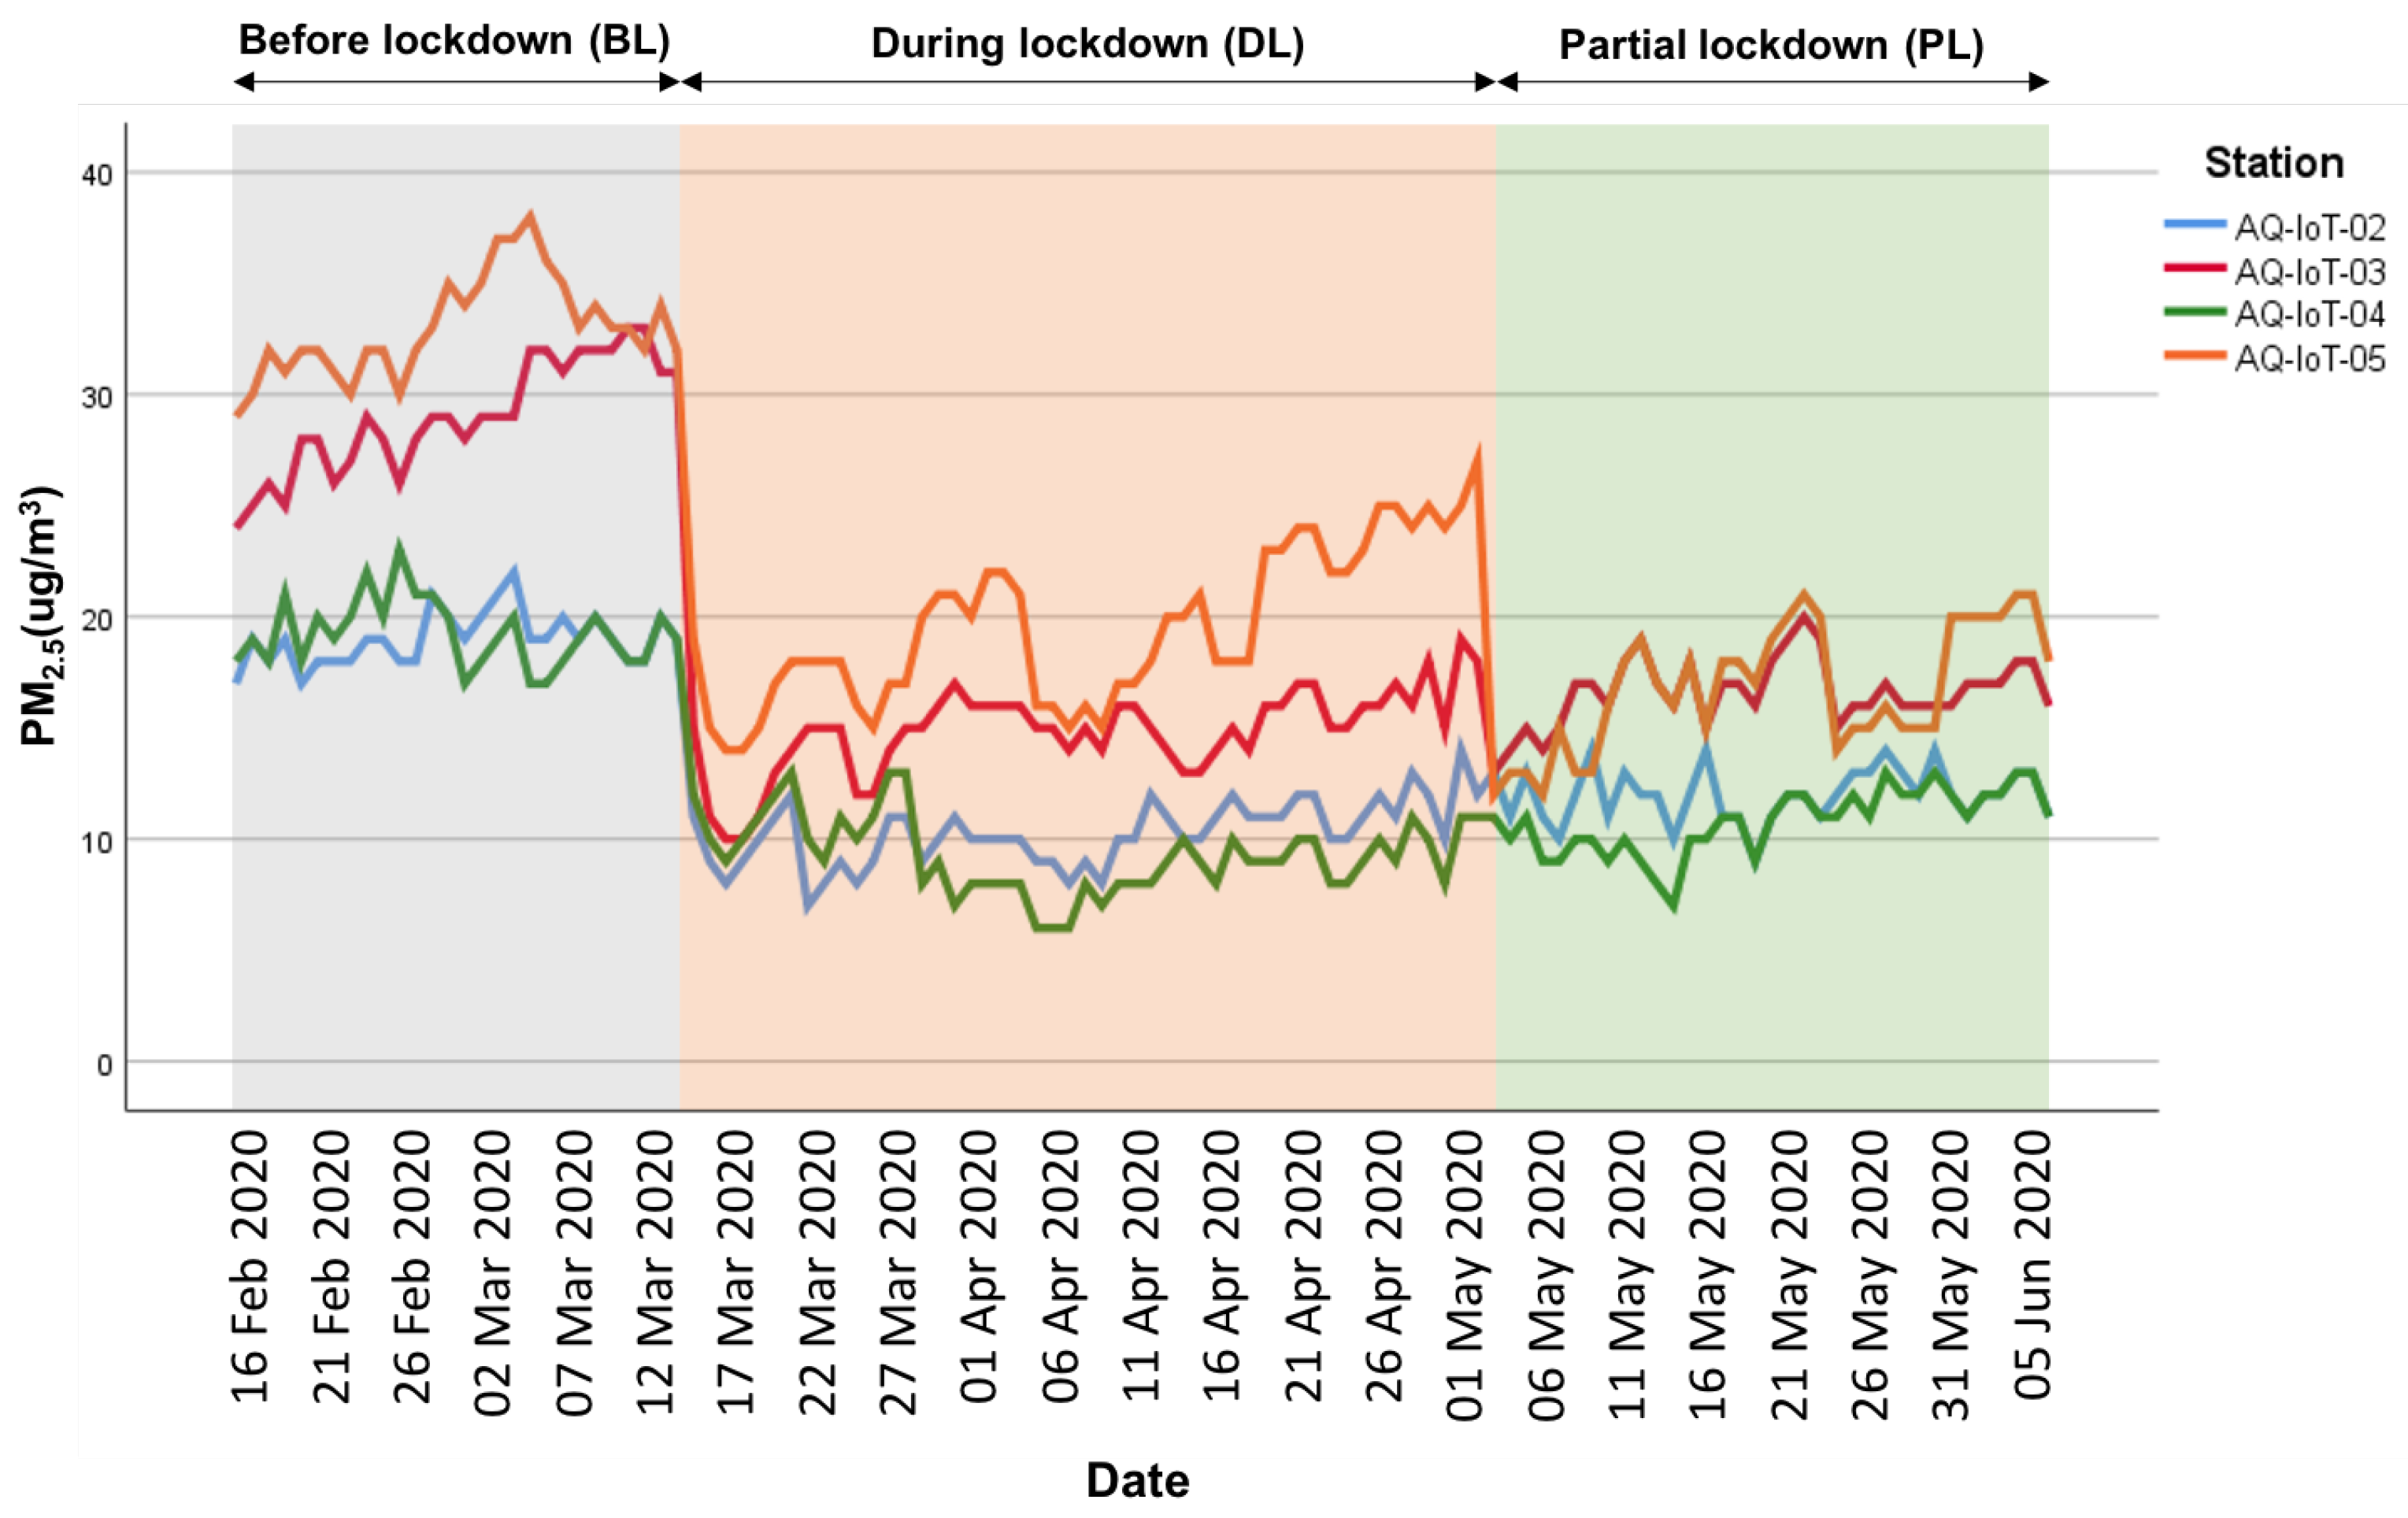
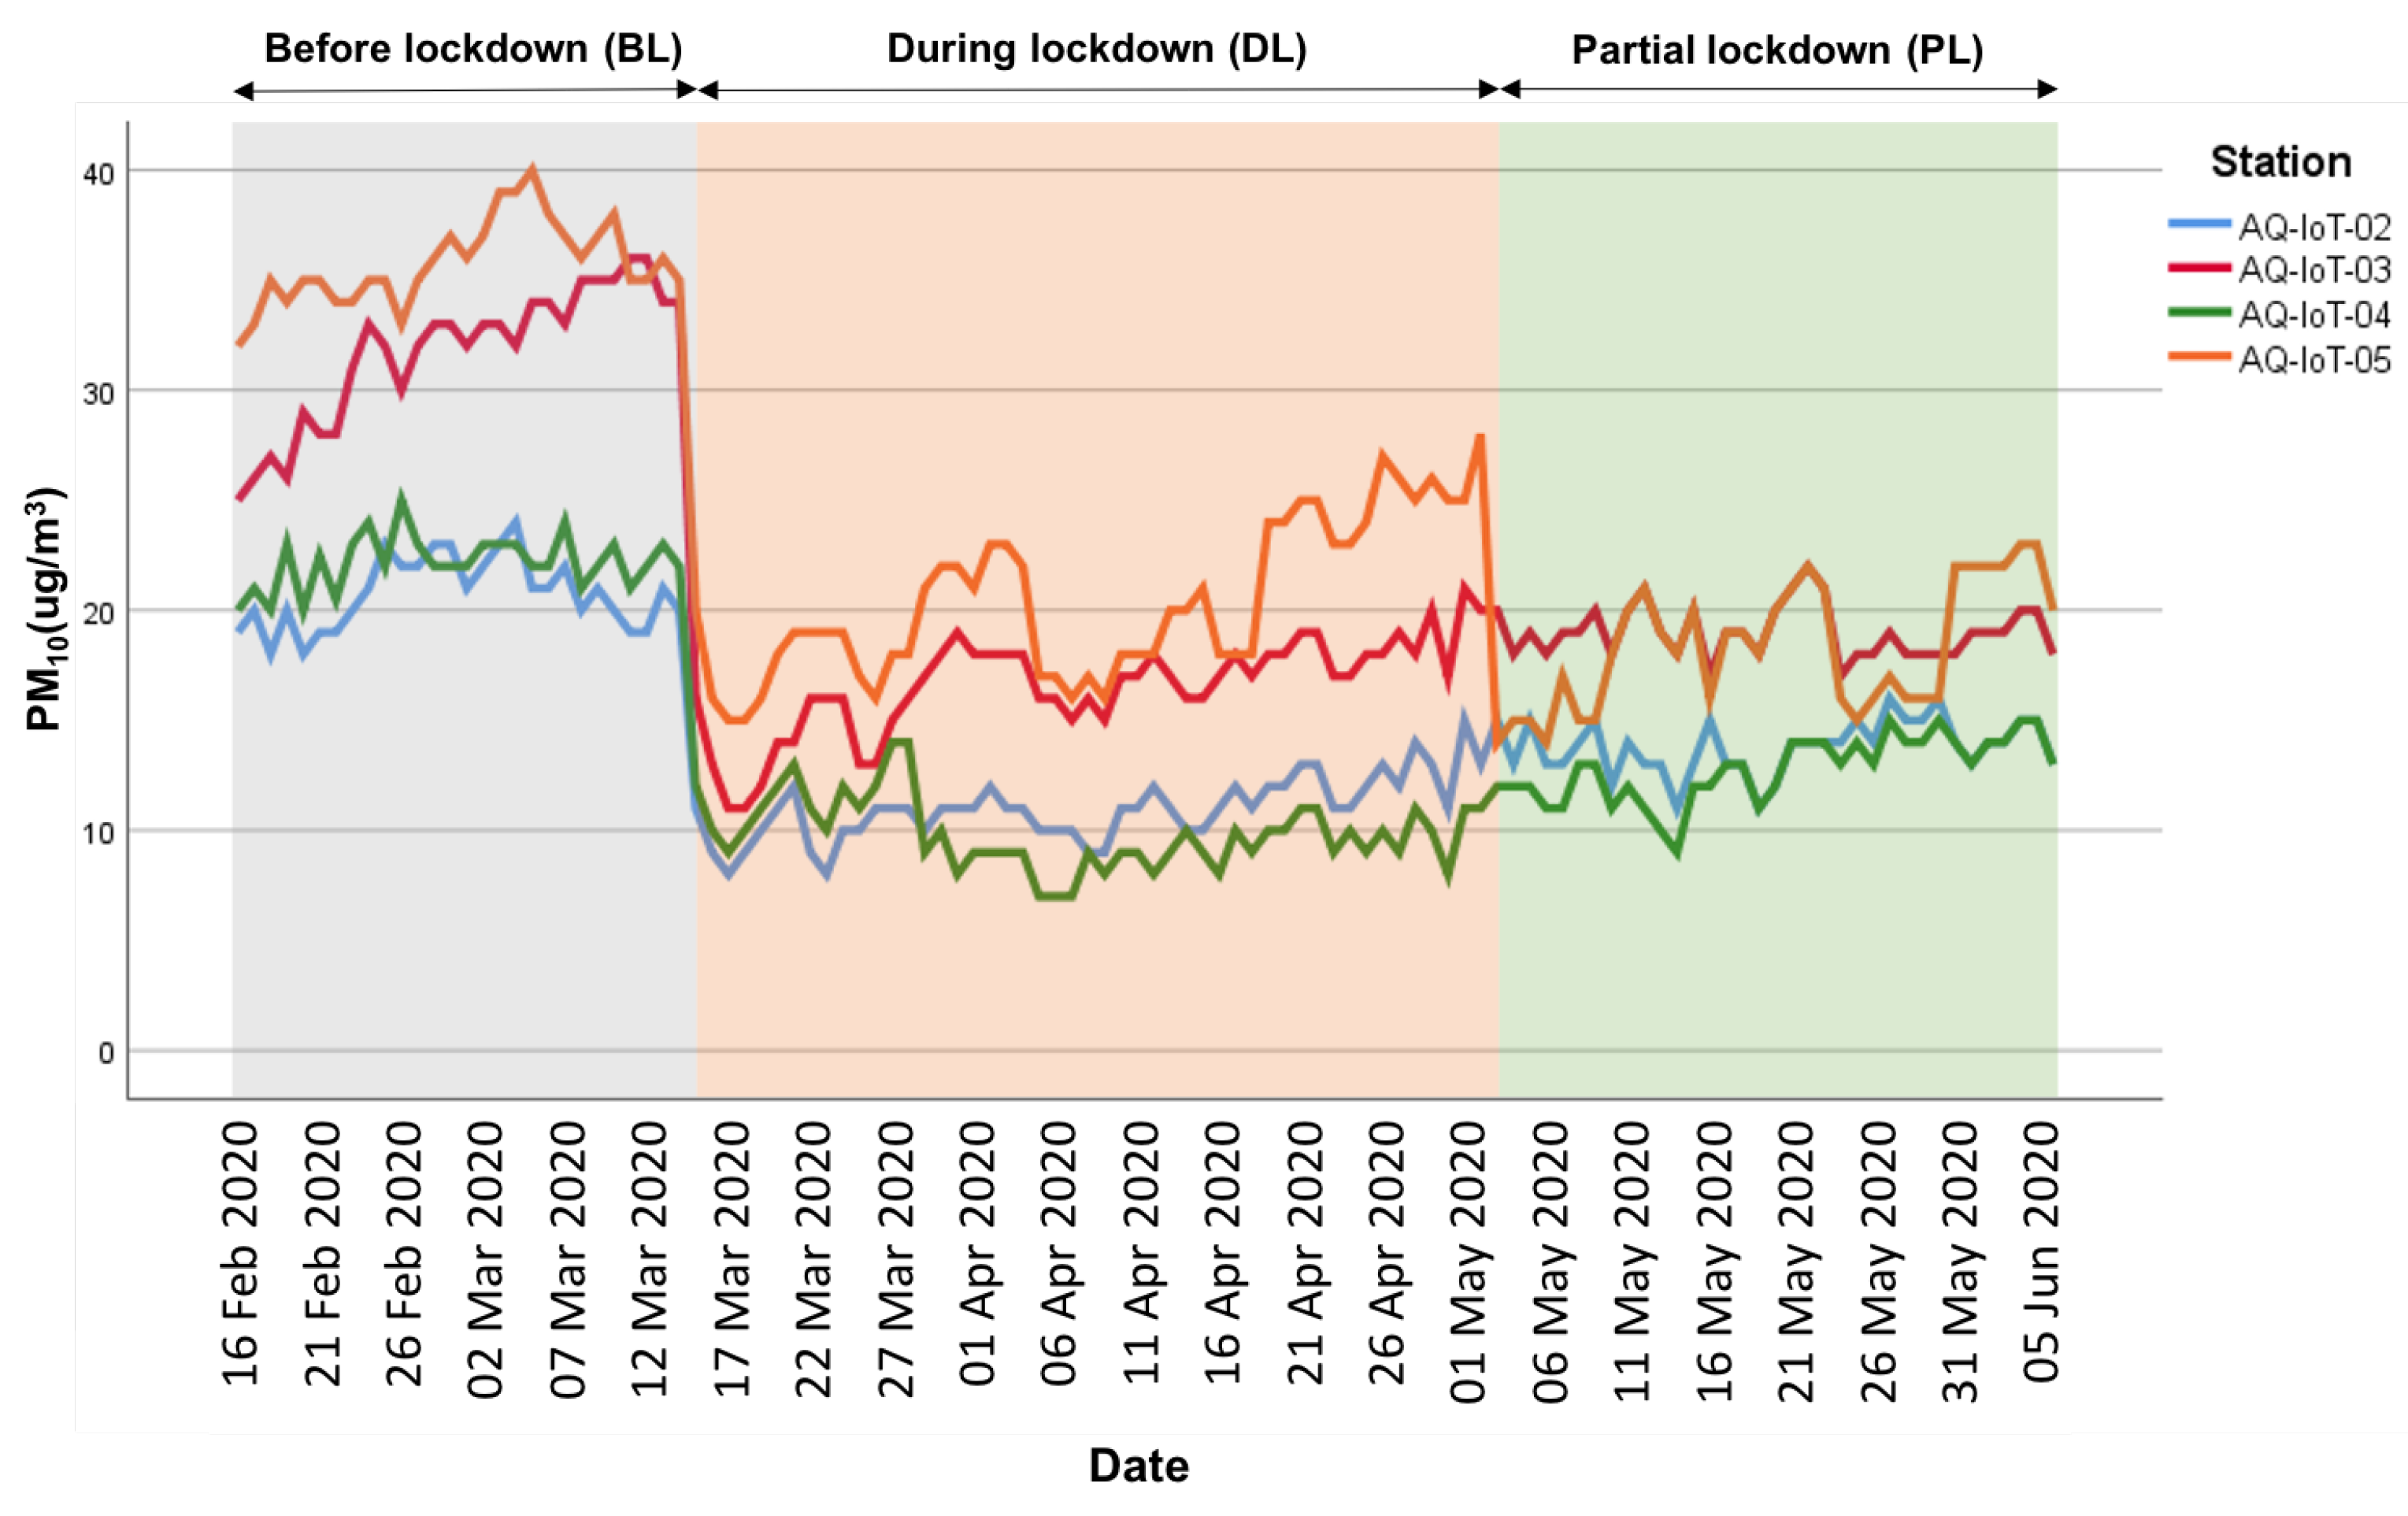
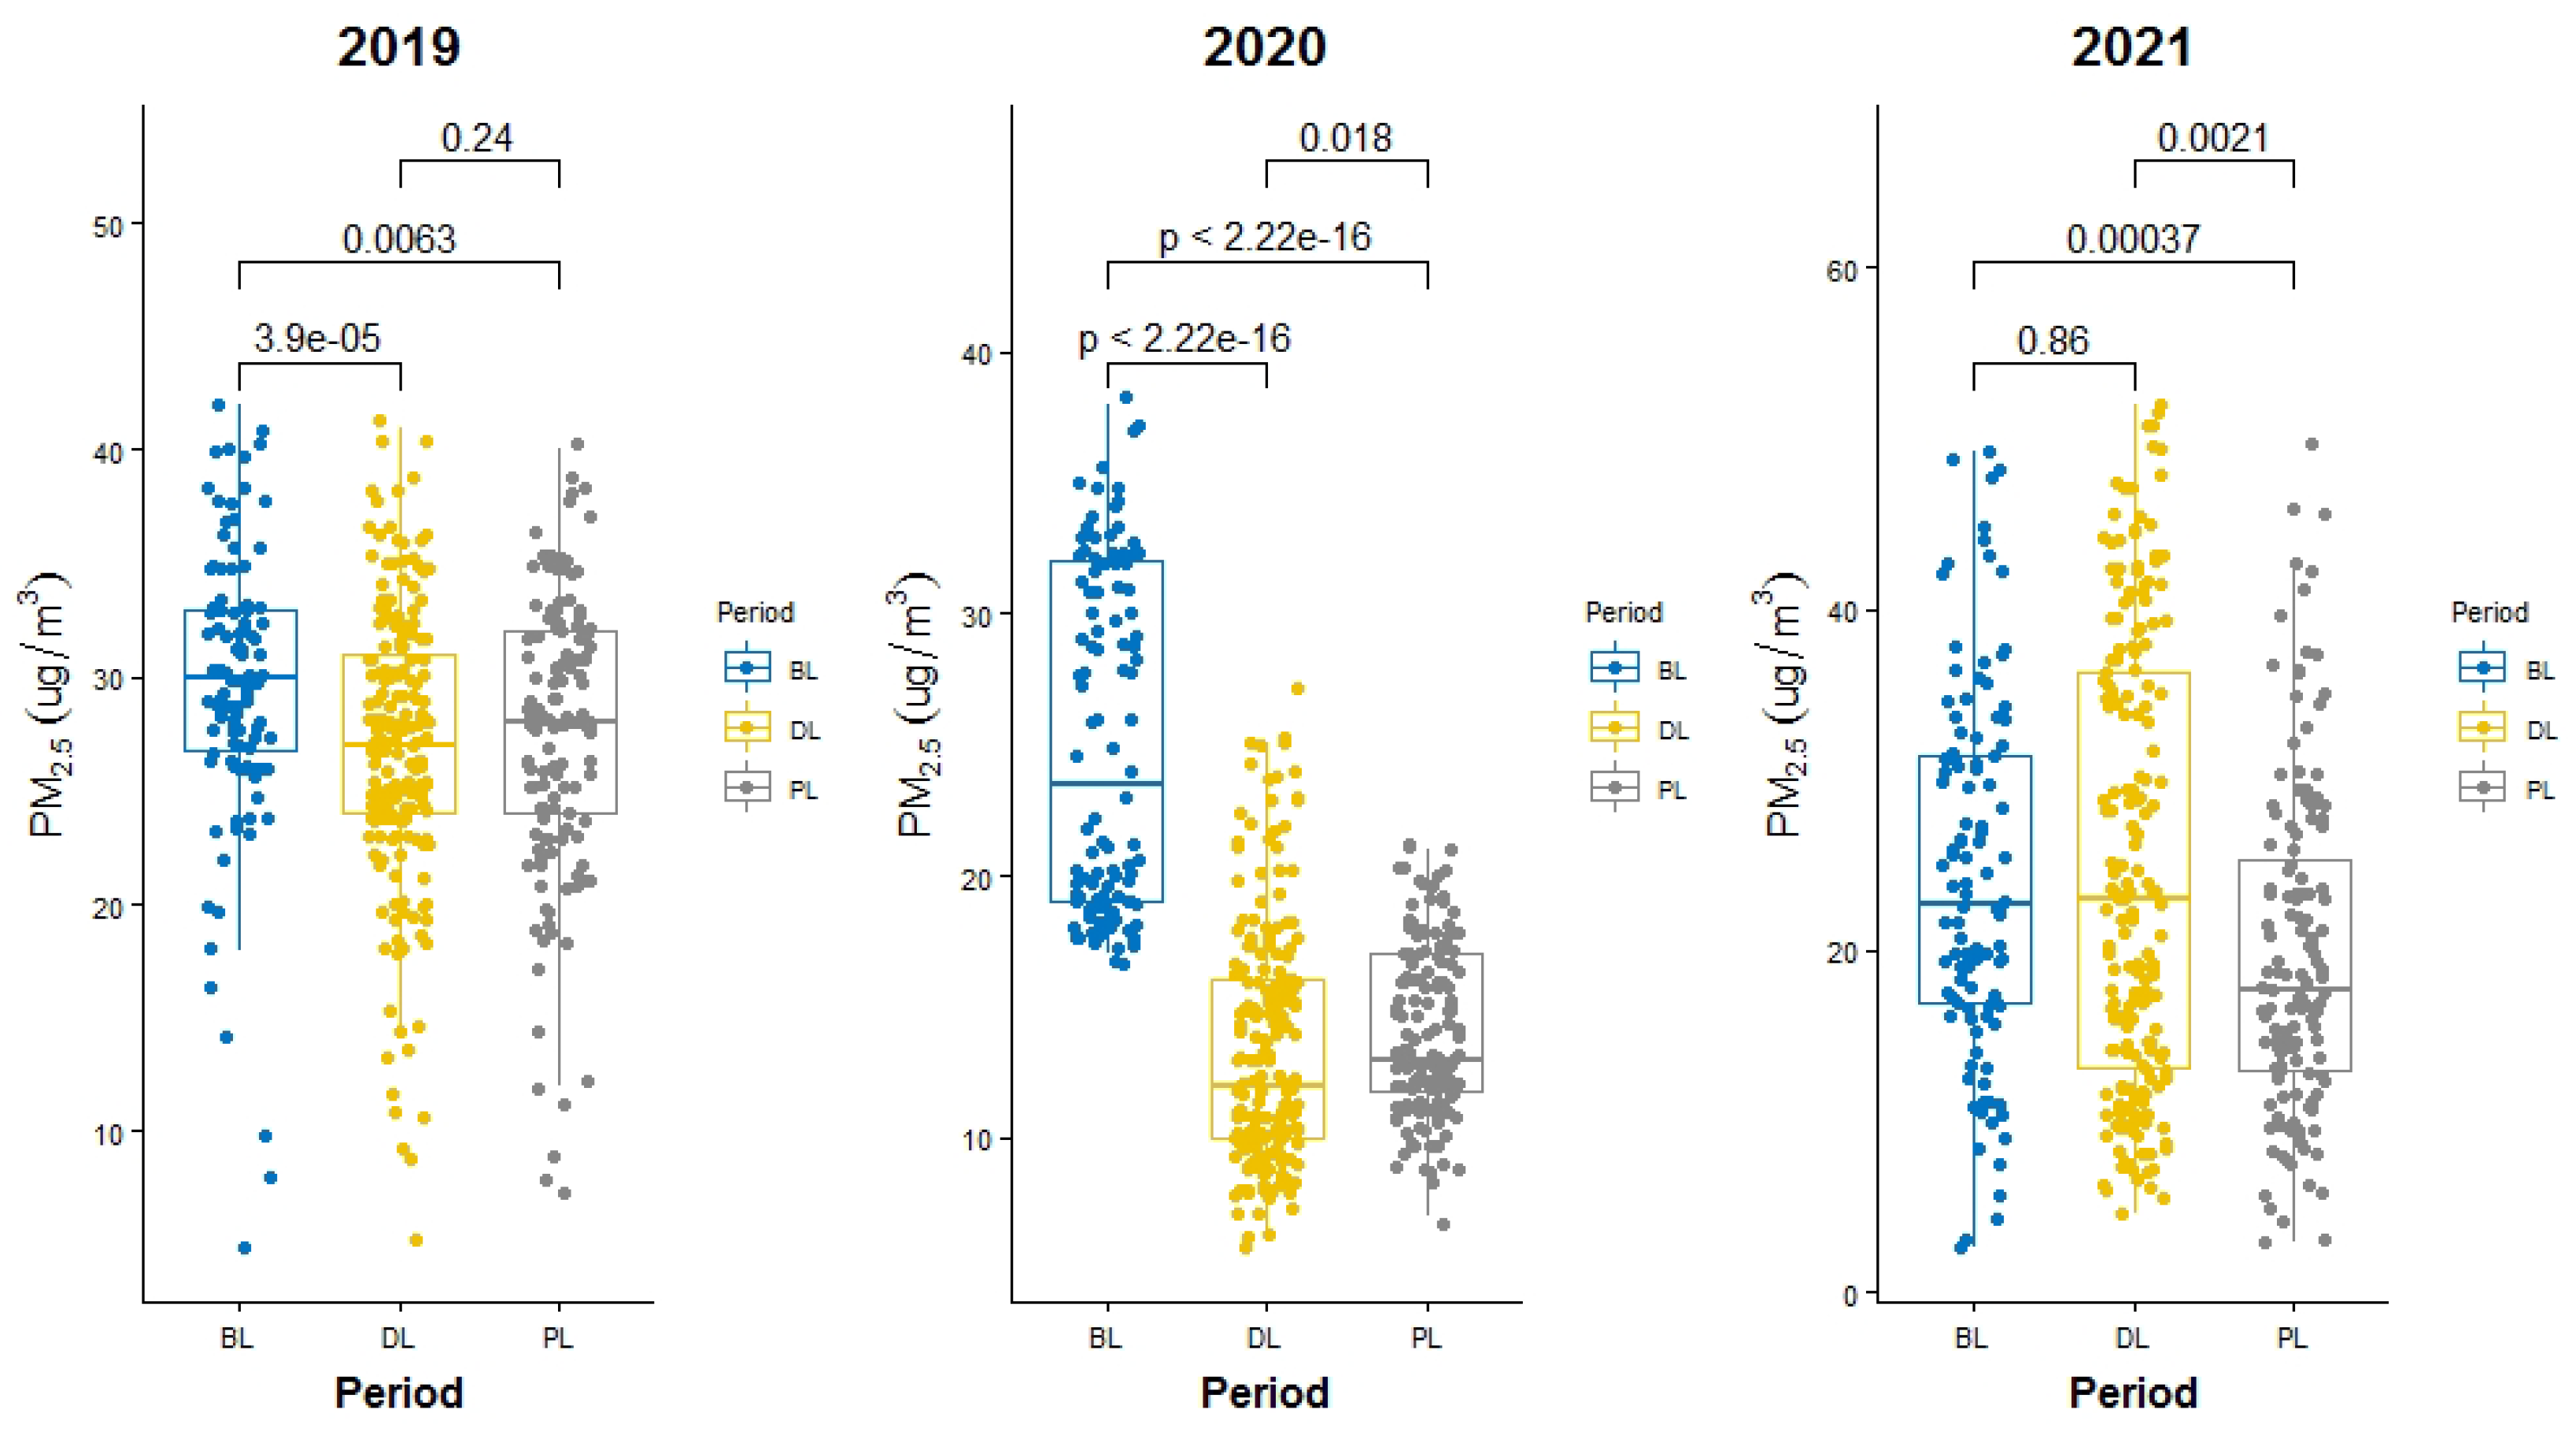
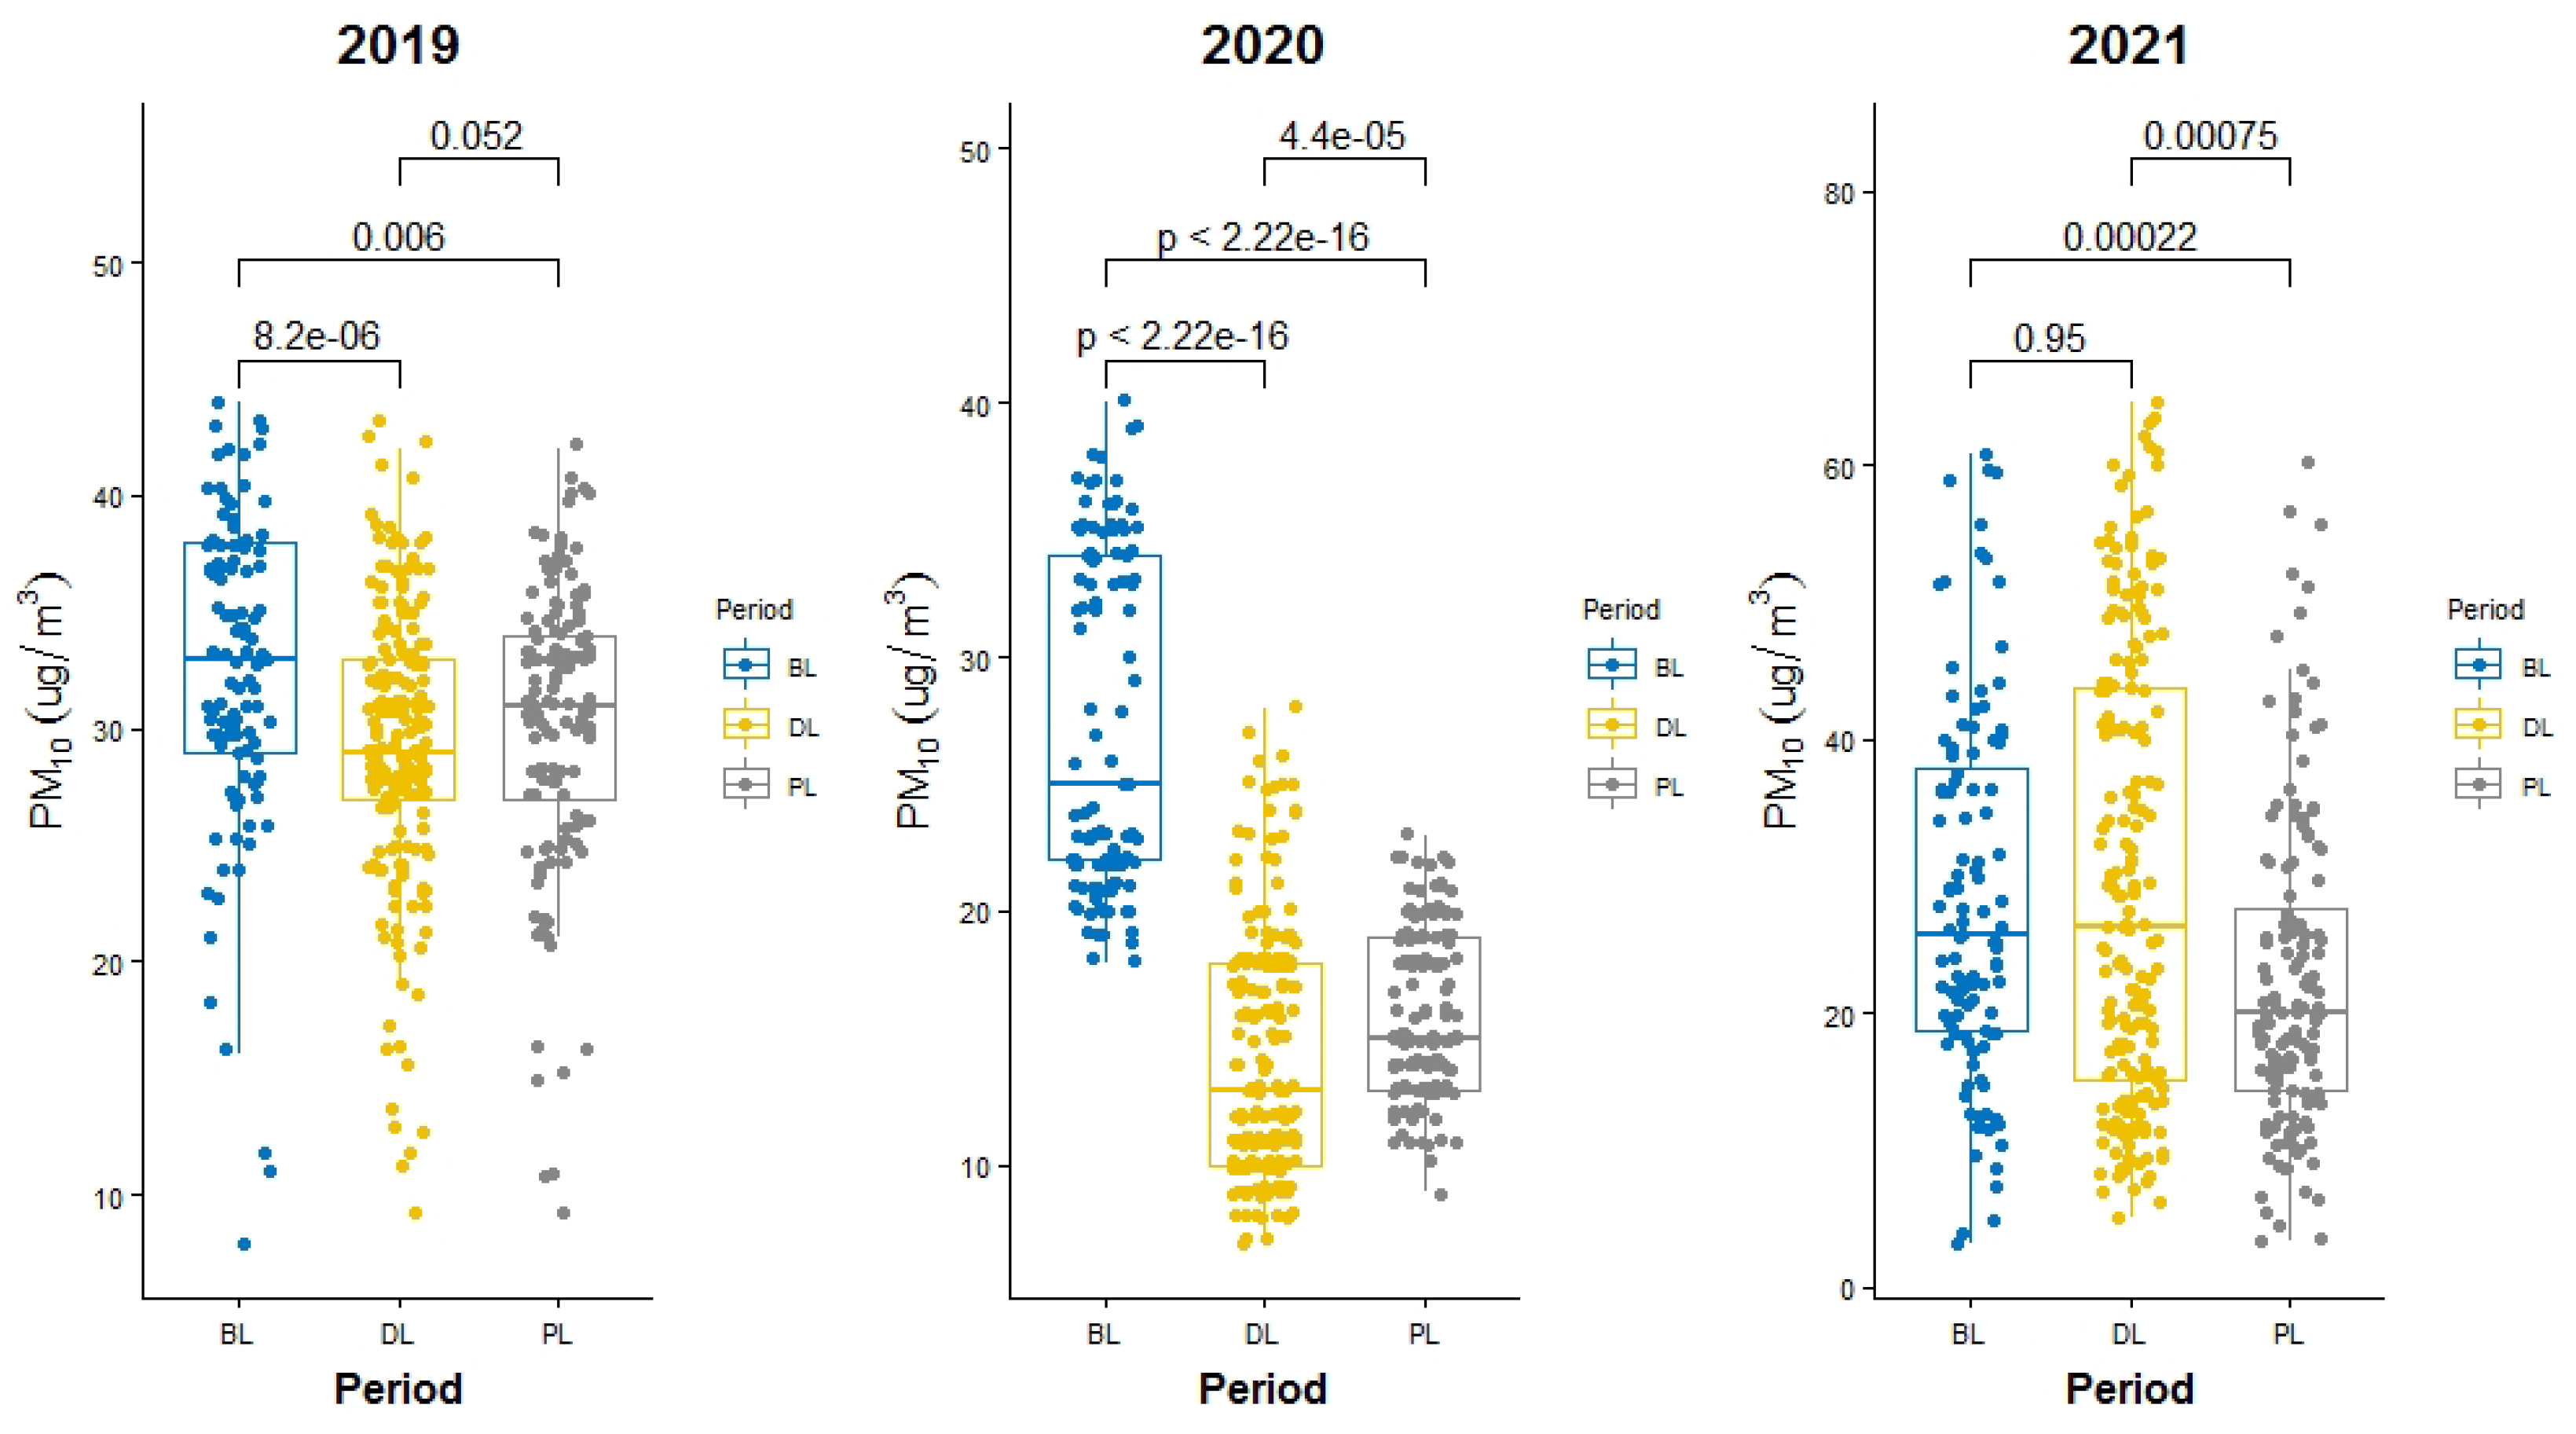
The Secretariat of Public Health of the State Government of Tamaulipas, Mexico, chose to suspend all activities in schools, colleges, and universities as of 17 March 2020, thus initiating the process of confinement derived from the health security measures due to COVID-19. As of 23 March 2020, the temporary closure of shopping centers, restaurants, recreational and sports centers, party rooms, mass events, and access to beaches was to be implemented. Outdoor recreation and exercise activities in parks and squares were suspended. Moreover, the mandatory use of face masks in outdoor activities was applied, and family reunions were limited to a maximum of 20 people wearing face masks. Government employees also suspended activities, and only essential tasks were performed in a home-office scheme. In this sense, virtual classes were started through Internet services at all levels of education. Most business enterprises and industries suspended activities or reduced their operations to a minimum. Afterward, on 30 April 2020, the Tamaulipas State Government updated the restrictions due to the pandemic, implementing a no driving day program—one day per week, limiting the use of motor vehicles to six days a week, except for essential services and emergency vehicles. Moreover, recreational activities and outdoor exercise (in parks and squares) were authorized only on a restricted schedule, individually, with the mandatory use of face masks and maintaining a minimum distance of two meters. In addition, the opening of restaurants was authorized, limited to drive-through or delivery services. Companies that provided services related to healthcare and essential services maintained regular operation during periods of total and partial closure caused by the COVID-19 pandemic.

3. Results

The relative changes determined by comparing the median concentration of PM 2.5 per period (BL, DL, and PL) between the years 2019, 2020, and 2021 are shown in Table 1. In the BL period of 2020, the PM 2.5 was reduced by −20.00% relative to 2019 (30 vs. 24 μ g/m3). In 2020, the highest PM 2.5 median value of 33.00 μ g/m3 with an IQR of 3 was recorded in the AQ-IoT-05 station. A reduction of −23.33% is observed in 2021 with respect to 2019, and a very slight difference between 2020 and 2021 with a decline of −4.16% (24 vs. 23 μ g/m3). It is important to emphasize that in the 2021 period, there were active social distancing measures. The coldest climate of the winter season was recorded in this period: the mean temperature was 21 °C, with a minimum and maximum temperature of 0 °C and 29 °C, respectively, and a mean relative humidity of 69%.
The median PM 2.5 concentration during the lockdown period in 2020 (see Table 1) was 12(6) μ g/m3, median (IQR), showing a significant drop compared with the same period of the previous year. A decrease in the PM 2.5 concentration of −55.56% was observed, an average of the four monitoring stations. In stations AQ-IoT-02 and AQ-IoT-04, the most significant reductions of −60.00% and −65.38%, respectively, were identified. The AQ-IoT-05 station shows the lowest relative change in PM 2.5 concentration of −32.14%. A decrease of −14.81% in the levels of PM 2.5 is observed when comparing the closure period of 2019 and 2021. In station AQ-IoT-02, the most significant reduction of −24.00% is presented, and in station AQ-IoT-05, a minimum relative change of −14.29%. Based on the above, it can be concluded that the air quality improved considerably during the lockdown period of 2020. However, in the same period of 2021 (see Table 1), there was a considerable increase in PM 2.5 , but without reaching the measurements of 2019. This increase may have been caused by the decrease in the social distancing restrictions in force in 2021.
In the period of partial lockdown of 2020, the average concentrations of PM 2.5 of the urban stations were −53.57% lower than the historical average of 2019. However, during 2021, there was a reduction of −35.71% in PM 2.5 , with absolute reductions of 10 μ g/m3. The PM 2.5 decreases were statistically significant in all monitoring stations with p < 0.05 . At the AQ-IoT-02 station, a decrease of −46.43% or 13 μ g/m3 was observed. Likewise, in stations AQ-IoT-03 and AQ-IoT-05, there was a significant reduction in pollution levels, with decreases of −39.29% and −35.48%, respectively. On the contrary, when comparing PM 2.5 average levels between 2020 and 2021, in the period of partial lockdown, it showed a significant increase in 2021 (38.46%). This increase is lower than that presented during the lockdown period. Coincidentally, the monitoring area of the AQ-IoT-04 station shows the most significant increase in PM 2.5 levels in the two periods. The partial closure of 2021 was characterized by several days of heavy rain, which was atypical for these months, helping to mitigate the increase in PM 2.5 in the city. The reference value defined in the standard for PM2.5 [37] was exceeded in the AQ-IoT-04 (BL period of 2019) and AQ-IoT-05 (BL and PL periods of 2019 and BL period of 2020) stations.
Figure 1 shows the behavior of the PM 2.5 pollutant during the year 2020 in the three periods considered in the study for each air quality monitoring station. This figure clearly shows the decrease in the contaminant concentration at the beginning of the confinement period. In comparing the BL and DL periods, a total decrease of −50.00% was found, and the total decrease between the BL and PL periods was −45.83%. However, between the DL and PL periods, an increase of 7.69% in the concentration of PM 2.5 was identified. When the average PM 2.5 concentration per monitoring station was analyzed between the BL and DL periods, the highest decrease of −52.63% was observed in the AQ-IoT-04 station and the smallest decrease of −42.42% in the AQ-IoT-05 station (see Figure 1). In the comparison between the BL and PL periods, the most significant decrease was −48.48% in the AQ-IoT-05 station, and the smallest decrease was −36.84% in the AQ-IoT-02 station, and in the other two stations, the decrease was approximate −42%. In comparing the DL and PL periods, an increase of 13.33% to 22.22% is observed in three monitoring stations. However, the AQ-IoT-05 station presented a decrease of −10.53% in the concentration of PM 2.5 pollutants.
Although the median PM 10 concentration before the lockdown of 2021 (26 μ g/m3) was 21.21% lower than in 2019 (33 μ g/m3), it was higher than 2020 by 3.85% (25 μ g/m3); see Table 2. In particular, during lockdown 2020, the median (IQR) of PM 10 was 13(8) μ g/m3, which was significantly lower than the means of the previous year (2019): 29(6) μ g/m3. Compared to 2019, i.e., one year before, the total lockdown 2020 mean concentration decreased by −55.17% for PM 10 . During the lockdown in 2021, the mean of PM 10 was 26 μ g/m3, which was significantly higher than all previous year. In the partial lockdown, the concentration of PM 10 decreased by −51.61% concerning the values of the same period in 2019 (see Table 2). Similarly, there was a decrease of −35.48% in 2021 versus 2019. When we compare the median concentration of PM 10 between 2020 and 2021, an increase of 33.33% can be observed. In the AQ-IoT-04 monitoring station, a substantial increase of 61.54% in the recorded levels of PM 10 was observed, with 13(2) μ g/m3 versus 21(18) μ g/m3, from 2020 to 2021.
Figure 2 shows the behavior of the daily average concentration of PM 10 in the three periods of 2020 per monitoring station. In the DL period, a decrease of −48.00% was registered with respect to the BL period, and a reduction of −40.00% in the period PL corresponding to the BL period of the same year. However, there is an increase in the concentration of PM 10 of 15.38% in the PL period to the DL period. The lowest concentration levels were recorded at the AQ-IoT-04 station at the monitoring station level in the DL and PL periods, as shown in Figure 2. The AQ-IoT-04 station registered a decrease of −54.54% in the DL period, and the AQ-IoT-05 station had a decrease of −48.57% in the PL period, both decreases corresponding to the level registered in the BL period. When comparing the concentration between the DL and PL periods, increases of 27.27%, 11.76%, and 30.00% were recorded at the AQ-IoT-02, AQ-IoT-03, and AQ-IoT-04 stations, respectively. However, at the AQ-IoT-05 station, a decrease of −10.00% was recorded in the concentration of PM 10 .
The statistical analysis applying the Friedman test displayed a significant difference between the BL periods when contrasting the three years for the concentration of PM 2.5 in the couples 2020–2019 and 2021–2019 with a significance level of 0.000. In contrast to the BL period of the 2020–2021 pair, there is no significant difference with x 2 = −0.097 (p = 0.475). Similarly, the BL period of the PM 10 concentration showed significant differences in the same pairs (p < 0.05), and the pair 2020–2021 was not significantly different with x 2 = −0.139 and a significance level of 0.307. On the other hand, we noted a significant difference in the comparisons of the 2020–2021, 2020–2019, and 2021–2019 pairs for the DL period and the PL period with a significance level of 0.000, both for PM 2.5 and PM 10 concentration. Moreover, when the BL, DL, and PL periods of 2019 were compared with PM 2.5 concentration values, no significant difference was identified between the DL–PL pairs ( x 2 = −0.065, p = 0.634). When contrasting the DL–BL and PL–BL pairs, there is a significant difference at a significance level of 0.000. In the case of PM 10 concentration, it does not show a significant difference in the DL–PL pair ( x 2 = −0.181, p = 0.185). Furthermore, there is a significant difference between the DL–BL and PL–BL pairs with p = 0.001. When contrasting the three periods of 2020, PM 2.5 and PM 10 concentrations showed significant differences among periods (DL–PL, DL–BL, and PL–BL) at a level of significance of p < 0.05 according to the Friedman hypothesis test. The previous behavior of PM 2.5 concentration changes when contrasted among the periods of 2021. No significant differences were identified in the DL–BL and PL–DL pairs, with an x 2 = 0.148 (p = 0.276) and x 2 = 0.287 (p = 0.105), respectively. In contrast, the PL–BL pair shows a significant difference with a significance level of less than 0.05. Similarly, in the PM 10 concentration, the PL–DL and DL–BL pairs do not show a significant difference ( x 2 = 0.324 and x 2 = 0.074, p = 0.052 and p = 1.000, respectively). The PL–BL pair displayed a significant difference in the concentration levels of PM 10 , with a significance level of 0.010.
Next, the statistical analysis results of the Kruskal–Wallis H test are displayed, which presents the statistically significant differences between the periods. In the contrast between the concentrations of PM 2.5 (2019) for DL–BL and PL–BL pairs, there are significant differences with a significance value lower in all cases than 0.05, except for the DL–PL pair, for which no significant differences were found, with an x 2 = −17.003 and significance level of 0.691, as shown in Figure 3. Similarly, for the PM 2.5 concentration in 2020, there is no significant difference between DL and PL, with an x 2 = −23.159 and a significance level of 0.316. In the other comparisons (DL–BL and PL–BL), there are significant differences less than 0.05, favorable to the concentration in the BL period, because the median of PM 2.5 has a higher value (see Figure 3). In the concentration of PM 2.5 for the periods in 2021, there are statistically significant differences between the two pairs, with a significance level of less than 0.05, as shown in Figure 3. On the other hand, there is no difference between the medians of the PM 2.5 concentration of the DL and BL periods, with x 2 = 6.515 and a significance level of 1.000 (see Figure 3).
In all periods of 2019, outliers are observed in the 25th percentile (see Figure 3), which corresponds to cases with values more than 1.5 lengths away from the 25th percentile box. Similarly, extreme cases are identified in the same percentile in the BL period. These values are more than three lengths away from the 25th percentile box. It is essential to mention that these values should be considered favorable for air quality from the point of view of environmental pollution because they display low values in the presence of fine particulate matter (2.5 μ g/m3) on several days of the monitored months. The north wind with a value close to between 1° and 360°, characteristic in the periods of BL and DL in the study area (in the winter and first weeks of the spring seasons), helped to present this condition of atypical values in the 25th percentile. The minimum average daily wind speeds recorded in the BL, DL, and PL periods are 8.8 km/h, 7.9 km/h, and 7 km/h, respectively. The maximum gust wind recorded in each period was 59.3 km/h, 55.6 km/h, and 51.9 km/h, respectively. On the other hand, in the PL period of 2021 (see Figure 3), some outliers are observed in the 75th percentile, corresponding to the daily average of instances far from the rest of the values. These outliers are within the limits of the 75th percentile of the two previous periods of the same year.
The results obtained in the Kruskal–Wallis test applied on the PM 10 concentration dataset in 2019 showed that a non-significant contrast was identified in the DL–PL pair, with a statistical x 2 value of −26.542 and a significance value of 0.183, as shown in Figure 4. Furthermore, the data analysis of 2020 showed statistically significant differences between the medians in the PM 10 concentration contrast of all pairs, with a significance level < 0.05 (see Figure 4). Finally, in the DL–BL comparisons, the boxplot graph of the PM 10 concentration in 2021 shows no significant differences between this pair, with an x 2 = 3.385 and significance values of 1.000 (see Figure 4); in the rest of the pairs, there are significant differences of less than 0.05.
Similarly, in the non-parametric statistical analysis of the concentration of the PM 10 pollutant in 2019 (see Figure 4), several outliers are presented in the BL and PL periods and to a greater extent in the DL period (these cases are observed in the 25th percentile limits). The atypical cases in the 25th percentile (PM 10 concentration) in the three periods of 2019 are related to the constant winds that occurred on several days of these periods. In the PL of 2021, behavior contrary to that identified in 2019 is observed—that is, atypical values in the 75th percentile (see Figure 4). These values are within the levels registered in the previous periods of 2021, within the limit of percentile 75. The four observed outliers farthest from the 75th percentile correspond to the daily average of each monitoring station collected on 10 May 2021. On this date, Mother’s Day is celebrated in Mexico, a holiday characterized by the great movement of people and vehicles, with celebrations in all parts of the country. In 2020, this celebration was not allowed due to the limitations implemented by the contingency of the COVID-19. The four outliers close to the limit of the 75th percentile corresponded to 15 May 2021. On this date, Teacher’s Day is celebrated throughout the country. The festivities that were held possibly caused an increase in PM 2.5 particles and PM 10 in all monitored areas of the city due to the large flow of people and vehicles that characterizes this day, coupled with the recorded meteorological conditions on these two days.

4. Discussion

A decrease in pollutant environment levels during the years 2020 and 2021 has been observed in many cities on all continents due to the reduction in industrial, economic, and tourism activities, driven by the confinement caused by the pandemic of COVID-19 [13,30,46]. The authors of [47] conclude that air quality improved during the confinement periods implemented due to the different waves of COVID-19, reporting a reduction of −28% and −26% for PM 2.5 and PM 10 , in the city of Madrid, Spain, during the period from 15 February to 15 June, 2020, concerning the values recorded in the pre-confinement period studied, which comprises 1 January to 15 February, 2020. Similarly, in [48], the authors analyze the impact of contingency measures during the pandemic on air quality in a medium-sized city in Thailand, reporting a decrease of −21.8% in PM 2.5 and −22.9% in PM 10 . This decrease was identified during the total closure period from March 25 to April 14, 2020, compared to the levels registered three weeks prior to the closure declaration. In addition, an increase in particulate matter measurements (PM 2.5 and PM 10 ) was observed in May and June 2020. Lange et al. [49] identified a significant reduction in PM 2.5 and PM 10 (−22.13% and −28.74%, respectively) in an industrial city (Pittsburgh, PA, USA) when comparing the values recorded in April 2020 with the values in April from four previous years. In the analysis of particulate material, data from different monitoring stations distributed in the city were used. The most significant decrease in PM 2.5 occurred in the industrial zone (−29.24%), which suggests that industrial sources contribute to a greater extent to the generation of particulate matter than vehicular transportation. Likewise, in [50], the authors report a reduction in the concentration of PM 2.5 , throughout the year 2020, in the city of Sao Paulo, Brazil; firstly, on the main highways that connect the city, a decrease in the average concentration of PM 2.5 was observed from −15.88% and −15.2% in the first and second quarter of the year compared to the same periods in 2019. Furthermore, in the five urban air quality monitoring stations, there was a decrease in the concentration of the same pollutant of −3.4% to −26.5%, and from −8.4% to −20.8%, in January to March from April to June 2020, concerning the concentrations of the previous year. Similarly, in [11], the authors report a decrease in the concentration of PM 2.5 and PM 10 of −45% and −35% during the total lockdown period in Korea. On the other hand, Al-Hemoud et al. [51] noticed a reduction in the concentration of PM 2.5 of −21% during the period from March 22 to May 10, 2020, compared to the same period in 2019. In Barcelona, ref. [52] document a decrease of −28% and −31% in the registered levels of PM 10 in traffic and urban background stations, respectively, during the first two weeks of the lockdown. Similarly, in [53], the authors report a reduction of −21.0% and −21.5% in the average concentration of PM 2.5 and PM 10 , respectively, registered on Sundays during the confinement in the city of Arequipa, Peru.
The results discussed in the previous paragraphs confirm the effects on air pollution due to the COVID-19 lockdown in various cities around the world, where the improvement in air quality induced by control measures during confinement varies in time. These positive changes in the concentration of particulate matter are associated with industrial activities, the local economy, and social activities. In most cases, returning to normal life or with fewer restrictions on activities increased the concentrations of PM 2.5 and PM 10 . The analysis of restrictions and their relationship with the decrease in pollution levels can help to define public policies to mitigate the emission of pollutants into the air.
In our study, we note that the primary source of PM 2.5 and PM 10 is vehicular traffic and, to a lesser degree, fugitive dust, given the characteristics of the city, which has a limited presence of industrial activity. Economic activities focus on trade and government management. The decrease in the concentrations of PM 2.5 and PM 10 in the total confinement stage allows a strengthening of the hypothesis of vehicular traffic as the first source of pollution, confirmed by the mobility restrictions applied in this period. Consequently, during the partial closure stage, the concentration levels of PM 2.5 and PM 10 increased considerably, which is related to the enabling of commercial and entertainment activities (restaurants, pubs) with limited hours and capacity, increasing vehicular traffic on all city streets.

5. Conclusions

This paper presents a study of the effects caused by the COVID-19 confinement on the concentrations of PM 2.5 and PM 10 pollutants in Ciudad Victoria, Mexico. The comparisons between periods (BL, DL, PL) made it possible to identify the benefit of the social distancing policies implemented and their effect on air quality, and their relation to the policies applied. On the one hand, the average concentration of PM 2.5 and PM 10 for the same period but different years (2019, 2020, and 2021) was compared, considering pre-lockdown, lockdown, and post-lockdown. On the other hand, the average concentrations of PM 2.5 and PM 10 were contrasted between the three periods (BL, DL, and PL) of 2020.
The aforementioned allowed us to determine the percentage decrease in the PM 2.5 and PM 10 concentration between periods and years. We observed an increase in the daily average concentration when social distancing policies decreased or relaxed; for example, in the comparison of the DL and PL periods of 2020, there was an increase of 4.07% and 10.58% in the PM 2.5 and PM 10 concentration, respectively. Furthermore, an analysis of the daily average concentration of PM 2.5 and PM 10 at the monitoring station level was presented, enabling us to locate the areas of the city that present the highest concentration levels of particles. Moreover, the increase in the concentration of pollutant levels identified during the holidays of May 2021 allows us to assume that the primary source of particulate matter is vehicular traffic in the city.

Author Contributions

B.A.M.-H.: Conceptualization, Methodology, Software, Formal Analysis, and Writing—Original Draft Preparation. E.T.-L.: Data Curation, Visualization, Investigation, Supervision, Validation, and Writing—Reviewing and Editing. All authors have read and agreed to the published version of the manuscript.

Funding

This research was funded by the Universidad Autónoma de Tamaulipas, México, grant number 26-UATINVES20.

Institutional Review Board Statement

Not applicable.

Informed Consent Statement

Not applicable.

Data Availability Statement

Not applicable.

Acknowledgments

The authors are grateful to the Autonomous University of Tamaulipas, Mexico for supporting this work.

Conflicts of Interest

The authors declare no conflict of interest.

Abbreviations

The following abbreviations are used in this manuscript:
WHOWorld Health Organization
PM 10 Particulate matter 10 micrometers or less in diameter
PM 2.5 Particulate matter 2.5 micrometers or less in diameter
COCarbon Monoxide
O 3 Ozone
BCBlack Carbon
NO 2 Nitrogen Dioxide
AQIAir Quality Index
SO 2 Sulfur Dioxide
BLBefore Lockdown
DLDuring Lockdown
PLPartial Lockdown

References

  1. WHO World Health Organization. Report of the WHO-China Joint Mission on Coronavirus Disease 2019 (COVID-19). 2020. Available online: https://www.who.int/emergencies/diseases/novel-coronavirus-2019/situation-reports (accessed on 7 January 2021).
  2. Salmon Ceron, D.; Bartier, S.; Hautefort, C.; Nguyen, Y.; Nevoux, J.; Hamel, A.L.; Camhi, Y.; CanouÃ-Poitrine, F.; Verillaud, B.; Slama, D.; et al. Self-reported loss of smell without nasal obstruction to identify COVID-19. The multicenter Coranosmia cohort study. J. Infect. 2020, 81, 614–620. [Google Scholar] [CrossRef]
  3. Pollán, M.; Perez-Gomez, B.; Pastor-Barriuso, R.; Oteo, J.; Hernán, M.; Pérez-Olmeda, M.; Sanmartín, J.; Fernandez-Garcia, A.; Cruz, I.; Larrea, N.; et al. Prevalence of SARS-CoV-2 in Spain (ENE-COVID): A nationwide, population-based seroepidemiological study. Lancet 2020, 396, 535–544. [Google Scholar] [CrossRef]
  4. Lipfert, F.W.; Wyzga, R.E. COVID-19 and the Environment, Review and Analysis. Environments 2021, 8, 42. [Google Scholar] [CrossRef]
  5. Skirienė, A.F.; Stasiškienė, Z. COVID-19 and Air Pollution: Measuring Pandemic Impact to Air Quality in Five European Countries. Atmosphere 2021, 12, 290. [Google Scholar] [CrossRef]
  6. Lovrić, M.; Pavlović, K.; Vuković, M.; Grange, S.K.; Haberl, M.; Kern, R. Understanding the true effects of the COVID-19 lockdown on air pollution by means of machine learning. Environ. Pollut. 2021, 274, 115900. [Google Scholar] [CrossRef]
  7. Mandal, I.; Pal, S. COVID-19 pandemic persuaded lockdown effects on environment over stone quarrying and crushing areas. Sci. Total Environ. 2020, 732, 139281. [Google Scholar] [CrossRef]
  8. Ali, G.; Abbas, S.; Qamer, F.M.; Wong, M.S.; Rasul, G.; Irteza, S.M.; Shahzad, N. Environmental impacts of shifts in energy, emissions, and urban heat island during the COVID-19 lockdown across Pakistan. J. Clean. Prod. 2021, 291, 125806. [Google Scholar] [CrossRef]
  9. Anil, I.; Alagha, O. The impact of COVID-19 lockdown on the air quality of Eastern Province, Saudi Arabia. Air Qual. Atmos. Health 2021, 14, 117–128. [Google Scholar] [CrossRef]
  10. Hu, M.; Chen, Z.; Cui, H.; Wang, T.; Zhang, C.; Yun, K. Air pollution and critical air pollutant assessment during and after COVID-19 lockdowns: Evidence from pandemic hotspots in China, the Republic of Korea, Japan, and India. Atmos. Pollut. Res. 2021, 12, 316–329. [Google Scholar] [CrossRef]
  11. Ju, M.J.; Oh, J.; Choi, Y.H. Changes in air pollution levels after COVID-19 outbreak in Korea. Sci. Total Environ. 2021, 750, 141521. [Google Scholar] [CrossRef]
  12. Toro, A.R.; Catalán, F.; Urdanivia, F.R.; Rojas, J.P.; Manzano, C.A.; Seguel, R.; Gallardo, L.; Osses, M.; Pantoja, N.; Leiva-Guzman, M.A. Air pollution and COVID-19 lockdown in a large South American city: Santiago Metropolitan Area, Chile. Urban Clim. 2021, 36, 100803. [Google Scholar] [CrossRef] [PubMed]
  13. Wang, H.; Miao, Q.; Shen, L.; Yang, Q.; Wu, Y.; Wei, H. Air pollutant variations in Suzhou during the 2019 novel coronavirus (COVID-19) lockdown of 2020: High time-resolution measurements of aerosol chemical compositions and source apportionment. Environ. Pollut. 2021, 271, 116298. [Google Scholar] [CrossRef] [PubMed]
  14. Chauhan, A.; Singh, R.P. Decline in PM2.5 concentrations over major cities around the world associated with COVID-19. Environ. Res. 2020, 187, 109634. [Google Scholar] [CrossRef] [PubMed]
  15. Feng, R.; Xu, H.; Wang, Z.; Gu, Y.; Liu, Z.; Zhang, H.; Zhang, T.; Wang, Q.; Zhang, Q.; Liu, S.; et al. Quantifying Air Pollutant Variations during COVID-19 Lockdown in a Capital City in Northwest China. Atmosphere 2021, 12, 788. [Google Scholar] [CrossRef]
  16. Gao, C.; Li, S.; Liu, M.; Zhang, F.; Achal, V.; Tu, Y.; Zhang, S.; Cai, C. Impact of the COVID-19 pandemic on air pollution in Chinese megacities from the perspective of traffic volume and meteorological factors. Sci. Total Environ. 2021, 773, 145545. [Google Scholar] [CrossRef]
  17. Jephcote, C.; Hansell, A.L.; Adams, K.; Gulliver, J. Changes in air quality during COVID-19 ‘lockdown’ in the United Kingdom. Environ. Pollut. 2021, 272, 116011. [Google Scholar] [CrossRef]
  18. Higham, J.; Acosta Ramirez, C.; Green, M.; Morse, A. UK COVID-19 Lockdown: 100 days of air pollution reduction. Air Qual. Atmos. Health 2021, 14, 325–332. [Google Scholar] [CrossRef]
  19. Tsou, I.; Liew, C.; Tan, B.P.; Chou, H.; Wong, S.; Loke, K.; Quah, R.; Tan, A.; Tay, K. Planning and coordination of the radiological response to the coronavirus disease 2019 (COVID-19) pandemic: The Singapore experience. Clin. Radiol. 2020, 75, 415–422. [Google Scholar] [CrossRef]
  20. Wang, S.; Zhang, Y.; Ma, J.; Zhu, S.; Shen, J.; Wang, P.; Zhang, H. Responses of decline in air pollution and recovery associated with COVID-19 lockdown in the Pearl River Delta. Sci. Total Environ. 2021, 756, 143868. [Google Scholar] [CrossRef]
  21. Chadwick, E.; Le, K.; Pei, Z.; Sayahi, T.; Rapp, C.; Butterfield, A.; Kelly, K. Technical note: Understanding the effect of COVID-19 on particle pollution using a low-cost sensor network. J. Aerosol Sci. 2021, 155, 105766. [Google Scholar] [CrossRef]
  22. Dang, H.A.H.; Trinh, T.A. Does the COVID-19 lockdown improve global air quality? New cross-national evidence on its unintended consequences. J. Environ. Econ. Manag. 2021, 105, 102401. [Google Scholar] [CrossRef]
  23. Venter, Z.S.; Aunan, K.; Chowdhury, S.; Lelieveld, J. COVID-19 lockdowns cause global air pollution declines. Proc. Natl. Acad. Sci. USA 2020, 117, 18984–18990. [Google Scholar] [CrossRef] [PubMed]
  24. Munir, S.; Coskuner, G.; Jassim, M.S.; Aina, Y.A.; Ali, A.; Mayfield, M. Changes in Air Quality Associated with Mobility Trends and Meteorological Conditions during COVID-19 Lockdown in Northern England, UK. Atmosphere 2021, 12, 504. [Google Scholar] [CrossRef]
  25. Kumar, S. Effect of meteorological parameters on spread of COVID-19 in India and air quality during lockdown. Sci. Total Environ. 2020, 745, 141021. [Google Scholar] [CrossRef]
  26. Ghosal, R.; Saha, E. Impact of the COVID-19 induced lockdown measures on PM2.5 concentration in USA. Atmos. Environ. 2021, 254, 118388. [Google Scholar] [CrossRef]
  27. Páez-Osuna, F.; Valencia-Castañeda, G.; Rebolledo, U.A. The link between COVID-19 mortality and PM2.5 emissions in rural and medium-size municipalities considering population density, dust events, and wind speed. Chemosphere 2022, 286, 131634. [Google Scholar] [CrossRef]
  28. Ibarra-Espinosa, S.; Dias de Freitas, E.; Ropkins, K.; Dominici, F.; Rehbein, A. Negative-Binomial and quasi-poisson regressions between COVID-19, mobility and environment in São Paulo, Brazil. Environ. Res. 2022, 204, 112369. [Google Scholar] [CrossRef]
  29. Marquès, M.; Correig, E.; Ibarretxe, D.; Anoro, E.; Antonio Arroyo, J.; Jericó, C.; Borrallo, R.M.; Miret, M.; Näf, S.; Pardo, A.; et al. Long-term exposure to PM10 above WHO guidelines exacerbates COVID-19 severity and mortality. Environ. Int. 2022, 158, 106930. [Google Scholar] [CrossRef]
  30. Bhatti, U.A.; Zeeshan, Z.; Nizamani, M.M.; Bazai, S.; Yu, Z.; Yuan, L. Assessing the change of ambient air quality patterns in Jiangsu Province of China pre-to post-COVID-19. Chemosphere 2022, 288, 132569. [Google Scholar] [CrossRef]
  31. Garcia, E.; Marian, B.; Chen, Z.; Li, K.; Lurmann, F.; Gilliland, F.; Eckel, S.P. Long-term air pollution and COVID-19 mortality rates in California: Findings from the Spring/Summer and Winter surges of COVID-19. Environ. Pollut. 2022, 292, 118396. [Google Scholar] [CrossRef]
  32. Cohen, A.J.; Brauer, M.; Burnett, R.; Anderson, H.R.; Frostad, J.; Estep, K.; Balakrishnan, K.; Brunekreef, B.; Dandona, L.; Dandona, R.; et al. Estimates and 25-year trends of the global burden of disease attributable to ambient air pollution: An analysis of data from the Global Burden of Diseases Study 2015. Lancet 2017, 389, 1907–1918. [Google Scholar] [CrossRef] [Green Version]
  33. Rhee, J.; Dominici, F.; Zanobetti, A.; Schwartz, J.; Wang, Y.; Di, Q.; Balmes, J.; Christiani, D.C. Impact of Long-Term Exposures to Ambient PM2.5 and Ozone on ARDS Risk for Older Adults in the United States. Chest 2019, 156, 71–79. [Google Scholar] [CrossRef]
  34. Liu, C.; Chen, R.; Sera, F.; Vicedo-Cabrera, A.M.; Guo, Y.; Tong, S.; Coelho, M.S.; Saldiva, P.H.; Lavigne, E.; Matus, P.; et al. Ambient Particulate Air Pollution and Daily Mortality in 652 Cities. N. Engl. J. Med. 2019, 381, 705–715. [Google Scholar] [CrossRef] [PubMed]
  35. Domingo, J.L.; Rovira, J. Effects of air pollutants on the transmission and severity of respiratory viral infections. Environ. Res. 2020, 187, 109650. [Google Scholar] [CrossRef] [PubMed]
  36. SEDUMA (Secretaría de Desarrollo Urbano y Medio Ambiente del Gobierno del Estado de Tamaulipas). Programa de Gestión Para Mejorar la Calidad del Aire del Estado de Tamaulipas 2018–2027. 2018. Available online: https://www.gob.mx/cms/uploads/attachment/file/399257/28_ProAire_Tamaulipas.pdf (accessed on 24 October 2021).
  37. NOM (Norma Oficial Mexicana). NORMA Oficial Mexicana NOM-025-SSA1-2014-Salud Ambiental. Secretaría de Salud. 2014. Available online: http://www.dof.gob.mx/nota_detalle.php?codigo=5357042&fecha=20/08/2014 (accessed on 1 October 2021).
  38. Zaręba, M.; Danek, T. Analysis of Air Pollution Migration during COVID-19 Lockdown in Krakow, Poland. Aerosol Air Qual. Res. 2022, 22, 210275. [Google Scholar] [CrossRef]
  39. Rudke, A.P.; de Almeida, D.S.; Alves, R.A.; Beal, A.; Martins, L.D.; Martins, J.A.; Hallak, R.; de Almeida Albuquerque, T.T. Impacts of Strategic Mobility Restrictions Policies during 2020 COVID-19 Outbreak on Brazil’s Regional Air Quality. Aerosol Air Qual. Res. 2022, 22, 210351. [Google Scholar] [CrossRef]
  40. Guo, Q.; Wang, Z.; He, Z.; Li, X.; Meng, J.; Hou, Z.; Yang, J. Changes in Air Quality from the COVID to the Post-COVID Era in the Beijing-Tianjin-Tangshan Region in China. Aerosol Air Qual. Res. 2021, 21, 210270. [Google Scholar] [CrossRef]
  41. Chossière, G.P.; Xu, H.; Dixit, Y.; Isaacs, S.; Eastham, S.D.; Allroggen, F.; Speth, R.L.; Barrett, S.R.H. Air pollution impacts of COVID-19–related containment measures. Sci. Adv. 2021, 7, eabe1178. [Google Scholar] [CrossRef]
  42. Libelium. Smart Environment PRO—Waspmote Gases PRO v30 Board. 2019. Available online: https://development.libelium.com/gases_pro_sensor_guide/sensors#particle-matter-pm1-pm2.5-pm10-dust-sensor (accessed on 17 March 2022).
  43. Sousan, S.; Regmi, S.; Park, Y.M. Laboratory Evaluation of Low-Cost Optical Particle Counters for Environmental and Occupational Exposures. Sensors 2021, 21, 4146. [Google Scholar] [CrossRef]
  44. AQMD (South Coast Air Quality Management District). Laboratory Evaluation Alphasense OPC-N3 Sensor. 2018. Available online: http://www.aqmd.gov/aq-spec/sensordetail/alphasense (accessed on 17 March 2022).
  45. Danek, T.; Zaręba, M. The Use of Public Data from Low-Cost Sensors for the Geospatial Analysis of Air Pollution from Solid Fuel Heating during the COVID-19 Pandemic Spring Period in Krakow, Poland. Sensors 2021, 21, 5208. [Google Scholar] [CrossRef]
  46. Zhang, X.; Tang, M.; Guo, F.; Wei, F.; Yu, Z.; Gao, K.; Jin, M.; Wang, J.; Chen, K. Associations between air pollution and COVID-19 epidemic during quarantine period in China. Environ. Pollut. 2021, 268, 115897. [Google Scholar] [CrossRef] [PubMed]
  47. Zoran, M.A.; Savastru, R.S.; Savastru, D.M.; Tautan, M.N.; Baschir, L.A.; Tenciu, D.V. Exploring the linkage between seasonality of environmental factors and COVID-19 waves in Madrid, Spain. Process. Saf. Environ. Prot. 2021, 152, 583–600. [Google Scholar] [CrossRef]
  48. Stratoulias, D.; Nuthammachot, N. Air quality development during the COVID-19 pandemic over a medium-sized urban area in Thailand. Sci. Total Environ. 2020, 746, 141320. [Google Scholar] [CrossRef] [PubMed]
  49. Lange, C.L.; Smith, V.A.; Kahler, D.M. Pittsburgh Air Pollution Changes During the COVID-19 Lockdown. Environ. Adv. 2022, 7, 100149. [Google Scholar] [CrossRef]
  50. Pérez-Martínez, P.J.; Magalhães, T.; Maciel, I.; de Miranda, R.M.; Kumar, P. Effects of the COVID-19 Pandemic on the Air Quality of the Metropolitan Region of São Paulo: Analysis Based on Satellite Data, Monitoring Stations and Records of Annual Average Daily Traffic Volumes on the Main Access Roads to the City. Atmosphere 2022, 13, 52. [Google Scholar] [CrossRef]
  51. Al-Hemoud, A.; Al-Khayat, A.; Al-Dashti, H.; Li, J.; Alahmad, B.; Koutrakis, P. PM2.5 and PM10 during COVID-19 lockdown in Kuwait: Mixed effect of dust and meteorological covariates. Environ. Challenges 2021, 5, 100215. [Google Scholar] [CrossRef]
  52. Tobías, A.; Carnerero, C.; Reche, C.; Massagué, J.; Via, M.; Minguillón, M.C.; Alastuey, A.; Querol, X. Changes in air quality during the lockdown in Barcelona (Spain) one month into the SARS-CoV-2 epidemic. Sci. Total Environ. 2020, 726, 138540. [Google Scholar] [CrossRef]
  53. Wannaz, E.D.; Valdivia, A.E.L.; Larico, J.A.R.; Peña, J.S.; Huillca, C.V. PM10 correlates with COVID-19 infections 15 days later in Arequipa, Peru. Environ. Sci. Pollut. Res. Int. 2021, 28, 39648–39654. [Google Scholar] [CrossRef]
Figure 1. Daily (24 h) average concentrations of PM 2.5 between February 16 and June 5 in Victoria, Mexico (in highlighted sections, the different periods are indicated).
Atmosphere 13 00827 g001
Figure 2. Daily (24 h) average concentrations of PM 10 between February 16 and June 05 in Victoria, Mexico (in highlighted sections, the different periods are indicated).
Atmosphere 13 00827 g002
Figure 3. Comparison of PM 2.5 concentration by period (BL, DL, and PL) and year, using the Wilcox test.
Atmosphere 13 00827 g003
Figure 4. Contrast of PM 10 concentration by period (BL, DL, and PL) and year, using the Wilcox test.
Atmosphere 13 00827 g004
Table 1. Descriptive analysis and relative change in PM 2.5 ( μ g/m3) between 16 February and 14 March (BL), 15 March and 2 May (DL), and 3 May and 6 June (PL) in Victoria City, Mexico.
Before Lockdown (BL)
STATION201920202021Relative Change (%)
MedianMinMaxMedianMinMaxMedianMinMax2019–20202019–20212020–2021
(IQR)1 (IQR) (IQR)
Total30 (7)54224 (13)173823 (15)349−20.00−23.33−4.16
AQIoT0226 (2)83119 (2)172222 (16)345−26.92−15.3815.79
AQIoT0329 (5)163629 (5)243322 (15)3490.00−24.14−24.14
AQIoT0432 (3)263819 (2)172323 (14)648−40.63−28.1321.05
AQIoT0536 (12)54233 (3)293824 (15)448−8.33−33.33−27.27
During Lockdown (DL)
STATION201920202021Relative Change (%)
MedianMinMaxMedianMinMaxMedianMinMax2019–20202019–20212020–2021
(IQR) (IQR) (IQR)
Total27 (7)54112 (6)62723 (23)552−55.56−14.8191.67
AQIoT0225 (6)53210 (2)71419 (24)547−60.00−24.0090.00
AQIoT0330 (8)144015 (2)101923 (25)651−50.00−23.3353.33
AQIoT0426 (7)19419 (2)61322 (22)752−65.38−15.38144.44
AQIoT0528 (9)94019 (6)142724 (24)652−32.14−14.2926.32
Partial Lockdown (PL)
STATION201920202021Relative Change (%)
MedianMinMaxMedianMinMaxMedianMinMax2019–20202019–20212020–2021
(IQR) (IQR) (IQR)
Total28 (8)74013 (6)72118 (13)350−53.57−35.7138.46
AQIoT0228 (8)73512 (2)91415 (11)340−57.14−46.4325.00
AQIoT0328 (11)83717 (2)132017 (14)446−39.29−39.290.00
AQIoT0426 (4)173111 (2)71319 (15)650−57.69−26.9272.73
AQIoT0531 (7)204017 (5)122120 (11)346−45.16−35.4817.65
1 interquartile range.
Table 2. Median, IQR, minimum and maximum concentration, and variation of PM 10 ( μ g/m3) in the BL, DL, and PL periods of 2019, 2020, and 2021.
Before Lockdown (BL)
STATION201920202021Relative Change (%)
MedianMinMaxMedianMinMaxMedianMinMax2019–20202019–20212020–2021
(IQR)1 (IQR) (IQR)
Total33 (9)84425 (12)184026 (20)361−24.24−21.214.00
AQIoT0229 (3)113421 (3)182424 (19)456−27.59−17.2414.29
AQIoT0332 (6)183933 (5)253625 (21)3613.13−21.88−24.24
AQIoT0437 (3)334222 (2)202526 (18)760−40.54−29.7318.18
AQIoT0538 (12)84435 (2)324026 (21)560−7.89−31.58−25.71
During Lockdown (DL)
STATION201920202021Relative Change (%)
MedianMinMaxMedianMinMaxMedianMinMax2019–20202019–20212020–2021
(IQR) (IQR) (IQR)
Total29 (6)94313 (8)72826 (29)565−55.17−10.34100.00
AQIoT0228 (6)93511 (2)81523 (29)559−60.71−17.86109.09
AQIoT0332 (7)164117 (2)112129 (32)663−46.88−9.3870.59
AQIoT0430 (5)224310 (2)71427 (28)965−66.67−10.00170.00
AQIoT0531 (9)114220 (6)152826 (30)763−35.48−16.1330.00
Partial Lockdown (PL)
STATION201920202021Relative Change (%)
MedianMinMaxMedianMinMaxMedianMinMax2019–20202019–20212020–2021
(IQR) (IQR) (IQR)
Total31 (7)94215 (6)92320 (14)360−51.61−35.4833.33
AQIoT0231 (9)93814 (2)111616 (12)348−54.84−48.3914.29
AQIoT0330 (10)114019 (2)172218 (17)557−36.67−40.00−5.26
AQIoT0431 (5)213613 (2)91521 (18)760−58.06−32.2661.54
AQIoT0533 (7)224218 (5)142322 (13)456−45.45−33.3322.22
1 interquartile range.
Publisher’s Note: MDPI stays neutral with regard to jurisdictional claims in published maps and institutional affiliations.

