
Numerical Evaluation of a Novel Vertical Drop Airflow System to Mitigate Droplet Transmission in Trains


Technical Regulations and Standards Research Department, Korea Railroad Research Institute, Uiwang-si 16105, Gyeonggi-do, Korea
*
Author to whom correspondence should be addressed.
Atmosphere 2022, 13(5), 829; https://0-doi-org.brum.beds.ac.uk/10.3390/atmos13050829
Submission received: 13 April 2022
/
Revised: 2 May 2022
/
Accepted: 16 May 2022
/
Published: 18 May 2022
(This article belongs to the Section Atmospheric Techniques, Instruments, and Modeling)
Abstract
:Owing to the outbreak of COVID-19, researchers are exploring methods to prevent contact and non-contact infections that occur via multiple transmission routes. However, studies on preventing infections caused by droplet transmission in public transportation are insufficient. To prevent the spread of infectious diseases, a new ventilation system in railway vehicles must be developed. In this study, a novel vertical drop airflow (VDA) system is proposed to mitigate the effect of droplet transmission in a high-speed train cabin. The droplet transmission route and droplet fate are investigated using three-dimensional fluid dynamics simulations, performed employing the Eulerian–Lagrangian model. Additionally, a porous model is adopted to simulate the effect of close-fitting masks. The results indicate that 120 s after coughing, the decrease in the droplet number in the VDA system is 72.1% of that observed in the conventional system. Moreover, the VDA system effectively suppresses droplet transmission because the maximum droplet travel distances of the VDA systems are 49.9% to 67.0% of those of the conventional systems. Furthermore, the effect of reducing droplet transmission by wearing a close-fitting mask is confirmed in all systems. Thus, the decrease in both droplet number and droplet transmission area in train cabins validate that the proposed VDA system has an effective airflow design to prevent droplet infection.
1. Introduction
COVID-19 has infected millions of people worldwide since its inception in December 2019 [1]. This pandemic has resulted in public panic and economic losses on a global scale [2]. COVID-19 can be transmitted via contact and non-contact routes [3]. Non-contact infection occurs when virus-laden droplets from an infected person spread through the air [4]. Moreover, COVID-19 can survive in droplet form for 3 h in indoor environmental conditions [5]. Therefore, the analysis of transmission routes of droplets is essential to eliminate them in a closed space with numerous people.
Public transport is vulnerable to droplet infections because passengers stay in confined spaces for several hours. Furthermore, COVID-19 droplets can travel through the air for a distance of over 2 m as the air is circulated in the heating, ventilation, and air-conditioning system inside the cabin [6]. Since 2020, cases of infection have been reported in various public transportation systems. On a cruise ship, approximately 700 cases of COVID-19 were laboratory-confirmed among passengers and crew [7]. In an airplane, laboratory-confirmed COVID-19 was detected in 12 patients after a five-hour flight [8]. Based on epidemiological evidence obtained from outbreak investigations, one study reported the possibility of droplet transmission of COVID-19 in a bus [9]. The epidemiological investigations of COVID-19 cases and their close contacts determined that the infection risk is high when passengers are seated within a distance of three rows and five columns from the patient in a train [10]. Therefore, extensive studies on droplet transmission in public transportation are required to ensure passenger safety.
In train ventilation systems, various airflow designs such as the ceiling inlet/ceiling outlet, ceiling inlet/floor outlet, and sidewall inlet/side wall outlet systems have been developed for increasing thermal comfort and spatial homogeneity [11]. However, these designs, which are not based on droplet transmission analysis, possess the risk of the droplet spread in the cabin. Woodward et al. [12] investigated experimentally that air mixing occurred well in the height and width direction in the intercity train of the ceiling inlet/outlet system. Furthermore, Wang et al. [13] reported that the maximum infection probability in Chinese long-distance trains with the ceiling inlet/side wall outlet system was 10.3%. In airplane ventilation systems, air enters the cabin from the overhead inlet and flows downward toward floor outlets at the sidewall. This could reduce air mixing between the front and rear seats. However, Yan et al. [14] reported that the droplet transmission in the window-seat passenger spread widely, which could lead to high exposure risks to nearby passengers. Therefore, to prevent droplet transmission in public transportation, a novel ventilation system of the vertical drop airflow (VDA) design is proposed in this study. The proposed VDA system was designed to exhaust the droplets expelled from the infected person to the bottom of the cabin area through a strong downstream airflow. Furthermore, the inlets and outlets were located properly for each seat such that the droplet travel distance was reduced.
Computational fluid dynamics (CFD) is actively used in the analysis of droplet transmission routes so they can be visualized [15]. Several studies have analyzed droplet transmission routes in restaurants [16], classrooms [17], hospitals [18], skilled nursing facilities [19], and buses [20,21]. Through the experiment of particle image velocimetry measurement, the validity of a CFD simulation study on air flow was verified [22]. The simulation method for the droplet transmission route analysis is divided into tracer gas and droplet particle tracking methods, which employ the Eulerian and Eulerian–Lagrangian methods, respectively. The tracer gas method has the advantages of lower computation time and convenient simulation accessibility. However, this method exhibited lower accuracy than the droplet particle tracking method owing to the difficult implementation of various drag forces on the droplet [23]. Therefore, this study employed the droplet particle tracking method for analyzing the droplet transmission in the train cabin [24].
Various studies to prevent droplet transmission of the COVID-19 infection were conducted in 2021. Lee et al. [25] reported that wearing a face mask reduces the transmittance distance of droplets by approximately 90–95% depending on the mask type. Heo et al. [26] investigated the effect of air purifiers on the spread of COVID-19. Ren et al. [27] reported that 70-cm-high barriers in workstations could reduce the risk of infection by 72%. Sha et al. [28] reported that the optimal control of building ventilation systems could reduce both infection risk and energy consumption. These studies suggested masks, air purifiers, barriers, and ventilation controls to prevent droplet transmission, but did not perform airflow design studies.
The aforementioned review of existing studies reveals that investigations on droplet transmission and reduction of infection risk in high-speed train cabins are limited, as shown in Table 1. Furthermore, research on mitigating droplet transmission through the novel design of airflow systems in public transportation is insufficient. Despite the mandated wearing of masks, studies on the effectiveness of masks in cabins are also insufficient.
The objective of this study is to evaluate the mitigating effect of droplet transmission in the novel VDA system of the high-speed train, comparing it with the conventional system. Three-dimensional (3D) fluid dynamics used the droplet particle tracking method with the Eulerian–Lagrangian model to analyze the droplet transmission. Droplet transmission in the conventional and VDA systems was compared for 120 s after an infected person coughed. The airflow streamlines, droplet route, droplet number, droplet fate, and droplet travel distance were investigated. Additionally, the effect of preventing droplet transmission while wearing a mask was analyzed.
2. Methodology
2.1. Simulation Domain
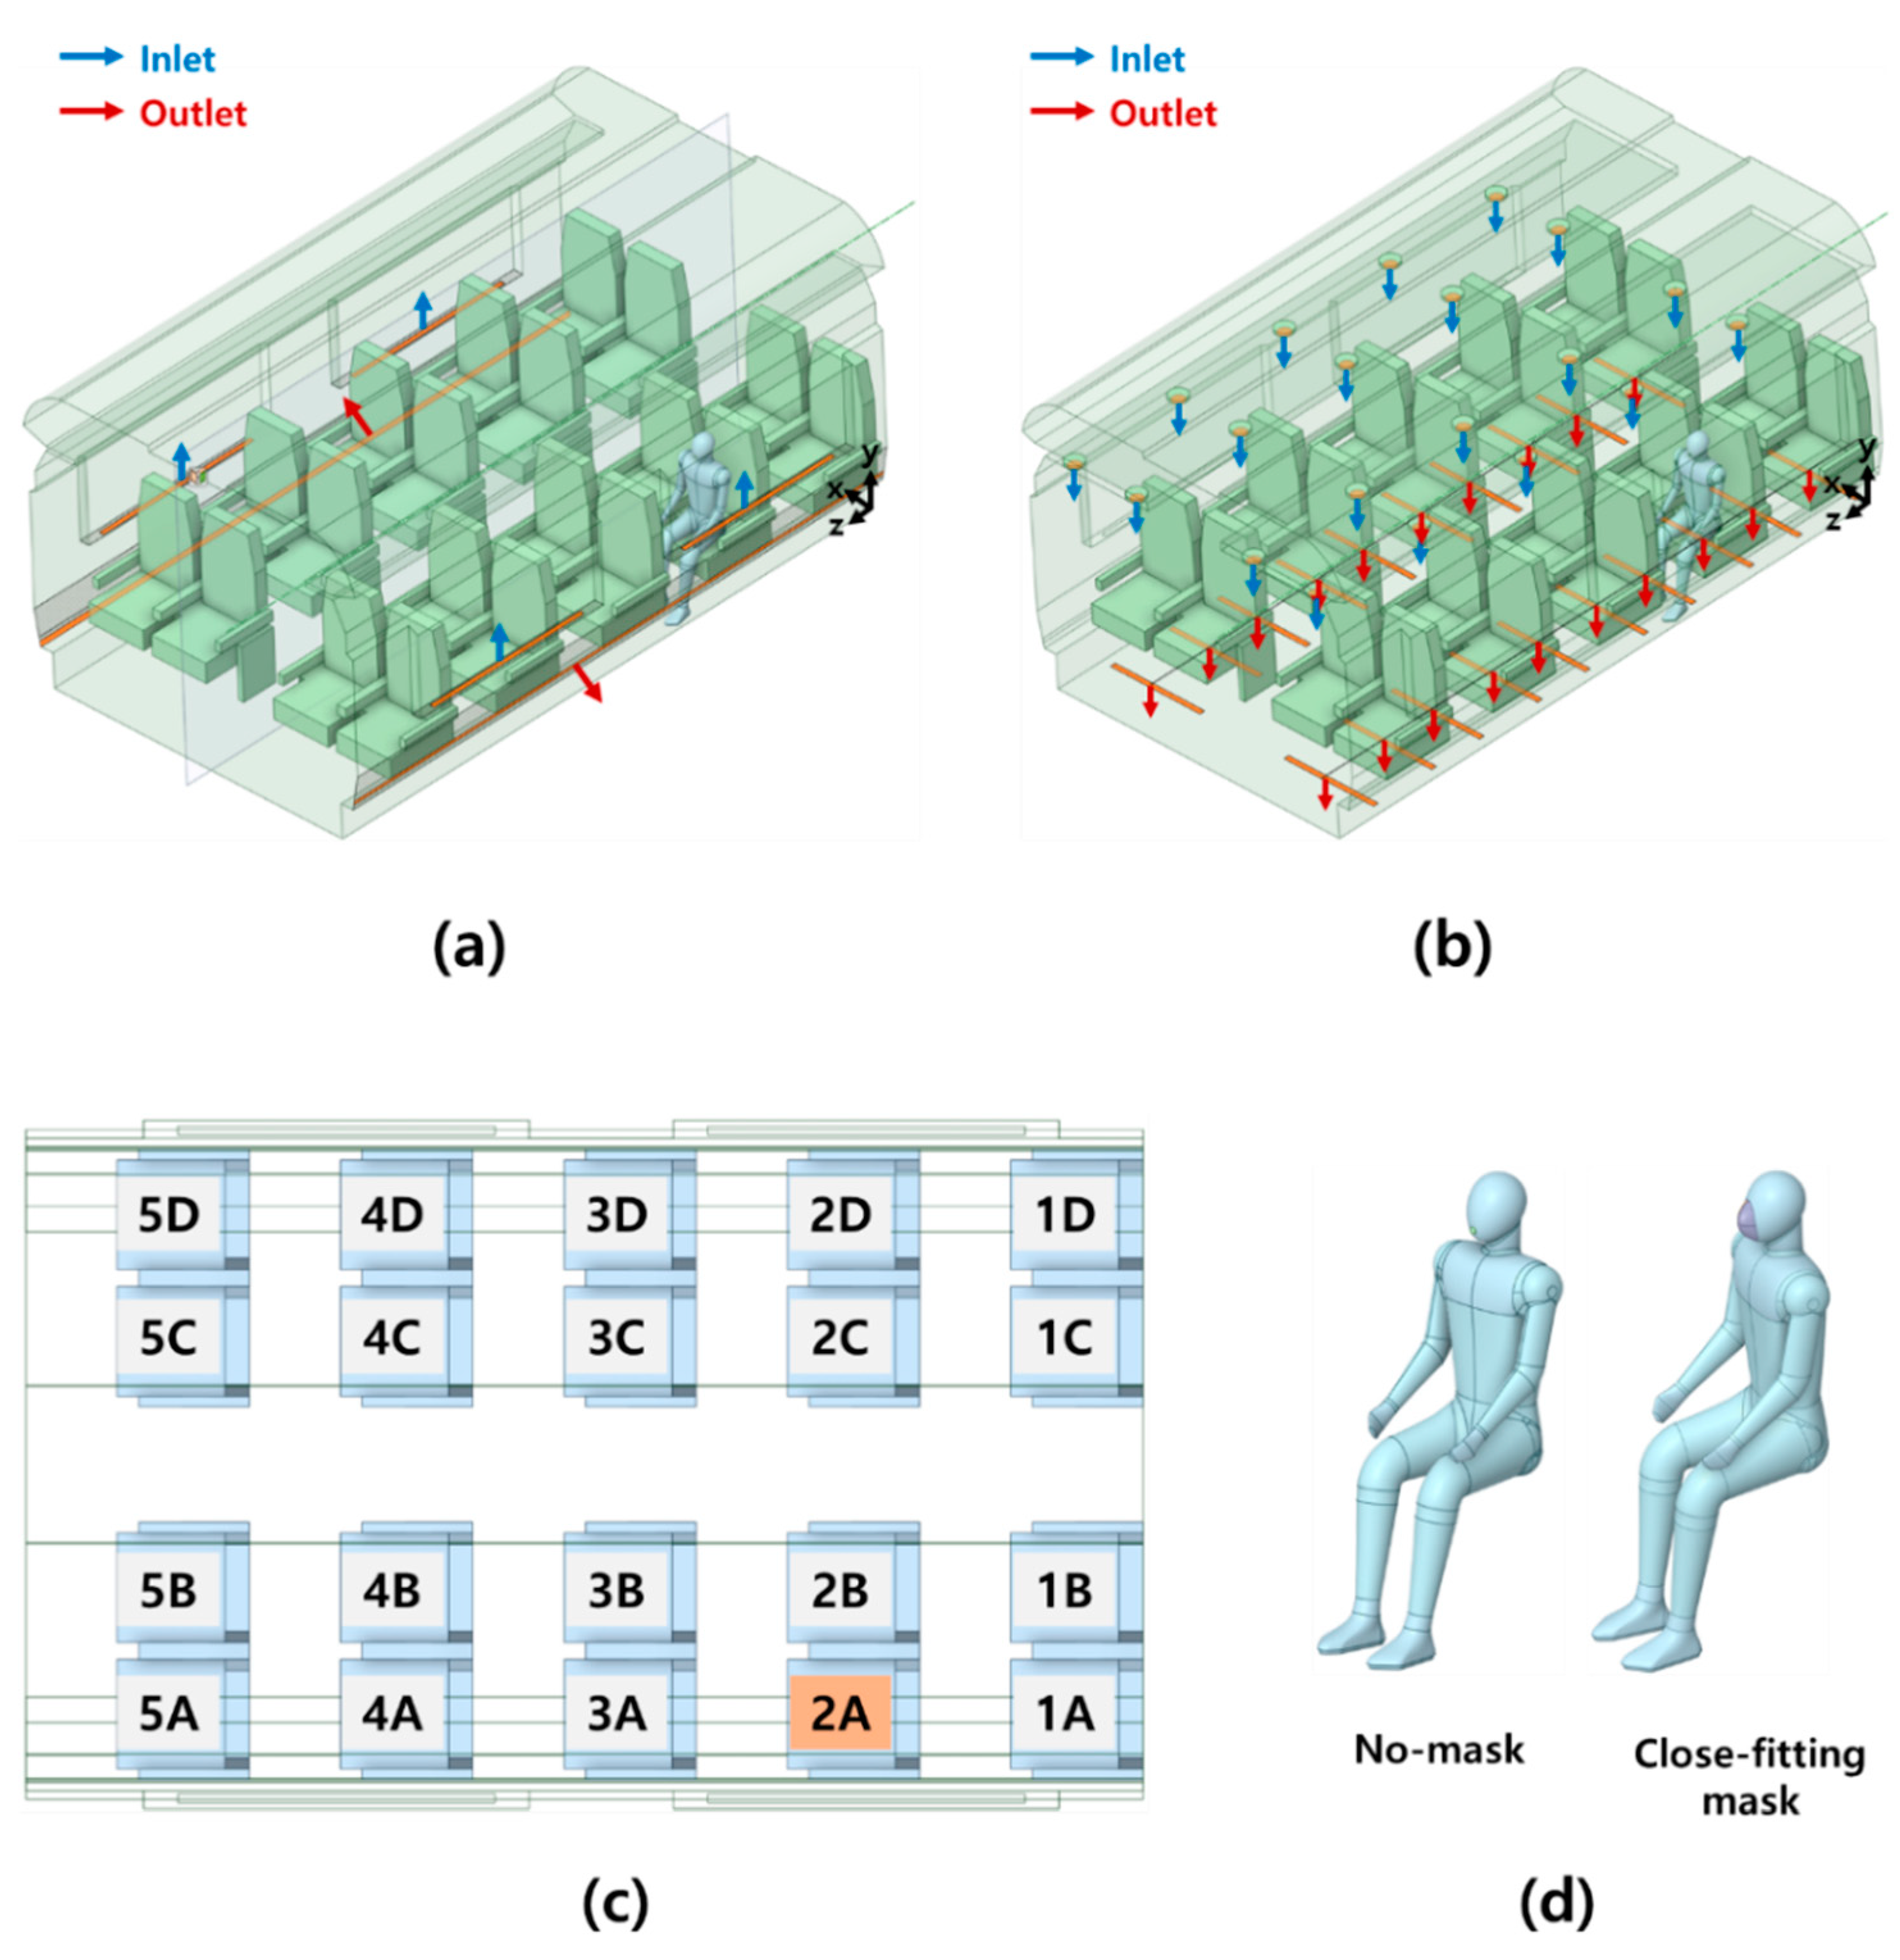
Figure 1 depicts the simulation domain and schematic structure of the high-speed train cabin. A five-column section of a realistic high-speed train cabin was adopted to reduce the calculation time. The cabin length, width, and height were 4650 mm, 2862 mm, and 2196 mm, respectively. The distance between the seats was 930 mm. In a conventional system, two inlets were located adjacent to the window in each row, and one outlet was located at the bottom sidewall of each row, as shown in Figure 1a. The conventional system was designed based on the Korea train express (KTX). The proposed VDA system was designed with twenty inlets and outlets for each seat on the ceiling and floor of the cabin to create vertical downward airflow, as shown in Figure 1b. The difference in the ventilation rates between the conventional and VDA systems was 1.1%. All seats were identified (Figure 1c), and the infected person was seated at 2A. Droplet transmission was investigated in the conventional and VDA systems for 120 s after an infected person coughed once. The height of the person was 1130 mm, and the height of the mouth from the floor was 1000 mm. As depicted in Figure 1d, a person wearing a 1-mm-thick close-fitting mask with an area of 7332 mm2 was designed to simulate the case of wearing a mask. Table 2 and Table 3 summarize the specifications of the high-speed train cabin and geometric parameters of the conventional and VDA systems, respectively.
2.2. Simulation Model
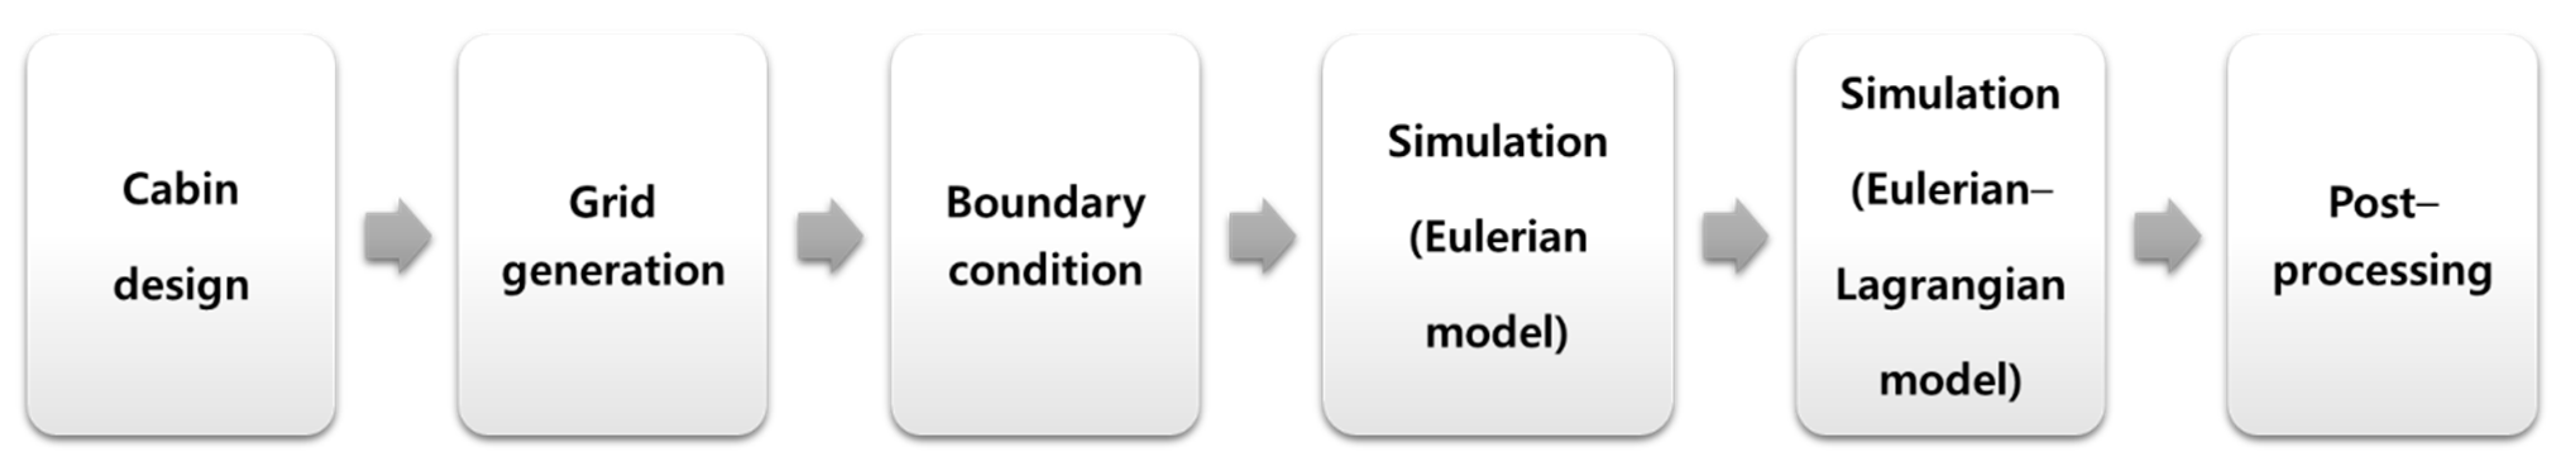
Figure 2 illustrates the flowchart of the simulation. The first step involved designing high-speed cabins in conventional and VDA systems using the SpaceClaim 2021 R1. The second step generated a grid using ANSYS Mesh 2021 R1. In the third step, fluid dynamics simulations with the Eulerian model were performed until the streamline of the airflow reached a steady state using the commercial CFD software, namely CFX 2021 R1. In the fourth step, fluid dynamics simulations tracked the droplet particle using the Eulerian–Lagrangian model. Finally, post-processing of the simulation results was performed using the CFD-Post 2021-R1. The simulation model was developed based on the following assumptions [21]:
- The influence of droplets on airflow is negligible;
- Droplets are assumed to be ideally shaped spheres;
- Coagulation of droplets is negligible;
- The energy equation is negligible;
- The droplet expelled from the patient’s mouth does not evaporate.
2.2.1. Eulerian Model
The governing equations of continuity and momentum in the simulation domain are presented in Equations (1) and (2), respectively [29].
where V donates the velocity and ρ indicates the density. In addition, p′ donates the modified pressure, and μe indicates the effective viscosity.
2.2.2. Lagrangian Model
Considering that the droplet travels in the fluid domain, the dominant forces on the particle motion are the drag force (FD) and buoyancy force (FB), as expressed in Equation (3) [33].
The drag force can be calculated using Equation (4).
where AF denotes the effective particle cross-section, and CD indicates the drag coefficient, which is derived using the Schiller–Naumann drag model [34], as follows:
where Rep denotes the particle Reynolds number, and dp indicates the particle diameter.
The buoyancy force can be expressed as shown in Equation (7).
2.2.3. Mask Model
The mask was assumed to be a porous domain to simulate the flow through it [35]. The porous model in the mask can be expressed using Equation (8).
where df denotes the mask thickness, D indicates the Darcy coefficient, and I represent the inertial coefficient. The Darcy coefficient can be determined as [36]:
where ξ denotes the packing density of the fibrous porous material, and dp,c indicates the critical diameter. According to a previous study [37], the inertial coefficient can be calculated using Equation (10) as:
where the value of the mask porosity is 0.88, and the filtration efficiency is obtained from another study [25].
2.3. Boundary Conditions
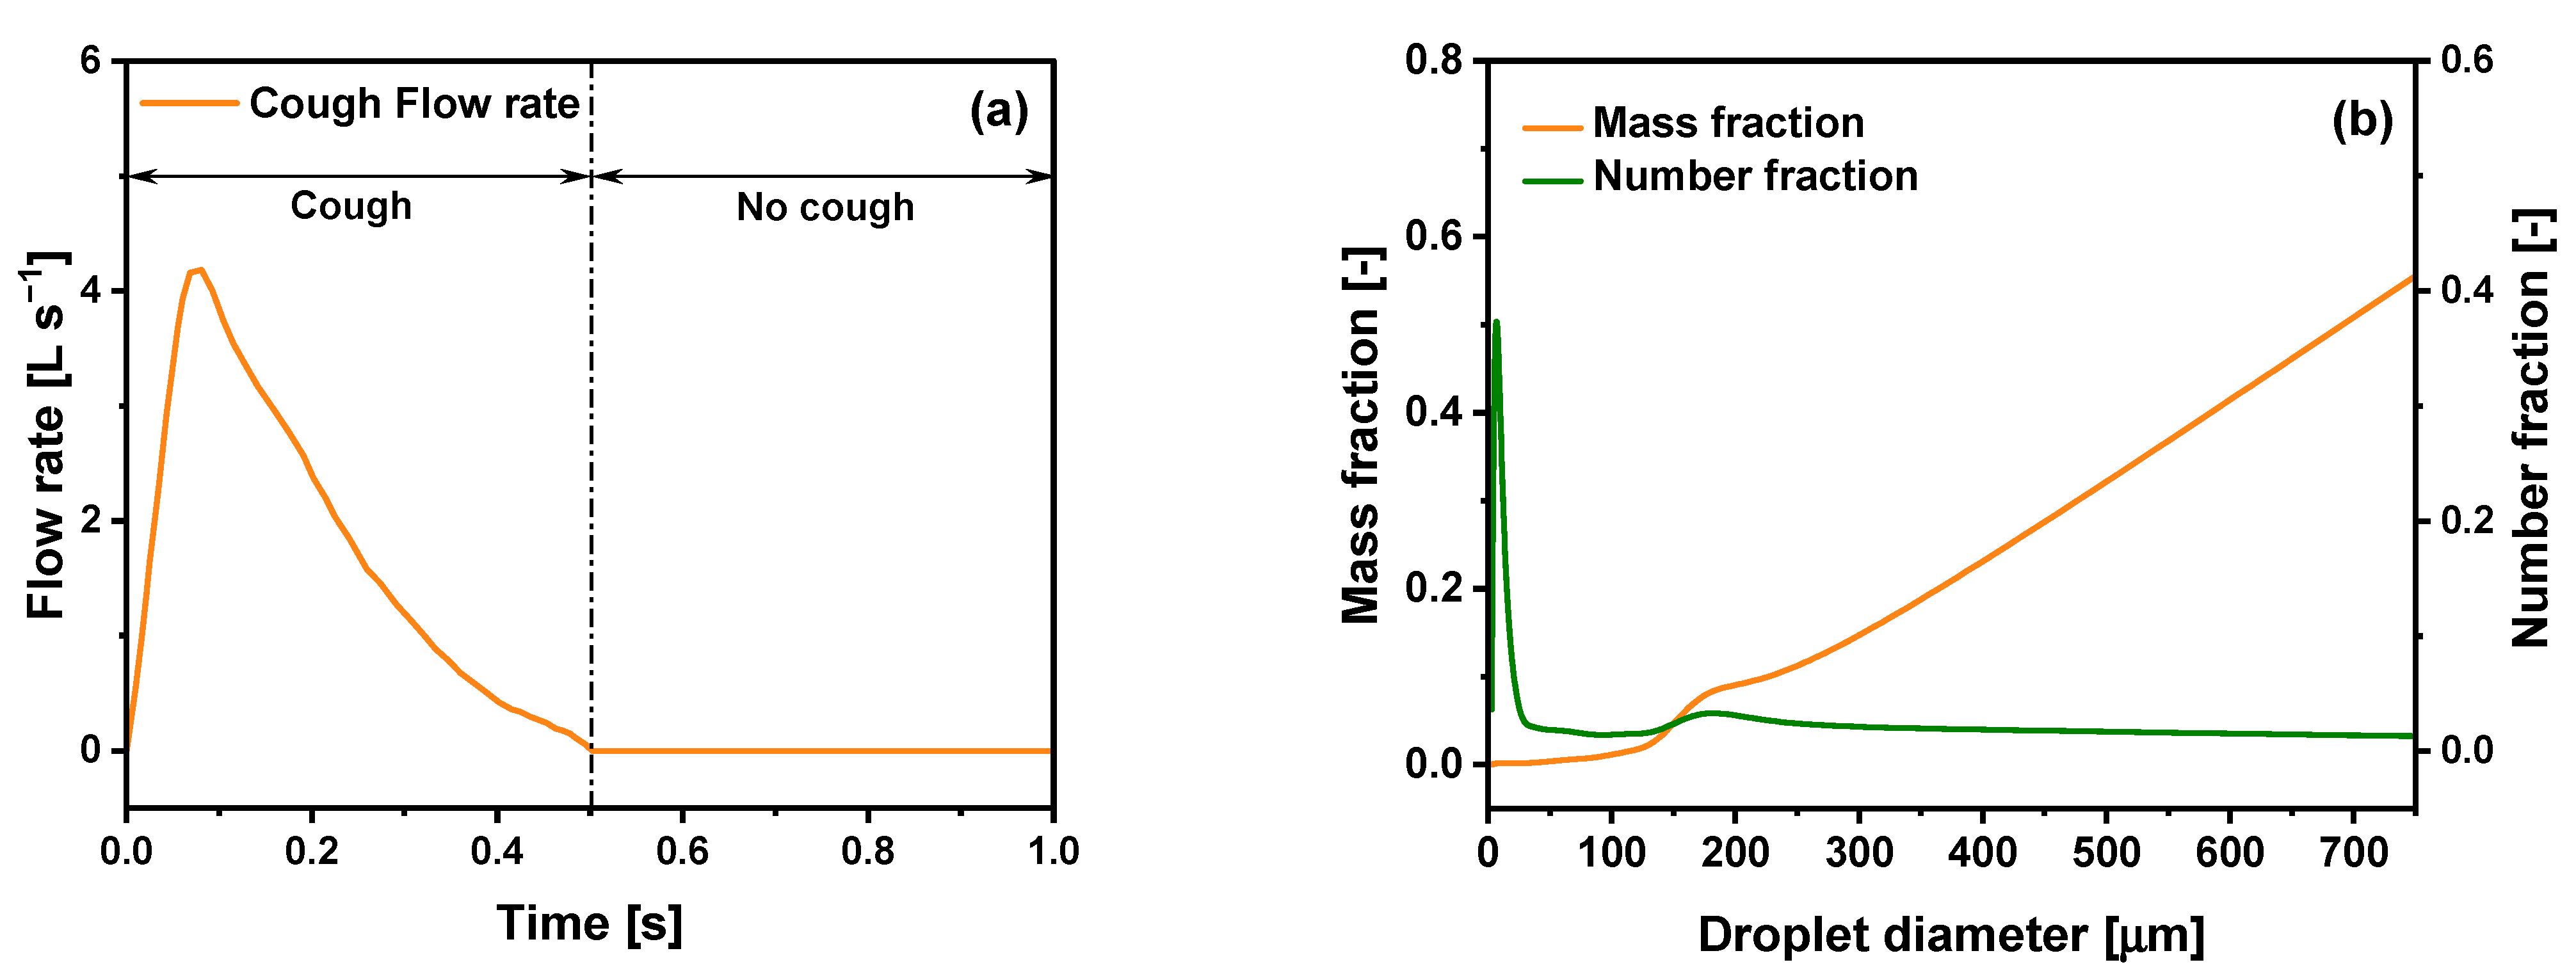
Figure 3a depicts the cough flow rate applied by a pulse air jet with a duration of 0.5 s on the mouth surface. The experimental data [38] of the cough flow rate were applied to the boundary condition as a user-defined function. The mouth was maintained open after coughing as it is difficult to simulate the movement of the mouth. The initial conditions of the mass and number fractions of the droplets were applied based on the experimental data [39], as depicted in Figure 3b. The total number of droplets in one cough was 1850 [40]. Droplets were composed of 90% liquid water and 10% sodium chloride [21]. In the cabin, the inlet velocity was set to 1 m s−1, and the outlet pressure was set to 1 atm. The wall was set under the deposition condition.
2.4. Validation
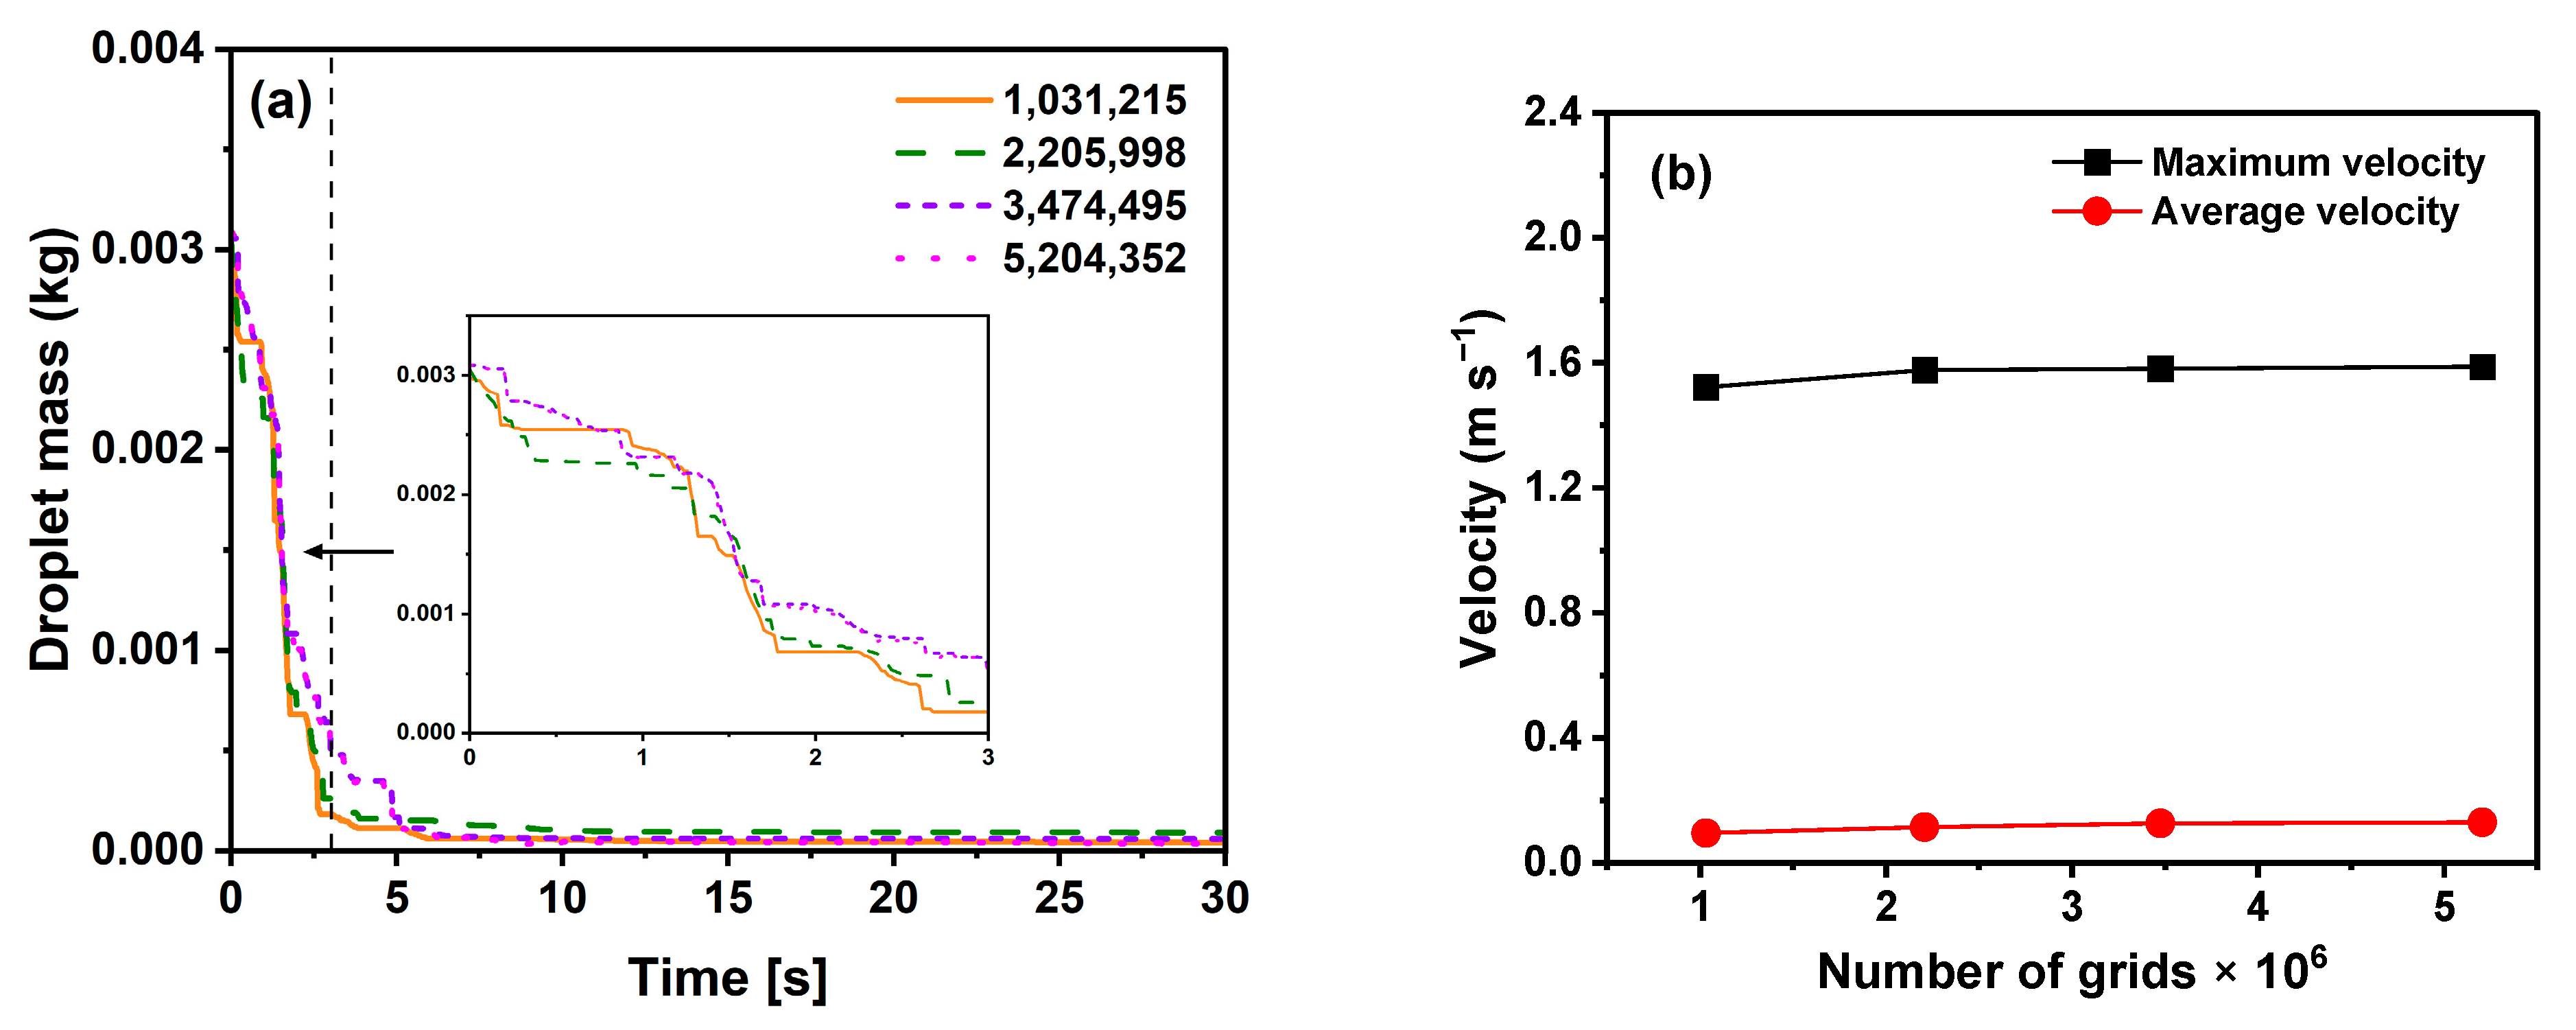
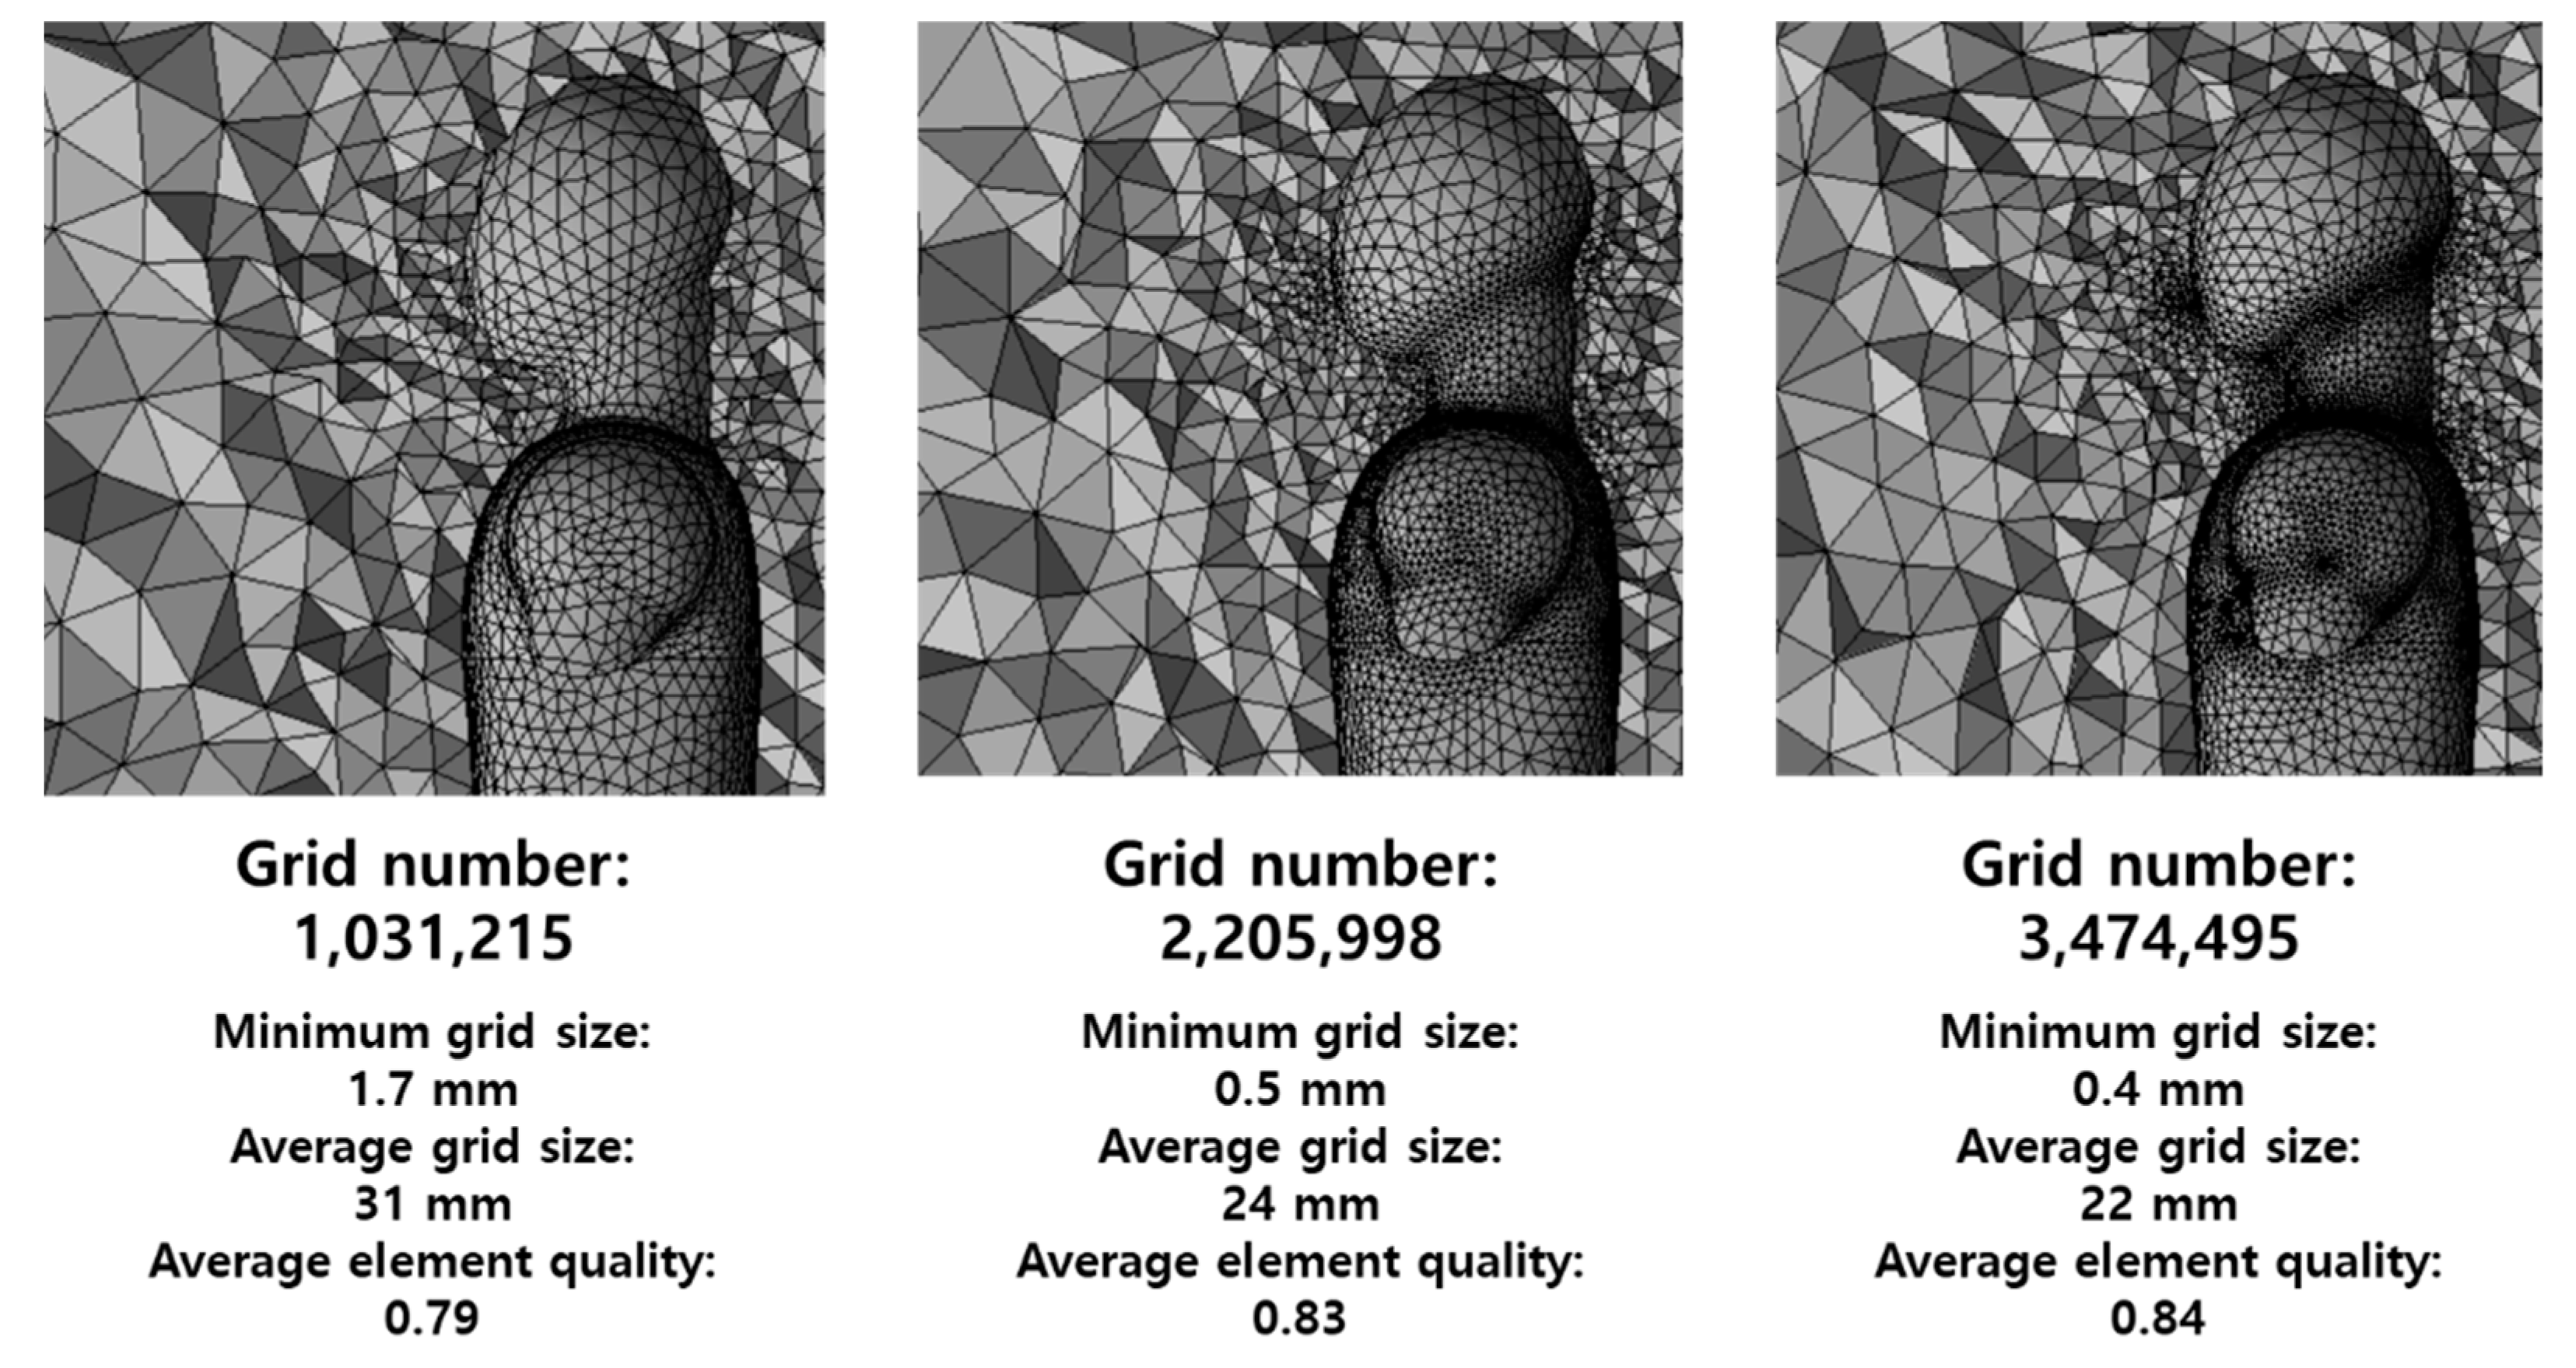
Grids were dominantly generated on the mouth, inlet, outlet, and mask. As depicted in Figure 4, grid-dependency tests were performed for the conventional system with no mask [41,42]. During the 3 s, a significant difference was observed in the droplet mass depending on the number of grids because a turbulent cloud with numerous droplets was spread out of the mouth during coughing, as shown in Figure 4a [43]. As illustrated in Figure 5, a finer grid in the cough cloud area was generated with an increase in the grid number. A grid number of 3.4 million was selected owing to its trend of the mass droplet and velocity similar to that of 5.2 million grids. Moreover, from the grid number of 3.4 million, the average element quality was higher than 0.8. The time-dependency test was conducted with five timesteps of 0.01, 0.02, 0.04, 0.08, and 0.1 s. The results indicate that the variations in droplet masses were within 1.9% for the timesteps less than 0.02 s. During the simulation time of 120 s, physical computation times of 26 and 52 h were required for timesteps of 0.01 and 0.02 s, respectively. Therefore, the timestep of 0.02 s was set to reduce computation time.
3. Results and Discussion
3.1. Comparison of Conventional and VDA Systems
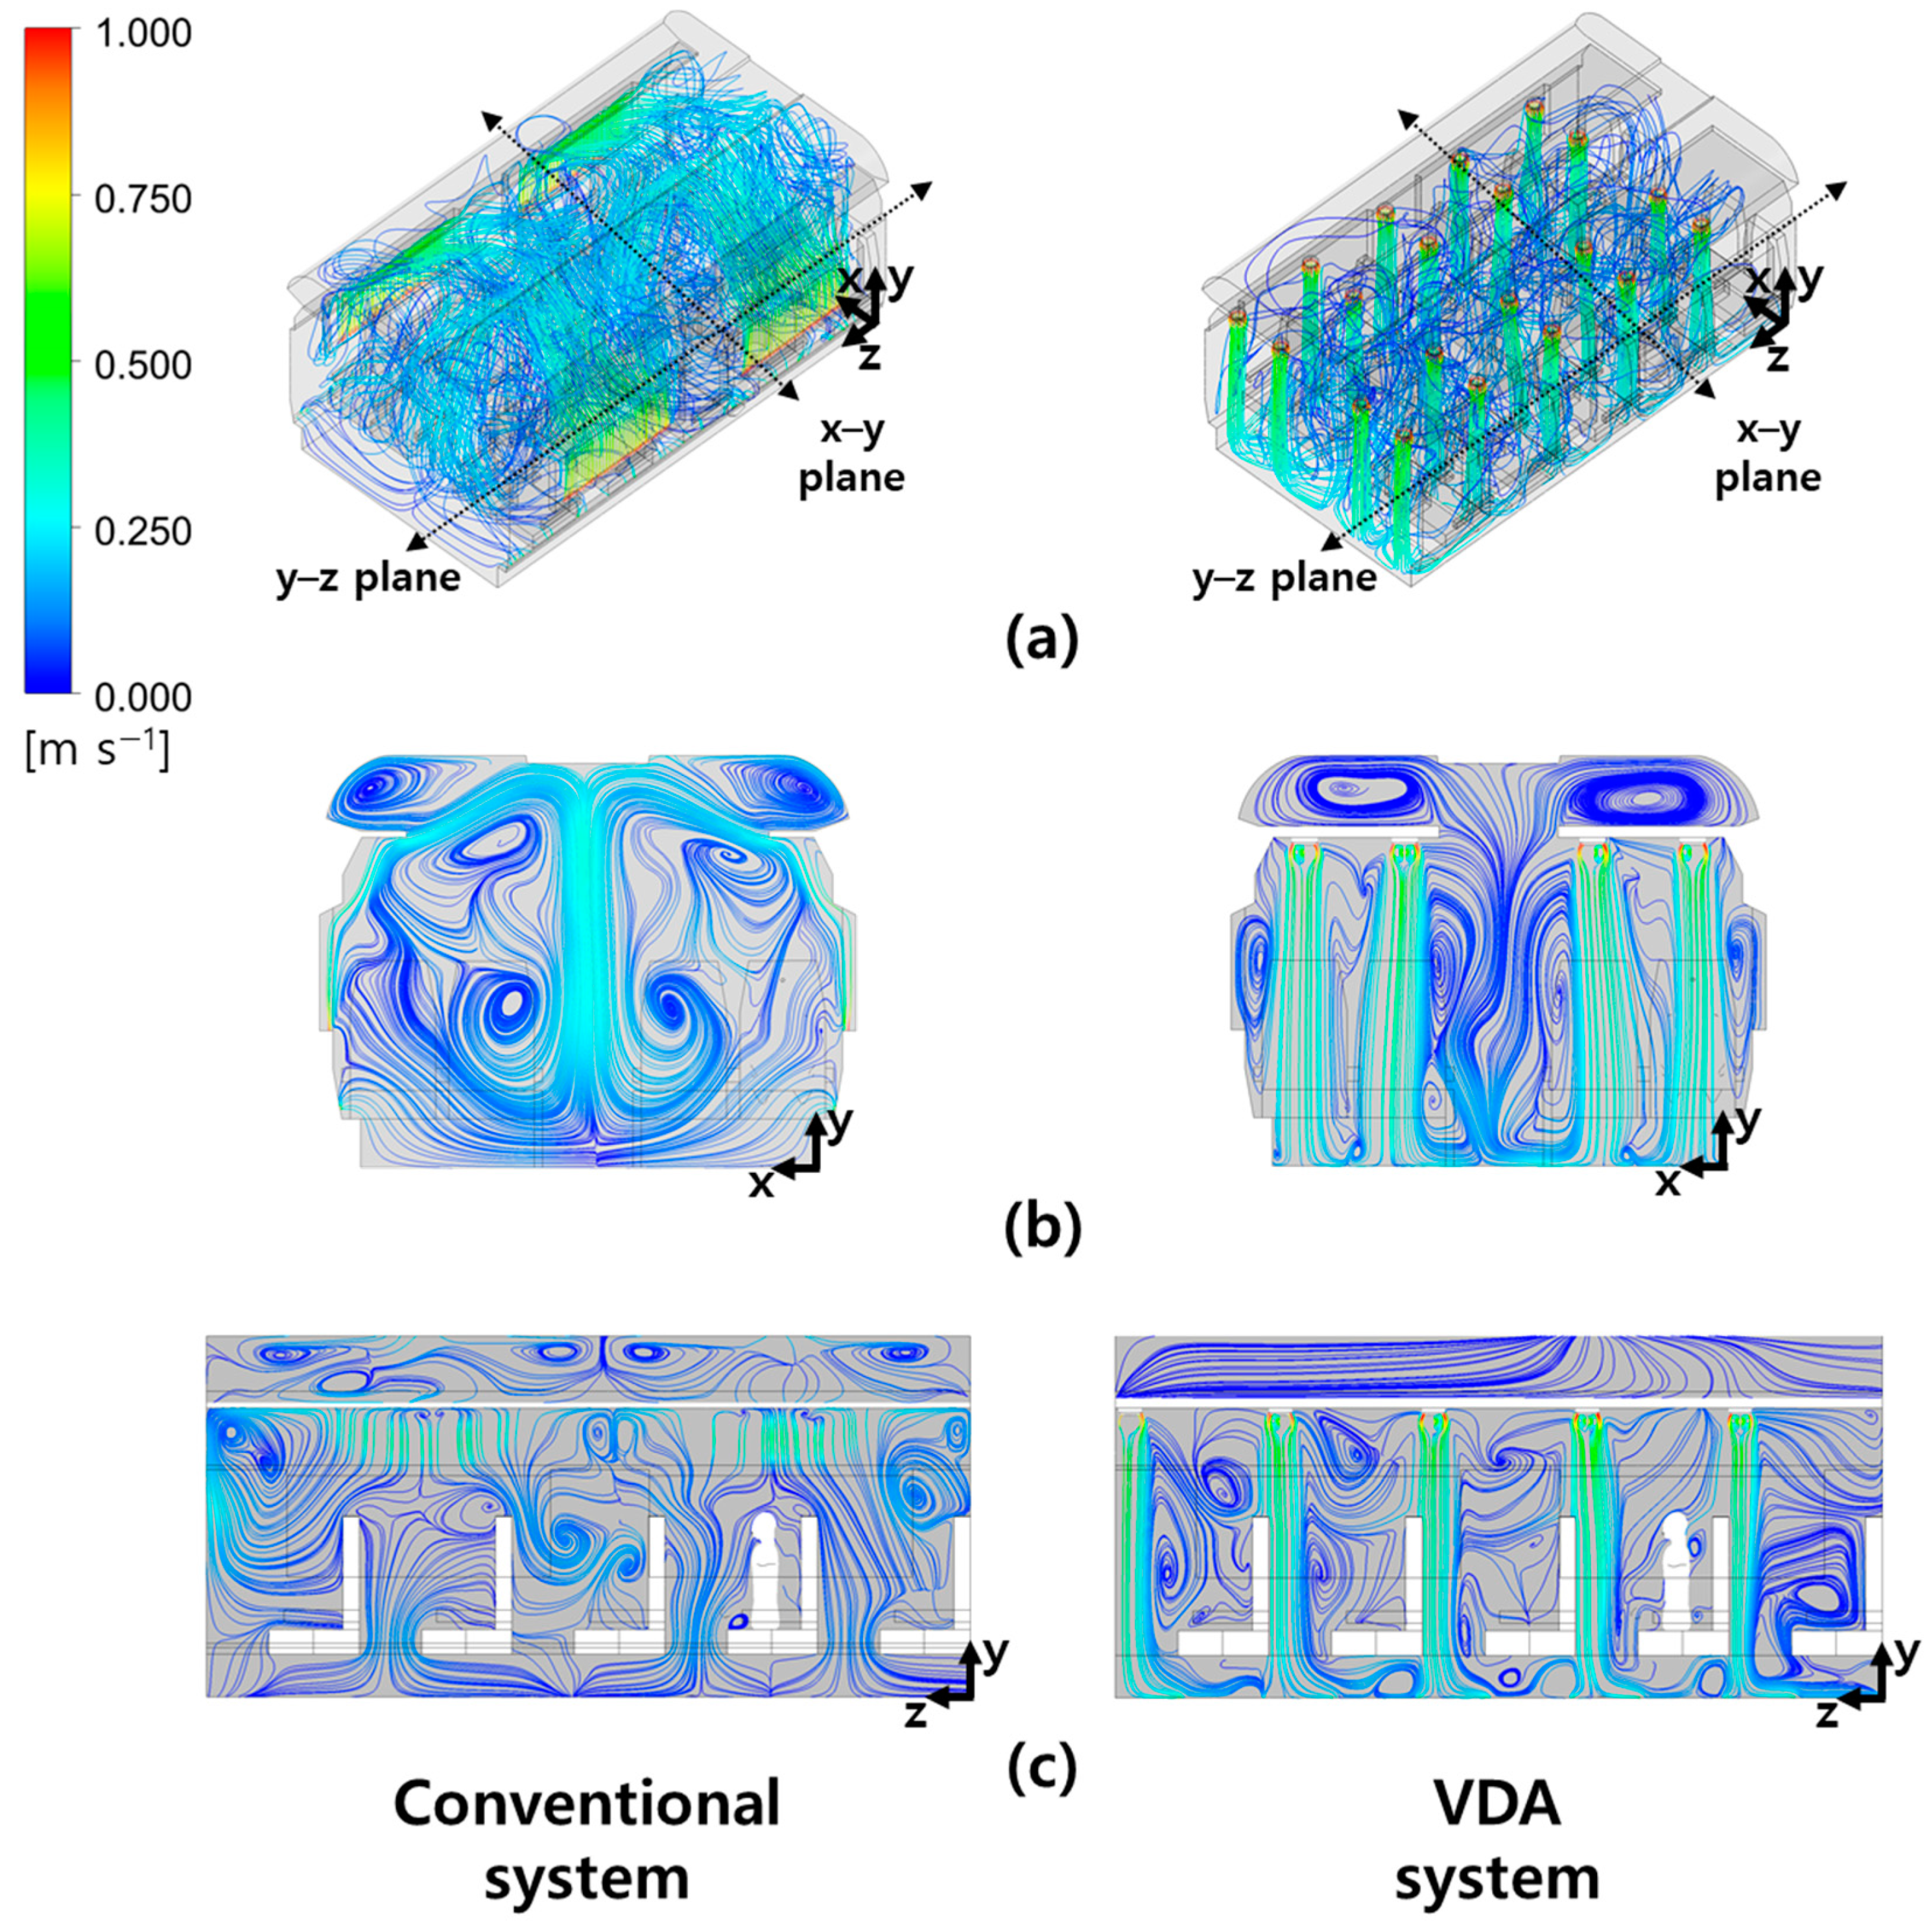
Figure 6 depicts the streamlines in the high-speed train cabins of the conventional and VDA systems. In the conventional system, airflow was exhausted through the inlet near the window and moved to the top of the cabin. A large vortex was generated around two seats as the airflow reaching the ceiling of the room converged in the corridor, with the airflow discharged from the opposite side. Subsequently, the flow reached the corridor floor and formed a small vortex. A certain portion of the airflow moved toward the outlet, and the remaining portion rose to the top of the seat. The streamline in the x–y direction exhibited the shape of a rotational flow surrounding the two seats. The streamline in the y–z direction exhibited airflow diffusion to the bottom and top of the seat. In the VDA system, most airflows moved from the inlet to the outlet rapidly owing to the downward airflow design. Furthermore, a small vortex was formed in certain sections at the top and bottom of the seat. Overall, the VDA system exhibited a lower airflow circulation in the cabin than the conventional system.
Figure 7 depicts the droplet distribution of the conventional and VDA systems between 0 and 10 s after coughing; a relative droplet size was observed. In the conventional system, droplets of 100 µm or more descended directly under the seat in the initial stage after coughing because of gravity. Droplets smaller than 100 µm began to deposit as they reached the back surface of the front seat. After 5 s of coughing, most of the non-deposited droplets descended; however, droplets smaller than 10 µm began to rise upward under the influence of airflow in the cabin. After 10 s of coughing, only small droplets remained and rose to the ceiling. Therefore, large droplets exhibited a high risk of contact infection on the back surface of the front seat because of their quick deposition, whereas small droplets showed a high risk of non-contact infection as they were floating in the cabin. In the VDA system, all droplets descended regardless of the diameter at the initial stage after coughing, owing to the influence of a strong downward airflow. After 3 s of coughing, most of the droplets moved to the outlet area at the bottom of the seat, and after 10 s, only a few droplets smaller than 10 µm appeared to spread under the seat. Overall, the VDA system mitigated droplet transmission in the cabin by blocking the rise of droplets to the upper part of the cabin.
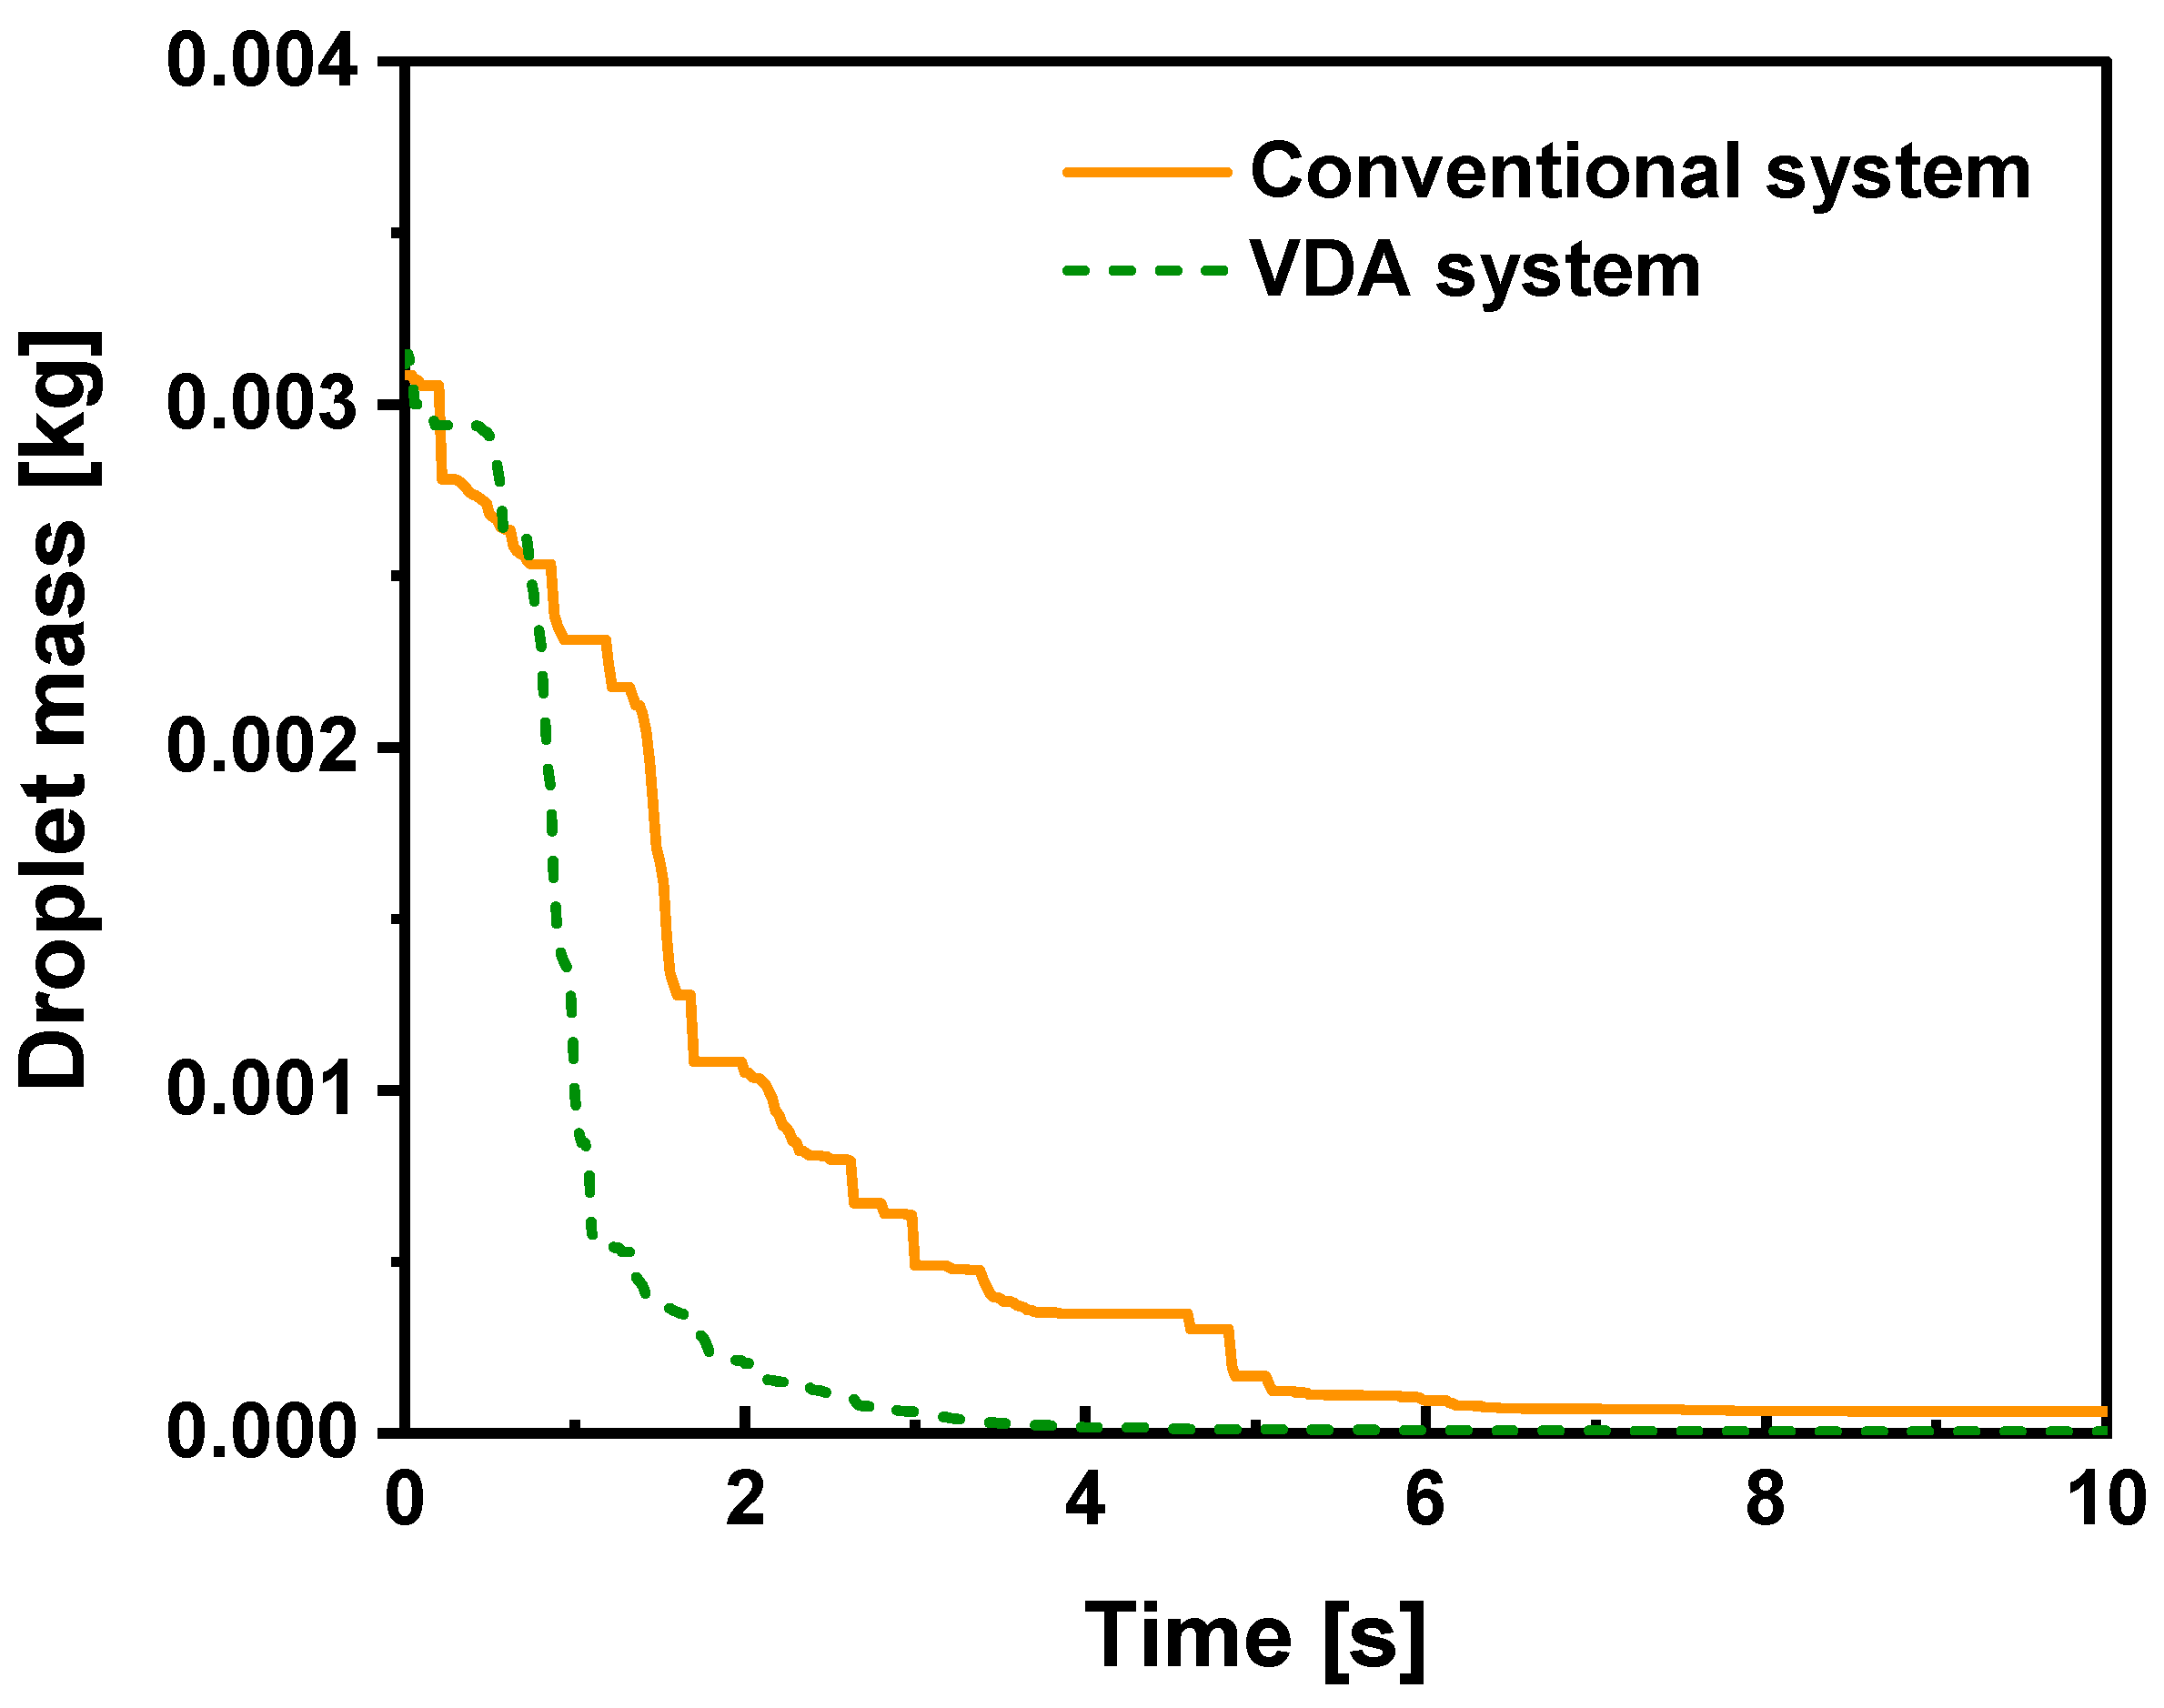
Figure 8 illustrates the variation in the droplet mass of the conventional and VDA systems according to the time after coughing. In the initial stage after coughing, both conventional and VDA systems exhibited a similar tendency of decreasing the droplet mass owing to its deposition on the back surface of the front seat. However, after 1.2 s, the droplet mass in the VDA system decreased more rapidly than that in the conventional system. This was because the droplets were exhausted through the outlet on the floor with a short traveling path. In the conventional system, the droplet mass decreased relatively slowly until 8 s, because a long travel distance is required for the droplets to be exhausted through the outlet.
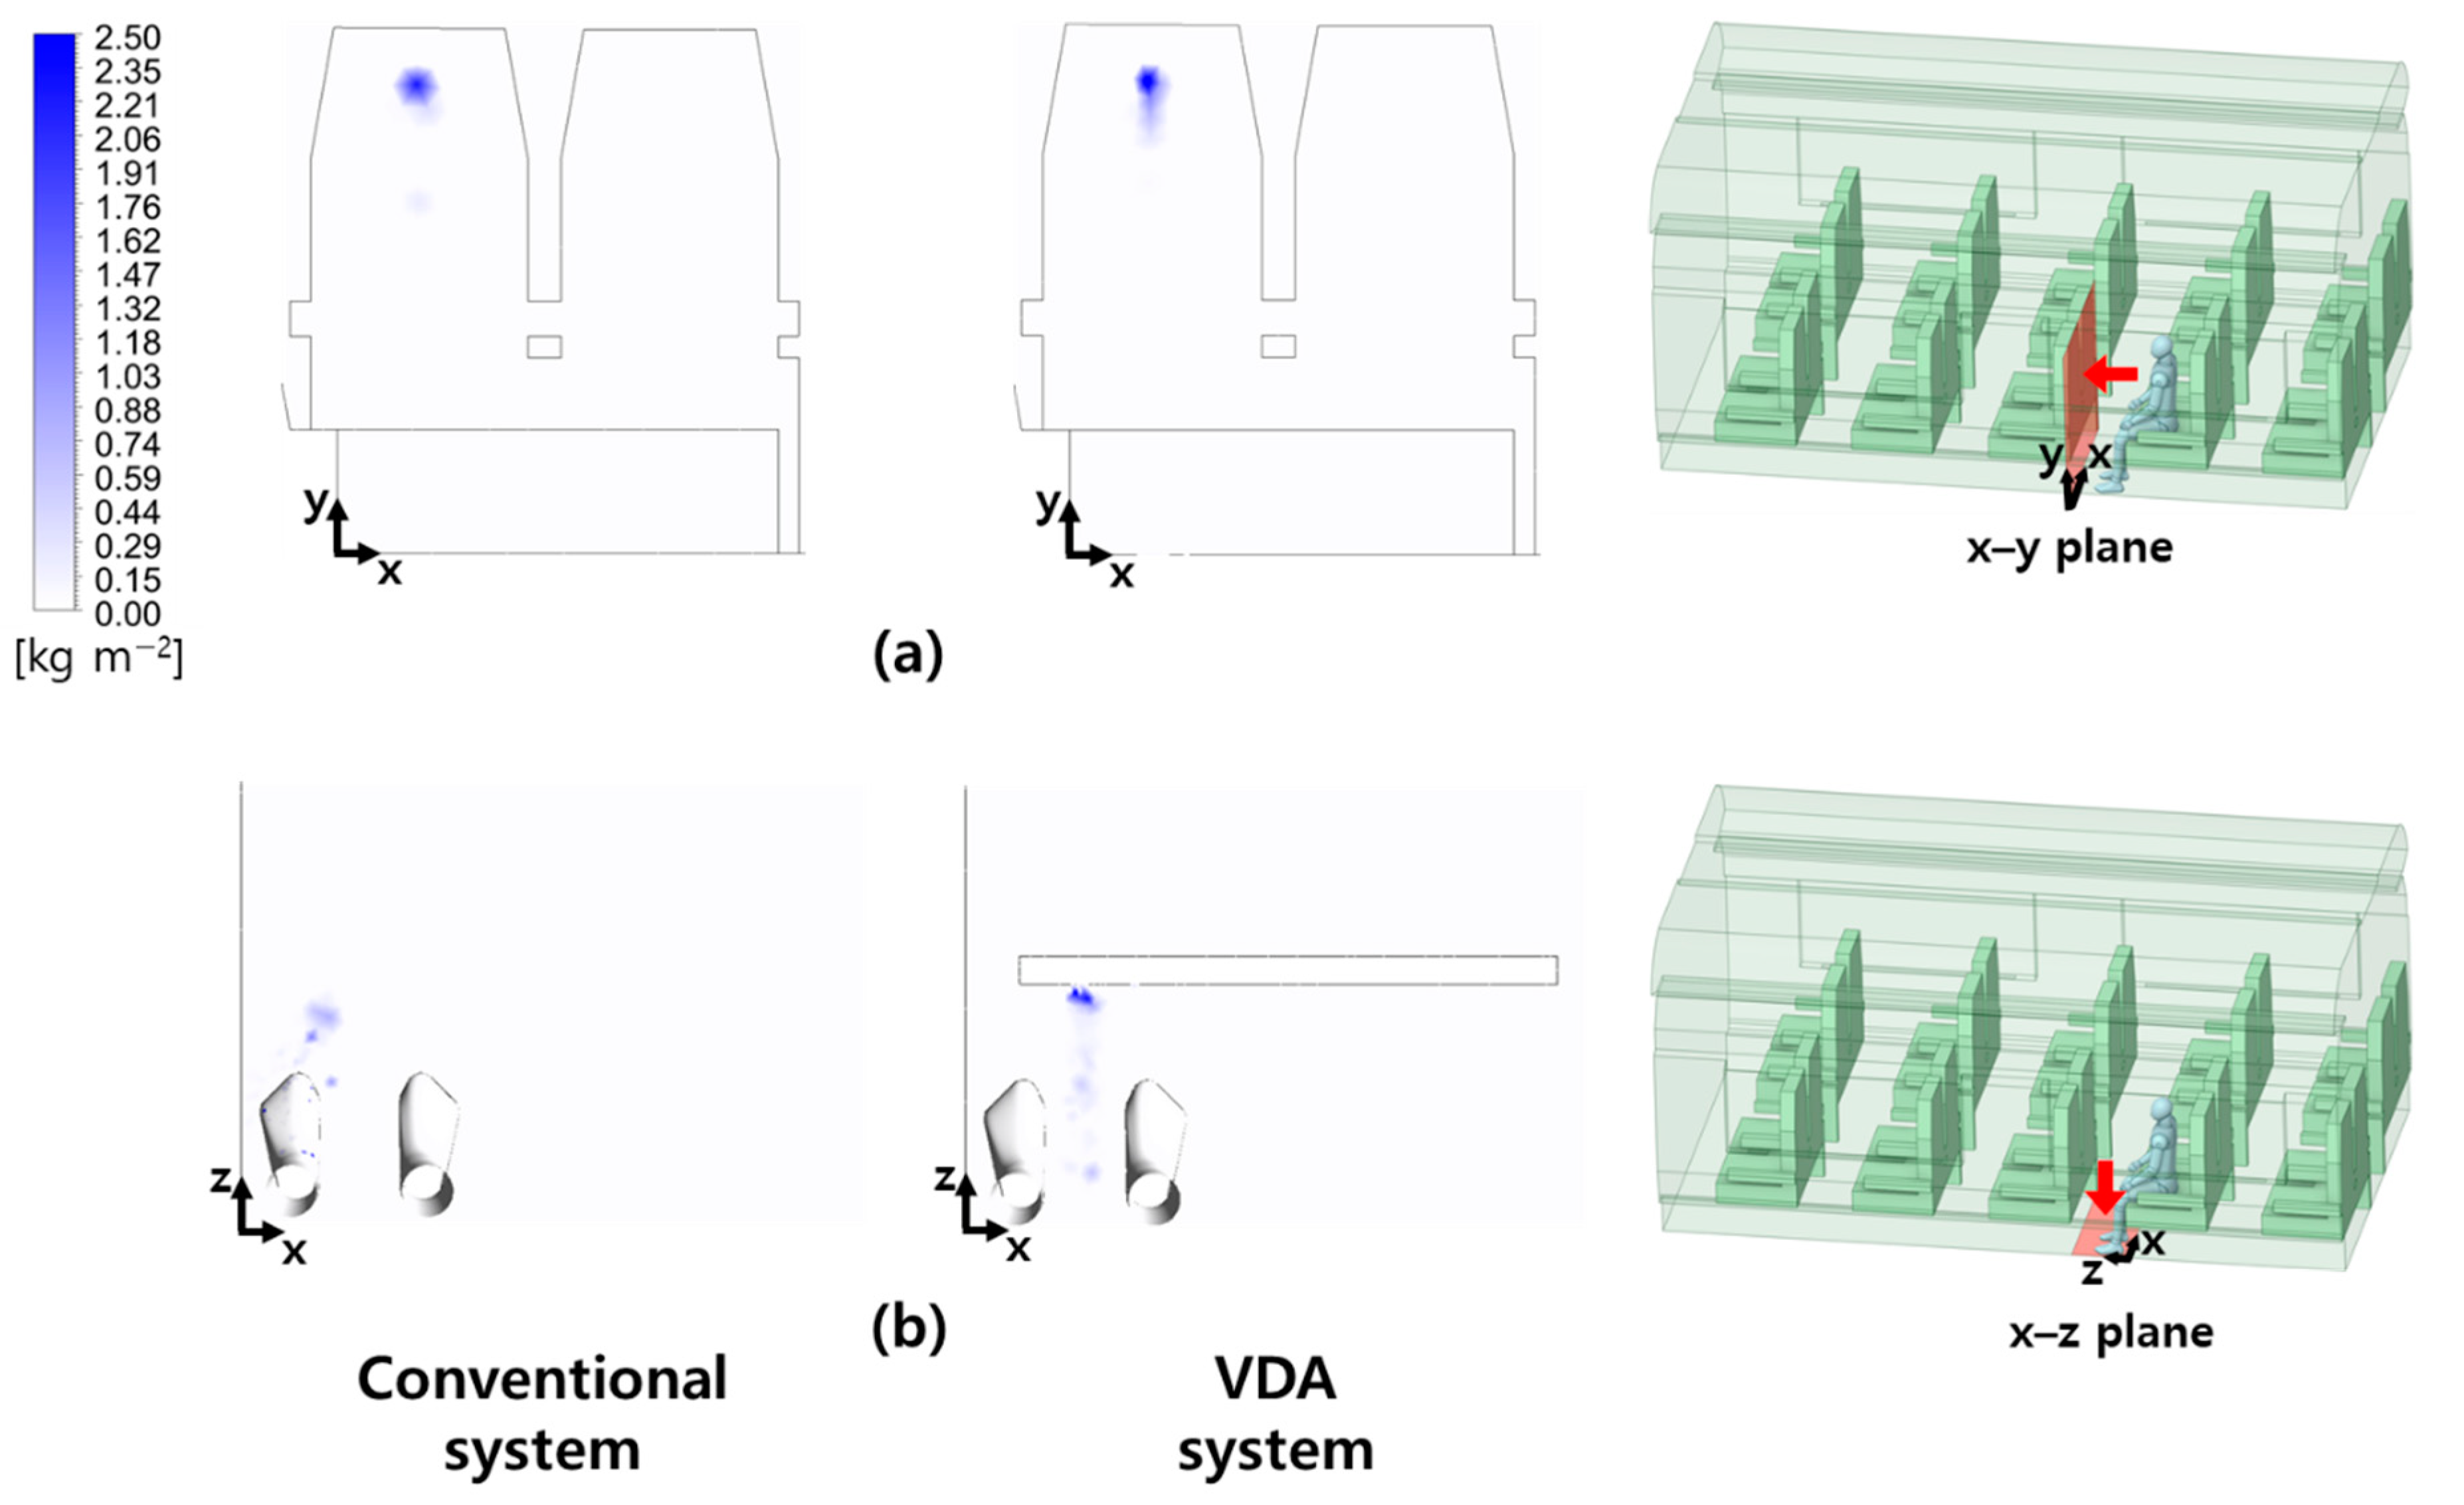
Figure 9 depicts the droplet deposition distribution of the conventional and VDA systems at the back surface of the front seat and on the floor under the seat. There was no significant difference in deposition between the conventional and VDA systems. However, the remaining droplets under 10 µm spread through various routes in the cabin, as shown in Figure 8. In both conventional and VDA systems, the droplet deposition was concentrated on the back surface of the front seat at a height similar to that of the mouth. In the VDA system, a few droplets were deposited in the direction of gravity owing to the strong downward airflow. The deposition in the conventional system occurred around the front of the seated person’s left foot on the floor, close to the outlet, owing to the airflow circulation. In the VDA system, the deposition occurred around the outlet because of downward airflow. Overall, frequent cleaning of the back surface of the front seat is required to prevent virus spread through surface contact because the droplet deposition is predominantly observed on the seat in both the conventional and VDA systems [35]. Furthermore, it is necessary to change the location to prevent contact infection because the space behind the seat often has a structure that can store things.
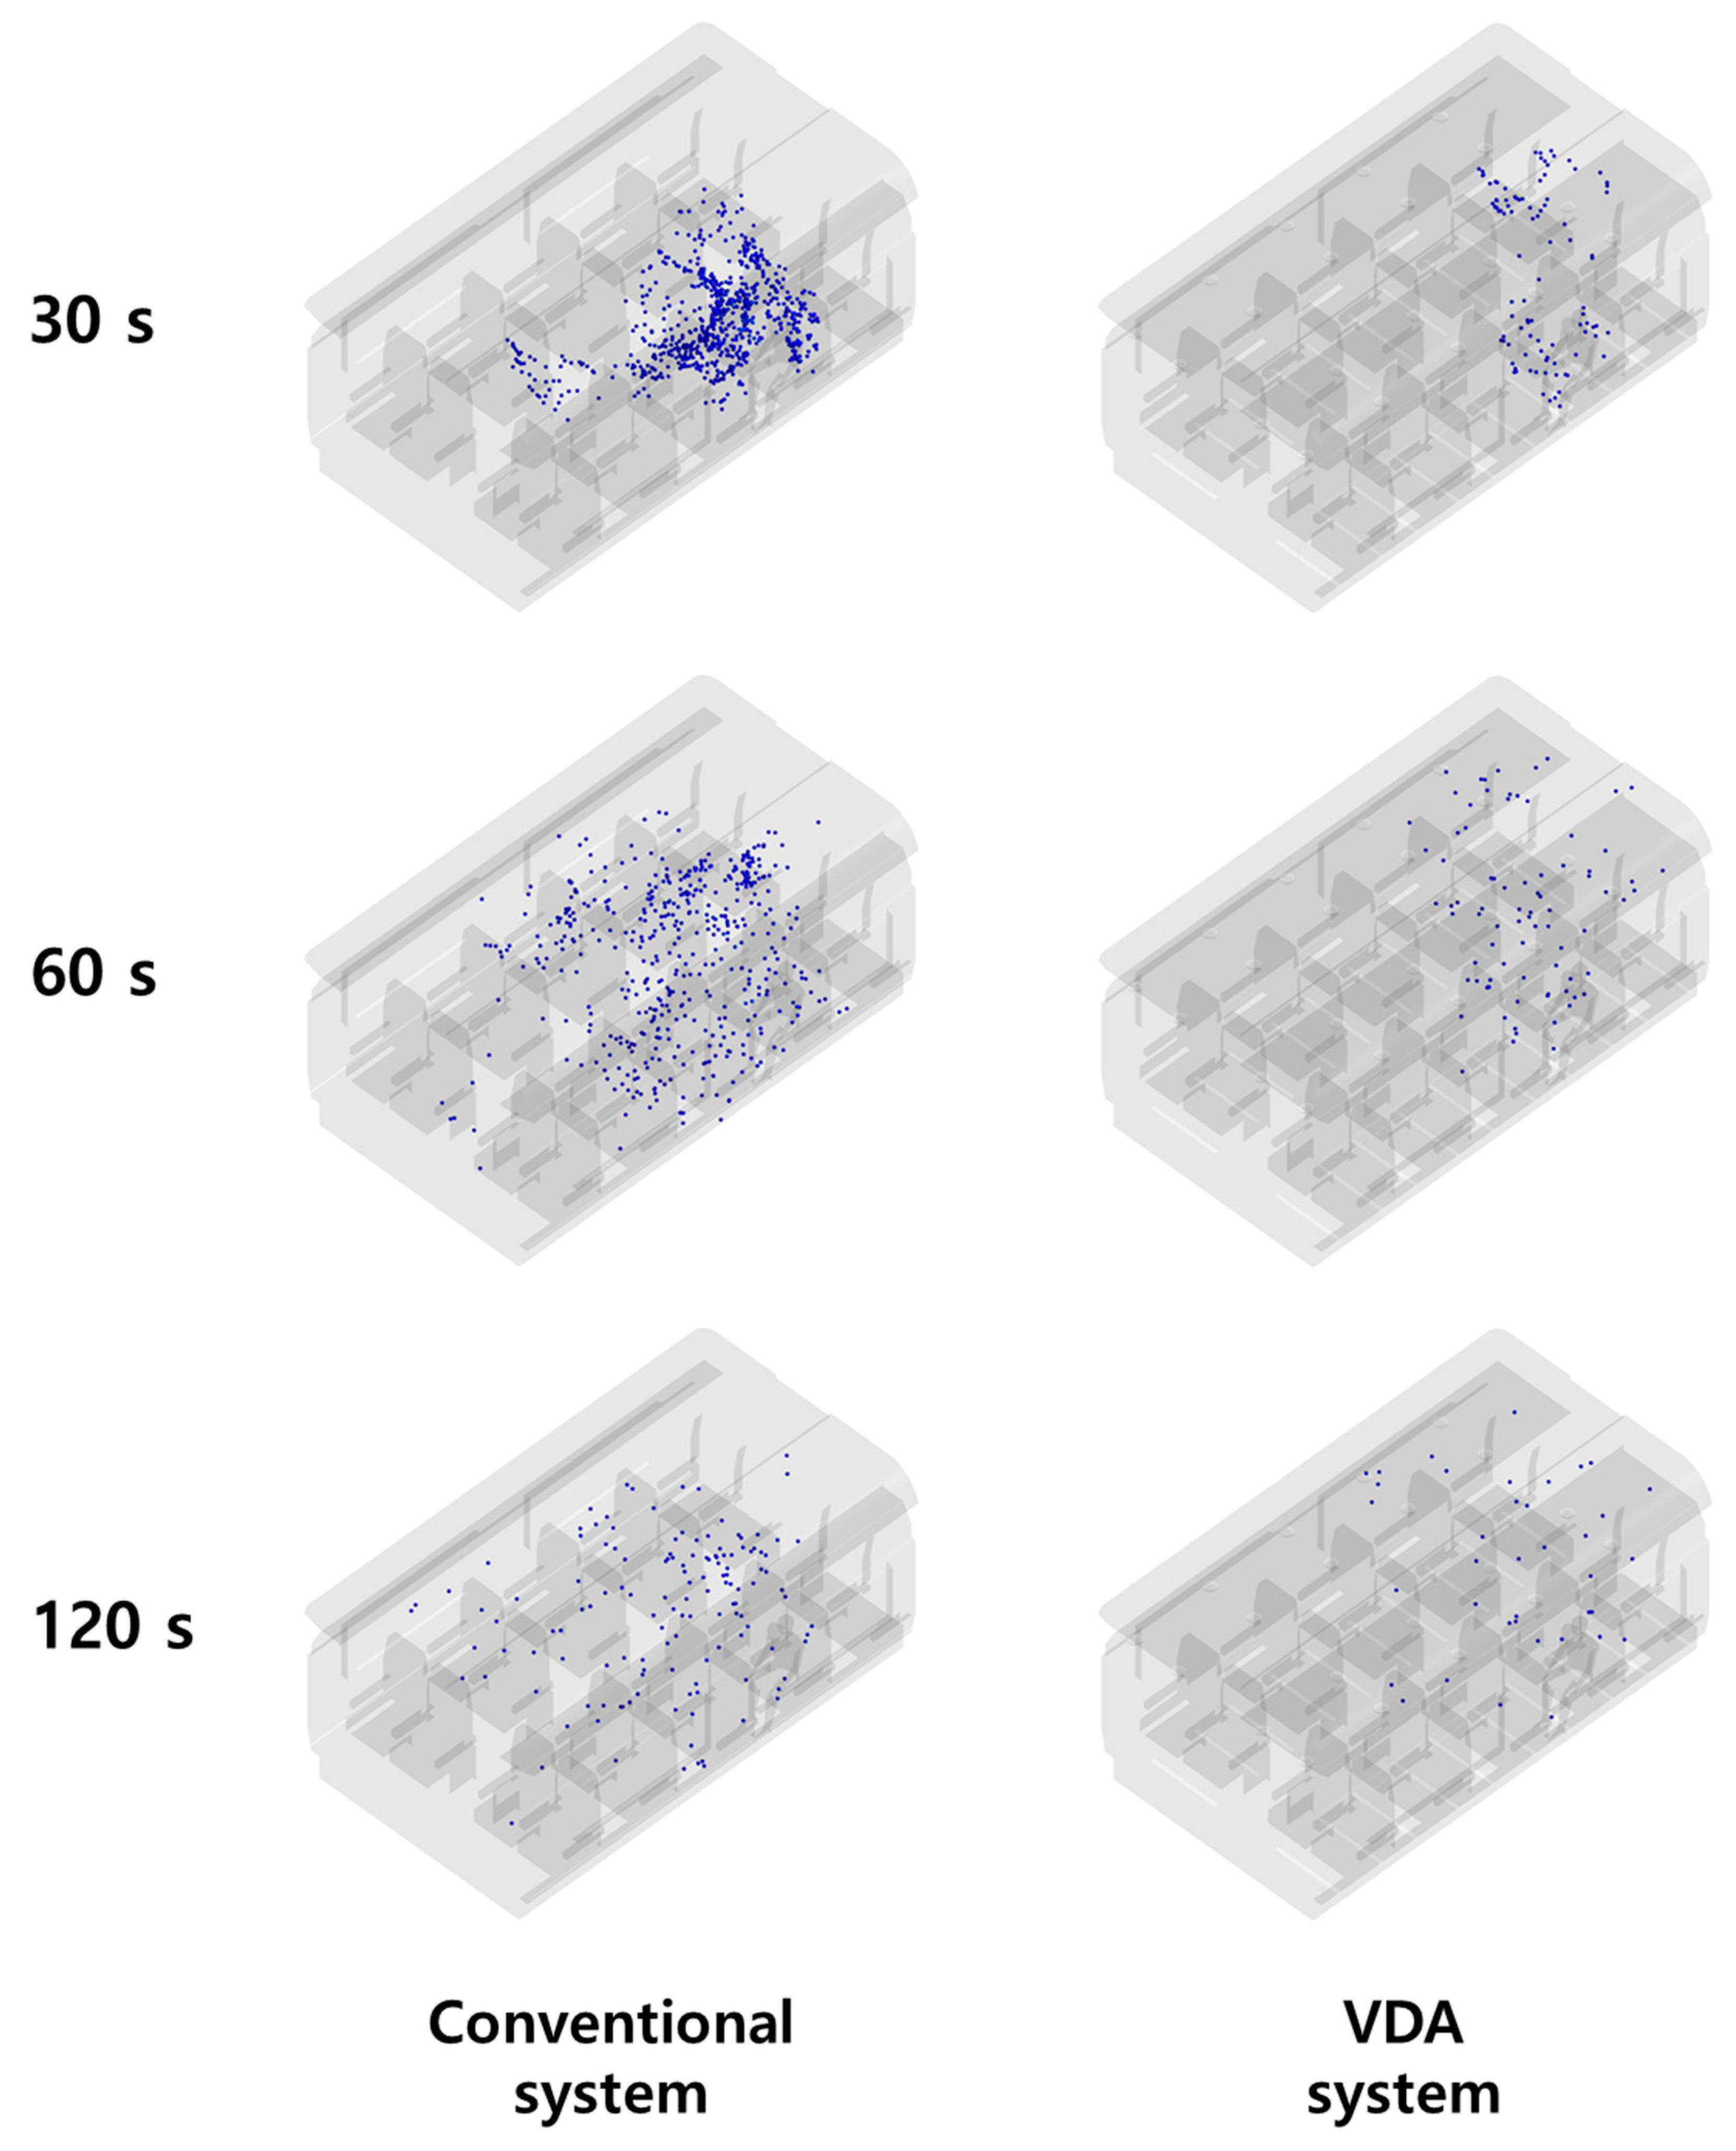
Figure 10 depicts the droplet distributions in the conventional and VDA systems between 30 and 120 s after coughing. The droplets exhibited a uniform size. In the conventional system, after 30 s of coughing, numerous droplets were distributed predominantly around the seat of the infected person and the adjacent seat because of the airflow circulation. Furthermore, several droplets spread along the corridor to the seats at the front of the cabin. After 60 s of coughing, droplets spread to the seats in the front column of the infected person and the seats in the row adjacent to the corridor. Additionally, numerous droplets continued to float in the upper part of the cabin. Although the number of droplets was reduced by deposition or exhaust after 120 s of coughing, the remaining droplets spread throughout the cabin. During 120 s, droplets moved to all seats except seat 5D, indicating a high infection risk. In the VDA system, droplets were distributed around the infected person and near the corridor ceiling after 30 s of coughing. After 60 s, the droplets spread around the seats behind, adjacent to, and in front of the infected person. However, owing to the strong downward airflow, the number of droplets and the spread area were lower than those in the conventional system. After 120 s of coughing, the droplets spread via various routes; however, seats 3C, 3D, 4A, 4B, 4C, 4D, 5A, 5B, 5C, and 5D remained unaffected by the droplets. Therefore, the mitigating effect of droplet transmission in the VDA system was confirmed even under the no-wearing mask case.
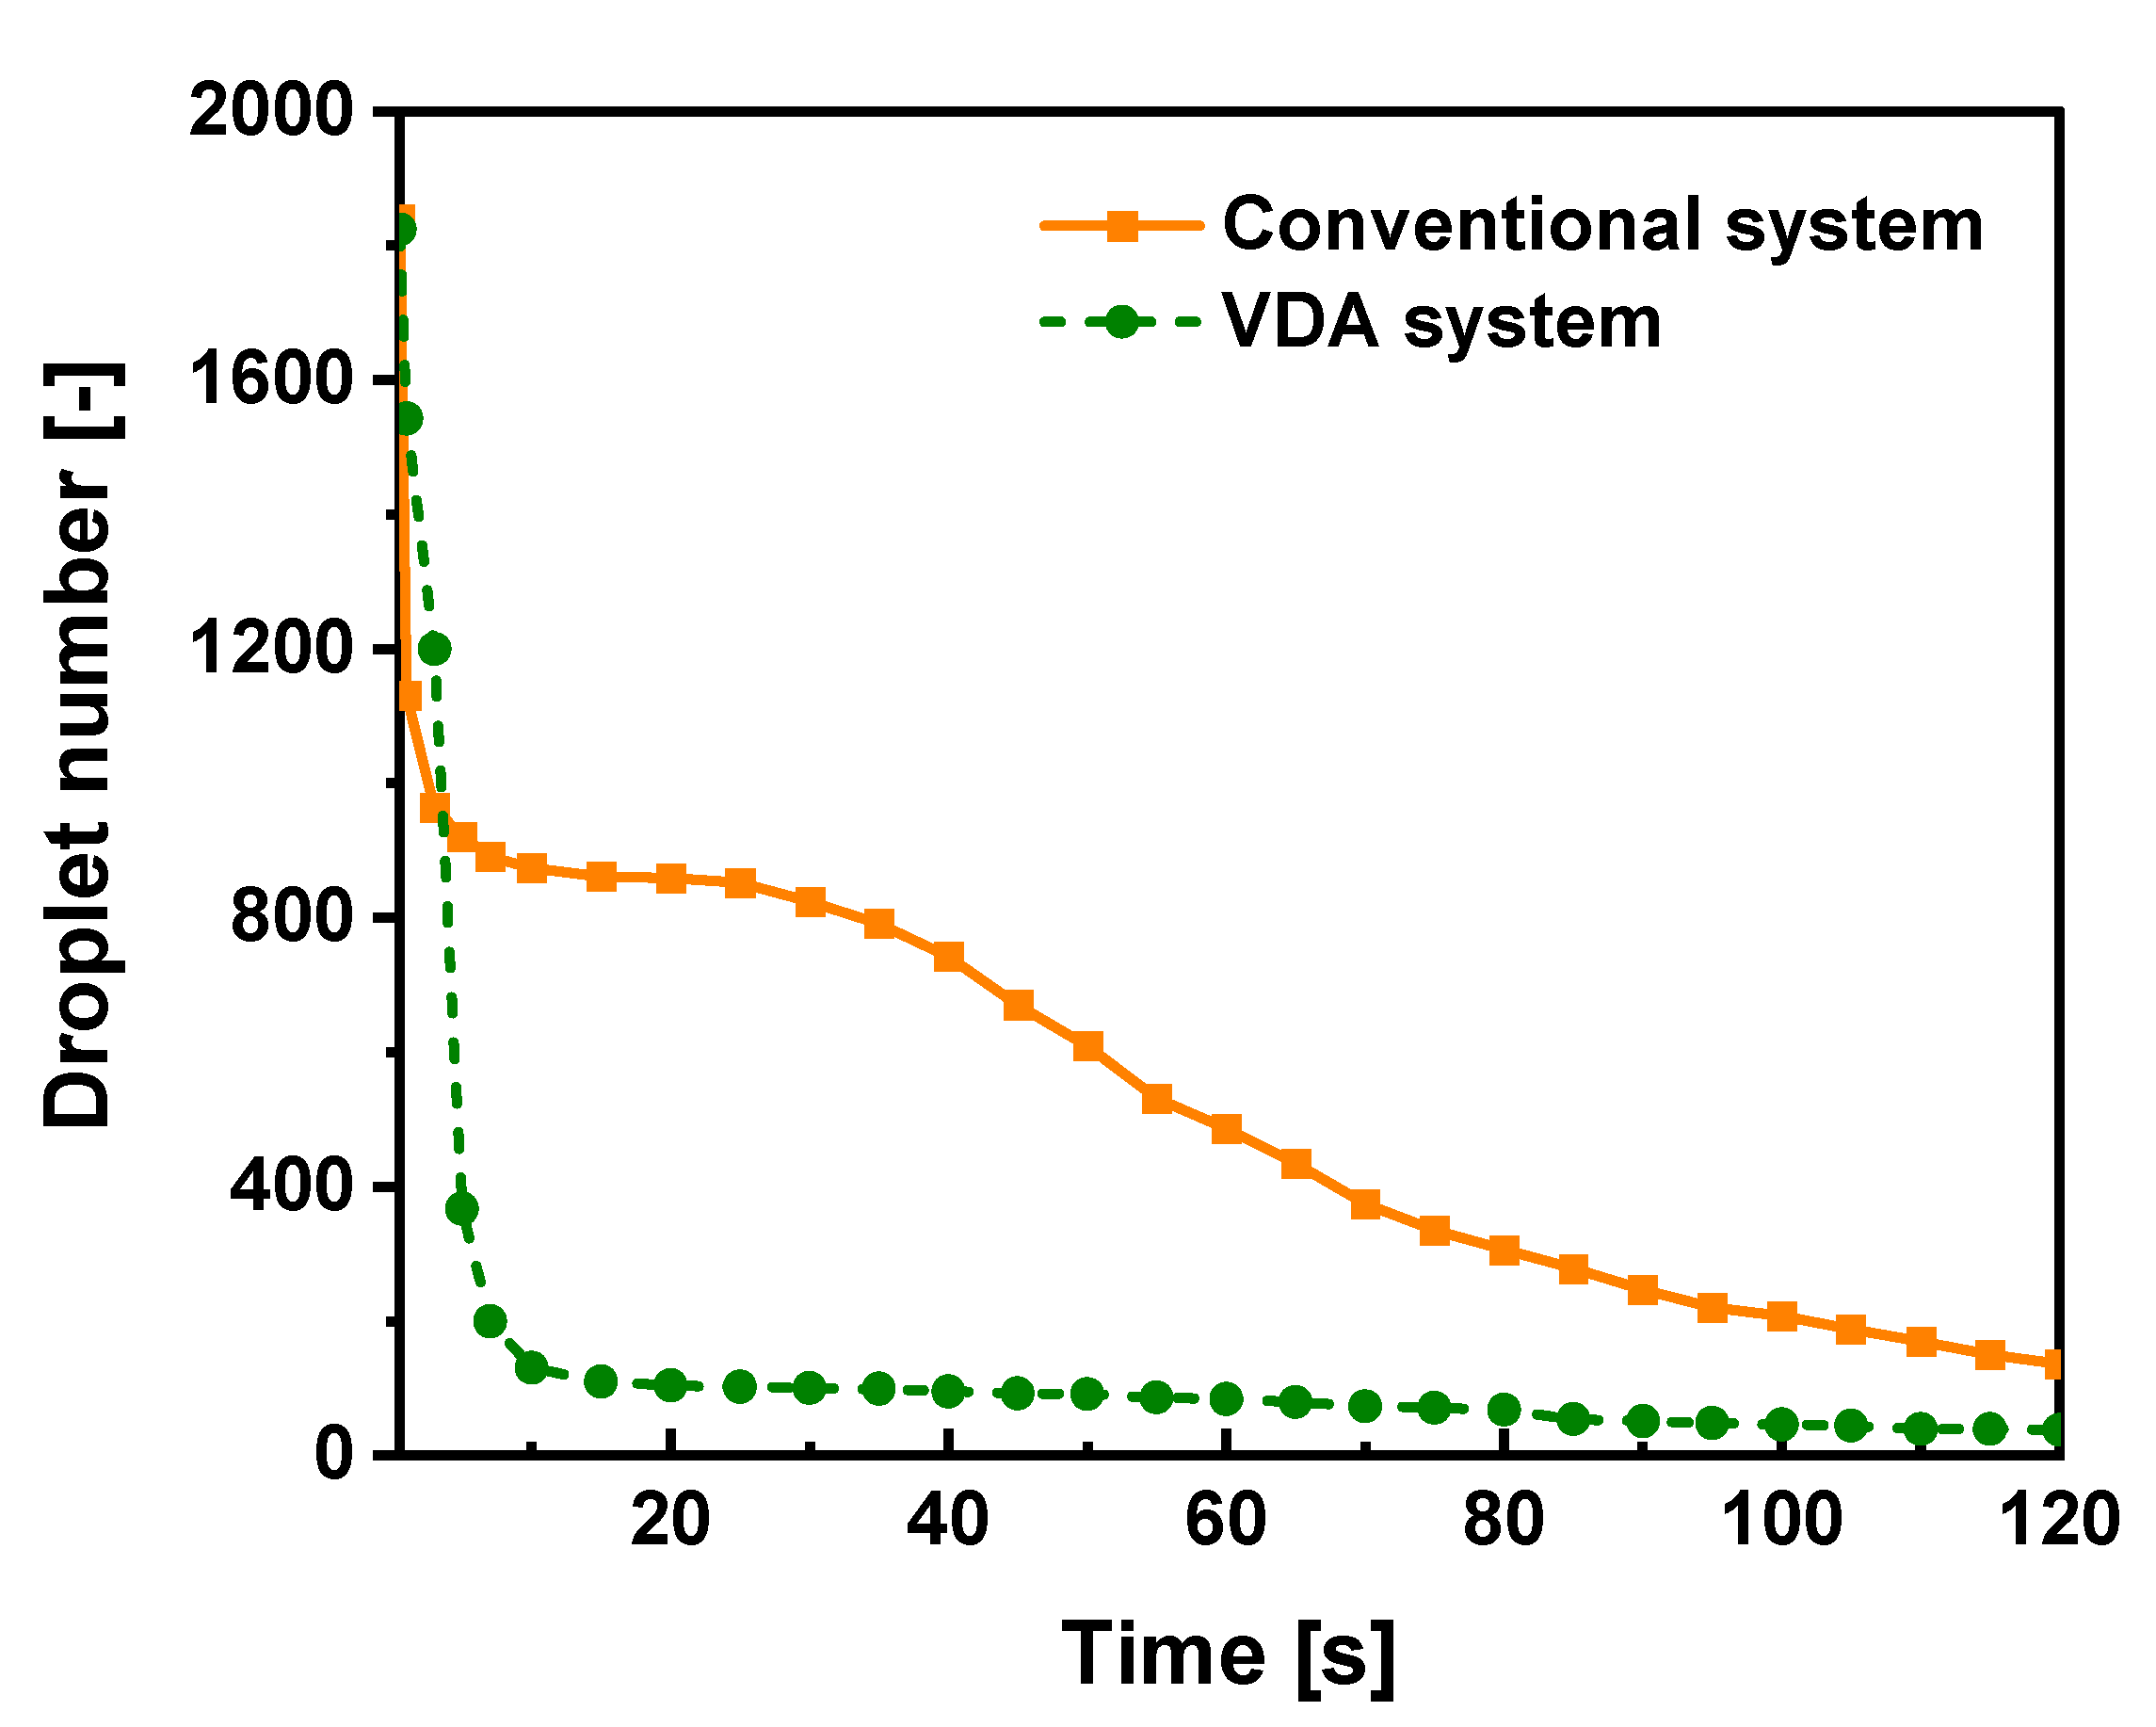
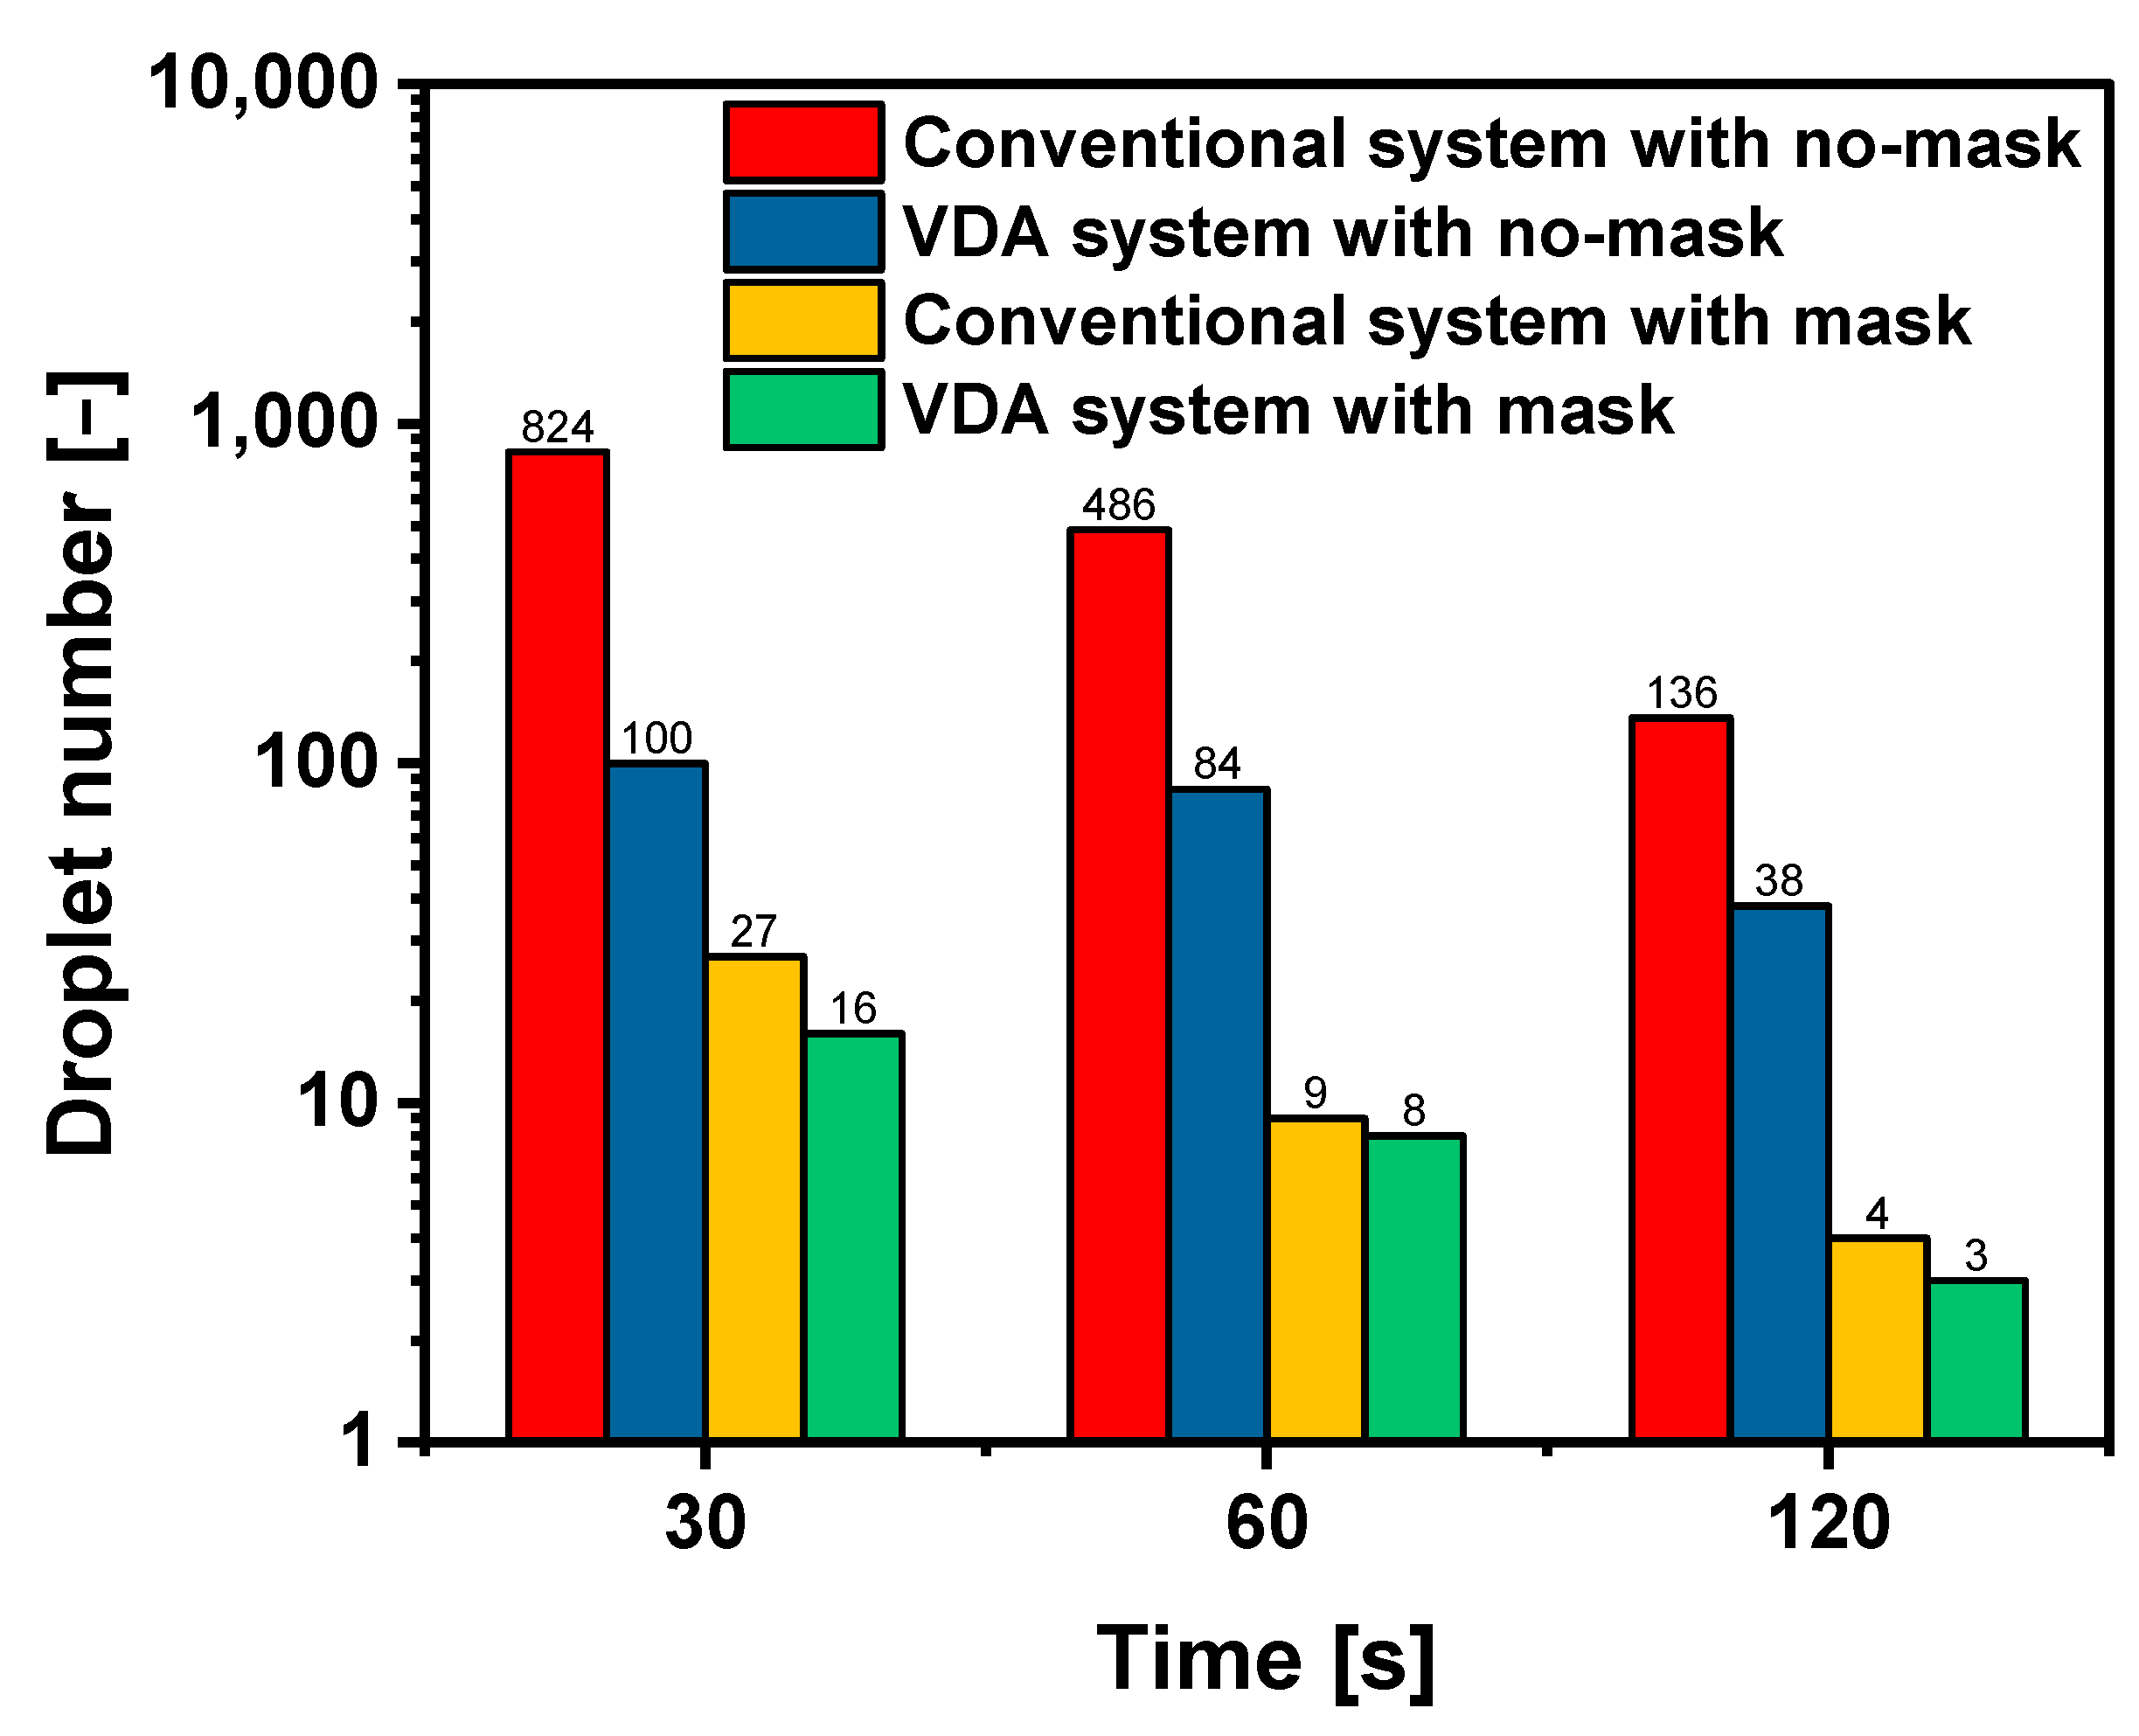
Figure 11 illustrates the variation in the number of droplets in the conventional and VDA systems according to the time after coughing. In the conventional system, the number of droplets decreased rapidly up to 10 s as they were predominantly deposited on the back surface of the front seat. Between 10 and 25 s, the decreasing rate of the droplet number stagnated because the droplet traveled a long distance to reach the outlet following the rotational airflow in the cabin. After 25 s, the droplet number gradually decreased because the droplets reached the cabin surface and were exhausted through various routes as they spread inside the cabin. In the VDA system, the droplet number decreased faster than in the conventional system up to 10 s, owing to the decrease in the exhaust distance. After 10 s, small droplets of less than 10 µm floated in the cabin and were exhausted slowly. At 120 s, the mitigating effect of droplet transmission was confirmed as the droplet number decreased by 72.1% from 136 in the conventional system to 38 in the VDA system.
3.2. Effect of Wearing Masks
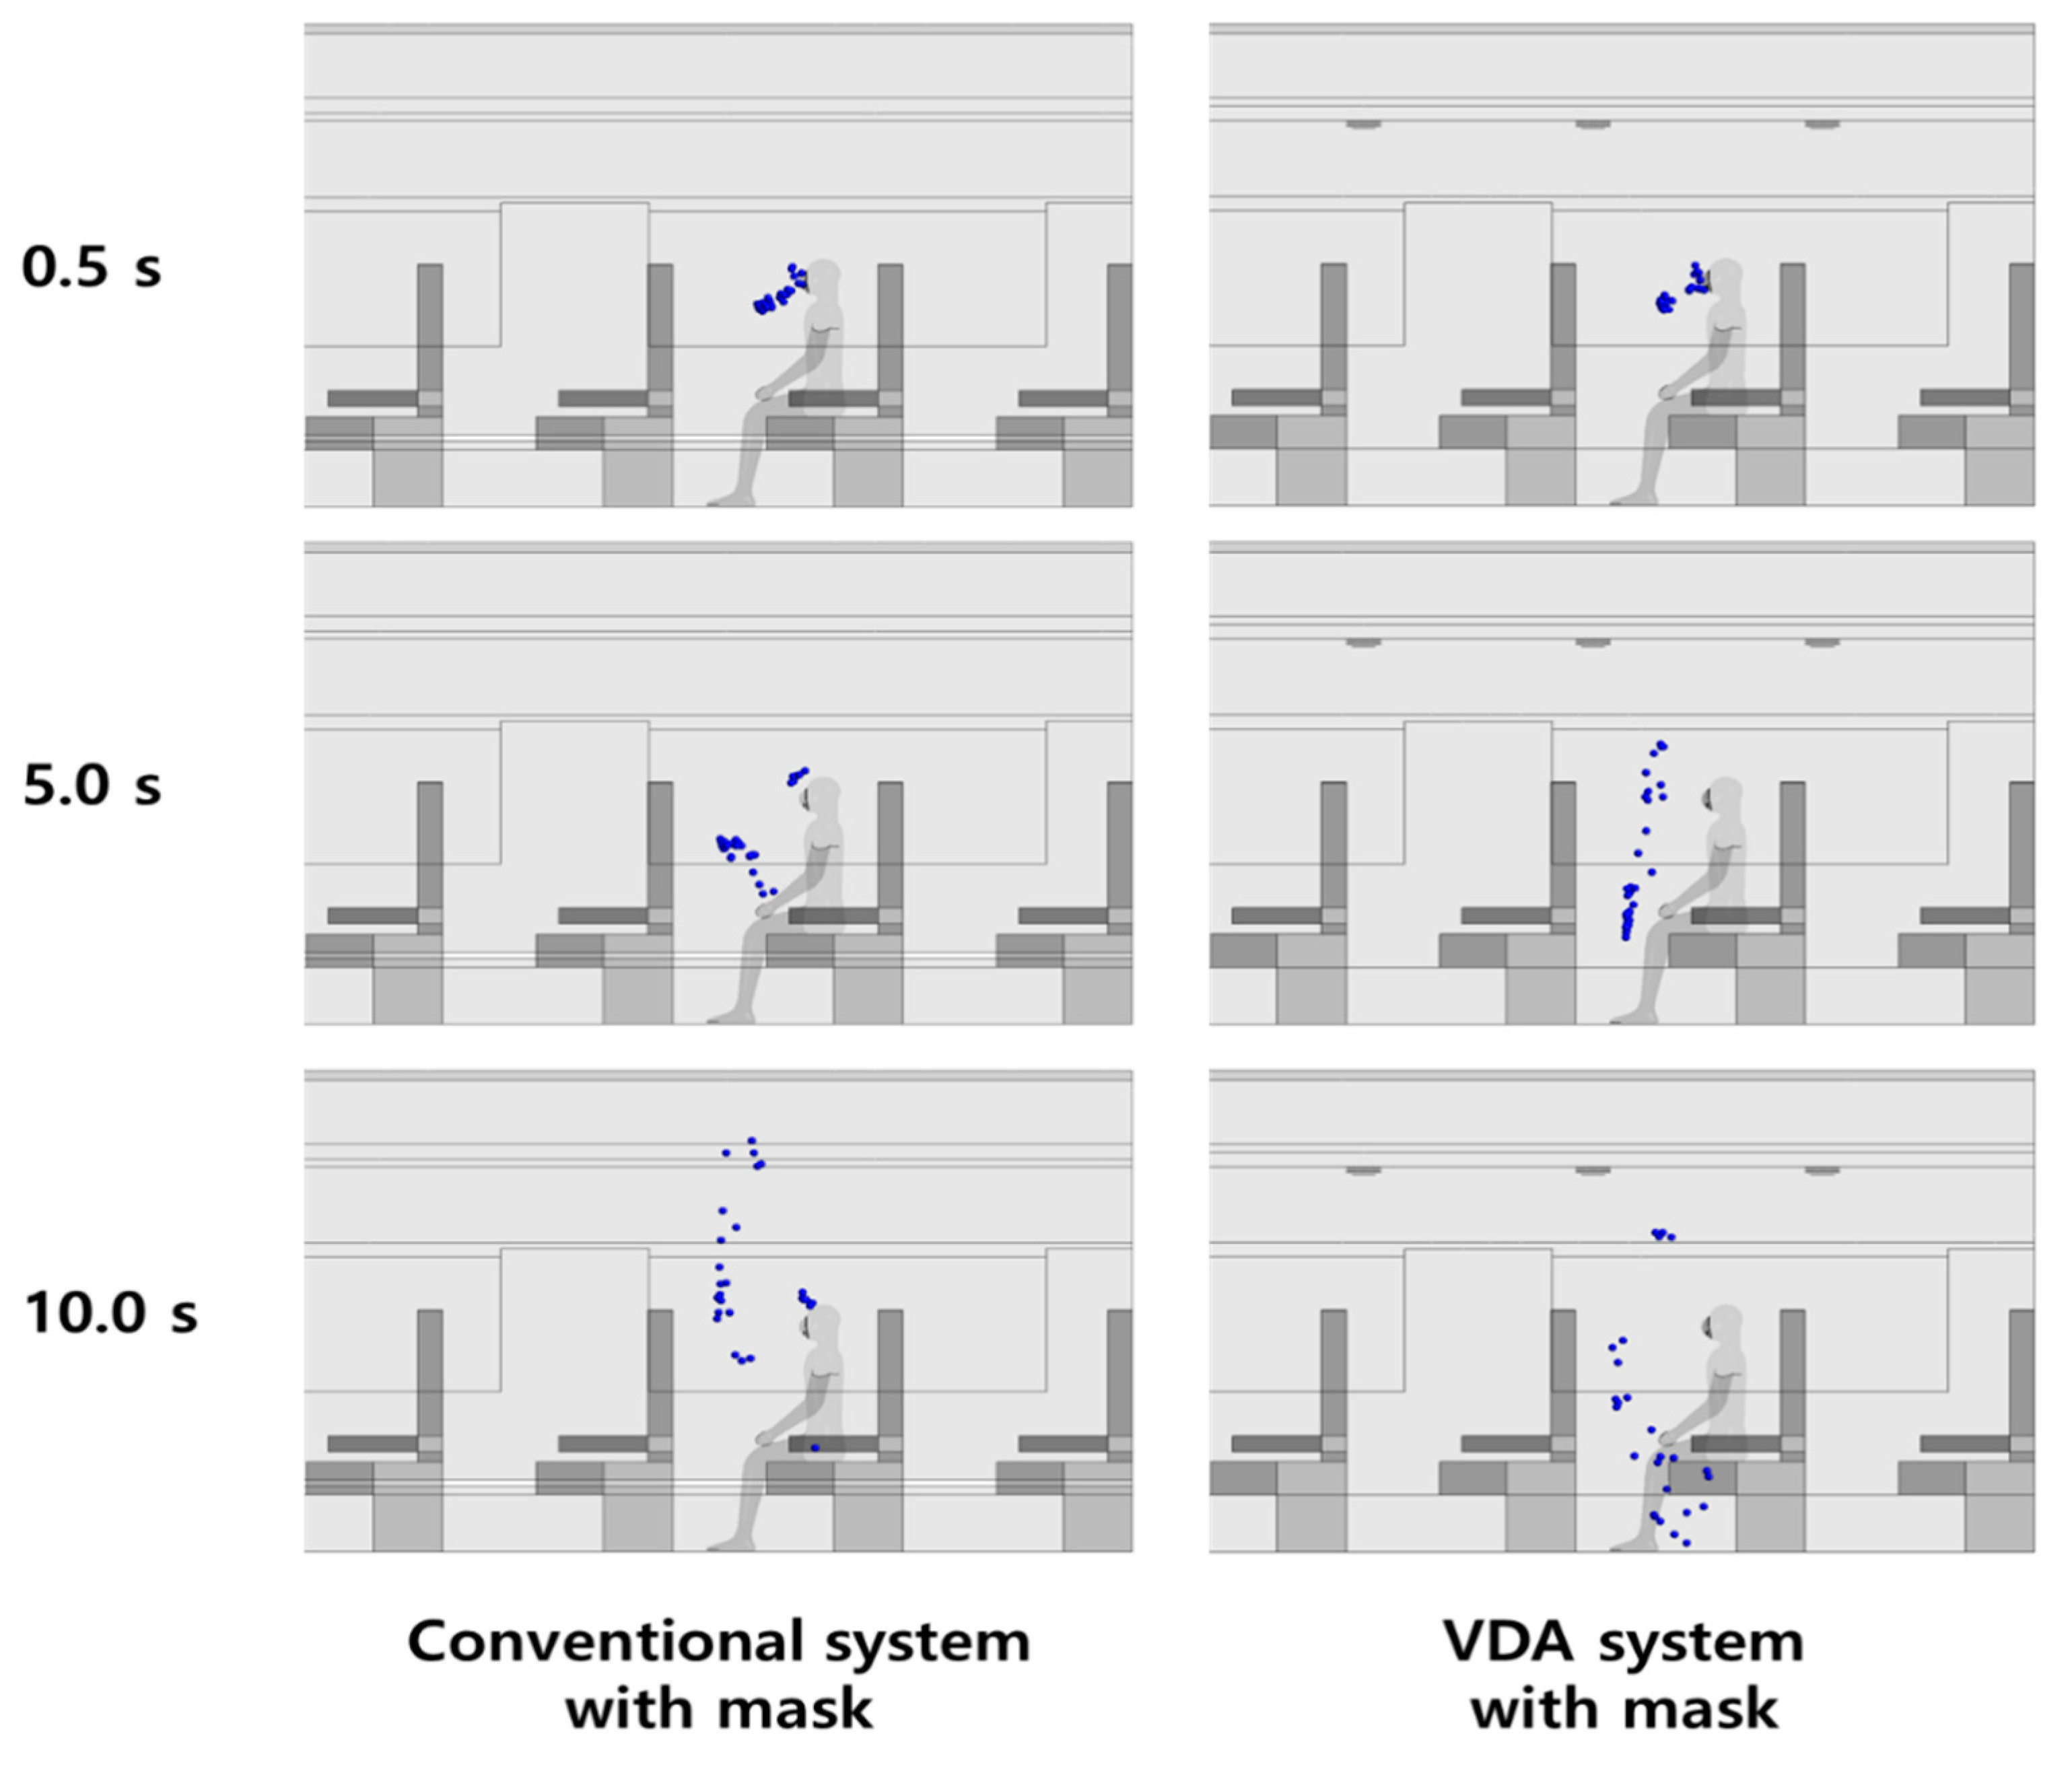
The effect of wearing close-fitting masks was analyzed and compared with that of the no-mask case. Figure 12 depicts the droplet distributions in the conventional and VDA systems with a mask between 0 and 10 s after coughing; the droplets exhibited a uniform size. In the initial stage after coughing, only a few droplets were discharged into the cabin because most of the droplets did not pass through the mask. Additionally, the droplets did not reach the front seat in comparison with the no-mask case because the porous domain of the mask reduced the cough flow rate. In the conventional system with the mask, the maximum travel distance of the droplet in the linear direction was 0.36 m after 5 s of coughing. After 10 s, most of the droplets floated to the upper part of the cabin compared to the no-mask case because the droplets with reduced momentum were affected by the airflow circulation. In the VDA system with the mask, after 0.5 s of coughing, the droplets discharged through the mask exhibited a transmission trend similar to the conventional system with the mask. After 5 s of coughing, the droplets were distributed vertically owing to the influence of downward airflow. However, the maximum travel distance in the linear direction of the droplet was similar to that of the conventional system with the mask, owing to the momentum loss of the cough airflow from the mask. After 10 s of coughing, droplets in the VDA system with the mask were distributed at the bottom of the cabin and around the outlet in comparison with the conventional system with the mask, owing to the downward airflow.
Figure 13 depicts the variations in the velocity distribution and streamline of the VDA system when coughing with and without a mask. In the no-mask case, a strong straight coughing airflow with a velocity of more than 5 m s−1 was expelled from the mouth at 0.1 s. During this period, turbulence predominantly affected the initial transport pattern of droplets [44]. After 0.3 s, the cough airflow encountered the downward airflow and exhibited a descending streamline. In the VDA system with the mask, a cough airflow with a velocity of less than 2 m s−1 was expelled from the mouth at 0.1 s, owing to the resistance from the mask. After 0.3 s, although the cough airflow encountered the downward airflow, it did not penetrate the center of the downward airflow because of the low flow rate. Therefore, the droplets in the with-the-mask case descended slowly compared to the droplets in the no-mask case.
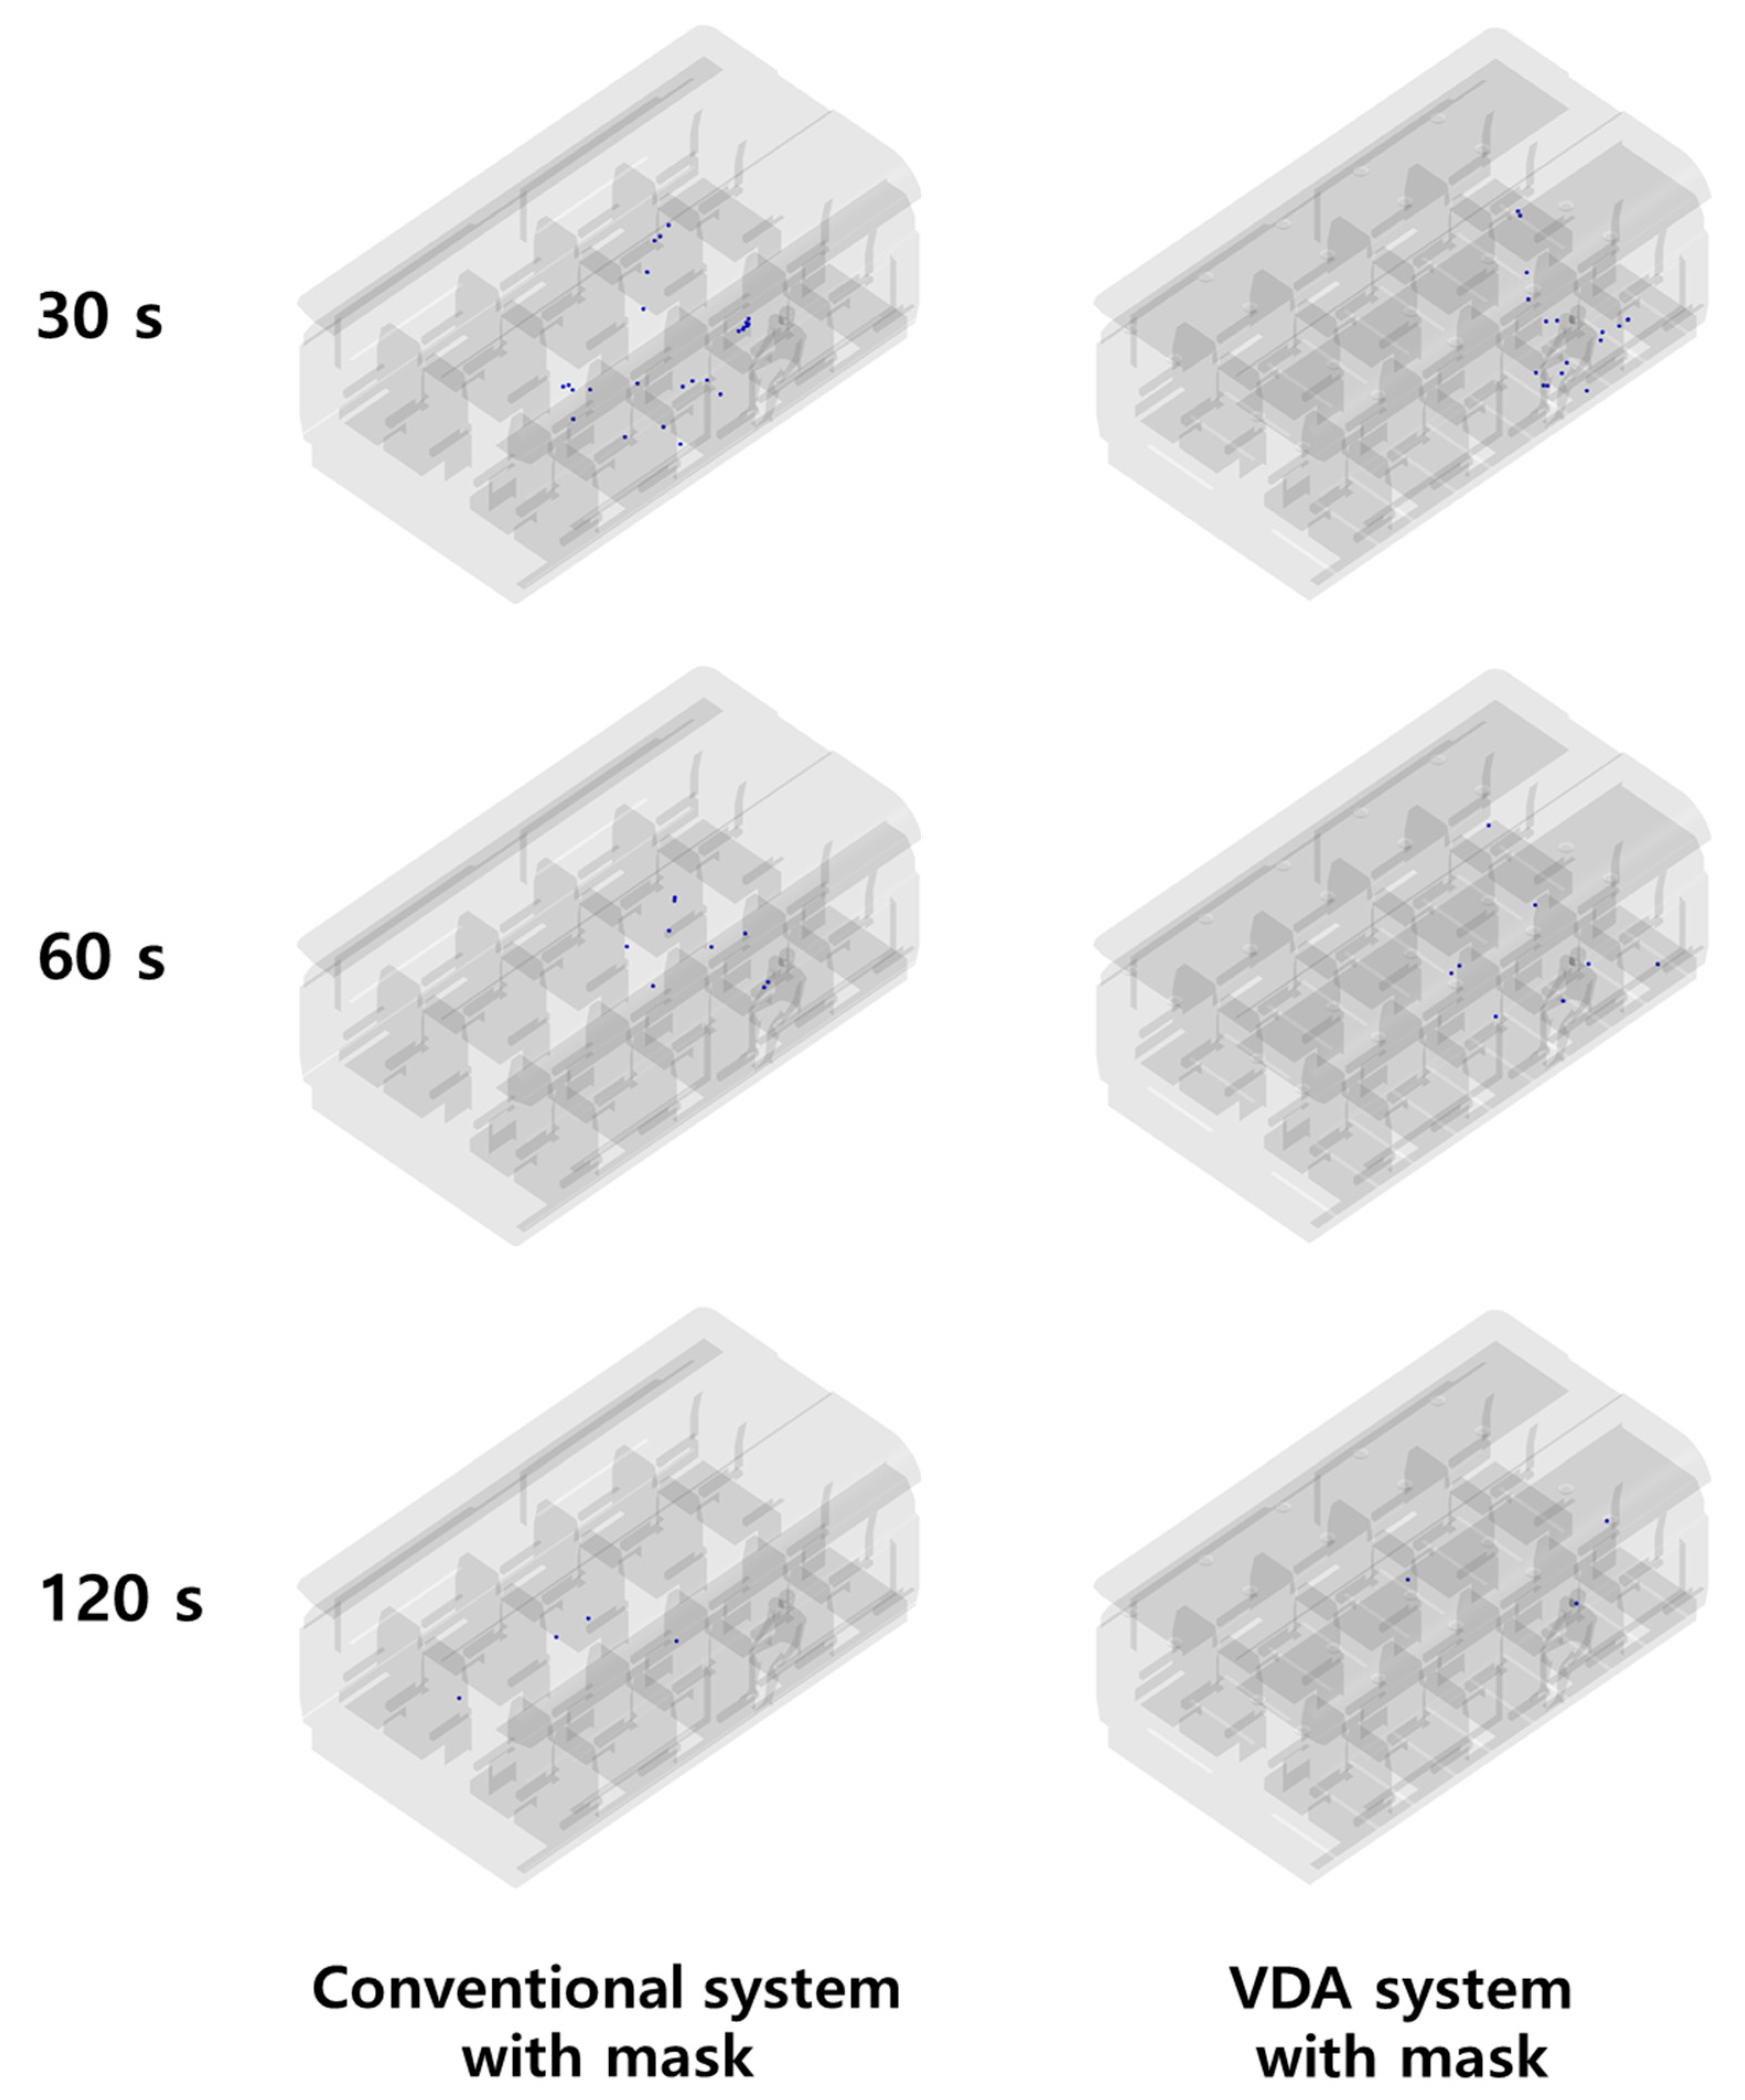
Figure 14 illustrates the droplet distributions in the conventional and VDA systems with a mask between 30 and 120 s after coughing. In the conventional system with the mask, a few droplets floated near the seat adjacent to the infected person after 30 s of coughing, whereas the remaining droplets spread along the aisle to the seat in front. After 60 s, most of the droplets were deposited or exhausted, and the remaining droplets floated around the infected person. After 120 s of coughing, droplets appeared on the seats in front of the infected person. During 120 s, seats 2B, 2C, 2D, 3A, 3B, 3C, 4A, 4B, and 4C were affected by the droplets. In the VDA system with the mask, most of the droplets were floating in the area between the downward airflow and infected person after 30 s of coughing. After 60 s, several droplets spread to the front seats, adjacent seats, and aisle. After 120 s of coughing, only a few droplets floated near the top of the cabin. During 120 s, seats 1A, 1B, 2B, 2C, 2D, 3A, and 3B were affected by the droplets. Therefore, the number of seats at risk of infection in the VDA system is lower than that in the conventional system.
Figure 15 depicts the variation in the number of droplets in the conventional and VDA systems with and without the mask. In both cases, the droplet number in the VDA system was smaller than that in the conventional system. In with-the-mask cases, the number of droplets reduced significantly compared to the no-mask case owing to the filtering of droplets. Therefore, wearing a close-fitting mask effectively reduced the number of droplets in the cabin. However, the mask does not adhere to the skin completely in actual conditions during coughing; therefore, droplets leak through an open gap in the nose and cheek regions [25]. Additional research that considers airflow leakage during coughing is required.
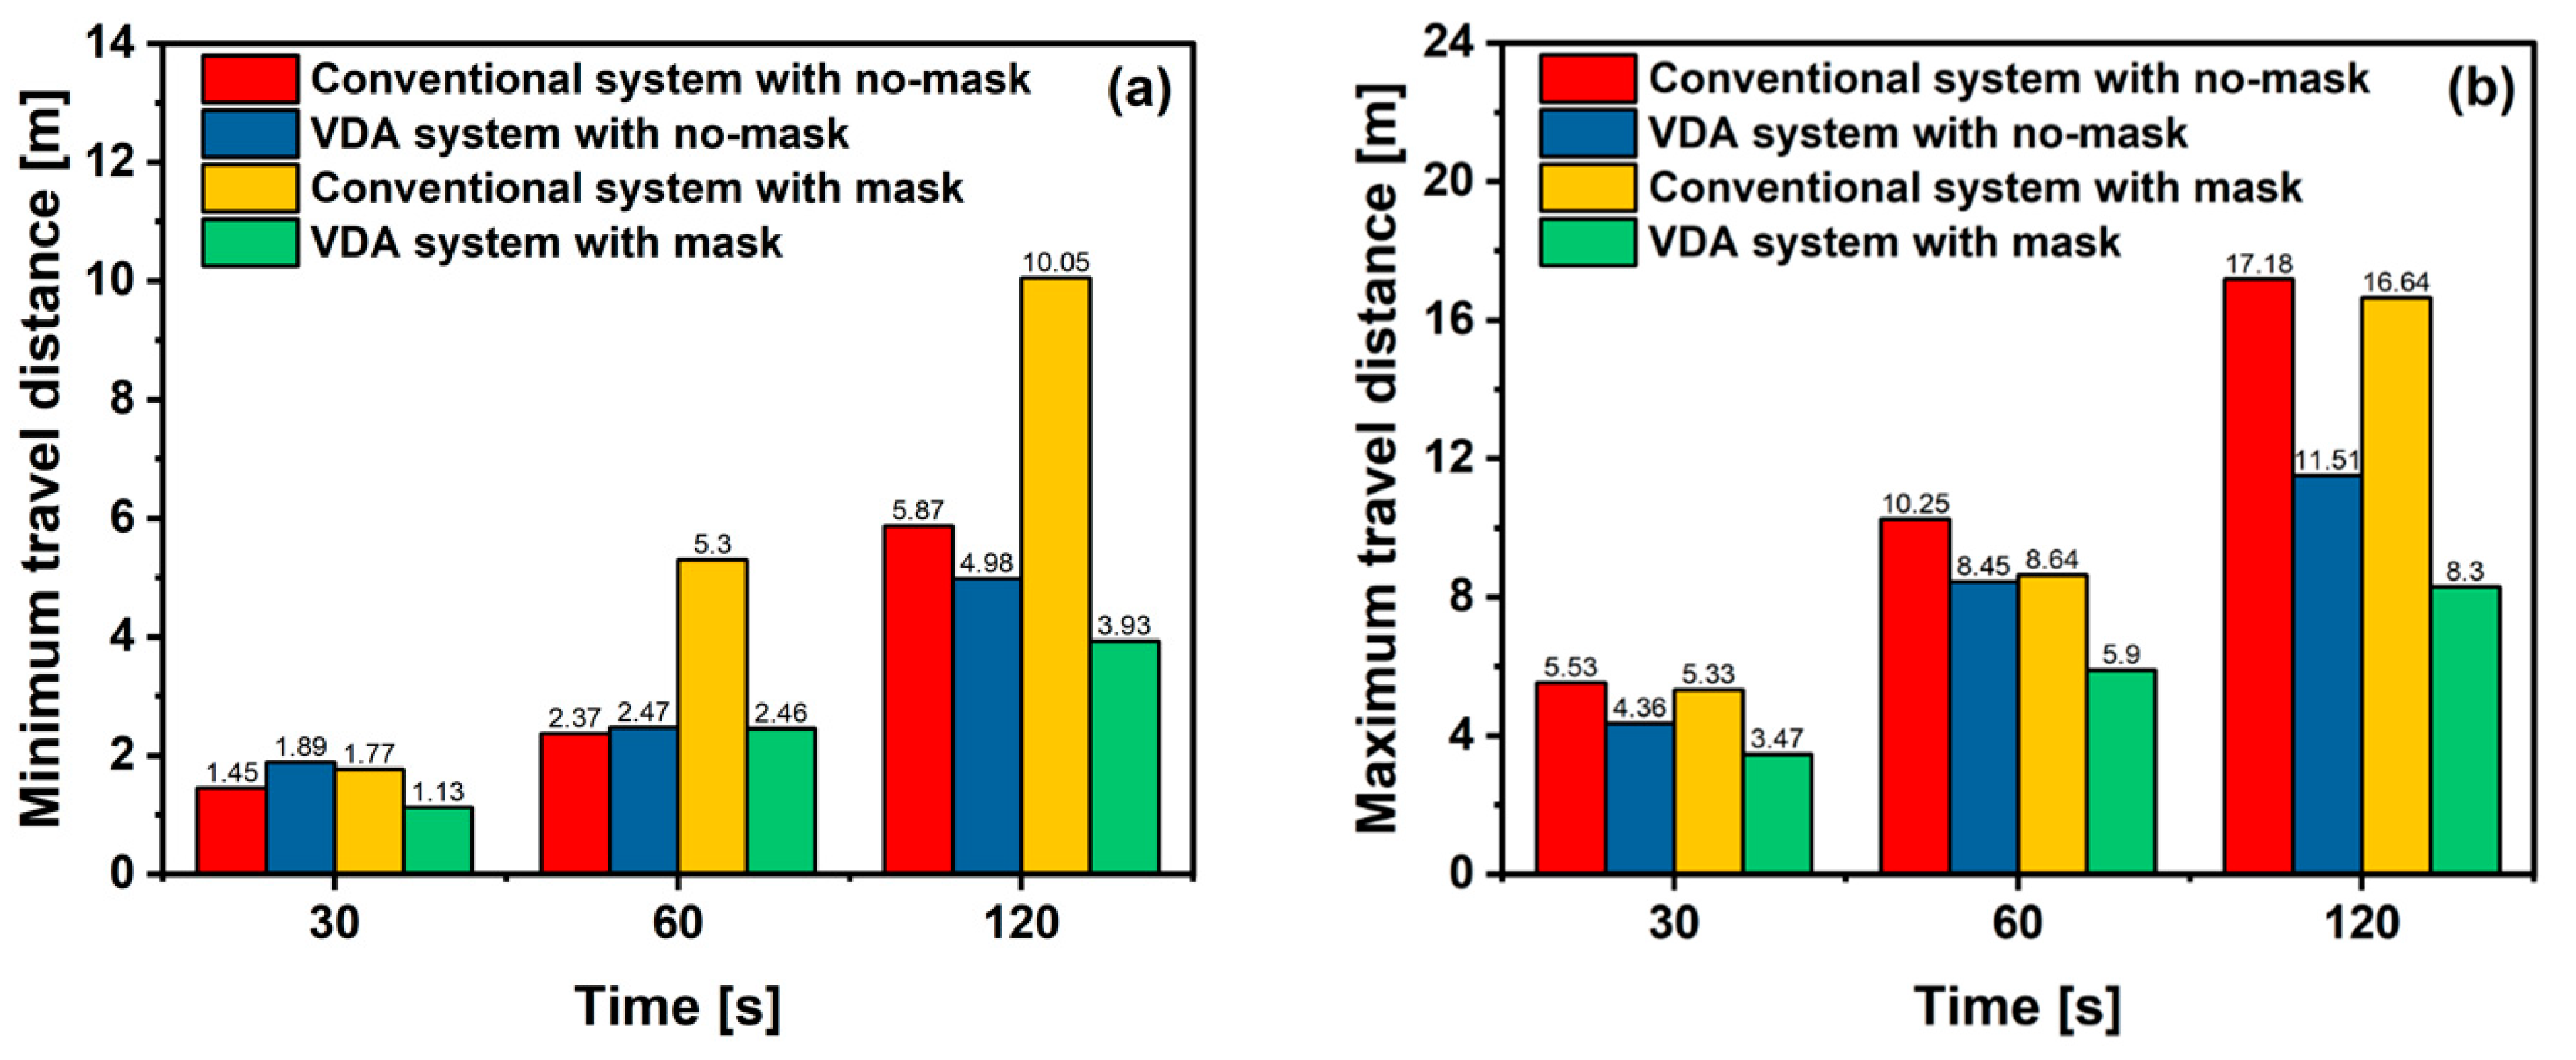
Figure 16 illustrates the variation in the minimum and maximum droplet travel distances in the conventional and VDA systems with and without masks. In both cases, the minimum and maximum droplet travel distances increased faster in the conventional system than in the VDA system. This was because the droplets were transmitted further owing to the effect of the circulating airflow in the cabin. After 120 s of coughing, the minimum droplet travel distances of the VDA systems with the no-mask and mask cases were 84.8% and 39.1% of those of the conventional systems, respectively. Furthermore, the maximum droplet travel distances of the VDA systems with the no-mask and mask cases were 67.0% and 49.9% of those of the conventional systems, respectively. Therefore, the VDA system effectively suppressed droplet transmission by significantly reducing the droplet travel distance compared to that of the conventional system.
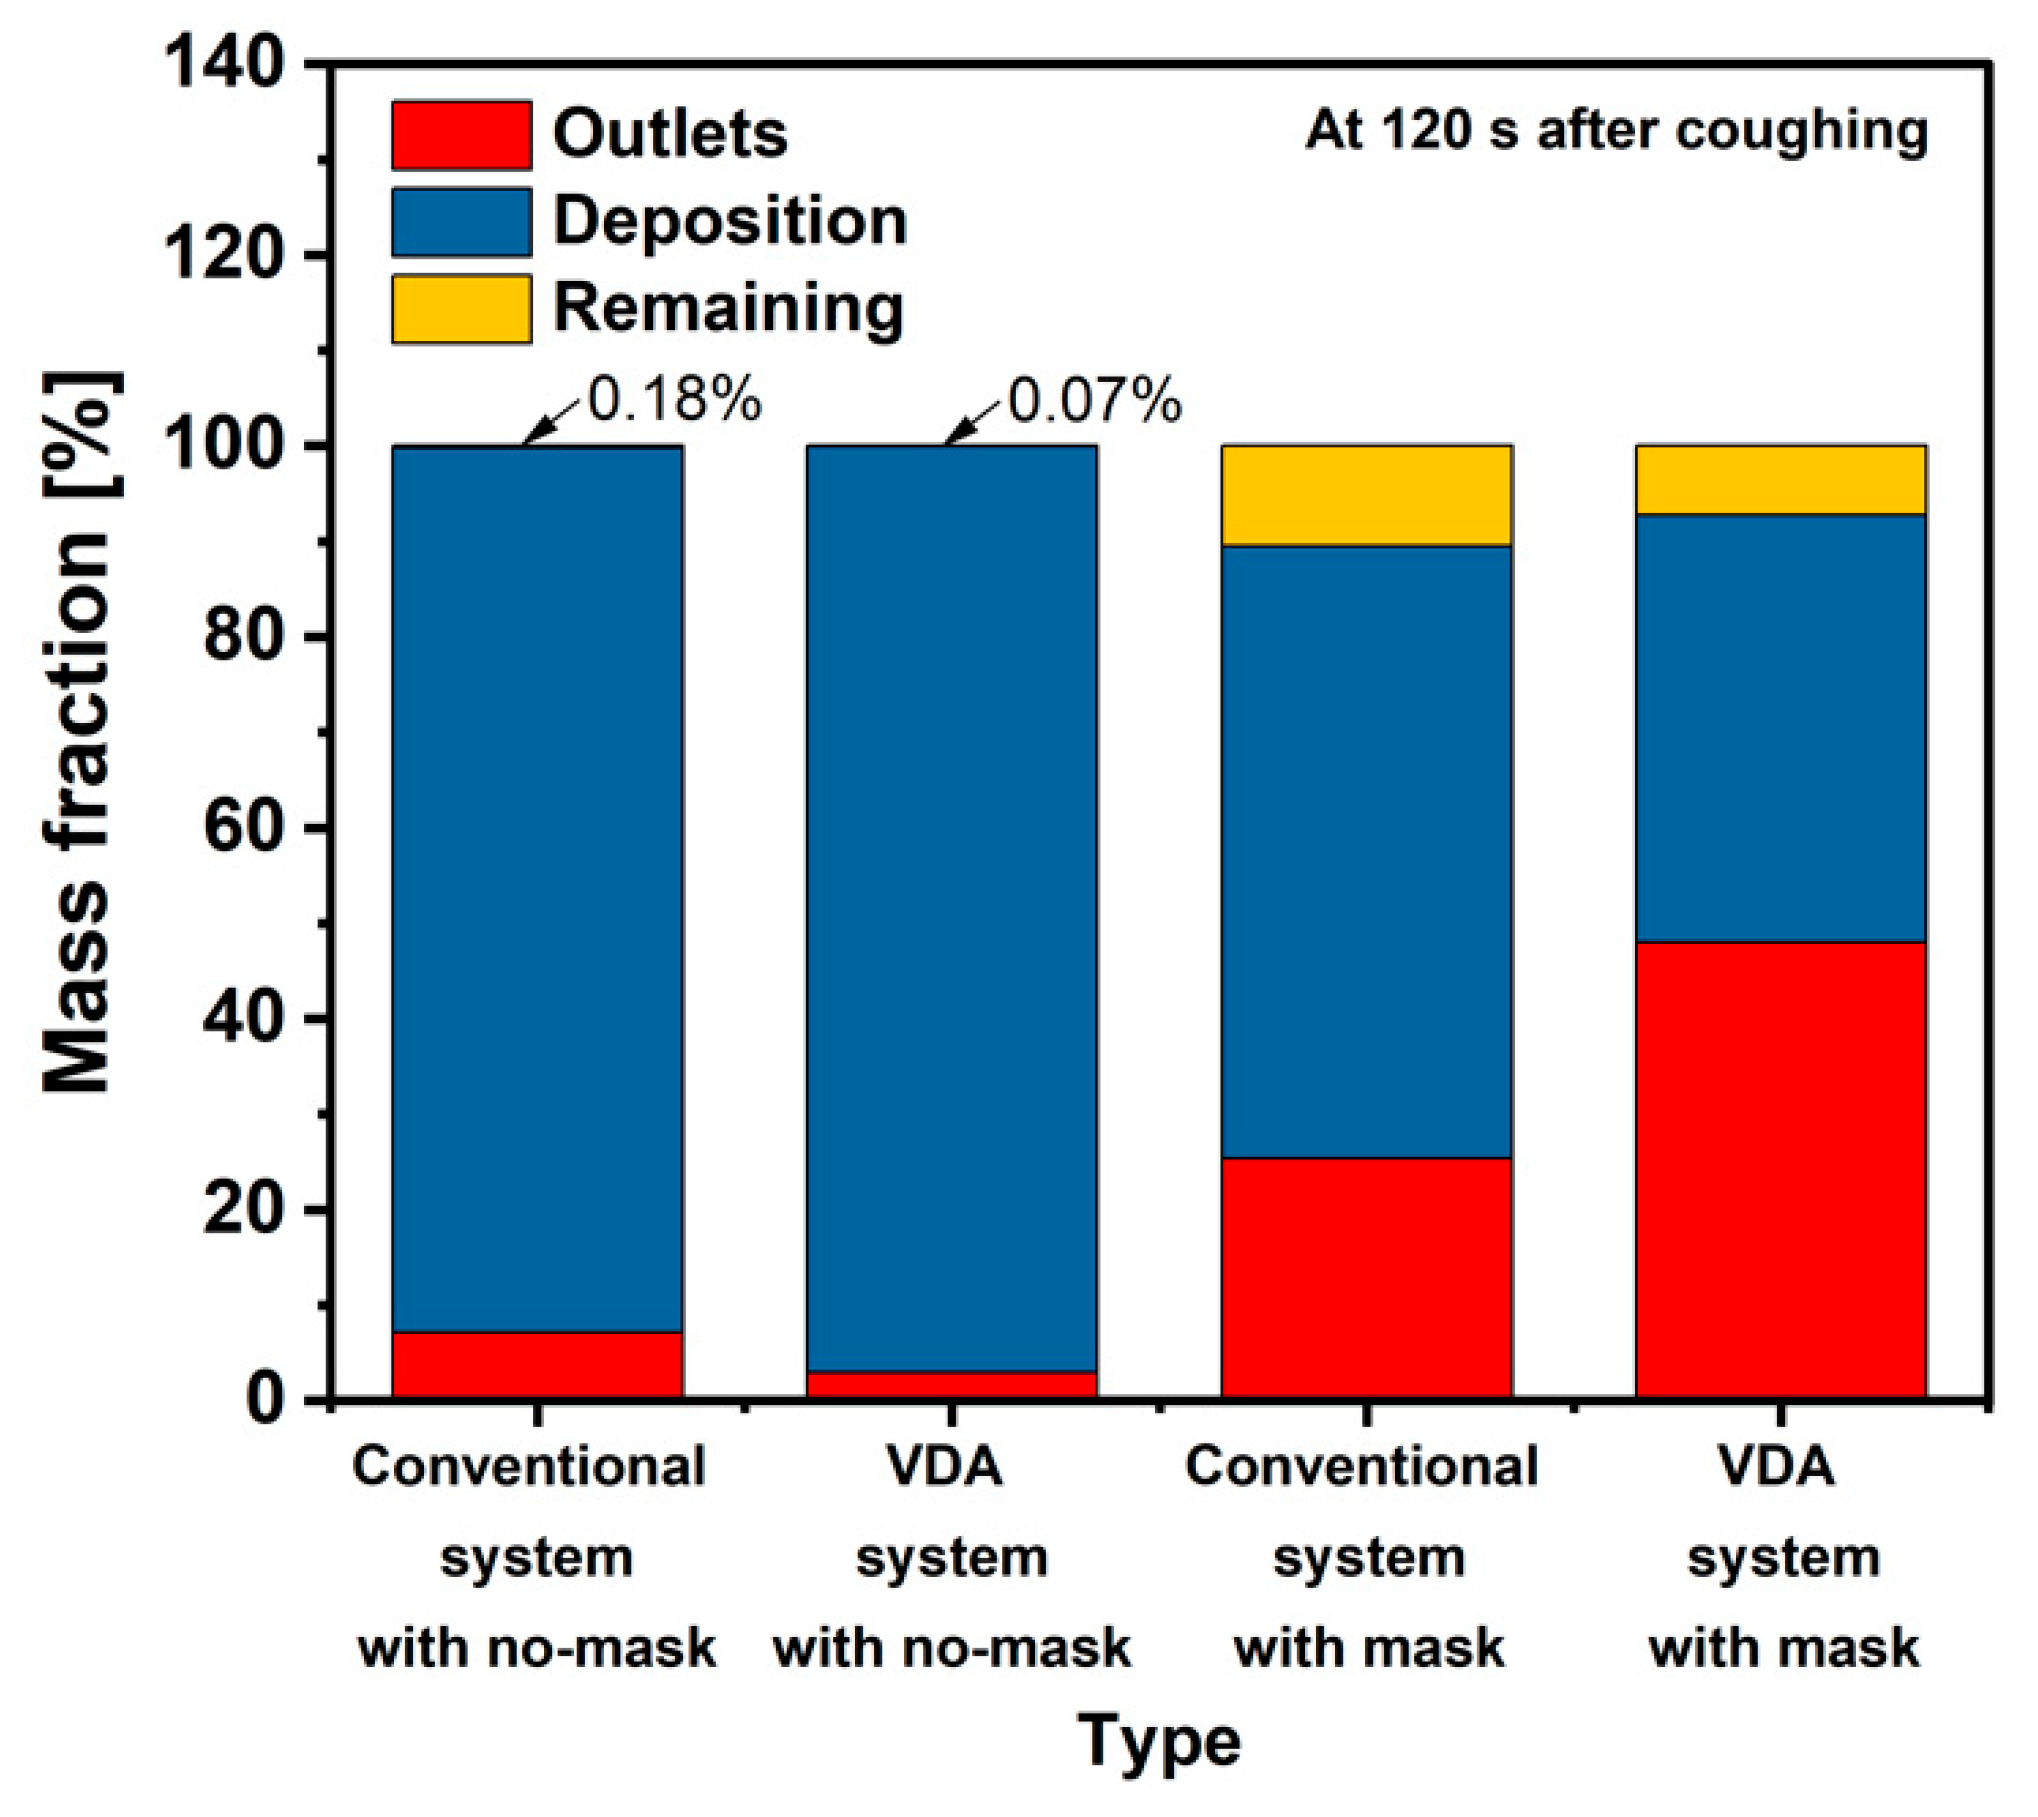
Figure 17 depicts the proportion of droplets in the conventional and VDA systems with and without the mask after 120 s of coughing. In with-the-mask cases, the mass fraction was calculated for the droplets that passed through the mask. In comparison with the conventional system, the VDA system with and without the mask exhibited smaller remaining droplets in the cabin. Particularly, the VDA system with the mask exhibited the highest exhaust portion of 48% owing to the short distance from the inlet to the outlet of the airflow. Therefore, the VDA system effectively exhausted droplets and reduced droplet transmission compared to the conventional system. After 120 s of coughing, the mass fraction of the remaining droplets in all systems was less than approximately 0.2%. However, as droplets smaller than 10 µm continued to float in the cabin, the number of droplets was relatively large despite the small mass fraction of droplets. Therefore, further studies are required to effectively exhaust the small droplets.
4. Conclusions
This study proposed a novel VDA system to supply a strong downstream airflow to mitigate droplet transmission in a high-speed train cabin. A five-column section of the cabin and one infected person with a close-fitting mask and without a mask were adopted in the simulation domain. The 3D fluid dynamics simulations were conducted using the droplet particle tracking method to analyze the droplet transmission for no-mask and with-the-mask cases. Compared to the conventional system, the VDA system exhibited a lower airflow circulation in the cabin than the conventional system owing to the downward airflow design. After 5 s of coughing, the back surface of the front seat exhibited a high risk of contact infection owing to droplet deposition in both conventional and VDA systems. After 120 s, the droplet number in the VDA system decreased by 72.1% than that in the conventional system. Moreover, the number of seats at risk of infection in the VDA system was lower than that in the conventional system. The results of mask effects indicated that the number of droplets in the with-the-mask case was significantly lower than that in the no-mask case owing to the effect of droplet filtering. In the cases of both with and without the mask, the proposed VDA system effectively suppressed droplet transmission as the maximum droplet travel distances of the VDA systems were 49.9% to 67.0%, respectively, of those of conventional systems. Moreover, the VDA system exhibited small remaining droplets and high exhaust through the outlet. Overall, both droplet number and droplet transmission area can be reduced in the train cabin owing to the effective airflow design of the proposed VDA system, thus preventing droplet infection. In the future, various case studies will be performed using the developing models considering the droplet evaporation and heat transfer according to the temperature and humidity. In addition, mitigating effects of the droplet transmission in the VDA system will be verified experimentally in an actual train system.
Author Contributions
S.Y. planned the study, contributed the main ideas, and is principally responsible for the writing of the manuscript; J.-C.K. revised the manuscript and conducted the methodology analysis. All authors have read and agreed to the published version of the manuscript.
Funding
This research was supported by a grant from the R&D Program (A Study on the International Standardization and Safety Standards Verification System of Railway New Technology, PK2204C2) of the Korea Railroad Research Institute.
Institutional Review Board Statement
Not applicable.
Informed Consent Statement
Informed consent was obtained from all subjects involved in the study.
Data Availability Statement
Not applicable.
Conflicts of Interest
The authors declare no conflict of interest.
References
- Chi, X.; Hua, J.; Hua, S.; Ren, X.; Yang, S. Assessing the Impacts of Human Activities on Air Quality during the COVID-19 Pandemic through Case Analysis. Atmosphere 2022, 13, 181. [Google Scholar] [CrossRef]
- Deb, P.; Furceri, D.; Ostry, J.D.; Tawk, N. The economic effects of Covid-19 containment measures. Open Econ. Rev. 2021, 33, 1–32. [Google Scholar] [CrossRef]
- Otter, J.A.; Donskey, C.; Yezli, S.; Douthwaite, S.; Goldenberg, S.; Weber, D.J. Transmission of SARS and MERS coronaviruses and influenza virus in healthcare settings: The possible role of dry surface contamination. J. Hops. Infect. 2016, 92, 235–250. [Google Scholar] [CrossRef] [PubMed] [Green Version]
- Xu, X.; Zhang, J.; Zhu, L.; Huang, Q. Transmission of SARS-CoV-2 Indoor and Outdoor Environments. Atmosphere 2021, 12, 1640. [Google Scholar] [CrossRef]
- Jayaweera, M.; Perera, H.; Gunawardana, B.; Manatunge, J. Transmission of COVID-19 virus by droplets and aerosols: A critical review on the unresolved dichotomy. Environ. Res. 2020, 188, 109819. [Google Scholar] [CrossRef]
- Hang, J.; Li, Y.; Jin, R. The influence of human walking on the flow and airborne transmission in a six-bed isolation room: Tracer gas simulation. Build. Environ. 2014, 77, 119–134. [Google Scholar] [CrossRef]
- Kakimoto, K.; Kamiya, H.; Yamagishi, T.; Matsui, T.; Suzuki, M.; Wakita, T. Initial investigation of transmission of COVID-19 among crew members during quarantine of a cruise ship—Yokohama, Japan, February 2020. Morb. Mortal. Wkly. Rep. 2020, 69, 312. [Google Scholar] [CrossRef]
- Yang, N.; Shen, Y.; Shi, C.; Ma, A.H.; Zhang, X.; Jian, X.; Wang, L.; Shi, J.; Wu, C.; Li, G.; et al. In-flight transmission cluster of COVID-19: A retrospective case series. Infect. Dis. 2020, 52, 891–901. [Google Scholar] [CrossRef]
- Shen, Y.; Li, C.; Dong, H.; Wang, Z.; Martinez, L.; Sun, Z.; Handel, A.; Chen, Z.; Chen, E.; Ebell, M.; et al. Airborne Transmission of COVID-19: Epidemiologic Evidence from Two Outbreak Investigations. 2020. Available online: https://www.researchgate.net/publication/340418430_Airborne_transmission_of_COVID-19_epidemiologic_evidence_from_two_outbreak_investigations (accessed on 1 April 2022).
- Hu, M.; Lin, H.; Wang, J.; Xu, C.; Tatem, A.J.; Meng, B.; Zhang, X.; Liu, Y.; Wang, P.; Wu, G.; et al. Risk of coronavirus disease 2019 transmission in train passengers: An epidemiological and modeling study. Clin. Infect. Dis. 2021, 72, 604–610. [Google Scholar] [CrossRef]
- Schmeling, D.; Volkmann, A. On the experimental investigation of novel low-momentum ventilation concepts for cooling operation in a train compartment. Build. Environ. 2020, 182, 107116. [Google Scholar] [CrossRef]
- Woodward, H.; Fan, S.; Bhagat, R.K.; Dadonau, M.; Wykes, M.D.; Martin, E.; Hama, S.; Tiwari, A.; Dalziel, S.B.; Jones, R.L.; et al. Air Flow Experiments on a Train Carriage—Towards Understanding the Risk of Airborne Transmission. Atmosphere 2021, 12, 1267. [Google Scholar] [CrossRef]
- Wang, Z.; Galea, E.; Grandison, A.; Ewer, J.; Jia, F. A coupled Computational Fluid Dynamics and Wells-Riley model to predict COVID-19 infection probability for passengers on long-distance trains. Saf. Sci. 2022, 147, 105572. [Google Scholar] [CrossRef] [PubMed]
- Yan, Y.; Li, X.; Fang, X.; Yan, P.; Tu, J. Transmission of COVID-19 virus by cough-induced particles in an airliner cabin section. Eng. Appl. Comp. Fluid Mech. 2021, 15, 934–950. [Google Scholar] [CrossRef]
- Li, F.; Jiang, G.; Hu, T. Coughing Intensity and Wind Direction Effects on the Transmission of Respiratory Droplets: A Computation with Euler–Lagrange Method. Atmosphere 2022, 13, 594. [Google Scholar] [CrossRef]
- Liu, H.; He, S.; Shen, L.; Hong, J. Simulation-based study on the COVID-19 airborne transmission in a restaurant. Phys. Fluids 2020, 33, 023301. [Google Scholar] [CrossRef] [PubMed]
- Li, W.; Chong, A.; Hasama, T.; Xu, L.; Lasternas, B.; Tham, K.W.; Lam, K.P. Effects of ceiling fans on airborne transmission in an air-conditioned space. Build. Environ. 2021, 198, 107887. [Google Scholar] [CrossRef]
- Jung, M.; Chung, W.J.; Sung, M.; Jo, S.; Hong, J. Analysis of Infection Transmission Routes through Exhaled Breath and Cough Particle Dispersion in a General Hospital. Int. J. Environ. Res. Public Health 2022, 19, 2512. [Google Scholar] [CrossRef]
- Miller, S.L.; Mukherjee, D.; Wilson, J.; Clements, N.; Steiner, C. Implementing a negative pressure isolation space within a skilled nursing facility to control SARS-CoV-2 transmission. Am. J. Infect. Control 2021, 49, 438–446. [Google Scholar] [CrossRef]
- Zhang, Z.; Han, T.; Yoo, K.H.; Capecelatro, J.; Boehman, A.L.; Maki, K. Disease transmission through expiratory aerosols on an urban bus. Phys. Fluids 2021, 33, 015116. [Google Scholar] [CrossRef]
- Yang, X.; Ou, C.; Yang, H.; Liu, L.; Song, T.; Kang, M.; Lin, H.; Hang, J. Transmission of pathogen-laden expiratory droplets in a coach bus. J. Hazard. Mater. 2020, 397, 122609. [Google Scholar] [CrossRef]
- Szczepanik-Scislo, N.; Antonowicz, A.; Scislo, L. PIV measurement and CFD simulations of an air terminal device with a dynamically adapting geometry. SN Appl. Sci. 2019, 1, 370. [Google Scholar] [CrossRef] [Green Version]
- Liu, Z.; Li, R.; Wu, Y.; Ju, R.; Gao, N. Numerical study on the effect of diner divider on the airborne transmission of diseases in canteens. Energy Build. 2021, 248, 111171. [Google Scholar] [CrossRef]
- Pendar, M.R.; Páscoa, J.C. Numerical modeling of the distribution of virus carrying saliva droplets during sneeze and cough. Phys. Fluids 2020, 32, 083305. [Google Scholar] [CrossRef] [PubMed]
- Lee, K.; Oh, J.; Kim, D.; Yoo, J.; Yun, G.J.; Kim, J. Effects of the filter microstructure and ambient air condition on the aerodynamic dispersion of sneezing droplets: A multiscale and multiphysics simulation study. Phys. Fluids 2021, 33, 063317. [Google Scholar] [CrossRef]
- Heo, K.J.; Park, I.; Lee, G.; Hong, K.; Han, B.; Jung, J.H.; Kim, S.B. Effects of air purifiers on the spread of simulated respiratory droplet nuclei and virus aggregates. Int. J. Environ. Res. Public Health 2021, 18, 8426. [Google Scholar] [CrossRef]
- Ren, C.; Xi, C.; Wang, J.; Feng, Z.; Nasiri, F.; Cao, S.J.; Haghighat, F. Mitigating COVID-19 infection disease transmission in indoor environment using physical barriers. Sustain. Cities Soc. 2021, 74, 103175. [Google Scholar] [CrossRef]
- Sha, H.; Zhang, X.; Qi, D. Optimal control of high-rise building mechanical ventilation system for achieving low risk of COVID-19 transmission and ventilative cooling. Sustain. Cities Sco. 2021, 74, 103256. [Google Scholar] [CrossRef]
- Yun, S.; Lee, D.; Jang, D.S.; Lee, M.; Kim, Y. Numerical analysis on thermo-fluid–structural performance of graded lattice channels produced by metal additive manufacturing. Appl. Therm. Eng. 2021, 193, 117024. [Google Scholar] [CrossRef]
- Xu, F.Y.; Lu, H.F.; Chen, Z.; Guan, Z.C.; Chen, Y.W.; Shen, G.W.; Jiang, Z. Selection of a computational fluid dynamics (CFD) model and its application to greenhouse pad-fan cooling (PFC) systems. J. Clean. Prod. 2021, 302, 127013. [Google Scholar] [CrossRef]
- Yun, S.; Kwon, J.; Lee, D.; Shin, H.H.; Kim, Y. Heat transfer and stress characteristics of additive manufactured FCCZ lattice channel using thermal fluid-structure interaction model. Int. J. Heat Mass Transf. 2020, 149, 119187. [Google Scholar] [CrossRef]
- Yun, S.; Hong, S.H.; Song, K.S.; Kwon, J.; Kim, Y. Experimental and numerical analyses of quenching performance of hot stamping blanks by two-phase refrigerant cooling using R1234yf. Int. J. Heat Mass Transf. 2021, 173, 121231. [Google Scholar] [CrossRef]
- Gomez-Flores, A.; Hwang, G.; Ilyas, S.; Kim, H.A. CFD study of the transport and fate of airborne droplets in a ventilated office: The role of droplet-droplet interactions. Front. Environ. Sci. Eng. 2022, 16, 31. [Google Scholar] [CrossRef] [PubMed]
- Ansys, C.F.X. ANSYS CFX-solver theory guide. Ansys CFX Release 2009, 15317, 724–746. [Google Scholar]
- Mirikar, D.; Palanivel, S.; Arumuru, V. Droplet fate, efficacy of face mask, and transmission of virus-laden droplets inside a conference room. Phys. Fluids 2021, 33, 065108. [Google Scholar] [CrossRef]
- Dbouk, T.; Drikakis, D. On respiratory droplets and face masks. Phys. Fluids 2020, 32, 063303. [Google Scholar] [CrossRef]
- Jaksic, D.; Jaksic, N. The porosity of masks used in medicine. Tekstilec 2004, 47, 301–304. [Google Scholar]
- Gupta, J.K.; Lin, C.H.; Chen, Q. Flow dynamics and characterization of a cough. Indoor Air 2009, 19, 517–525. [Google Scholar] [CrossRef]
- Yan, Y.; Li, X.; Tu, J. Thermal effect of human body on cough droplets evaporation and dispersion in an enclosed space. Build. Environ. 2019, 148, 96–106. [Google Scholar] [CrossRef]
- Chao, C.Y.H.; Wan, M.P.; Morawska, L.; Johnson, G.R.; Ristovski, Z.D.; Hargreaves, M.; Katoshevski, D. Characterization of expiration air jets and droplet size distributions immediately at the mouth opening. J. Aerosol Sci. 2009, 40, 122–133. [Google Scholar] [CrossRef] [Green Version]
- Shah, I.; Kim, S.W.; Kim, K.; Doh, Y.H.; Choi, K.H. Experimental and numerical analysis of Y-shaped split and recombination micro-mixer with different mixing units. Chem. Eng. J. 2019, 358, 691–706. [Google Scholar] [CrossRef]
- Kim, K.; Shah, I.; Ali, M.; Aziz, S.; Khalid, M.A.U.; Kim, Y.S.; Choi, K.H. Experimental and numerical analysis of three Y-shaped split and recombination micromixers based on cantor fractal structures. Microsyst. Technol. 2020, 26, 1783–1796. [Google Scholar] [CrossRef]
- Agrawal, A.; Bhardwaj, R. Reducing chances of COVID-19 infection by a cough cloud in a closed space. Phys. Fluids 2020, 32, 101704. [Google Scholar] [CrossRef] [PubMed]
- Rosti, M.E.; Olivieri, S.; Cavaiola, M.; Seminara, A.; Mazzino, A. Fluid dynamics of COVID-19 airborne infection suggests urgent data for a scientific design of social distancing. Sci. Rep. 2020, 10, 22426. [Google Scholar] [CrossRef] [PubMed]
Figure 1.
Simulation domain and schematic structure in the high-speed train cabin: (a) conventional system; (b) vertical drop airflow (VDA) system; (c) location of seats; and (d) the infected person without a mask and with a close-fitting mask.
Figure 1.
Simulation domain and schematic structure in the high-speed train cabin: (a) conventional system; (b) vertical drop airflow (VDA) system; (c) location of seats; and (d) the infected person without a mask and with a close-fitting mask.

Figure 2.
Flowchart of the simulation.

Figure 3.
Boundary conditions of (a) cough flow rate; and (b) mass and number fractions of droplets.
Figure 3.
Boundary conditions of (a) cough flow rate; and (b) mass and number fractions of droplets.

Figure 4.
Grid-dependency tests of (a) droplet mass and (b) maximum and average velocity.

Figure 5.
Mesh characteristics of simulation domains.

Figure 6.
Streamline in the high-speed train cabin considering the conventional and VDA systems: (a) isometric view; (b) x–y plane; and (c) y–z plane.
Figure 6.
Streamline in the high-speed train cabin considering the conventional and VDA systems: (a) isometric view; (b) x–y plane; and (c) y–z plane.

Figure 7.
Droplet distributions in the conventional and VDA systems between 0 and 10 s after coughing. Relative droplet size is observed.
Figure 7.
Droplet distributions in the conventional and VDA systems between 0 and 10 s after coughing. Relative droplet size is observed.

Figure 8.
Variation in the droplet mass in the conventional and VDA systems according to the time after coughing.
Figure 8.
Variation in the droplet mass in the conventional and VDA systems according to the time after coughing.

Figure 9.
Droplet deposition distributions in the conventional and VDA systems (a) at the back surface of the front seat and (b) on the floor under the seat.
Figure 9.
Droplet deposition distributions in the conventional and VDA systems (a) at the back surface of the front seat and (b) on the floor under the seat.

Figure 10.
Droplet distributions in the conventional and VDA systems between 30 and 120 s after coughing. The droplet size is uniform.
Figure 10.
Droplet distributions in the conventional and VDA systems between 30 and 120 s after coughing. The droplet size is uniform.

Figure 11.
Variation in the droplet number in the conventional and VDA systems according to the time after coughing.
Figure 11.
Variation in the droplet number in the conventional and VDA systems according to the time after coughing.

Figure 12.
Droplet distributions in the conventional and VDA systems with a mask between 0 and 10 s after coughing. The droplet size is uniform.
Figure 12.
Droplet distributions in the conventional and VDA systems with a mask between 0 and 10 s after coughing. The droplet size is uniform.

Figure 13.
Variation in the velocity distribution and streamline in the VDA system when coughing with and without the mask.
Figure 13.
Variation in the velocity distribution and streamline in the VDA system when coughing with and without the mask.

Figure 14.
Droplet distributions in the conventional and VDA systems with the mask between 30 and 120 s after coughing. The droplet size is uniform.
Figure 14.
Droplet distributions in the conventional and VDA systems with the mask between 30 and 120 s after coughing. The droplet size is uniform.

Figure 15.
Variation in the droplet number in the conventional and VDA systems with and without the mask.
Figure 15.
Variation in the droplet number in the conventional and VDA systems with and without the mask.

Figure 16.
Variation in the (a) minimum and (b) maximum droplet travel distances in the conventional and VDA systems with and without the mask.
Figure 16.
Variation in the (a) minimum and (b) maximum droplet travel distances in the conventional and VDA systems with and without the mask.

Figure 17.
Proportion of droplets in the conventional and VDA systems with and without the mask 120 s after coughing.
Figure 17.
Proportion of droplets in the conventional and VDA systems with and without the mask 120 s after coughing.


Table 1.
Previous studies on droplet transmission and reduction of infection risk.
| Target | Analysis Method | Reduction of Infection Risk | Reference |
|---|---|---|---|
| Building | |||
| Restaurant | Simulation | - | [16] |
| Classroom | Simulation | - | [17] |
| Hospital | Simulation | - | [18] |
| Skilled nursing facility | Simulation | - | [19] |
| Room | Experiment and simulation | - | [22] |
| Simulation | Mask | [26] | |
| Test chamber | Experiment | Air purifier | [27] |
| Office | Simulation | Barrier | [28] |
| Simulation | Ventilation control | [29] | |
| Transportation | |||
| Cruise ship | Laboratory-confirmed case | - | [7] |
| Airplane | Laboratory-confirmed case | - | [8] |
| Simulation | - | [14] | |
| Bus | Laboratory-confirmed case | - | [9] |
| Simulation | - | [20] | |
| Simulation | - | [21] | |
| Train | Laboratory-confirmed case | - | [10] |
| Experiment | - | [12] | |
| Simulation | - | [13] | |
| Simulation | Novel airflow design | Present study |
Table 2.
Specifications of the high-speed train cabin.
| Parameters | Values |
|---|---|
| Cabin length | 4650 mm |
| Cabin width | 2862 mm |
| Cabin height | 2196 mm |
| Seat length | 550 mm |
| Seat width | 535 mm |
| Seat height | 1100 mm |
| Distance between seats | 930 mm |
| Height of the seated person | 1130 mm |
| Height of the person’s mouth from the floor | 1000 mm |
| Mouth area | 264 mm2 |
| Mask thickness | 1 mm |
| Mask area | 7332 mm2 |
Table 3.
Geometric parameters of the conventional and vertical drop airflow (VDA) systems.
| Parameters | Values |
|---|---|
| Conventional system | |
| Inlet area | 47,520 mm2 |
| Number of inlets | 4 |
| Outlet area | 130,200 mm2 |
| Number of outlets | 2 |
| Ventilation rate | 27.0 h−1 |
| VDA system | |
| Inlet area | 9613 mm2 |
| Number of inlets | 20 |
| Outlet area | 30,800 mm2 |
| Number of outlets | 20 |
| Ventilation rate | 27.3 h−1 |
Publisher’s Note: MDPI stays neutral with regard to jurisdictional claims in published maps and institutional affiliations. |
© 2022 by the authors. Licensee MDPI, Basel, Switzerland. This article is an open access article distributed under the terms and conditions of the Creative Commons Attribution (CC BY) license (https://creativecommons.org/licenses/by/4.0/).
Share and Cite
MDPI and ACS Style
Yun, S.; Kim, J.-C. Numerical Evaluation of a Novel Vertical Drop Airflow System to Mitigate Droplet Transmission in Trains. Atmosphere 2022, 13, 829. https://0-doi-org.brum.beds.ac.uk/10.3390/atmos13050829
AMA Style
Yun S, Kim J-C. Numerical Evaluation of a Novel Vertical Drop Airflow System to Mitigate Droplet Transmission in Trains. Atmosphere. 2022; 13(5):829. https://0-doi-org.brum.beds.ac.uk/10.3390/atmos13050829
Chicago/Turabian StyleYun, Sungho, and Jae-Chul Kim. 2022. "Numerical Evaluation of a Novel Vertical Drop Airflow System to Mitigate Droplet Transmission in Trains" Atmosphere 13, no. 5: 829. https://0-doi-org.brum.beds.ac.uk/10.3390/atmos13050829
Note that from the first issue of 2016, this journal uses article numbers instead of page numbers. See further details here.