
Trends of Tropical Cyclone Translation Speed over the Western North Pacific during 1980−2018


1
Key Laboratory of Mesoscale Severe Weather, Ministry of Education, and School of Atmospheric Sciences, Nanjing University, Nanjing 210023, China
2
School of Energy and Environment, City University of Hong Kong, Hong Kong, China
*
Author to whom correspondence should be addressed.
Atmosphere 2022, 13(6), 896; https://0-doi-org.brum.beds.ac.uk/10.3390/atmos13060896
Submission received: 4 April 2022
/
Revised: 27 April 2022
/
Accepted: 26 May 2022
/
Published: 1 June 2022
(This article belongs to the Special Issue Tropical Cyclone Forecasting - Analysis and Methods)
Abstract
:Tropical cyclone (TC) translation speed often affects the time of strong wind attacks and precipitation accumulation in the areas that TCs pass through. Therefore, the trend of TC translation speed has important implications for TC-related risks in the current and future climate. In this paper, the trends of TC translation speed over the Western North Pacific (WNP) from 1980 to 2018 are analyzed, and TC lifetime maximum intensity (LMI) is proposed as a factor related to the interdecadal change of translation speed. During the periods with accurate data, 1980–1997 shows a decreasing trend in TC translation speed while an increasing trend was found in 1998–2018. The main lifetime period contributing to a TC translation speed change is before the occurrence of the LMI. The change in the trend is related to both the TC’s characteristics itself and the environmental factors. For the period 1998–2018, an increasing trend of TC intensity has a significant influence on the trend of translation speed. For the environmental factors, a trend of east wind enhancement at and above 500 hPa as the steering flow is found mostly correlated in the active TC region of the WNP with westward translation before reaching LMI, accompanied by a weakening trend of 200–850 hPa vertical wind shear, and an increasing trend of potential intensity.
1. Introduction
Tropical cyclone (TC) has been a hot topic in meteorological research [1]. Recently, many scholars have started to pay attention to TC translation speed and have conducted lots of studies [2,3]. The influence of TC on the area through which the TC passes is different partly because of its translation speed. While a higher speed is often accompanied by higher-intensity and more destructive forces [4], a lower speed means that TCs stay longer and tend to bring long-term rainfall [4,5,6]. The study of TC translation speed is therefore of great importance.
Kossin [7] found that the global TC translation speed showed a decreasing trend for nearly 70 years from 1949 to 2016, and the decreasing trend varied among different ocean basins, with the most significant decreasing trend over the Western North Pacific (WNP). Wang et al. [6] came to the same conclusion as Kossin that the WNP TC translation speed has been decreasing during the period 1949–2018. Kossin suggested that this decrease over the last 70 years may be due to the enhanced rainfall and weakened summer tropical circulation. However, Kossin’s conclusions might have large uncertainties. Yamaguchi et al. [4] found an increase in TC translation speed rather than a decrease and a tendency of TCs to move poleward. Using the same data analysis as Kossin, Chang et al. [8] found that the increasing trend of TC translation speed started in 1998, and the South China Sea (105–120° E, 5–25° N) was the most significant sea area. Chan and Moon et al. [2,5] argued that one reason for the deviation of Kossin’s conclusions from those of later scholars is the lack of accurate observations of some slow-moving weak TCs before 1965, so that the trend decreased in earlier years, while in more recent years, especially after 1980, the observations of TCs are more accurate. Therefore, the trend of global TC and WNP TC translation speed is still controversial.
There are many factors affecting TC translation speed, including environmental factors, geographical location, and intrinsic factors. In terms of environmental factors, changes in external factors such as sea surface temperature (SST), geopotential height, vertical wind shear, and steering flow can affect translation speed [5,7,8,9,10]. In terms of geographical location, TC translation speed can change substantially before and after landfall and tend to move faster after landfall than before. There is also a relationship between translation speed and latitude. When TCs move to higher latitudes, translation speed tends to increase [10]. In terms of the TC development stage, for the same TC, translation speed also shows different change patterns at different developing stages. From the genesis to the tropical storm stage, translation speed increases significantly with the increase in intensity, and then it changes more slowly [6,10,11], which shows that the magnitude of intensity is particularly important for TC translation speed. In the study of TC intensity, lifetime maximum intensity (LMI) is an important factor in describing TC intensity. Kossin and Emanuel found that globally, the latitude of LMI has had a tendency to shift poleward globally since 1980 [12,13], and this trend is more significant in WNP compared to other ocean basins [14,15,16].
So far, combining the above discussion on TC translation speed and intensity (especially LMI), it has been found that the time when the trend change of WNP LMI starts and the TC translation speed changes from decreasing to increasing, as found by Zhang et al. [10] are basically around 1980. Therefore, based on the temporal consistency between the two in the interdecadal change, this paper considers introducing the change of LMI, combining the change of TC intensity and the change of translation speed. In other words, the consistency between TC translation speed and TC LMI at the turning point, from a new perspective of the effect of intensity on translation speed, and thus studying the trend change of TC translation speed in the interdecadal scale. The scientific question to be investigated is which of the two stages of TC lifetime before and after reaching LMI dominates the trend of TC translation speed at the interdecadal scale? In addition, what are the main factors that affect the interdecadal trend variation of TC translation speed? In this paper, we introduce LMI as a reference based on previous studies of TC translation speed over the WNP, with the aim of identifying the period with a more dominant contribution to translation speed. Further, while past studies have mostly discussed the role of TC translation speed on TC intensity, we in turn illustrate the contribution of intensity to translation speed and explain the effect of a range of intensity-related factors on translation speed.
2. Materials and Methods
The TC best-track data set used in this study is obtained from the Joint Typhoon Warning Center (JTWC), which provides the TC position and intensity data at 6 h intervals over WNP. The study period is from June to November during the period 1980–2018 because the pre-satellite era before 1980 may be subject to observational systematic errors, and the results may be less accurate [10,16,17,18]. June to November is chosen as the active typhoon period, which accounts for more than 90% of the annual number of TCs. A total of 962 WNP TCs were included, including 471 for the period 1990–1997 and 491 for the period 1998–2018. SST and wind field are obtained from the European Centre for Medium-Range Weather Forecasts (ECMWF)’s ERA5 (ECMWF Reanalysis v5) reanalysis data at 6 h intervals. The horizontal resolution of SST is 1° latitude × 1° longitude, and of the wind field is 2.5° latitude × 2.5° longitude. The selected WNP range is (0–40° N, 100–160° E).
The first 6-hourly position at which the wind speed reaches 35 knots is selected as the genesis location, and the last position of 35 knots after weakening is selected as the point of TC dissipation. For the same TC, there are two cases for the selection of TC LMI: if there is only one maximum value of intensity, then it is selected as the LMI; if several identical maximum values of intensity exist, then the first position is selected as the location of LMI.
TC translation speed is calculated using the method of Zhang et al. [10], which uses the geographic distance between two consecutive 6-hourly TC positions on the Earth’s surface calculated under the World Geodetic System 1984 (WGS-84) ellipsoidal model of the Earth.
TC potential intensity (PI) is calculated based on the method mentioned by Bister and Emanuel [19], in which SST and sea level pressure data are obtained from ECMWF’s ERA5 reanalysis data. In addition, the time series trends in this study are obtained by linear regression analysis, and statistical significance tests are performed using t-tests. To obtain the time series of environmental factors influencing each TC, the variables are averaged over a circle with a radius of 5° latitude/longitude from the TC center.
3. Results
3.1. The Change of Translation Speed Trends in Two Periods
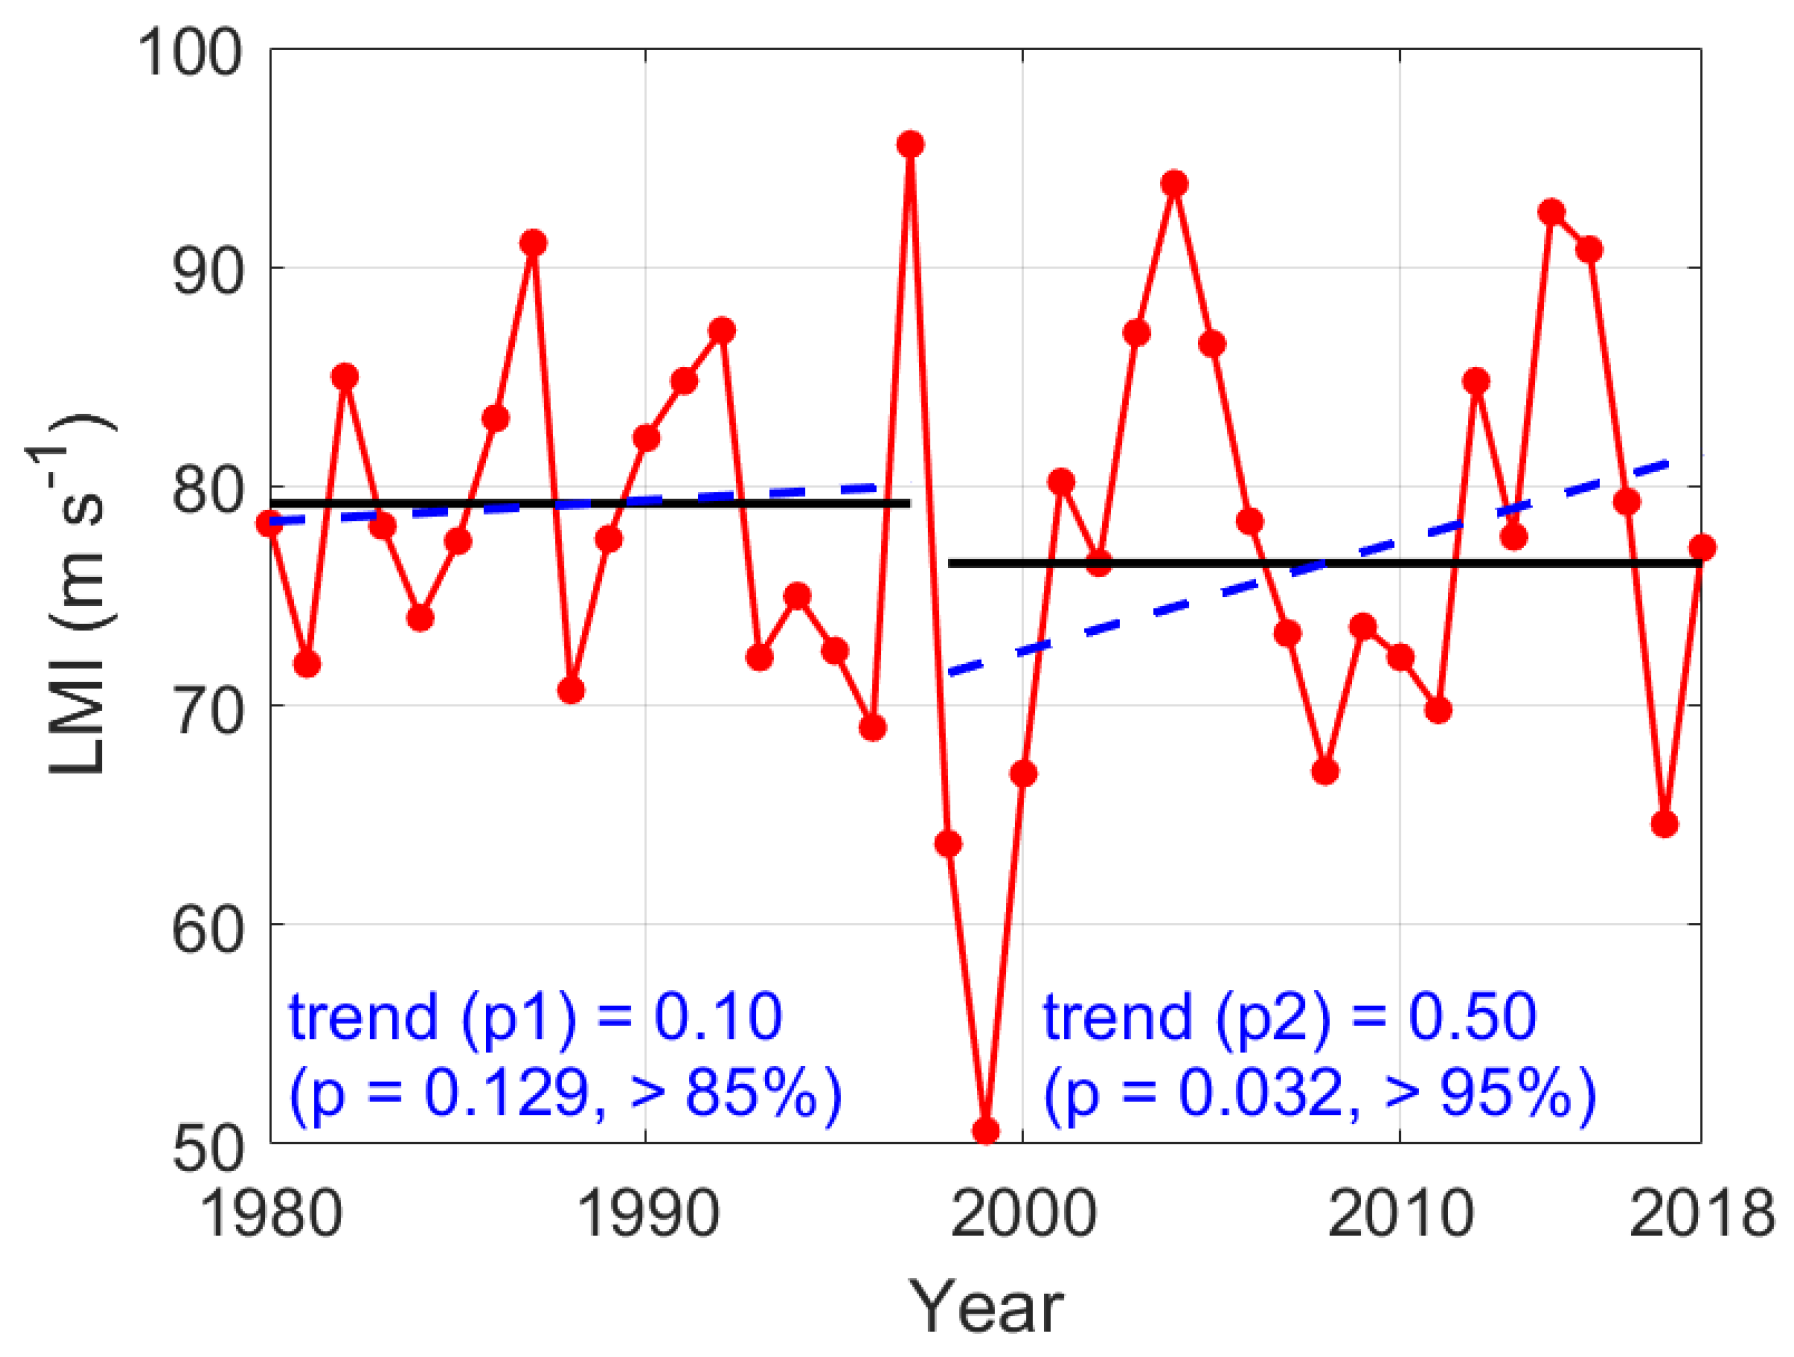
Table 1 shows the numbers and LMI values of WNP TCs from June to November during the period 1980–2018, which gives a clear picture of the TC activity for each year. Here, the LMI values were taken as the mean LMI of all the TCs that existed in the WNP from June to November for a particular year. The trend of WNP TC LMI during the TC active period 1980–2018 is shown in Figure 1. The LMI reaches the maximum value in 1997, then decreases rapidly and reaches the minimum value in 1999. The 39-year period is divided into two periods, from 1980 to 1997 and from 1998 to 2018, which are referred to as P1 and P2, respectively. The LMI in P1 shows an insignificant increasing trend but a significant increasing trend in P2, reaching a 95% confidence level. The result of the LMI trend is consistent with Mei et al. [20]. The reasons for choosing 1997 as the separation point for the two periods will be discussed later. In addition, considering some strong interannual signals, it is found that after removing the strong interannual signals, the basic time series trends still satisfy the original trends (not shown).
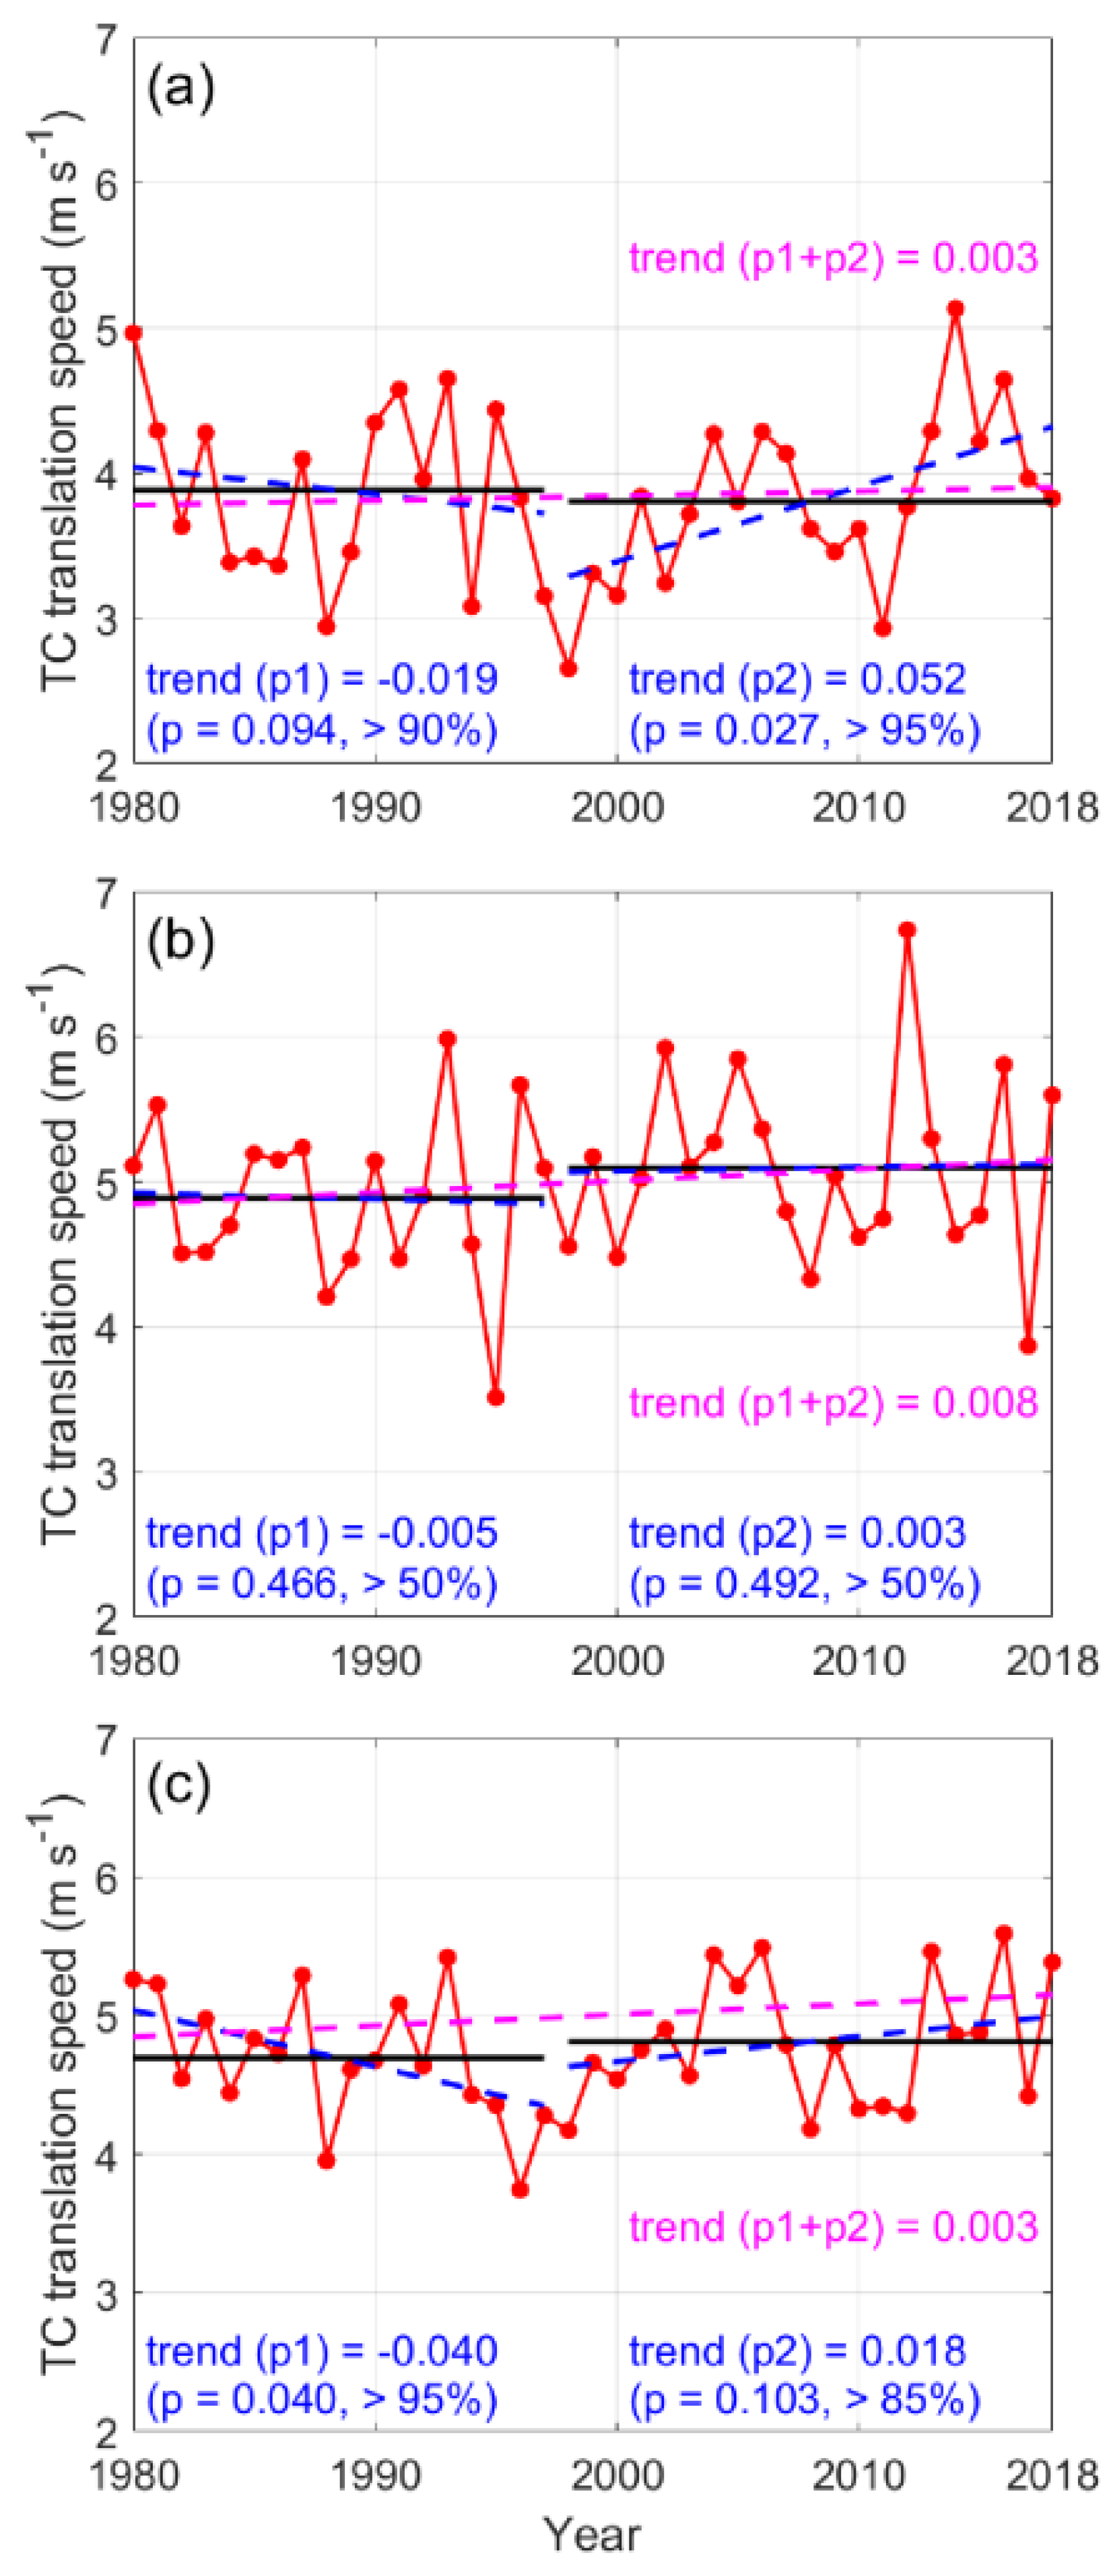
To study possible differences in the trend during different periods of a TC lifetime, we propose to use LMI as the turning point of TC lifetime and analyze the trend of TC translation speed in three stages: genesis–LMI (Figure 2a), LMI–dissipation (Figure 2b), and genesis–dissipation (Figure 2c). From 1980 to 2018, the translation speed of the above three stages showed a slight increasing trend but was insignificant. However, using 97/98 as the turning point and then analyzing the trend in the two periods, it is clear that for the genesis–LMI stage (Figure 2a), P1 shows a decreasing trend in translation speed, which continues until 1998 (the first year of P2), when it reaches the minimum value and then is reversed significantly with an increasing trend. For the LMI–dissipation phase (Figure 2b), both P1 and P2 show relatively flat trends. For the entire lifetime of genesis–dissipation (Figure 2c), P1 shows a very significant decreasing trend, while P2 shows an increasing trend, opposite to P1. For both the genesis–LMI (Figure 2a) and genesis–dissipation (Figure 2c) stages, the decreasing trend of P1 and the increasing trend of P2 are similar but with different slopes. In particular, the slope of an upward trend in P2 before LMI is 0.052 and more significant. Therefore, we may conclude that the trend of TC translation speed change in the whole lifetime is mainly contributed by the change before LMI. In the rest of this paper, we will focus only on the genesis–LMI stage of TC lifetime.
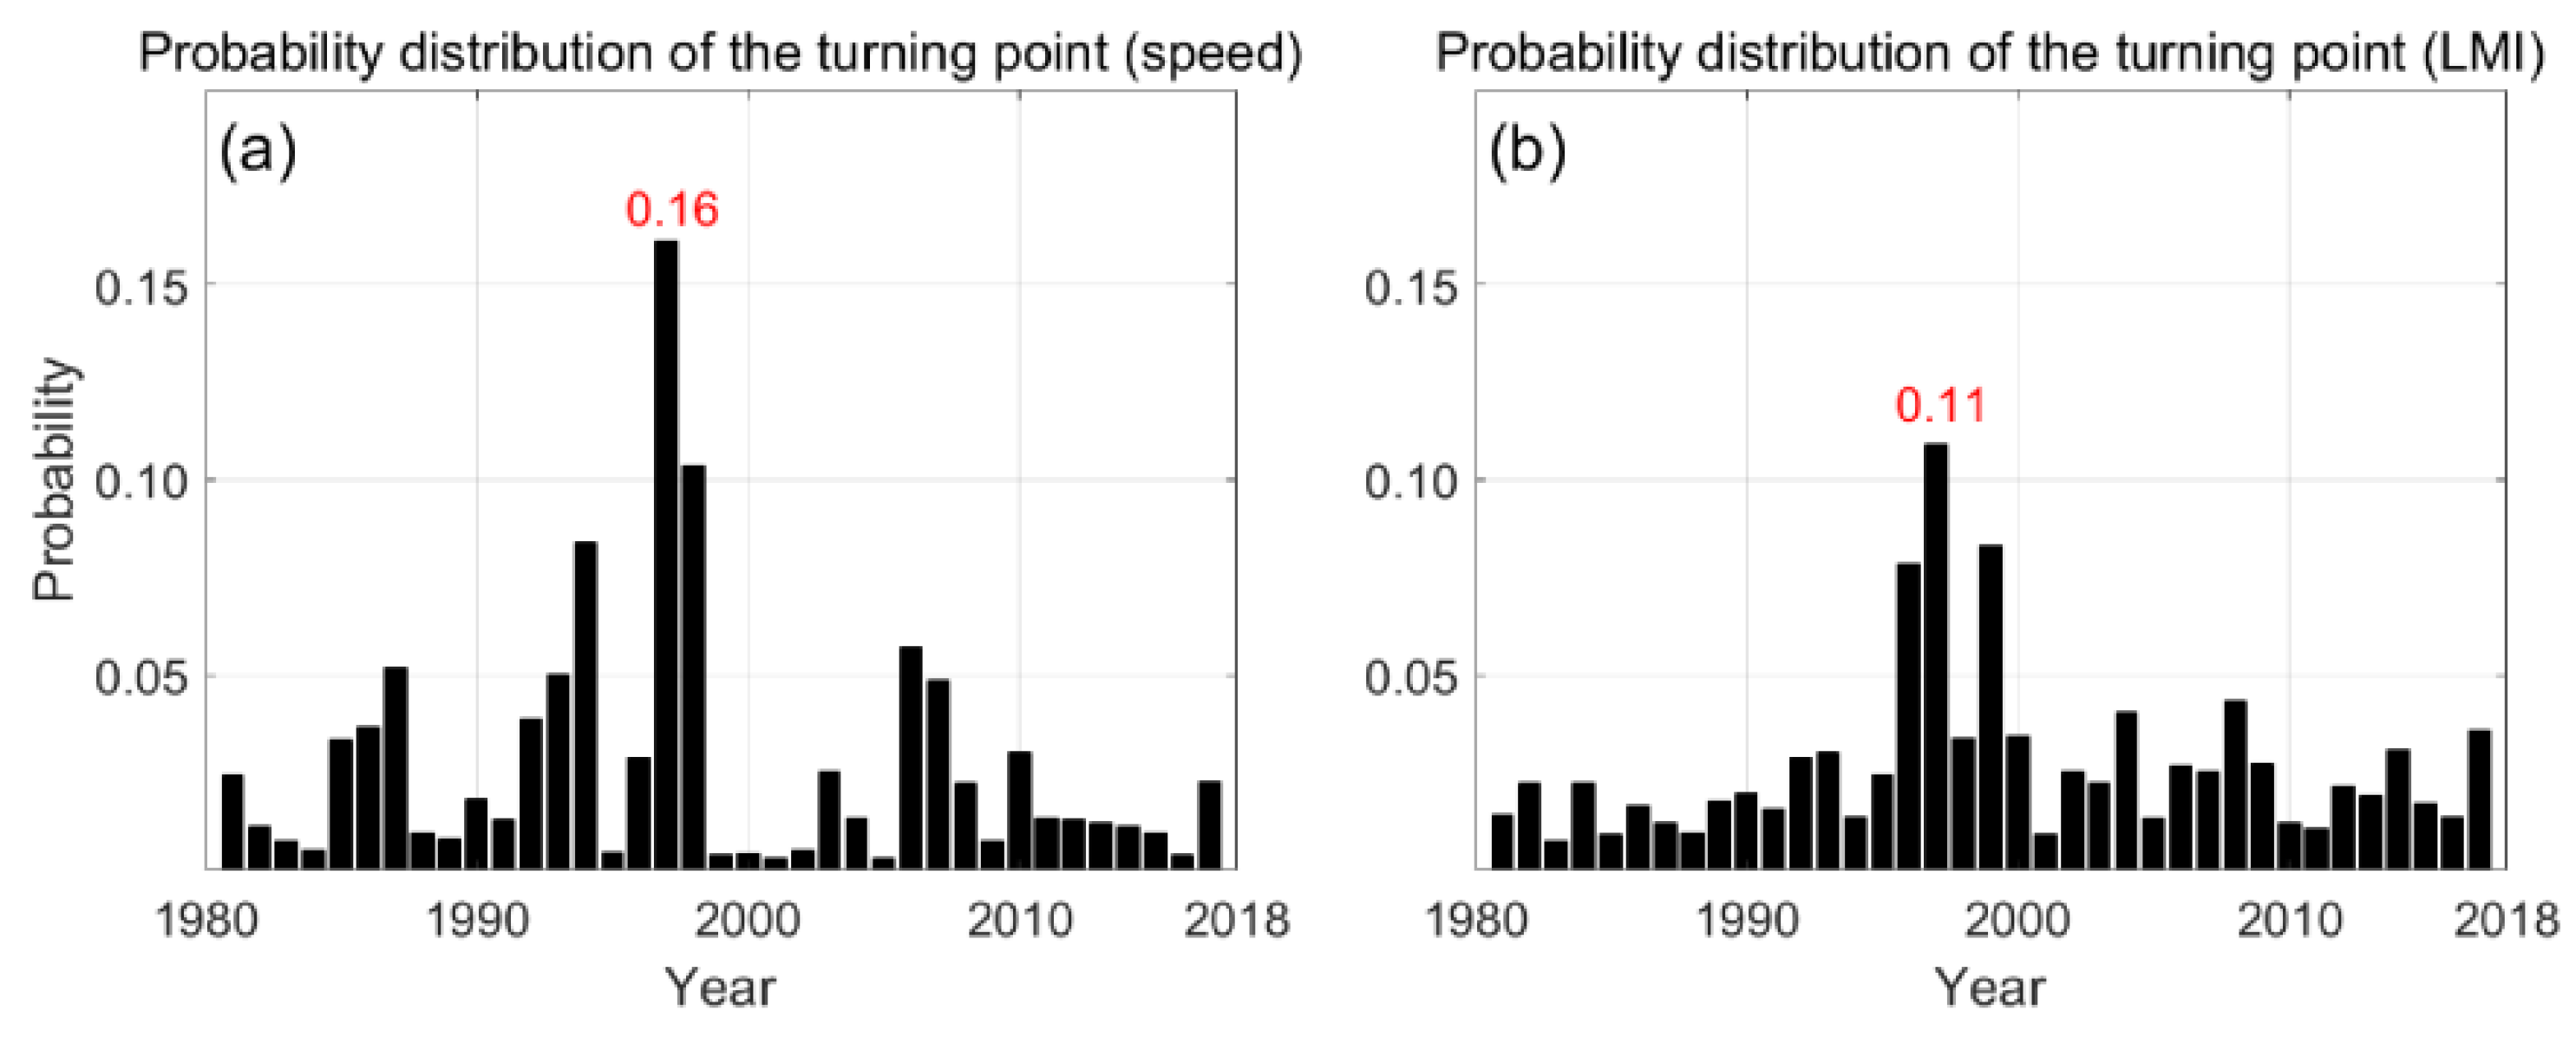
Two reasons are given for the selection of the turning point of 1997/1998. First, according to the Bayesian method used by Chu and Zhao [21] to determine the time turning point (Figure 3), the posterior probability distribution of each year as the turning point can be estimated. For LMI, the change probability in 1997 is the highest (0.11), while for the translation speed during the genesis–LMI stage, the change probability in 1997 is also the highest (0.16). Thus, there is theoretical support for taking 1997 as the last year of the first period (P1) and 1998 as the first year of the second period (P2). Secondly, according to previous studies, 1997/1998 was the key event turning point in climatology when PDO changed from the positive to the negative phase [13,15,22]. Therefore, taking 1997 as the turning point is not only supported by theories but also fits the physical climatology background.
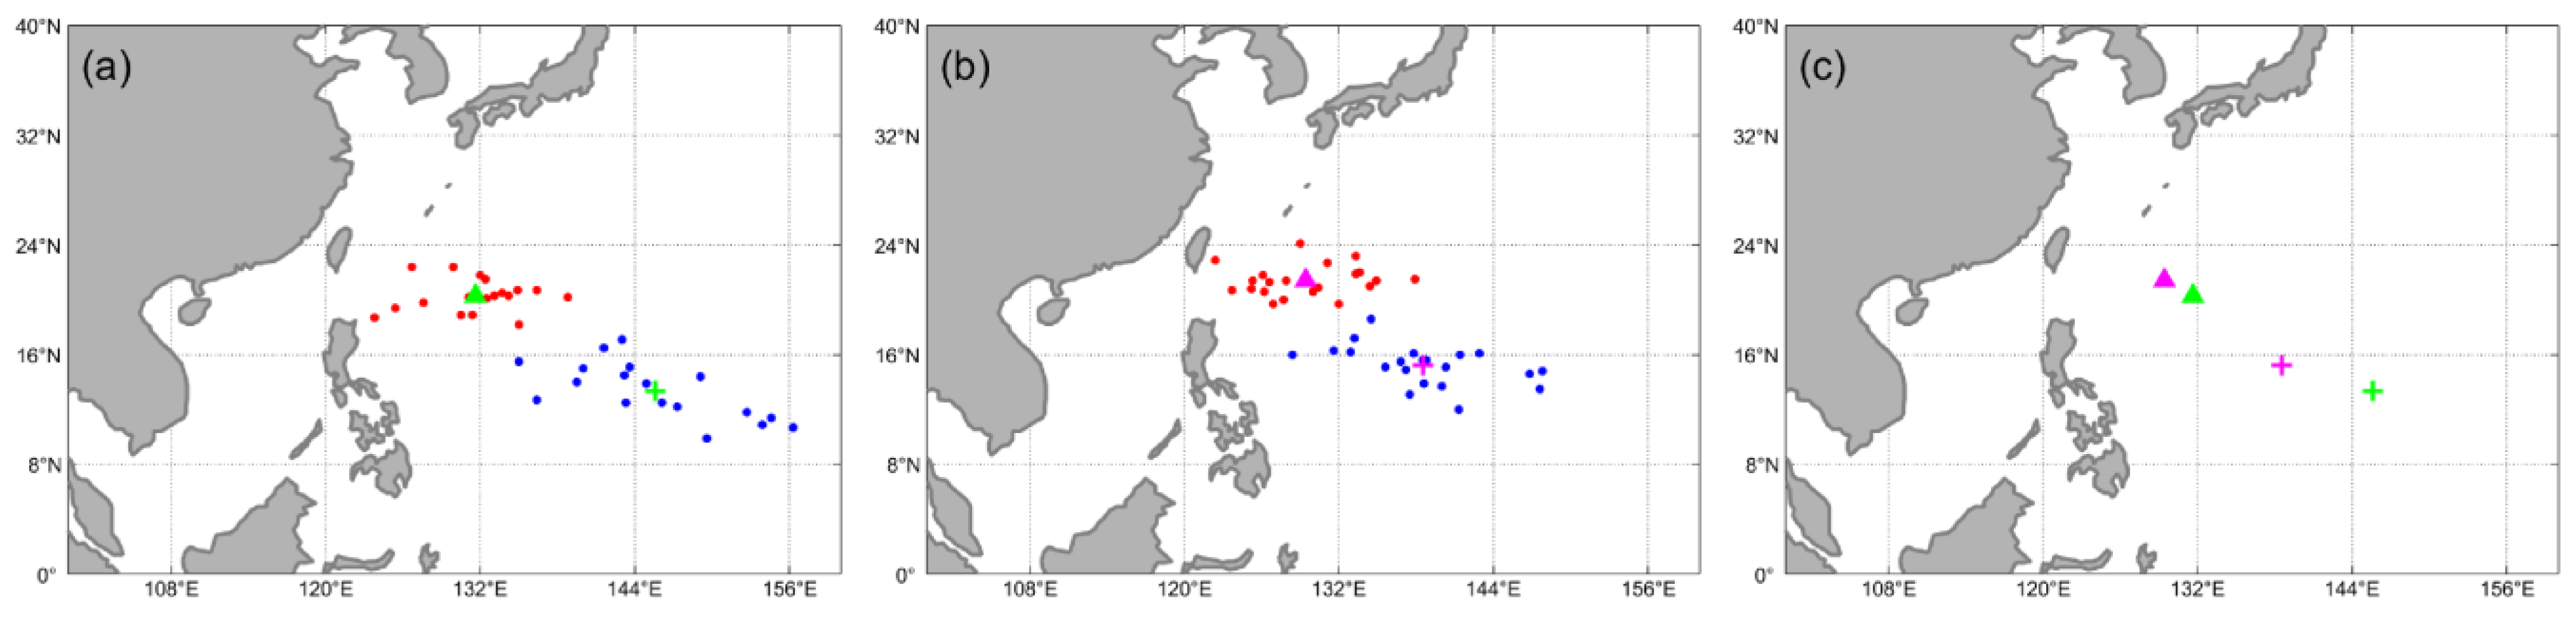
The mean location distributions of WNP TC genesis and LMI suggest that the position of TC genesis shows an obvious westward trend from P1 (Figure 4a) to P2 (Figure 4b). The overall mean position comparison shows a westward and northward shift in the TC genesis and LMI positions, with the trend being more significant for the mean genesis position (Figure 4c). The reasons for these changes in the magnitude and direction will be discussed based on both the TC characteristics and the environmental factors.
3.2. TCs’ Intensities Affecting TC Translation Speed
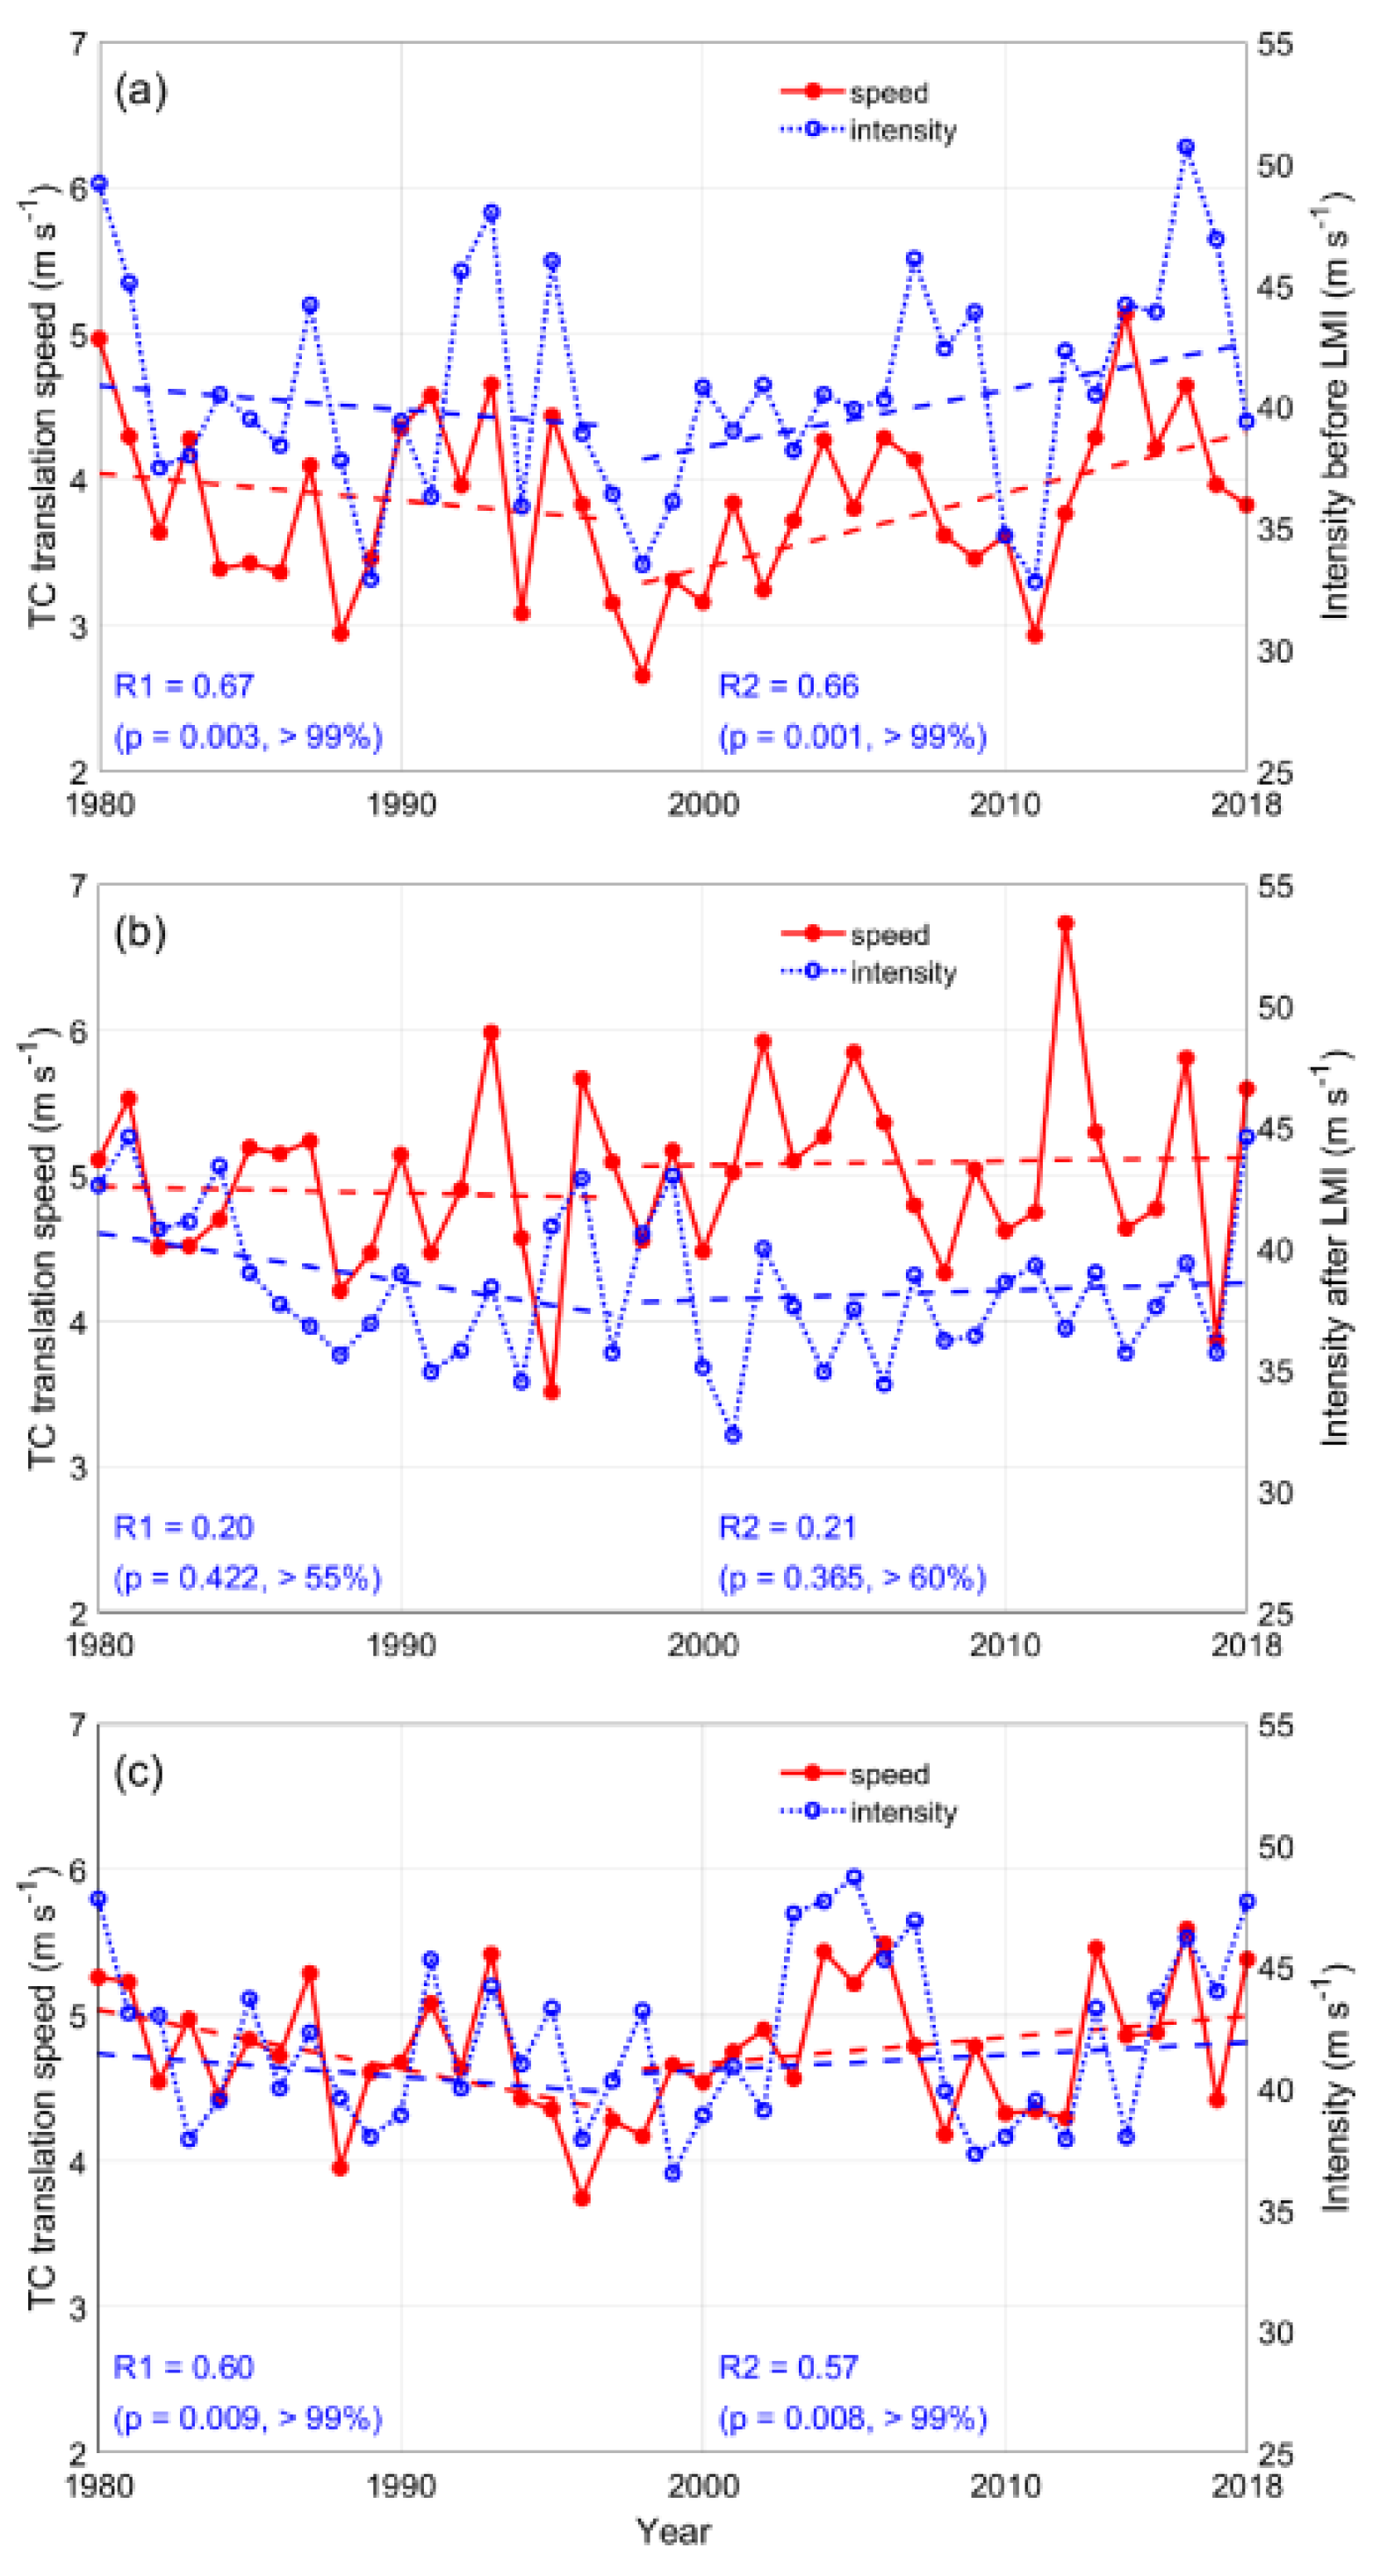
The characteristics of TC itself can influence its translation speed, and one of the most important factors is TC intensity [10,23]. Although the trends of translation speed and intensity are different in the three stages (Figure 5), they basically show a decreasing trend in P1 and an increasing trend in P2 (but not statistically significant after LMI), and the trends of translation speed and intensity are basically consistent. The correlation coefficient and significance test show that the TC translation speed and intensity are positively correlated, especially before LMI, P1 is 0.67 and P2 is 0.66. The trends of TC translation speed and intensity before LMI are similar to those of the entire life history, and they are well correlated. Intensity, as a key factor in measuring TC activity, is, therefore, an important factor in influencing the translation speed.
3.3. Environmental Factors Affecting TC Translation Speed
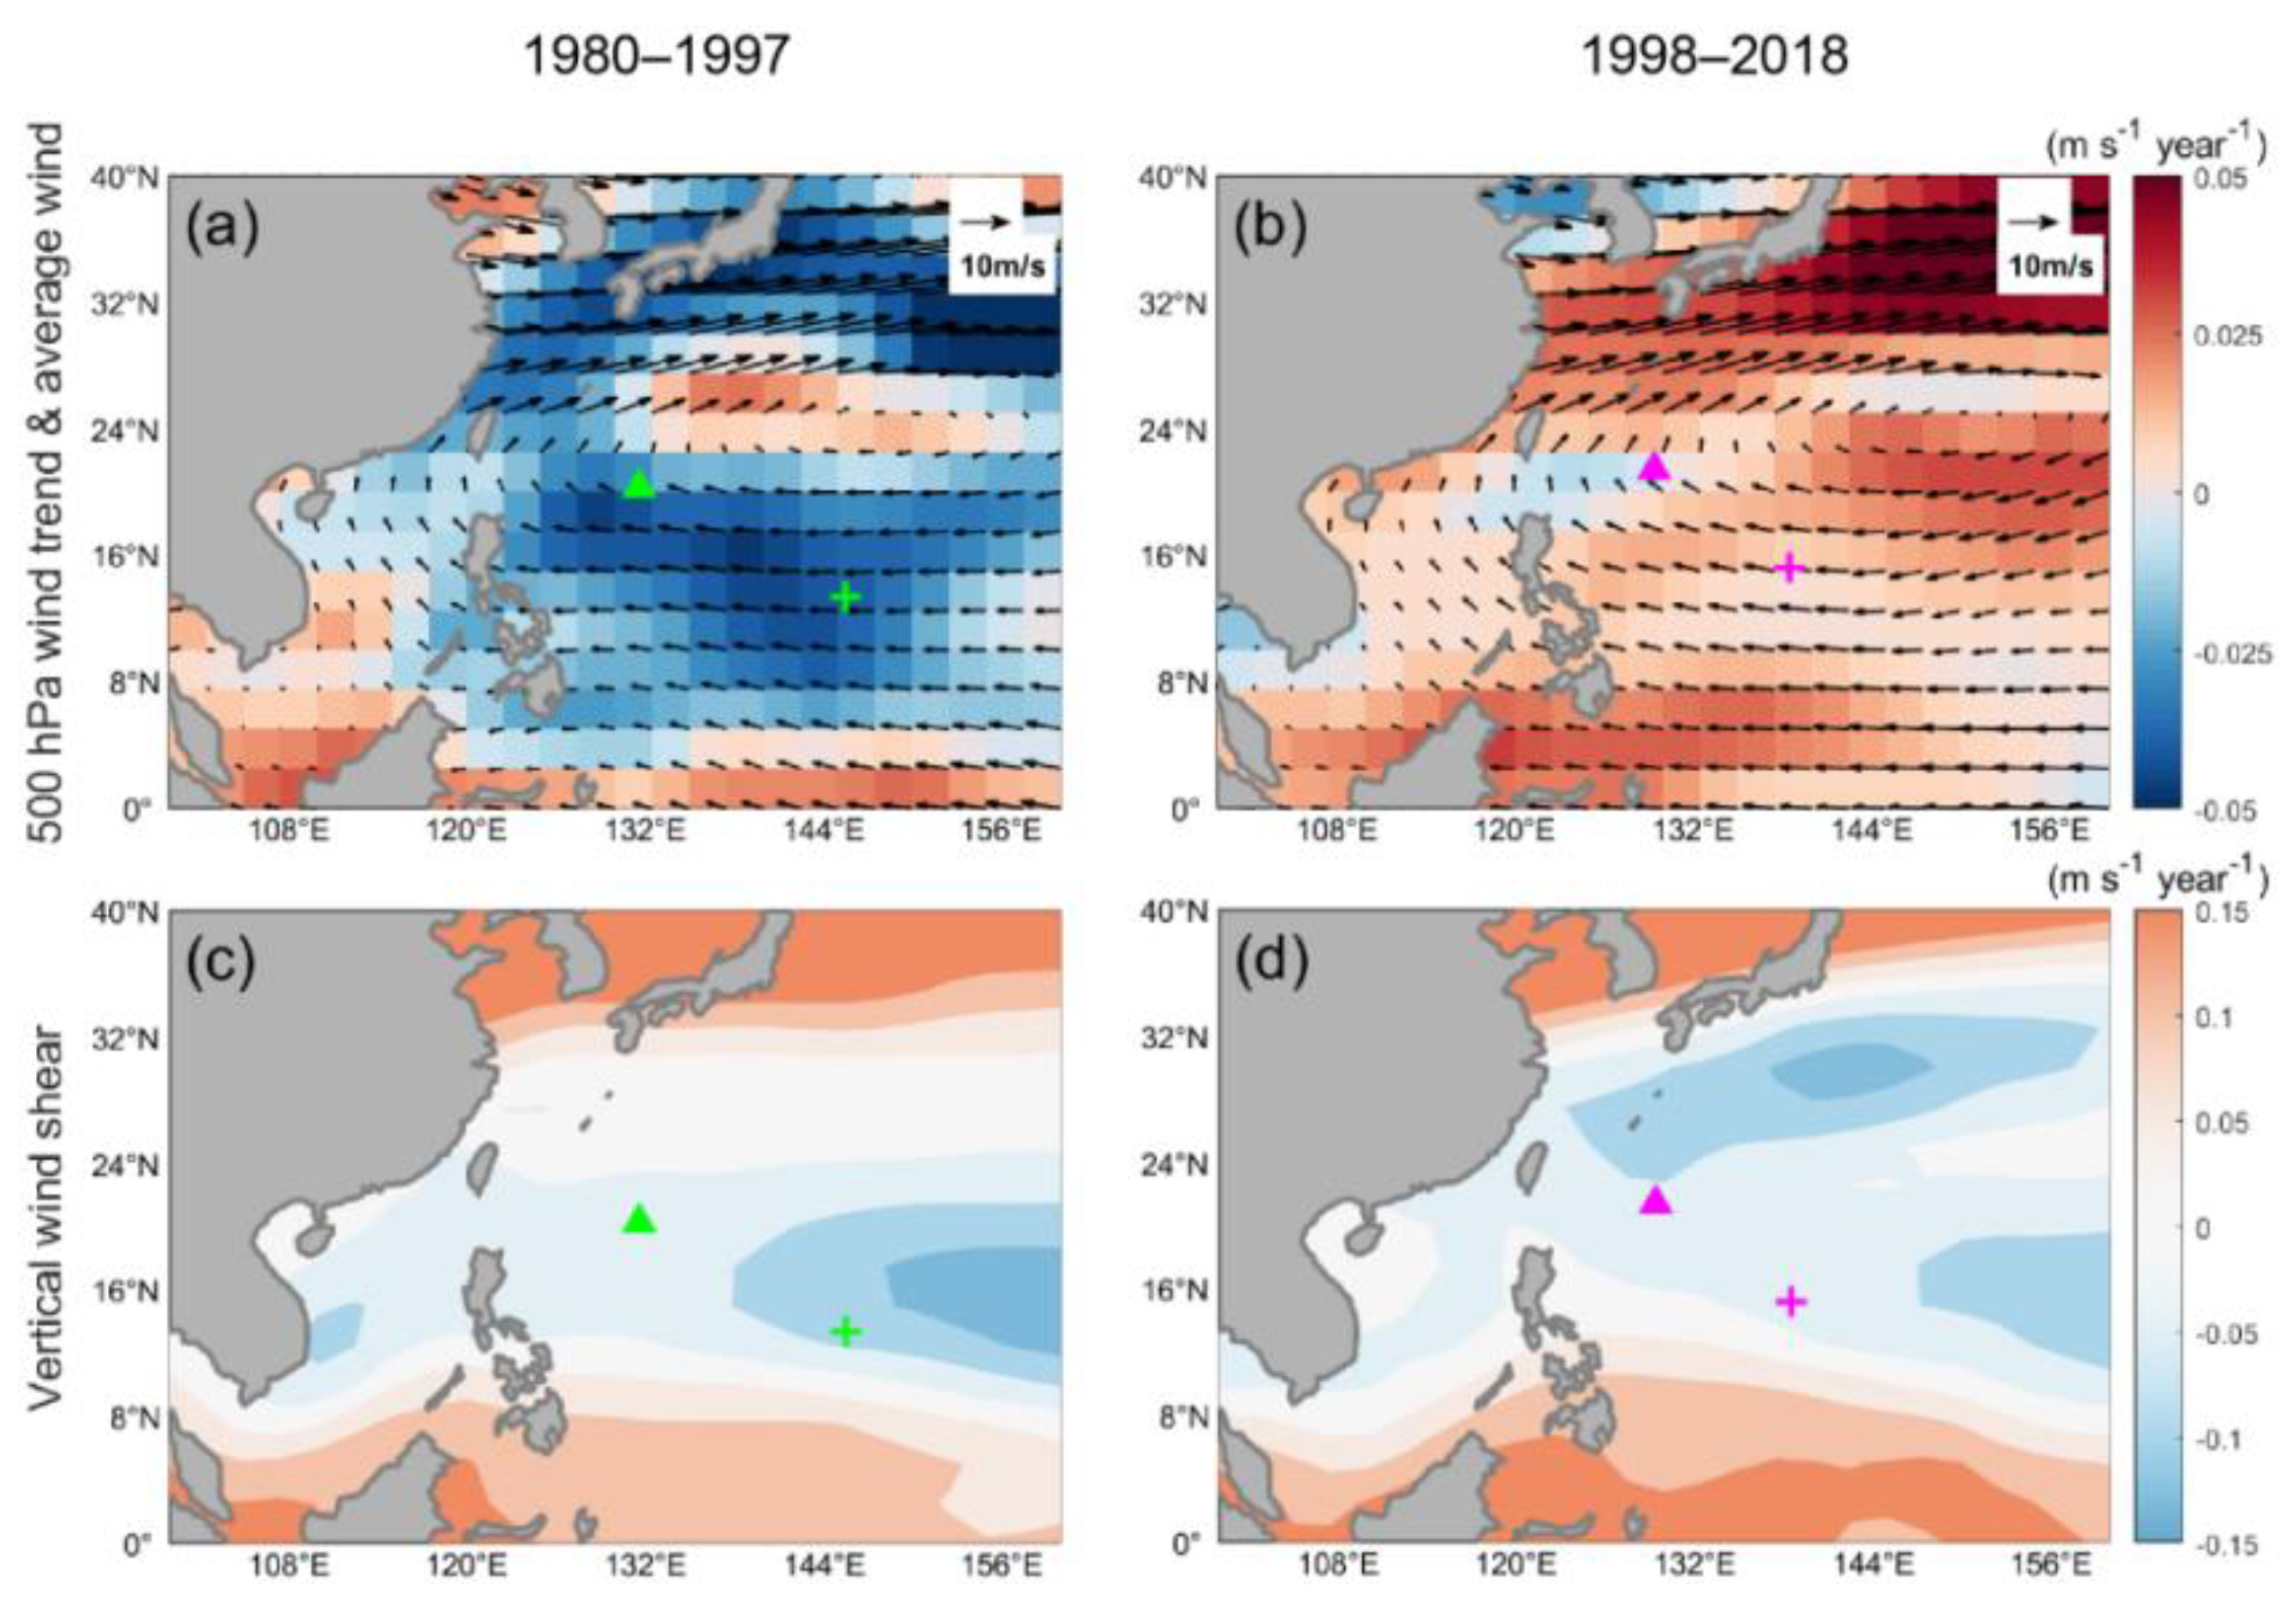
In addition to the effects of TC characteristics on the translation speed analyzed above, TC movement is also influenced by various environmental factors. The changes in steering flow and vertical wind shear of the background field are important for the translation speed [11,12,16,23]. A comparison between P1 and P2 shows a significant weakening trend of the mid-level wind speed magnitude over WNP in P1 (Figure 6a), and the TC genesis and LMI mean positions fall in the region with larger negative values (the trend is based on the magnitude of the wind speed without regard to direction). On the contrary, there is an increasing trend for P2 (Figure 6b), which means that when the translation speed is increased. An easterly wind strengthening trend is also found over the WNP south of 24° N, which is conducive to advecting the TC westward faster.
However, the change of 200–850 hPa vertical wind shear is relatively similar in the two periods, and the trend of vertical wind shear weakening is weaker in the main range of TC movement (central WNP, 10–24° N) and the weakening trend is smaller for the P2 period. We know that the stronger the vertical wind shear is, the less favorable it is for TC development and strengthening. According to Figure 5 and Section 3.2, it is clear that the trend of translation speed and intensity are positively correlated. When the vertical wind shear is weaker, it is more favorable for TC strengthening, and therefore the translation speed is larger [11,24,25]. Therefore, for P2, TCs move mainly in the region between TC mean genesis and LMI positions with the weakened trends of vertical wind shear before reaching LMI, so that it corresponds to the increasing trend of TC translation speed (Figure 6d).
The trends of steering flow and vertical wind shear in P2 are both favorable to the increase in TC translation speed. In addition to the influences of the environmental wind field, the thermodynamic state of the atmospheric environment and the heat exchange with the upper layer of the ocean can largely control TC intensity and, in turn, affect its translation speed [26,27,28,29]. In the 1990s, Emanuel [26] proposed that PI describes the thermal upper limit of TC intensity, which depends on the difference between the sea surface temperature (SST) and the outflow temperature in the upper troposphere (T0), and PI is obtained based on this difference. PI is an effective indicator for forecasting TC intensity, and we can regard PI as the maximum intensity that a TC can reach during its lifetime activity [30]. A larger PI is usually accompanied by a stronger TC intensity. The PI expression is as follows [26]:
where V2 is the square of the TC maximum wind speed, Ck is the enthalpy exchange coefficient, Cd is the drag coefficient, k* is the ocean surface enthalpy, and k is the enthalpy of the environmental field under the TC core. The left side of the equal sign is the square of PI, the second term on the right side is a constant value by default 0.9, and the third term is the enthalpy difference term.
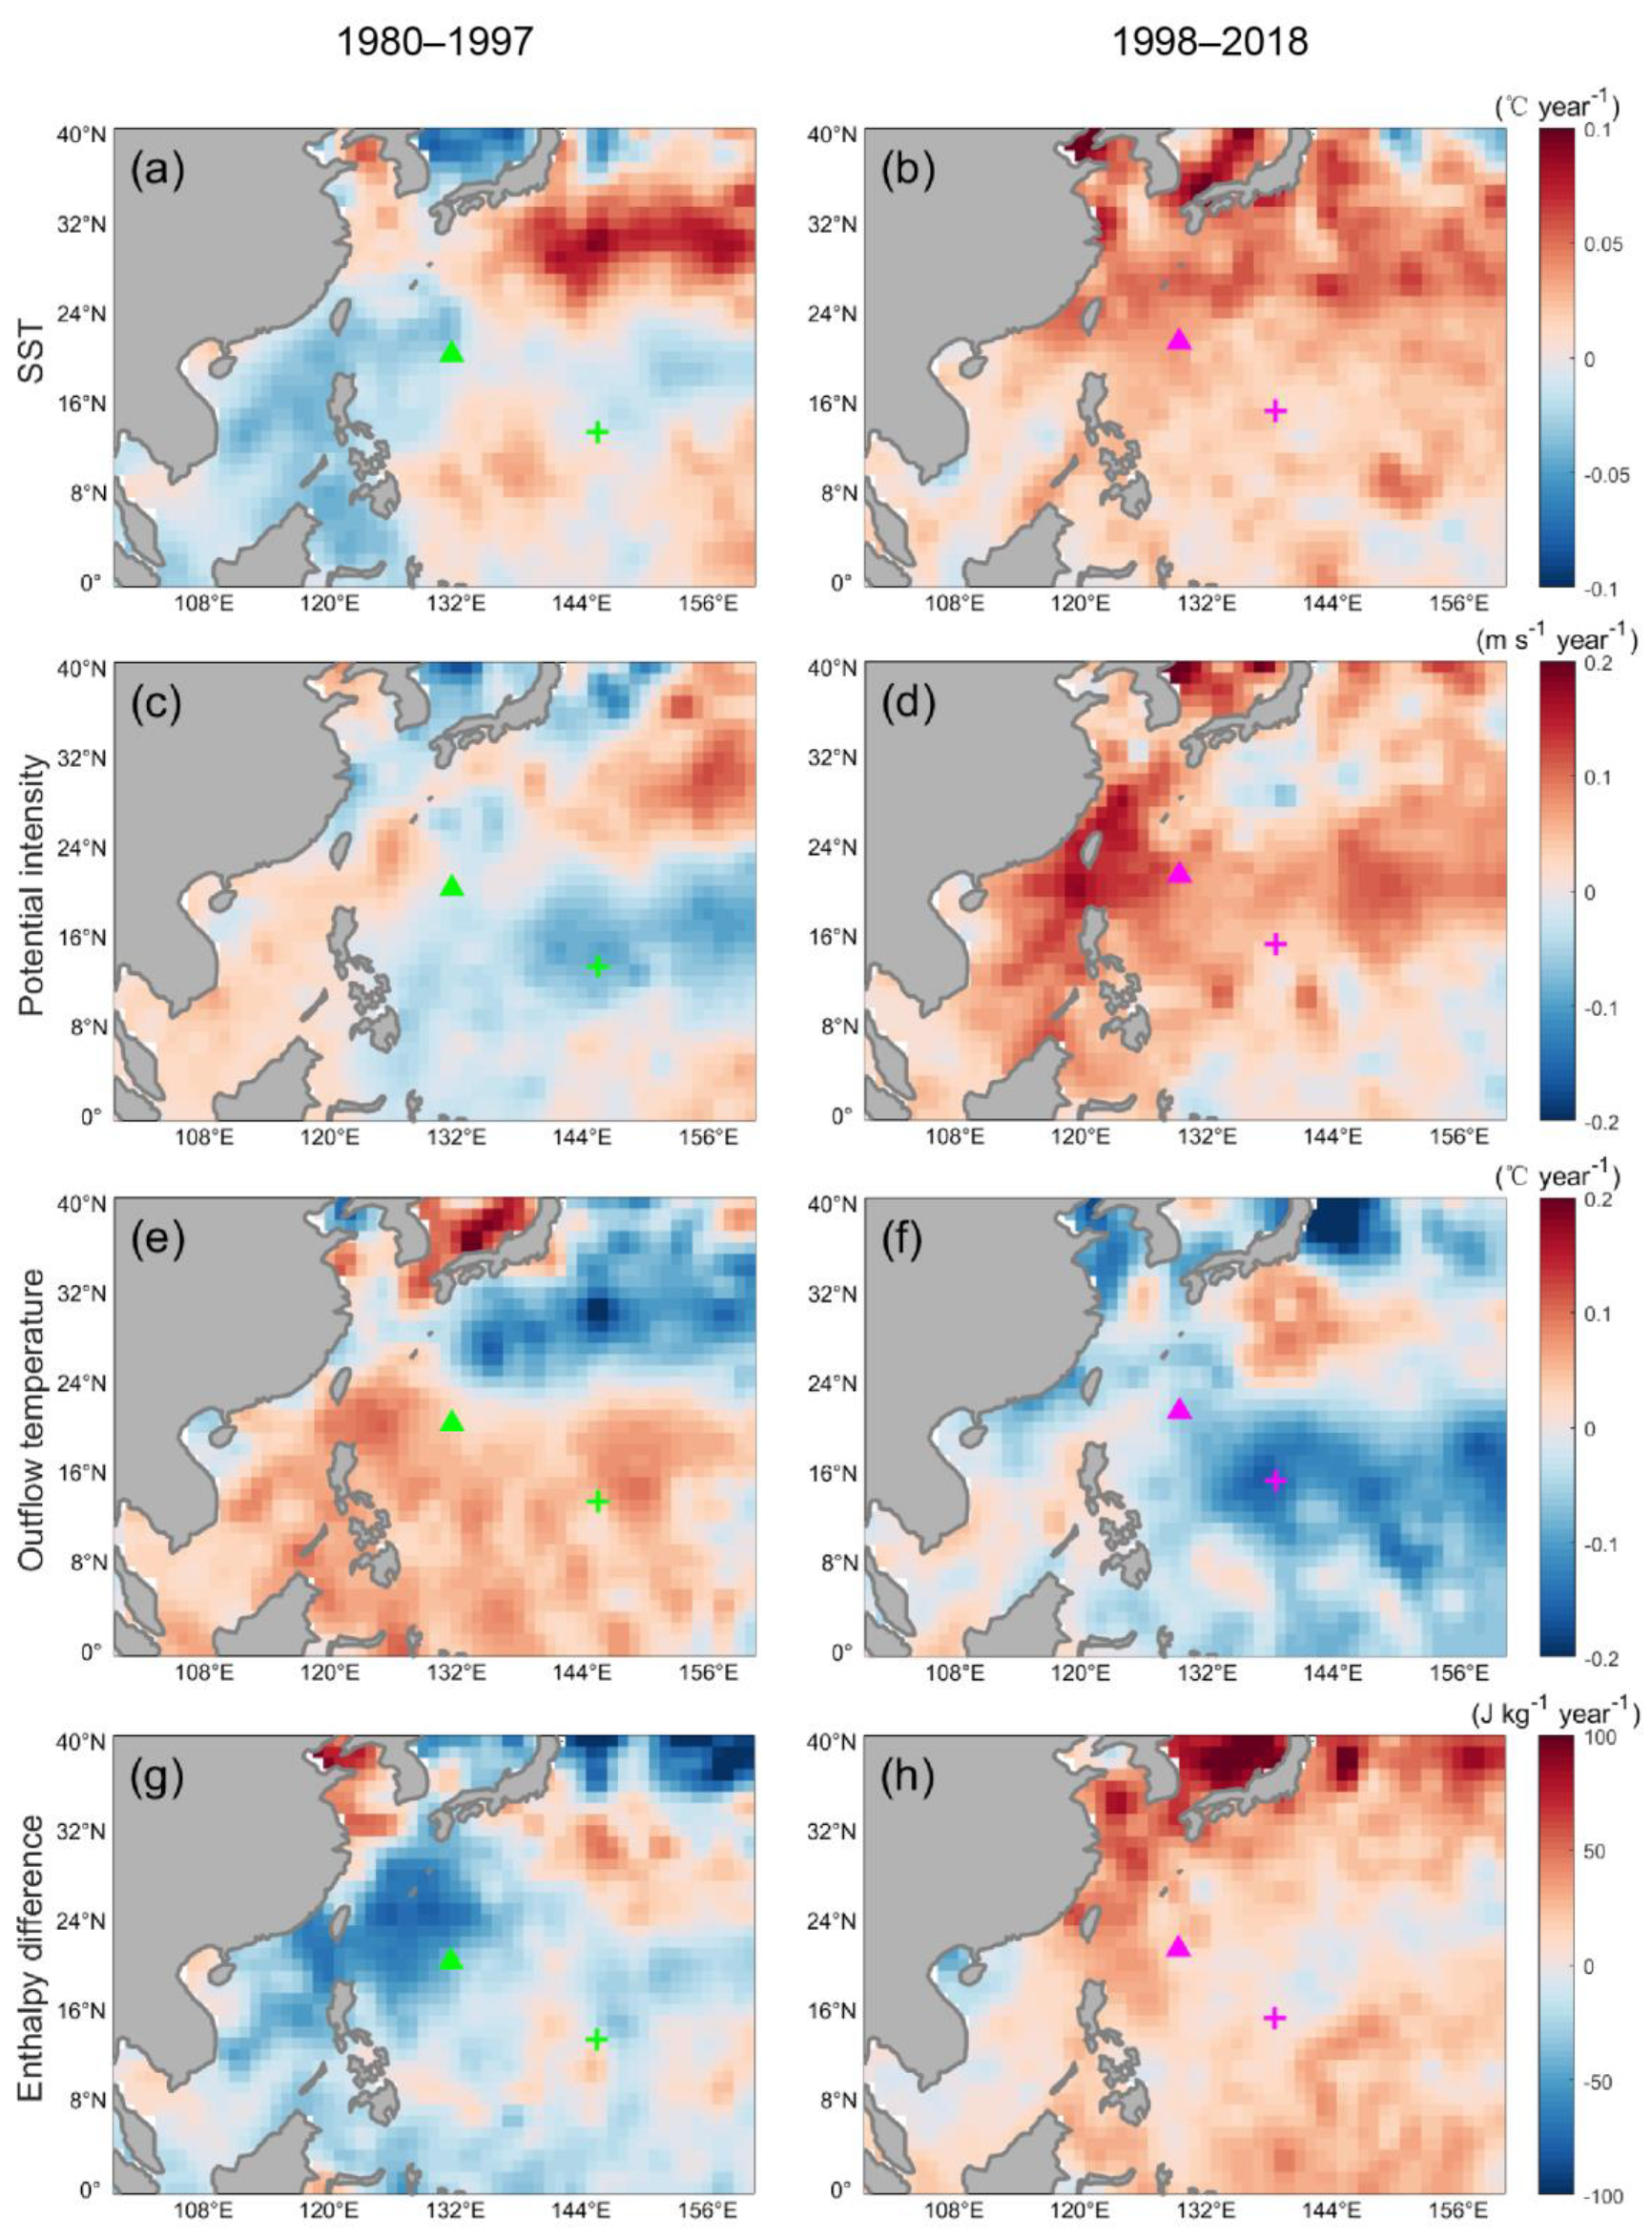
Figure 7 shows the spatial trend of each factor in PI, including SST, T0, and enthalpy difference. First, the SST can be considered both as an independent environmental factor for its own effect on the TC translation speed and as a factor affecting PI [25]. For P1, the spatial trend of SST shows a decreasing trend in the South China Sea and the Northeast Philippine Sea and an increasing trend in the South Sea of Japan and the East Philippine Sea, while the mean positions of TC genesis and LMI all fall within the range of the decreasing trend of SST. On the contrary, SST shows an increasing trend over nearly the whole of WNP in P2, and the corresponding translation speed is also an increasing trend.
The PI trends (Figure 7c,d) clearly show that both mean positions in P1 fall within the decreasing PI trend region, while the PI trends in P2 are similar to the SST trends, with a wide range of positive trends. Along the line of genesis mean position-LMI mean position-Taiwan Island off the southeast coast of China, the PI trends show an increasing trend from southeast to northwest, and it can be assumed that for P2, the TC translation speed has a tendency to accelerate in the direction of increasing PI trends.
For T0 and enthalpy difference trends, the WNP from the equator to 20° N in P1 basically shows an increasing trend of T0, and both mean positions fall in the warming area (Figure 7e). For P2, the mean positions of TC genesis and LMI fall in the area with a decreasing temperature trend (Figure 7f). The lower temperature of the outflow layer indicates a higher height of the outflow layer, which implies a stronger TC development and a higher translation speed. The spatial field change of enthalpy difference shows that for P2, the trend of enthalpy difference over WNP is increasing (Figure 7h).
From the expression of PI, it can be seen that the trend of PI is influenced by several factors acting together. When SST shows an increasing trend, T0 shows a decreasing trend, and the enthalpy difference shows an increasing trend, it is basically consistent with the spatial trend of P2. Although the role of individual factors for translation speed may not always be significant, the PI of P2 eventually shows a large positive trend over WNP under the combined effect of the factors (Figure 7d), and the LMI position falls in the region with a significant positive trend, which corresponds to an increase in TC translation speed at this time (Figure 2a). Therefore, when the environmental PI shows an increasing trend, it is favorable for TC translation speed to increase.
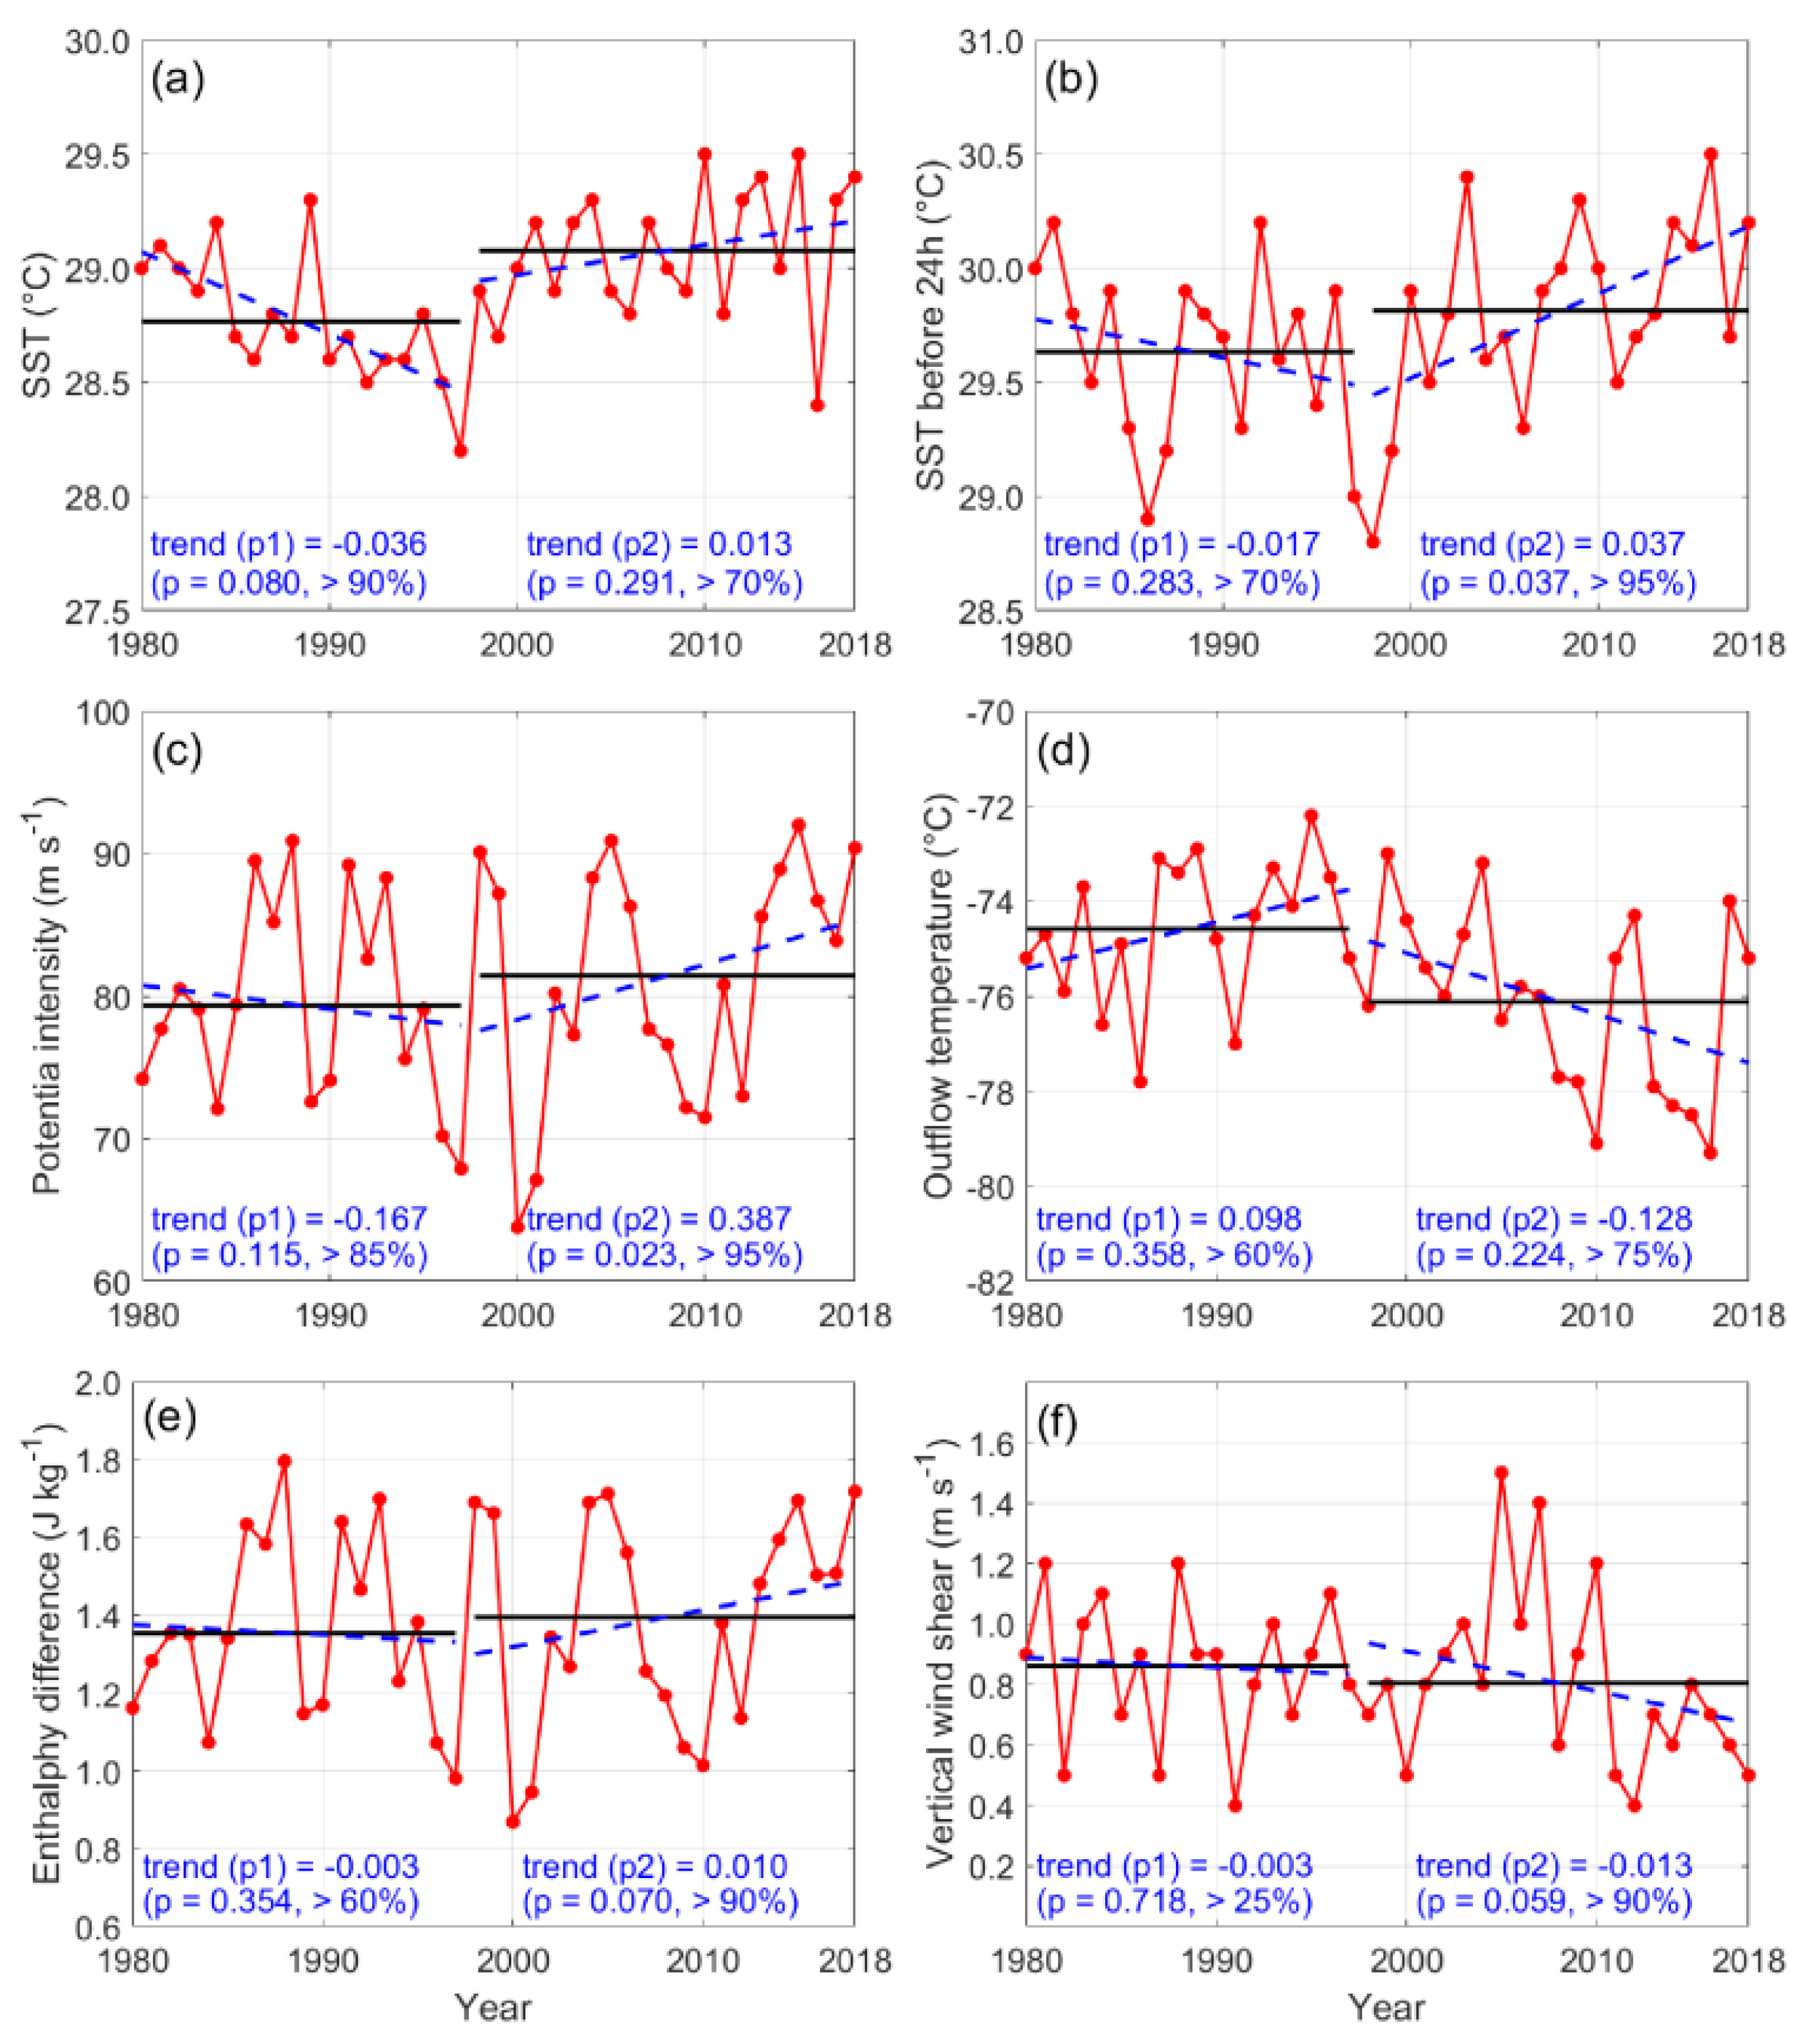
In addition to the trends in spatial fields, changes in time series of individual factors are also important. The trends of the above environmental factors on time series (Figure 8) show a small decrease in SST after TC passes through over the WNP ocean (Figure 8a,b), but the trends of the SST and SST 24 h before the passing of TC are basically the same. Moreover, the trends of PI and the SST before 24 h are basically the same in the two periods, especially during P2, when the increasing trend of SST before and after the TC passing is significant in P2, especially. SST before 24 h, enthalpy difference at the ocean surface, and vertical wind shear have more significant trends in P2, which altogether contribute to the shifting to an increasing trend of the TC translation speed in P2.
3.4. The Physical Linkage between TC Translation and Intensity
In earlier years, the correlation between TC intensity and TC translation speed was not uniformly conclusive. Some scholars believe that TCs become weaker accompanied by TC translation speed increases. For example, the observations near Australia by Holland show that weaker TCs usually have an increasing translation speed [31]. However, others have held the opposite view in recent years since the effect of TC translation speed on TC intensity has now been more fully studied by considering the air-sea interaction. That is, increasing translation speed helps to reduce the ocean cooling caused by TCs, thus maintaining the supply of air-sea enthalpy flux favorable to TC enhancement [8,32].
TC intensity can also have a very important effect on TC translation speed through the steering flow. According to Chan and Gray [33], steering flow has a key role in TCs’ movement. We analyze the trend of steering flow between 200 and 850 hPa according to Kimberlain and Breman [34] for the TC’s stage from generation to LMI during 1980–2018, then the trends of steering flow and translation speed are compared. The 200–850 hPa steering flow is calculated as follows:
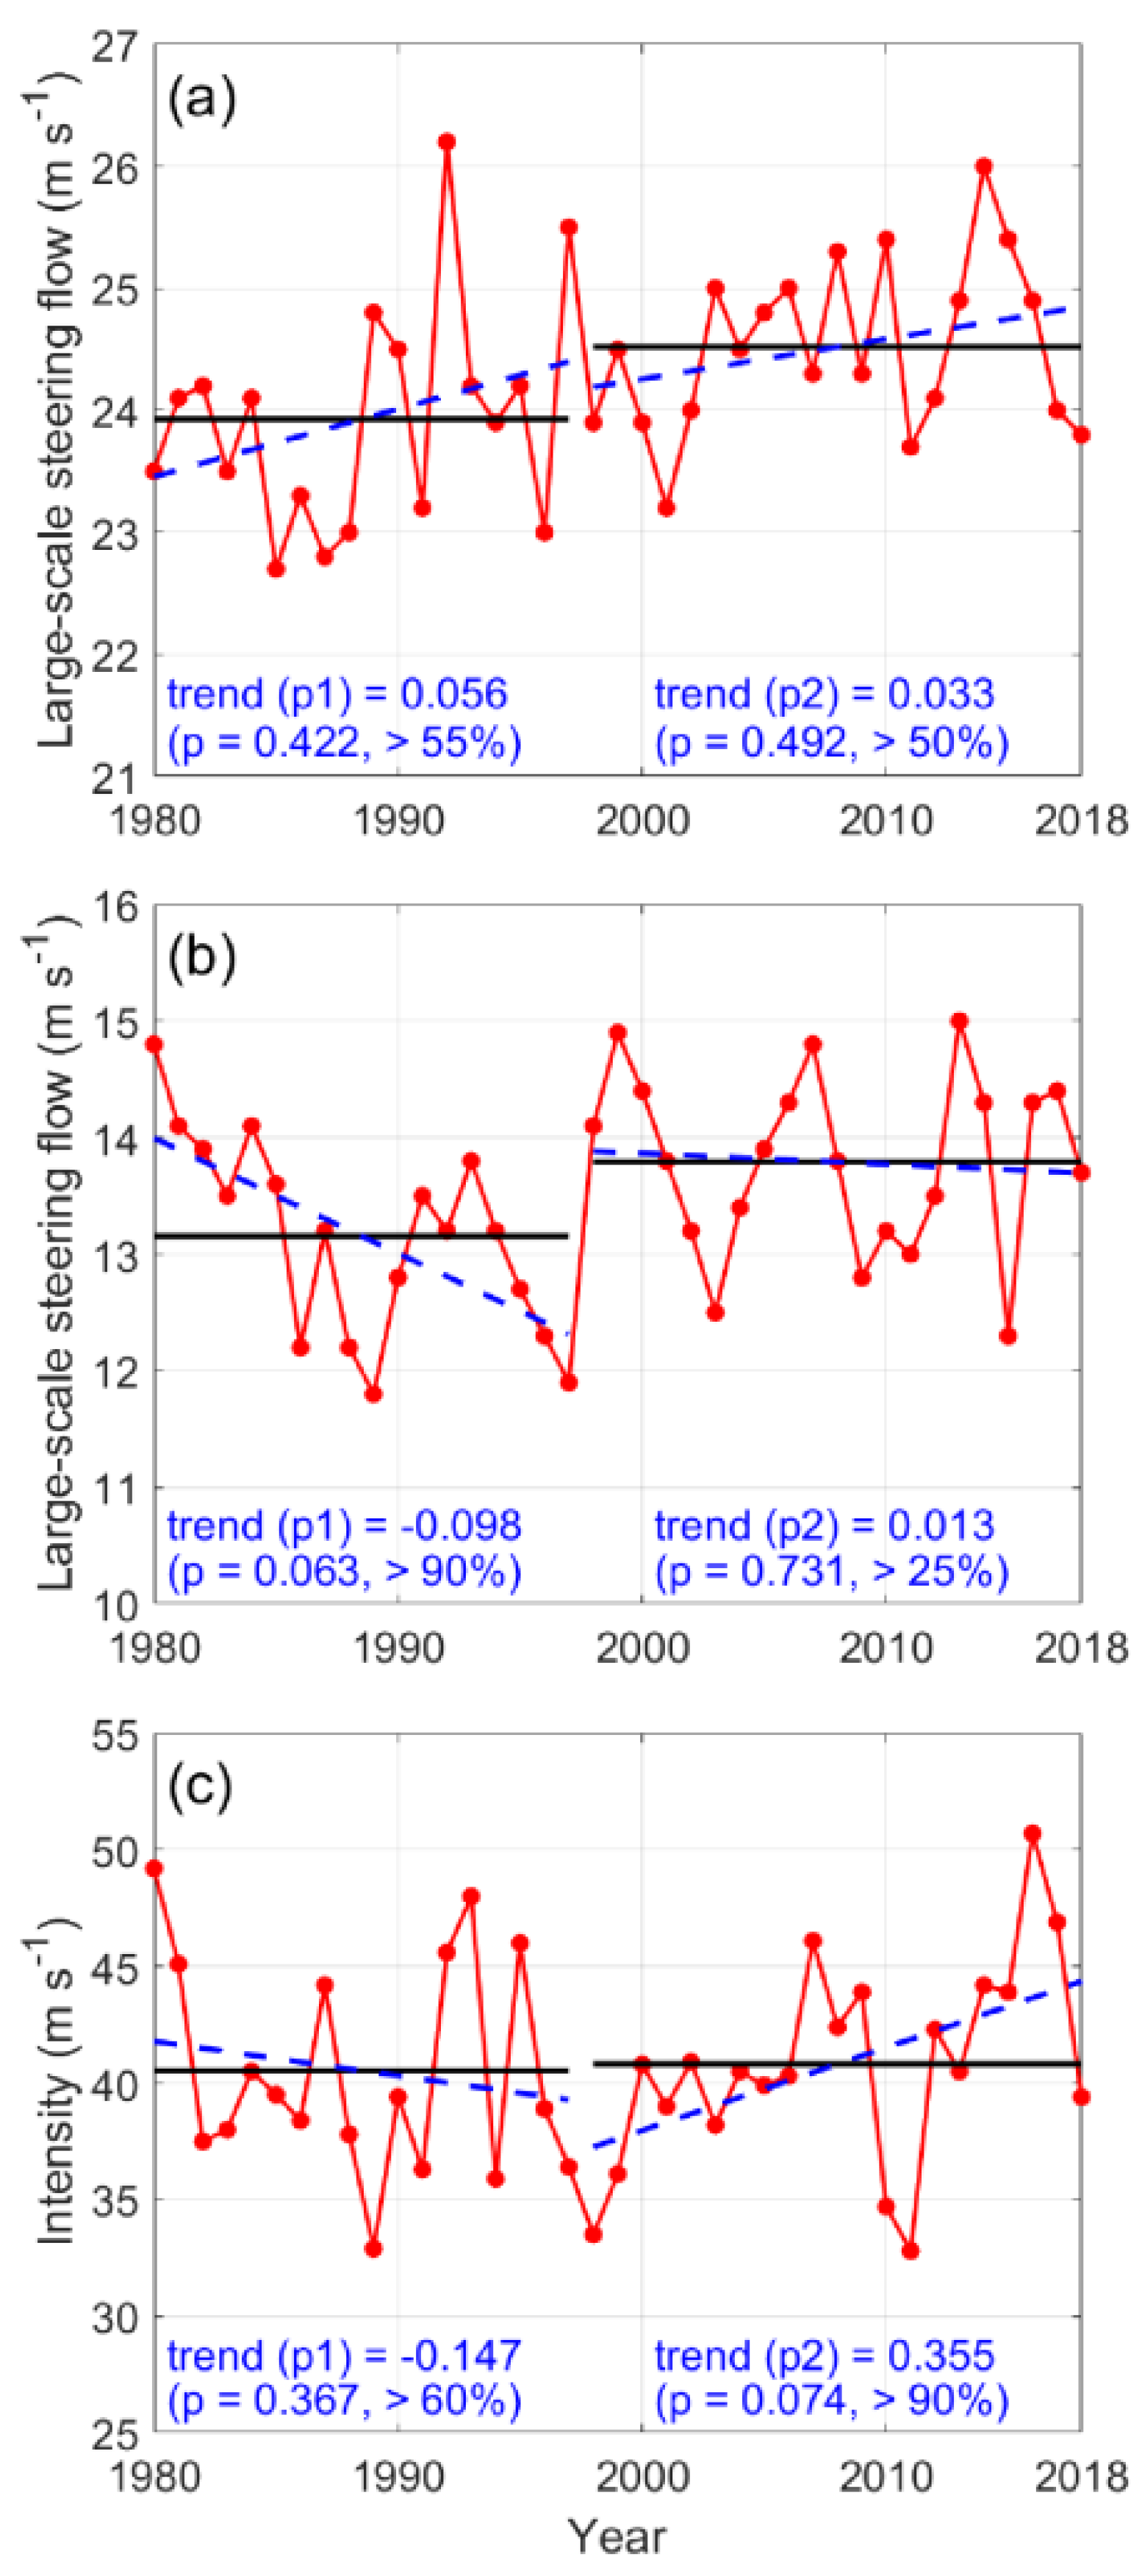
Figure 9a,b show the trends of 200–850 hPa and 500–850 hPa steering flow for P1 and P2, respectively. For P1, the steering flow of 200–850 hPa shows an enhanced trend (Figure 9a), and 500–850 hPa shows a weakened trend (Figure 9b), while the TC intensity of P1 is a weakening trend, corresponding to a decreasing trend of TC translation speed (Figure 5a). It can be deduced that because the overall TCs are weaker (Figure 10a), they cannot develop to a higher level, and even if the flow in the middle-high levels gradually strengthens, it cannot act on steering the TCs. However, the steering flow of 200–850 hPa and TC intensity both show enhanced trends for P2 (Figure 9a,c) and corresponds to an increasing trend of TC translation speed (Figure 5a). The steering flow of middle-high levels can act on the TCs easily during P2, although 500–850 hPa steering flow shows a flat trend (Figure 9b). That is to say, the increased trend of 200–850 hPa steering flow during two periods has different effects on TC translation trends, which depends on the TC intensity [35].
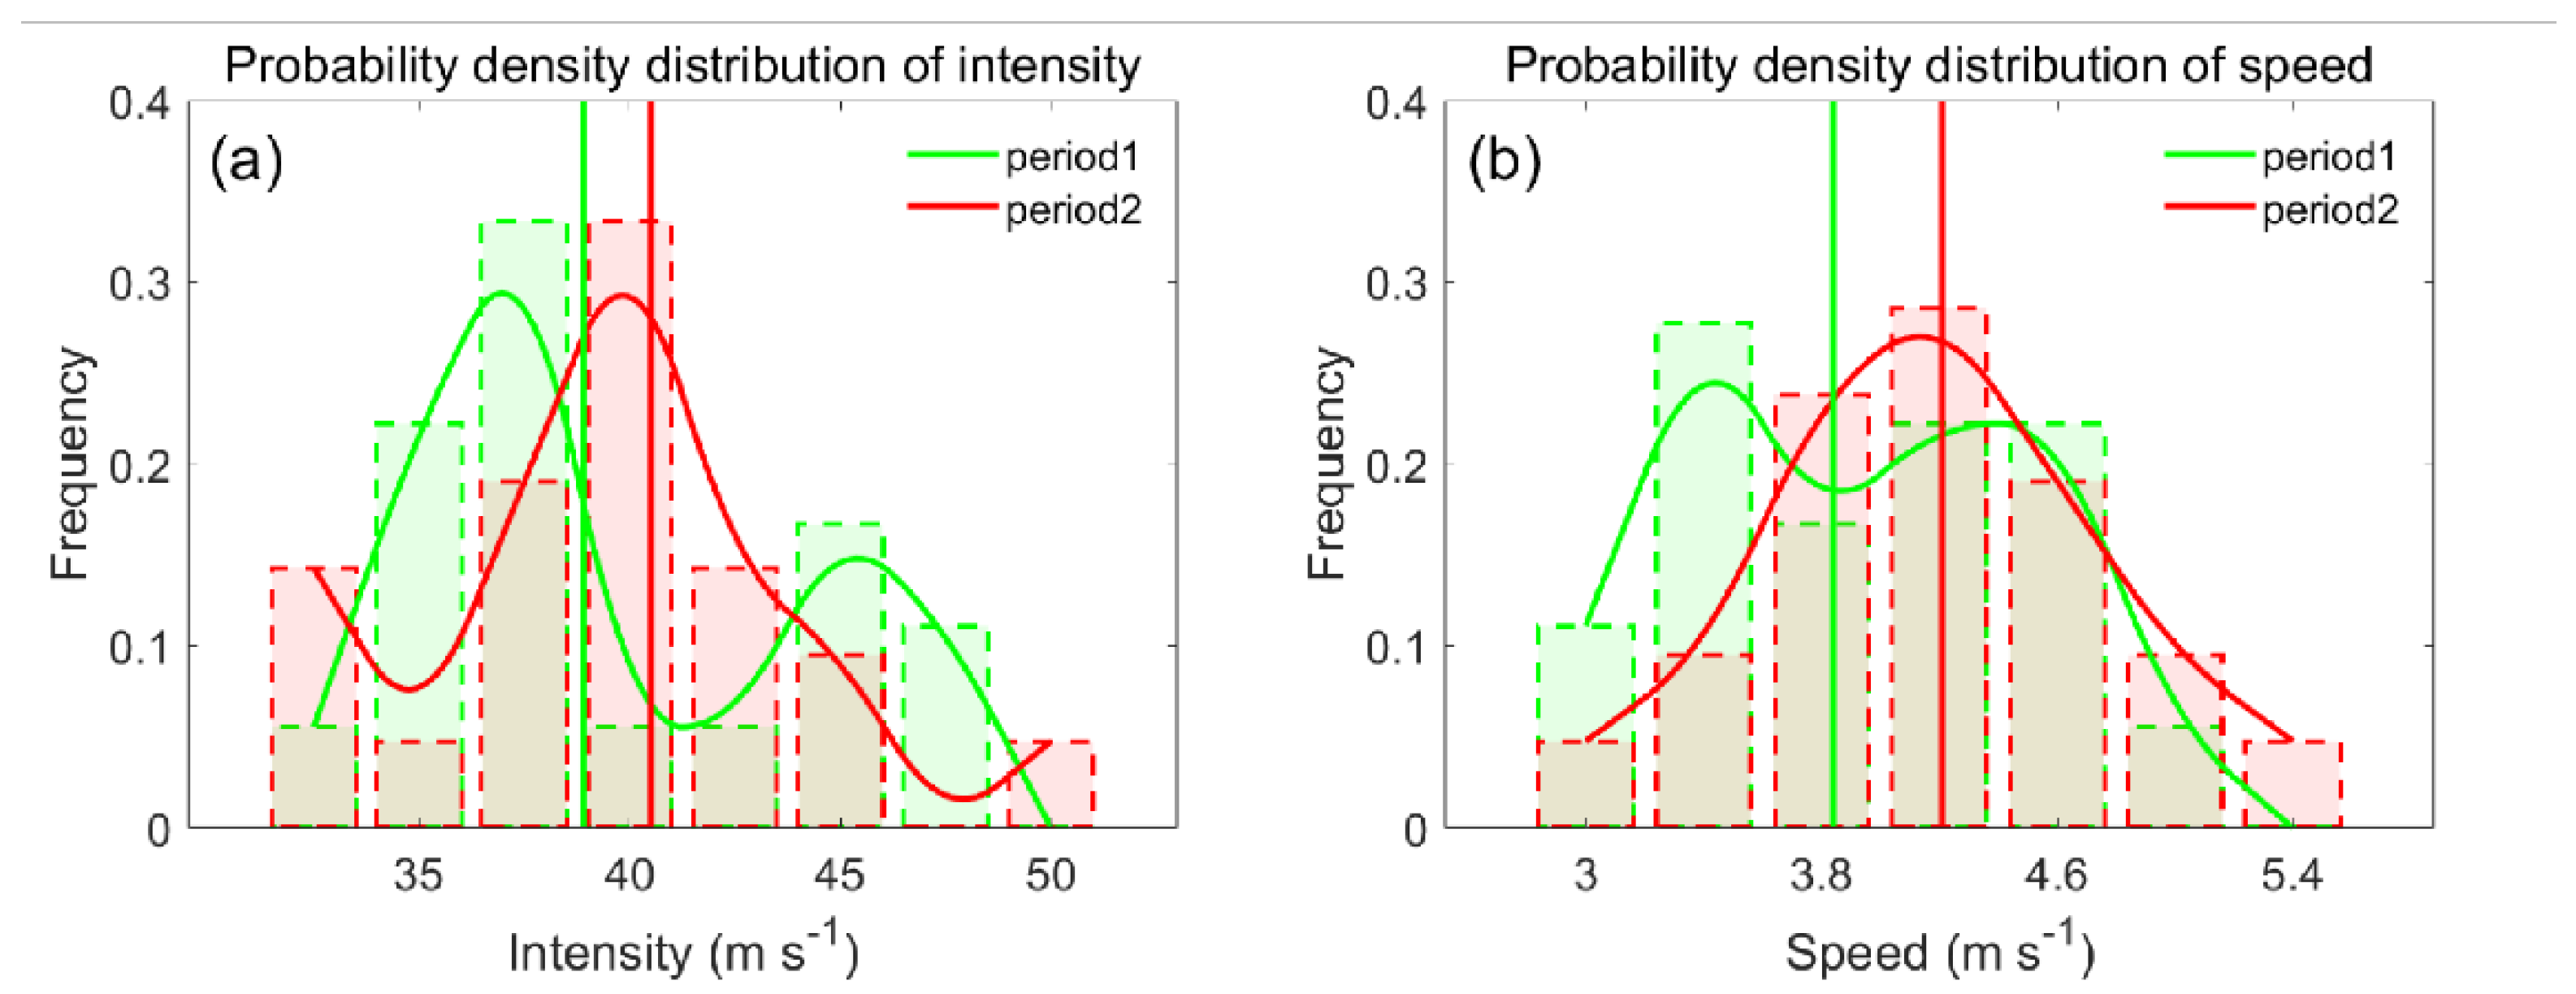
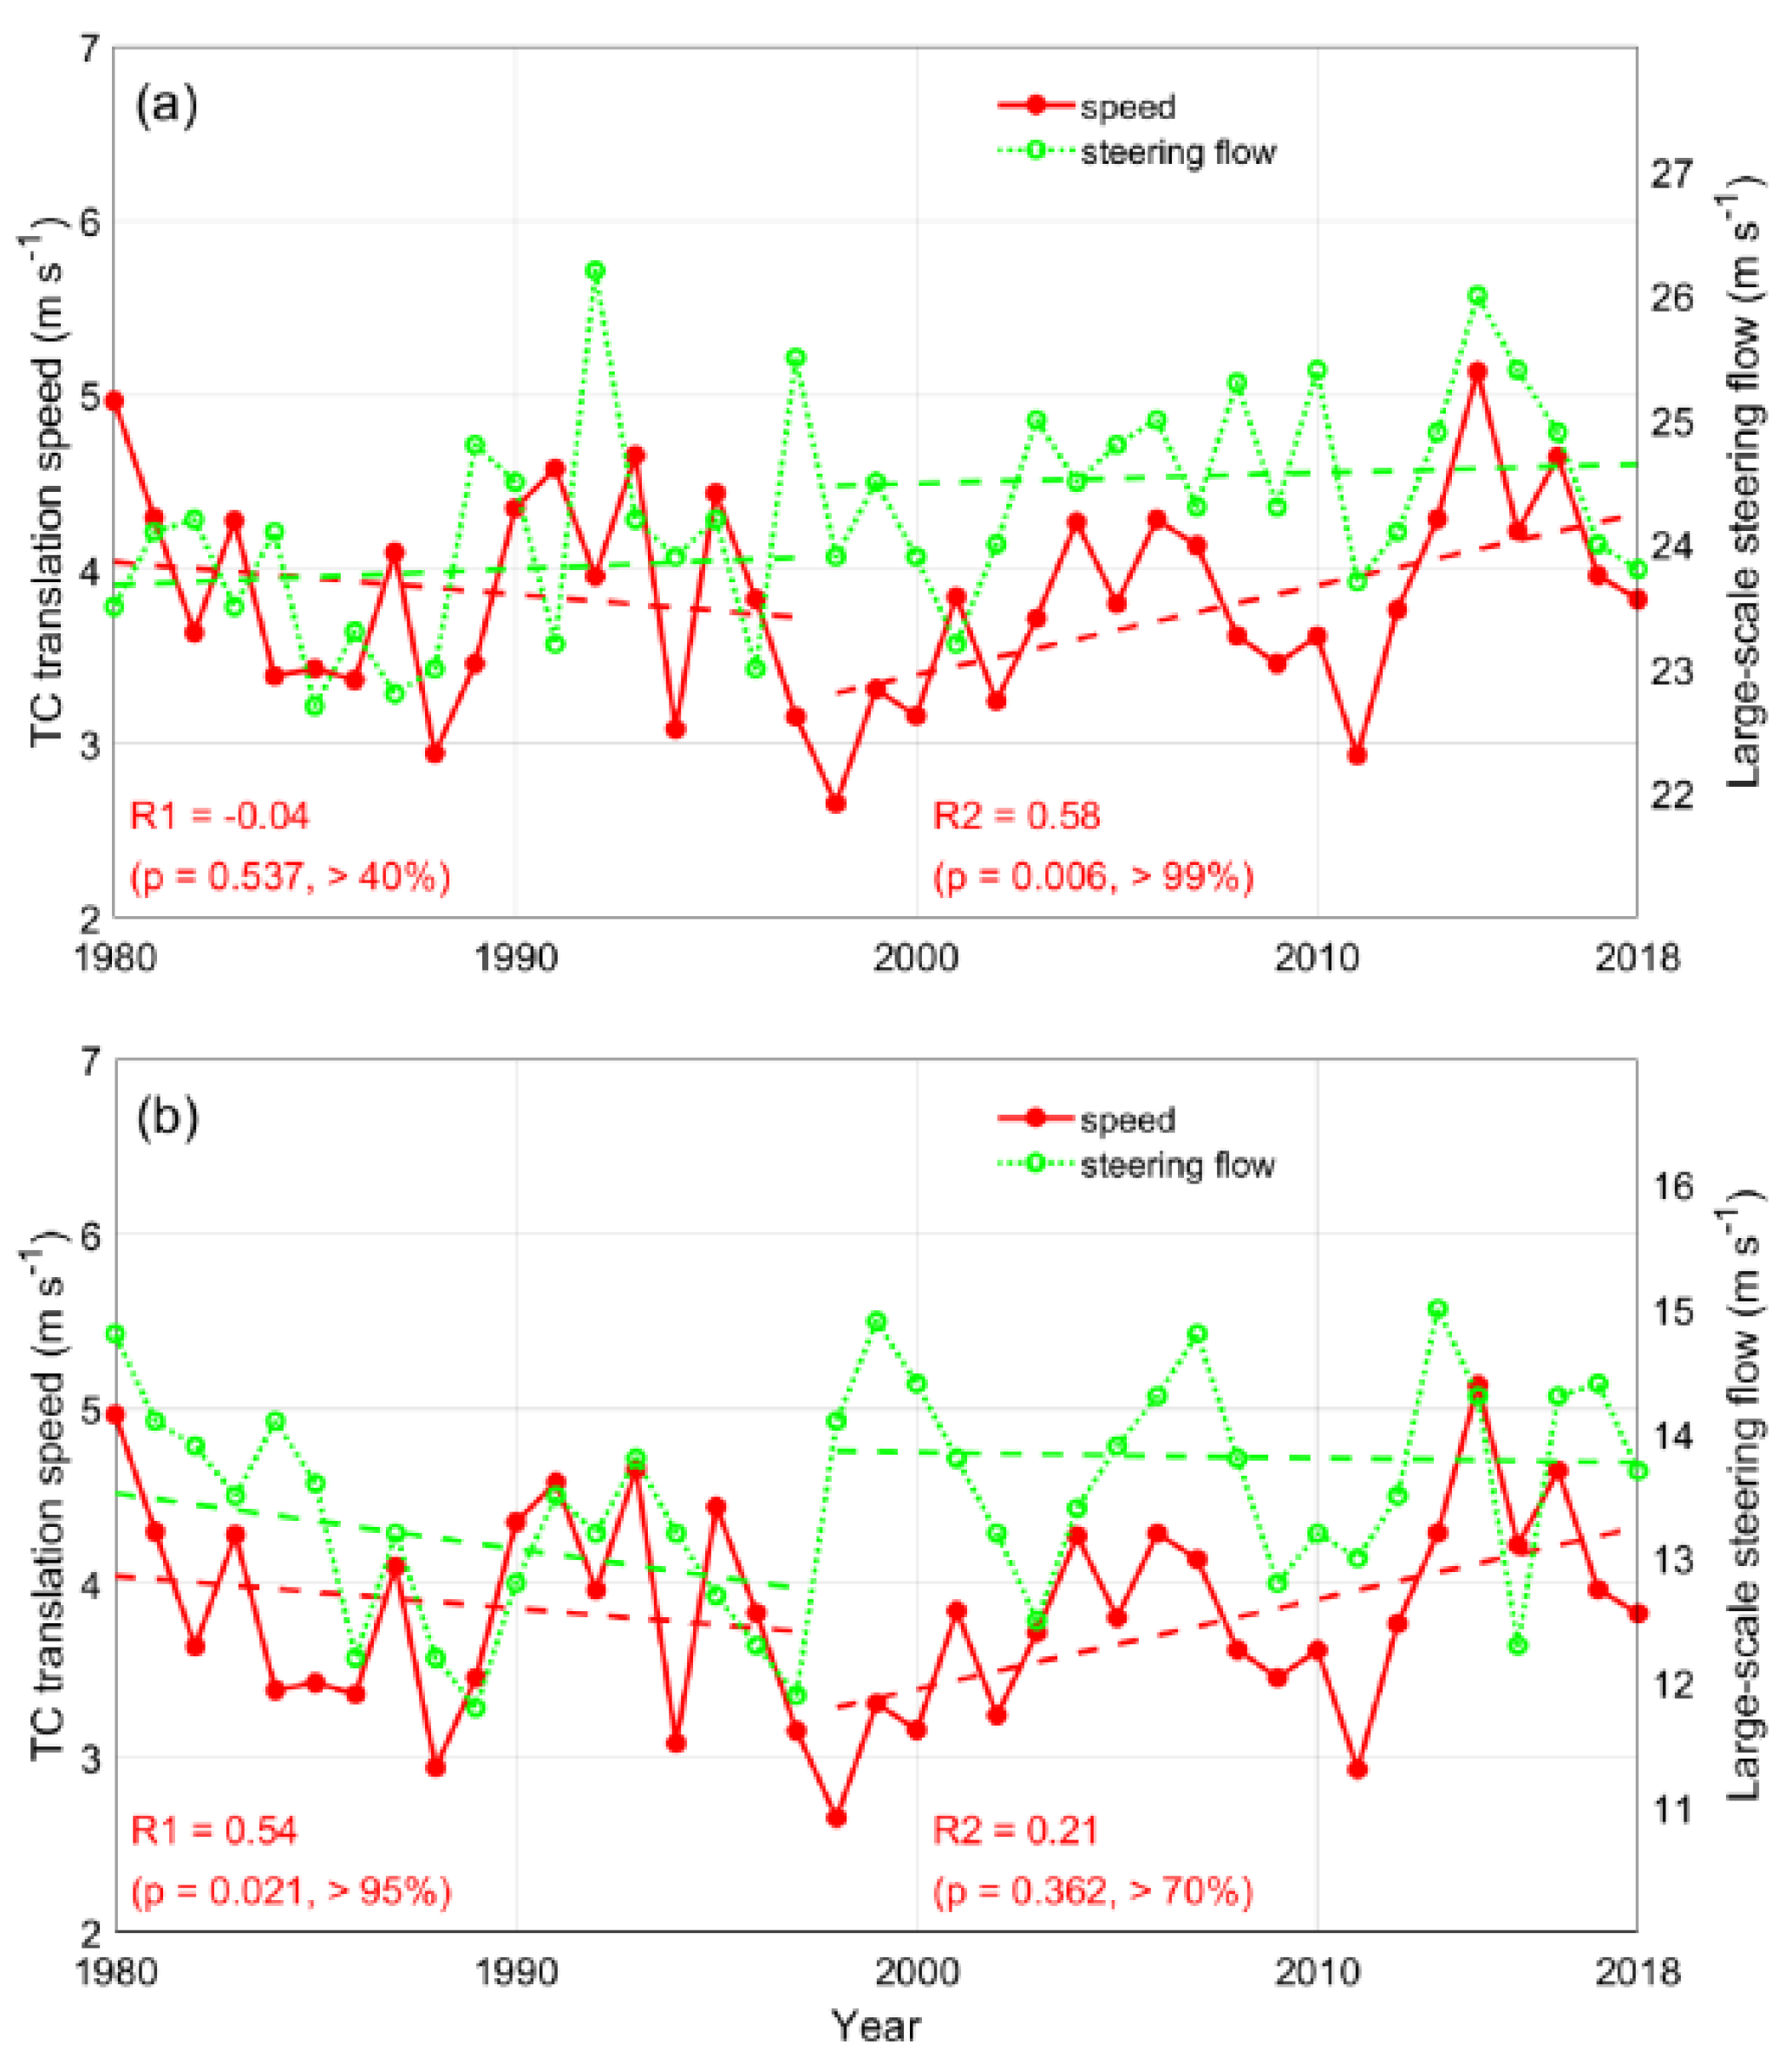
In addition, the probability distributions of TC intensity in both periods (Figure 10a) show that there are much stronger TCs in P2 than in P1. TC intensity trend is decreasing, and most TCs are weak during the P1 period, so many of these TCs cannot extend to higher levels and respond to the increase in high-level steering flow. The difference between the two periods can also be seen in the probability distribution of TC translation speed (Figure 10b). Indeed, there is nearly no correlation between translation speed and 200–850 hPa steering flow for P1 (Figure 11a). For P2, TC intensity is an increasing trend so that the stronger TCs can develop to higher altitudes and therefore can be advected by the higher-level steering flow, obtaining a higher translation speed. Hence, a significant correlation between TC translation speed and 200–850 hPa steering flow occurs in P2 (Figure 11a), which is contributed mostly from the steering above 500 hPa rather than that below 500 hPa (Figure 11b).
4. Discussion
The study of TC translation speed has become a hot topic in recent years, among which WNP has received more attention due to the most frequent TC activities. The basic conclusion recognized by most scholars so far is that TC translation speed shows a decreasing trend from the 1950s to the present. However, some scholars have recently found that it has changed to an increasing trend after 1997/1998. Here, we study the translation speed of TC over WNP during the active seasons (June to November) from 1980 to 2018 and discuss the translation speed trends for the three stages of TC genesis–LMI, LMI–dissipation, and the whole process of genesis dissipation. By taking LMI as the turning point of TC lifetime, we find that the interdecadal translation speed trend changes in TC whole lifetime are mainly contributed from the genesis–LMI stage, and translation speed showed an increasing trend during the period of 1998–2018 (P2).
This trend is influenced by both the TC characteristics and the environmental factors. As for the TC characteristics, the later period P2 with the increasing translation speed trend also has an obvious increasing trend in intensity, and the two are highly correlated. Faster-moving TCs have less time to be influenced by the cooled ocean and, therefore, could maintain or continue to intensify. As for environmental factors, the strengthening trend of easterly winds in the region of TC westward moving over WNP, the increasing trend of SST, and the factors in PI in P2 all work together to cause the TC to move faster, thus making the translation speed increase. The increasing trend of SST and PI provides a favorable thermal environment for the development of TCs, the advection of steering flow provides a dynamical effect for the translation of TCs, and they together promote the enhancement of TC and increment of translation speed.
The effect of TC intensity on TC translation speed is proposed as the new perspective, and the contributed period is mainly from before LMI. It is found that a larger translation speed is more likely associated with higher intensity, and the levels of steering flow affecting P1 and P2 are different. For the TC of weaker distribution intensity in P1, the 500–850 hPa steering flow affects a lot without the effects of upper-level environment flow, while for the stronger distribution intensity P2, the 200–850 hPa steering flow is more correlated due to the effects of upper-level environment flow, so that TC translation speeds have an increasing trend.
It is very interesting to study the trend of translation speed in different periods of TC. Clearly, many factors affecting the trend deserve to be studied besides those mentioned in this paper. For example, the connection with the poleward movement of the TCs [7], large differences in TC translation speed at different latitudes [2], and anthropogenic activity under global warming [36]. Although this paper discusses some possible factors, it still lacks sufficient attribution analysis to explain the specific influence and effects of various factors on TC translation speed. The effect that TC translation speed can impact TC intensity by regulating negative air-sea thermal feedback is also lacking further exploration. In addition, since the turning point of TC translation speed in this paper is consistent with the turning point of the PDO phase, more specific linkage between them can be analyzed in the future, such as how the change in SST trend in the Atlantic and South Pacific under the PDO phase shift affects WNP TC translation speed.
Author Contributions
Conceptualization, D.G.; methodology, D.G. and X.T.; software, D.G.; validation, D.G.; formal analysis, D.G.; investigation, D.G.; data curation, D.G.; writing—original draft preparation, D.G. and X.T.; writing—review and editing, D.G., X.T., J.C.L.C. and Q.W. All authors have read and agreed to the published version of the manuscript.
Funding
This research was funded by the Fundamental Research Funds for the Central Universities (grant XJ2021001601).
Data Availability Statement
The TC best-track data analyzed during this study can be found at the website https://www.metoc.navy.mil/jtwc/jtwc.html?western-pacific (accessed on 1 April 2020). Environmental factors data used in this paper, such as SST and wind speed, can be found at the website https://www.ecmwf.int/en/forecasts/dataset/ecmwf-reanalysis-v5 (accessed on 1 May 2020). TC potential intensity algorithm provided by Kerry Emanuel is openly available from the website http://texmex.mit.edu/pub/emanuel/TCMAX/ (accessed on 1 May 2020).
Conflicts of Interest
The authors declare no conflict of interest.
References
- Emanuel, K.A. Assessing the present and future probability of Hurricane Harvey’s rainfall. Proc. Natl. Acad. Sci. USA 2017, 114, 12681–12684. [Google Scholar] [CrossRef] [PubMed] [Green Version]
- Moon, I.J.; Kim, S.H.; Chan, J. Climate change and tropical cyclone trend. Nature 2019, 570, 3–6. [Google Scholar] [CrossRef] [PubMed]
- Walsh, K.; Camargo, S.J.; Knutson, T.R.; Kossin, J.P.; Lee, T.C.; Murakami, H.; Patricola, C. Tropical cyclones and climate change. Trop. Cyclone Res. Rev. 2019, 34, 7443–7460. [Google Scholar] [CrossRef]
- Yamaguchi, M.; Chan, J.C.L.; Moon, I.J.; Yoshida, K.; Mizuta, R. Global warming changes tropical cyclone translation speed. Nat. Commun. 2020, 11, 1–7. [Google Scholar] [CrossRef] [Green Version]
- Chan, K.T.F. Are global tropical cyclones moving slower in a warming climate? Environ. Res. Lett. 2019, 14, 105015. [Google Scholar] [CrossRef]
- Wang, C.; Wu, L.; Lu, J.; Liu, Q.; Cao, J. Interannual variability of the basinwide translation speed of tropical cyclones in the Western North Pacific. J. Clim. 2020, 33, 1–33. [Google Scholar] [CrossRef]
- Kossin, J.P. A global slowdown of tropical-cyclone translation speed. Nature 2018, 558, 104–107. [Google Scholar] [CrossRef]
- Chang, Y.T.; Lin, I.I.; Huang, H.C.; Liao, Y.C.; Lien, C.C. The association of typhoon intensity increase with translation speed increase in the South China Sea. Sustainability 2020, 12, 939. [Google Scholar] [CrossRef] [Green Version]
- Chan, J.C.L. The physics of tropical cyclone motion. Annu. Rev. Fluid. Mech. 2005, 37, 99–128. [Google Scholar] [CrossRef]
- Zhang, D.; Zhang, H.; Zheng, J.; Cheng, X.; Chen, D. Changes in tropical-cyclone translation speed over the Western North Pacific. Atmosphere 2020, 11, 93. [Google Scholar] [CrossRef] [Green Version]
- Wang, Y.; Rao, Y.; Tan, Z.M.; Schönemann, D. A statistical analysis of the effects of vertical wind shear on tropical cyclone intensity change over the Western North Pacific. Mon. Weather Rev. 2015, 143, 3434–3453. [Google Scholar] [CrossRef]
- Kossin, J.P.; Emanuel, K.A.; Vecchi, G.A. The poleward migration of the location of tropical cyclone maximum intensity. Nature 2014, 509, 349–352. [Google Scholar] [CrossRef] [PubMed] [Green Version]
- Kossin, J.P.; Emanuel, K.A.; Camargo, S.J. Past and projected changes in Western North Pacific tropical cyclone exposure. J. Clim. 2016, 29, 5725–5739. [Google Scholar] [CrossRef]
- Moon, I.J.; Kim, S.H.; Klotzbach, P.J.; Chan, J.C.L. Roles of interbasin frequency changes in the poleward shifts of the maximum intensity location of tropical cyclones. Environ. Res. Lett. 2015, 10, 104004–104012. [Google Scholar] [CrossRef] [Green Version]
- Song, J.; Klotzbach, P.J. What has controlled the poleward migration of annual averaged location of tropical cyclone lifetime maximum intensity over the Western North Pacific since 1961? Geophys. Res. Lett. 2018, 45, 1148–1156. [Google Scholar] [CrossRef]
- Sun, J.; Wang, D.; Hu, X.; Ling, Z.; Wang, L. Ongoing poleward migration of tropical cyclone occurrence over the Western North Pacific ocean. Geophys. Res. Lett. 2019, 46, 9110–9117. [Google Scholar] [CrossRef]
- Kossin, J.P.; Olander, T.L.; Knapp, K.R. Trend analysis with a new global record of tropical cyclone intensity. J. Clim. 2013, 26, 9960–9976. [Google Scholar] [CrossRef]
- Schreck, C.J.; Knapp, K.R.; Kossin, J.P. The impact of best track discrepancies on global tropical cyclone climatologies using IBTrACS. Mon. Weather Rev. 2014, 142, 3881–3899. [Google Scholar] [CrossRef]
- Bister, M.; Emanuel, K.A. Low frequency variability of tropical cyclone potential intensity 1. Interannual to interdecadal variability. J. Geophys. Res. Atmos. 2002, 107, ACL26-1–ACL26-15. [Google Scholar] [CrossRef]
- Mei, W.; Xie, S.P. Intensification of landfalling typhoons over the northwest Pacific since the late 1970s. Nat. Geosci. 2016, 9, 753–757. [Google Scholar] [CrossRef]
- Chu, P.S.; Xin, Z. Bayesian change-point analysis of tropical cyclone activity: The central North Pacific case. J. Clim. 2004, 17, 4893–4901. [Google Scholar] [CrossRef] [Green Version]
- Gao, S.; Chen, Z.F.; Zhang, W. Impacts of tropical North Atlantic SST on Western North Pacific landfalling tropical cyclones. J. Clim. 2018, 31, 853–862. [Google Scholar] [CrossRef]
- Sun, J.; Wang, G.H.; Zuo, J.C.; Ling, Z.; Liu, D.H. Role of surface warming in the northward shift of tropical cyclone tracks over the South China Sea in November. Acta. Oceanol. Sin. 2017, 36, 67–72. [Google Scholar] [CrossRef]
- Riemer, M.; Montgomery, M.T.; Nicholls, M.E. A new paradigm for intensity modification of tropical cyclones: Thermodynamic impact of vertical wind shear on the inflow layer. ACPD 2010, 9, 1635–1642. [Google Scholar] [CrossRef] [Green Version]
- Zhao, H.K.; Duan, X.Y.; Raga, G.B.; Klotzbach, P.J. Changes in characteristics of rapidly intensifying Western North Pacific tropical cyclones related to climate regime shifts. J. Clim. 2018, 31, 8163–8179. [Google Scholar] [CrossRef]
- Emanuel, K.A. Thermodynamic control of hurricane intensity. Nature 1999, 401, 665–669. [Google Scholar] [CrossRef]
- Emanuel, K.A. Tropical cyclone activity downscaled from NOAA-CIRES reanalysis, 1908–1958. JAMES 2010, 2, 12. [Google Scholar] [CrossRef]
- Lin, I.I.; D’Asaro, E.A.; Black, P.; Price, J.F.; Wu, C.C. An ocean cooling potential intensity index for tropical cyclones. Geophys. Res. Lett. 2012, 40, 1878–1882. [Google Scholar] [CrossRef]
- Vecchi, G.A.; Soden, B.J. Effect of remote sea surface temperature change on tropical cyclone potential intensity. Nature 2007, 450, 1066–1070. [Google Scholar] [CrossRef]
- Yang, L.; Huang, X.G.; Fei, J.F.; Cheng, X.P.; Shi, W.L. A statistical comparison of the potential intensity index for tropical cyclones over the Western North Pacific. Atmos. Sci. Lett. 2020, 21, e945–e953. [Google Scholar] [CrossRef]
- Holland, G.J.; Greg, J. The maximum potential intensity of tropical cyclones. J. Atmos. Sci. 1997, 54, 2519–2541. [Google Scholar] [CrossRef]
- Zhao, X.H.; Chan, J.C.L. Changes in tropical cyclone intensity with translation speed and mixed layer depth: Idealized WRF-ROMS coupled model simulations. Q. J. Roy. Meteor. Soc. 2017, 143, 152–163. [Google Scholar] [CrossRef]
- Chan, J.C.L.; Gray, W.M. Tropical cyclone movement and surrounding flow relationships. Mon. Weather Rev. 1982, 110, 1354–1374. [Google Scholar] [CrossRef] [Green Version]
- Kimberlain, B.T.; Breman, M.J. Global Guide to Tropical Cyclone Forecasting National Hurricane Center; NOAA/NWS/NCEP: Miami, FL, USA, 2017.
- Velden, C.S.; Leslie, L.M. The basic relationship between TC intensity and the depth of the environmental steering layer in the Australian region. WAF 1991, 6, 244–253. [Google Scholar]
- Lanzante, J.R. Uncertainties in tropical-cyclone translation speed. Nature 2019, 570, E6–E15. [Google Scholar] [CrossRef]
Figure 1.
Time series and trends analysis of yearly averaged TC LMI in active seasons (June–November) over WNP during the period 1980–2018. The two blue dashed lines indicate the trends, and the two black solid lines indicate the mean value in P1 and P2.
Figure 1.
Time series and trends analysis of yearly averaged TC LMI in active seasons (June–November) over WNP during the period 1980–2018. The two blue dashed lines indicate the trends, and the two black solid lines indicate the mean value in P1 and P2.

Figure 2.
The trend of TC translation speed over WNP on the stages of (a) TC genesis to LMI, (b) LMI to dissipation, and (c) TC genesis to dissipation. The blue dashed line indicates the trend, and the black solid line indicates the mean value in the period 1980–1997 and 1998–2018, respectively. The purple dashed line indicates the trend for the whole period 1980–2018.

Figure 3.
Probability distribution of each year as a time turning point according to (a) TC translation speed and (b) LMI.
Figure 3.
Probability distribution of each year as a time turning point according to (a) TC translation speed and (b) LMI.

Figure 4.
Annual mean positions of TC genesis (blue dots) and LMI (red dots) over WNP for periods of (a) 1980–1997 (P1) and (b) 1998–2018 (P2). (c) The comparisons of the genesis (cross) and LMI (triangle) positions averaged on P1 (green) and P2 (purple).
Figure 4.
Annual mean positions of TC genesis (blue dots) and LMI (red dots) over WNP for periods of (a) 1980–1997 (P1) and (b) 1998–2018 (P2). (c) The comparisons of the genesis (cross) and LMI (triangle) positions averaged on P1 (green) and P2 (purple).

Figure 5.
Relationship between TC translation speed and intensity (a) before LMI, (b) after LMI, and (c) during the whole lifetime of TC in P1 and P2. The blue dashed line indicates intensity trend (scale on right axis), and the red dashed line indicates speed trend (scale on left axis).
Figure 5.
Relationship between TC translation speed and intensity (a) before LMI, (b) after LMI, and (c) during the whole lifetime of TC in P1 and P2. The blue dashed line indicates intensity trend (scale on right axis), and the red dashed line indicates speed trend (scale on left axis).

Figure 6.
The trend of the magnitudes (shading) of (a,b) wind field at 500 hPa superimposed with the mean (vectors) and (c,d) vertical wind shear (200–850 hPa) over WNP in the phase from TC genesis to LMI. Left and right columns are for the periods 1980–1997 (P1) and 1998–2018 (P2), respectively. Crosses (triangles) indicate mean TC genesis (LMI) locations. Green (purple) indicates P1 (P2).

Figure 7.
Spatial distributions of trends of different environmental factors from TC genesis to LMI over WNP for the periods 1980–1997 (P1, left columns) and 1998–2018 (P2, right columns). (a,b) SST, (c,d) PI, (e,f) TC outflow layer temperature, (g,h) enthalpy difference. Crosses (triangles) indicate mean TC genesis (LMI) locations. Green (purple) indicates P1 (P2).

Figure 8.
Time series and the trends of different environmental factors averaged during the stage from TC genesis to LMI over WNP. (a) SST at the current moment, (b) SST before 24 h, (c) PI, (d) outflow layer temperature, (e) enthalpy difference (its value and trend are multiplied by 10−4 for the convenience of display), (f) 200–850 hPa vertical wind shear. The blue dashed line indicates the trend, and the black solid line indicates the mean value.

Figure 9.
Trends of steering flow at different layer and TC intensity at the stage from TC genesis to LMI before LMI. (a) 200–850 hPa steering flow, (b) 500–850 hPa steering flow, and (c) intensity. The blue dashed line indicates the trend, and the black solid line indicates the mean value.
Figure 9.
Trends of steering flow at different layer and TC intensity at the stage from TC genesis to LMI before LMI. (a) 200–850 hPa steering flow, (b) 500–850 hPa steering flow, and (c) intensity. The blue dashed line indicates the trend, and the black solid line indicates the mean value.

Figure 10.
The probability density distribution of TC (a) intensity and (b) speed before LMI in two periods of P1 (green) and P2 (red). The two lines perpendicular to the x-axis indicate the median values.
Figure 10.
The probability density distribution of TC (a) intensity and (b) speed before LMI in two periods of P1 (green) and P2 (red). The two lines perpendicular to the x-axis indicate the median values.

Figure 11.
Relationship between TC translation speed and the steering flow at the layers of (a) 200–850 hPa and (b) 500–850 hPa before LMI. The red dashed line indicates the trend of speed, and the green dashed line indicates the trend of steering flow.
Figure 11.
Relationship between TC translation speed and the steering flow at the layers of (a) 200–850 hPa and (b) 500–850 hPa before LMI. The red dashed line indicates the trend of speed, and the green dashed line indicates the trend of steering flow.


Table 1.
Numbers and LMI values (m s−1) of WNP TCs during the period 1980–2018.
| P1 | year | 1980 | 1981 | 1982 | 1983 | 1984 | 1985 | 1986 | 1987 | 1988 | ||
| TC number | 21 | 24 | 23 | 22 | 29 | 22 | 21 | 22 | 23 | |||
| LMI | 78.3 | 71.9 | 85.0 | 78.2 | 74.0 | 77.5 | 83.1 | 91.1 | 70.7 | |||
| year | 1989 | 1990 | 1991 | 1992 | 1993 | 1994 | 1996 | 1996 | 1997 | |||
| TC number | 29 | 27 | 27 | 31 | 30 | 30 | 28 | 35 | 27 | |||
| LMI | 77.6 | 82.2 | 84.8 | 87.1 | 72.2 | 75.0 | 72.5 | 69.0 | 95.6 | |||
| P2 | year | 1998 | 1999 | 2000 | 2001 | 2002 | 2003 | 2004 | 2005 | 2006 | 2007 | |
| TC number | 23 | 25 | 29 | 26 | 24 | 20 | 24 | 20 | 22 | 24 | ||
| LMI | 63.7 | 50.6 | 66.9 | 80.2 | 76.5 | 87.0 | 93.8 | 86.5 | 78.4 | 73.3 | ||
| year | 2008 | 2009 | 2010 | 2011 | 2012 | 2013 | 2014 | 2015 | 2016 | 2017 | 2018 | |
| TC number | 20 | 25 | 16 | 20 | 22 | 30 | 16 | 20 | 28 | 27 | 30 | |
| LMI | 67.0 | 73.6 | 72.2 | 69.8 | 84.8 | 77.7 | 92.5 | 90.8 | 79.3 | 64.6 | 77.2 |
Publisher’s Note: MDPI stays neutral with regard to jurisdictional claims in published maps and institutional affiliations. |
© 2022 by the authors. Licensee MDPI, Basel, Switzerland. This article is an open access article distributed under the terms and conditions of the Creative Commons Attribution (CC BY) license (https://creativecommons.org/licenses/by/4.0/).
Share and Cite
MDPI and ACS Style
Gong, D.; Tang, X.; Chan, J.C.L.; Wang, Q. Trends of Tropical Cyclone Translation Speed over the Western North Pacific during 1980−2018. Atmosphere 2022, 13, 896. https://0-doi-org.brum.beds.ac.uk/10.3390/atmos13060896
AMA Style
Gong D, Tang X, Chan JCL, Wang Q. Trends of Tropical Cyclone Translation Speed over the Western North Pacific during 1980−2018. Atmosphere. 2022; 13(6):896. https://0-doi-org.brum.beds.ac.uk/10.3390/atmos13060896
Chicago/Turabian StyleGong, Danyi, Xiaodong Tang, Johnny C. L. Chan, and Qiuyun Wang. 2022. "Trends of Tropical Cyclone Translation Speed over the Western North Pacific during 1980−2018" Atmosphere 13, no. 6: 896. https://0-doi-org.brum.beds.ac.uk/10.3390/atmos13060896
Note that from the first issue of 2016, this journal uses article numbers instead of page numbers. See further details here.