
Road Traffic and Its Influence on Urban Ammonia Concentrations (France)


1
AtmoGrand Est, 5 Rue de Madrid, 67300 Schiltigheim, France
2
IMT Nord Europe, Univ. Lille, CERI EE, 59000 Lille, France
*
Author to whom correspondence should be addressed.
Atmosphere 2022, 13(7), 1032; https://0-doi-org.brum.beds.ac.uk/10.3390/atmos13071032
Submission received: 19 May 2022
/
Revised: 23 June 2022
/
Accepted: 25 June 2022
/
Published: 29 June 2022
(This article belongs to the Special Issue Ammonia in a Changing Atmosphere)
Abstract
:Ammonia (NH3) is an unregulated atmospheric gaseous pollutant in ambient air, involved in the formation of fine particles. Ammonia is therefore a major precursor of particulate matter (PM), the health effects of which have been widely demonstrated. NH3 emissions are clearly dominated by the agricultural sector (livestock and fertilizers), but other sources may also be important and less studied, such as road traffic with the increased use of catalytic converters in vehicles. This study is based on a long-term real-time measurements campaign (December 2019–September 2021) on two urban sites: a background site and a roadside site in the same agglomeration in France. The study of historical measurements at the background site clearly demonstrated the dominance of agriculture on the ammonia concentrations. This influence was also observed at both sites during the measurement campaign. The annual and monthly averages obtained in the study were similar to previous ones, with concentrations between 1–10 µg/m3 at both sites, indicating lower levels than previous studies for the roadside site. The ammonia levels measured during the campaign at the traffic site were significantly higher than those measured at the background site, highlighting the road traffic influence on ammonia in urban area. The biomass burning influence also seemed to be observed during this long measurement campaign at the agglomeration scale. The influences of road traffic and biomass burning on ammonia concentration remain small compared to agriculture.
1. Introduction
Atmospheric ammonia (NH3) is a major environmental concern. It is the main gaseous basic compound in the atmosphere that drives the acidity of precipitation, clouds, and particles [1]. In gaseous form, ammonia is highly reactive and therefore its lifetime in the atmosphere is short (a few hours to a few days) [2,3]. This reactivity includes dissociation by solar radiation or deposition by dry and/or wet deposition, but its primary issue is related to the formation of secondary inorganic particles by reaction with atmospheric acids as sulfuric and nitric acid [4,5]. Indeed, these secondary particles can contribute significantly to particulate concentrations in urban areas throughout the year or during pollution episodes2. However, this problem and the health impact of fine particles are clearly identified at present with more than 40,000 deaths in 2018 associated with particulate pollution in France [6]. In the 27 EU Member States, 307,000 premature deaths were attributed to chronic exposure to fine particulate matter in 2019 [7]. Ammonia itself does not have a direct health effect on the concentrations measured in the atmosphere, but it contributes to particulate pollution, which is a major public health concern. In addition to its indirect health impact, ammonia also has a strong environmental consequence. The primary one is the modification of the nitrogen cycle (input of reactive nitrogen into the environment). Indeed, ammonia impacts ecosystems and biodiversity, particularly through the eutrophication of environments, which is the most important impact. Ammonia is also involved in the acidification of natural ecosystems and its acute toxicity can impact aquatic species [8]. It also participates in radiative forcing and influences climate change through the addition of reactive nitrogen that can alter the carbon cycle [1,2,3].
Ammonia is presently unregulated in ambient air and there are no limit values or thresholds to be respected in Europe. However, the European regulations (directives 2008/50/EC of 21 May 2008 and 2004/107/EC of 15 December 2004) concern the PM10 mass concentration. Therefore, monitoring and reducing ammonia concentrations in ambient air would limit the formation of secondary ammonium particles. Ammonia is often the limiting reagent in the ammonium particle formation reactions in urban areas. With respect to emissions, ammonia is one of the atmospheric pollutants targeted in the French National Plan for the Reduction of Atmospheric Pollutants Emissions (PREPA) resulting from the European directives on the reduction of emissions (directive n°2016/2284 of 14 December 2016). The French objective is to reduce national ammonia emissions by 13% in 2030 compared to the 2005 reference year, with two intermediate stages: −4% in the 2020–2024 period and −8% in the 2025–2029 period compared to the same reference year. Compliance with this plan and its objectives highlights the importance of a good knowledge of the ammonia sources in ambient air.
Ammonia can be emitted by both natural and anthropogenic sources, but anthropogenic sources are dominant in urban areas. Ammonia is primarily emitted by the agricultural sector. The emissions are dominated by livestock farming (with higher emissions from slurry than from manure) then by using nitrogen fertilizers. Overall, the volatilization of ammonia into the air depends on different factors, such as the type of waste or fertilizer, the spreading practices, the weather conditions, or the soil characteristics. For example, a soil with a high pH in a hot and dry climate favors ammonia emissions. Understanding these factors and their influence on ammonia volatilization allows experts to advise farmers on the best practices to limit agricultural ammonia emissions. Although agricultural emissions remain dominant, other less-studied sources may become important in urban areas. These sources include road traffic, biomass burning, industry, and waste management [9]. Impact of road traffic emissions is less known, but the accurate knowledge of this ammonia source is fundamental for a better understanding of the formation of secondary particles in urban areas, particularly for this source, whose emissions could increase in the upcoming years. Ammonia emissions have been slightly impacted by the development of vehicles equipped with three-way catalytic converters (TWC) in the 2000s. The recent integration and the future increase of the selective catalytic reduction (SCR) system may contribute to the increase of traffic-related ammonia emissions. These last years, diesel vehicles have been equipped with these systems to meet the Euro standards for NOx emissions. The SCR system is based on the reduction of NOx in the presence of a continuous reductant, the most used being urea. Its thermolysis forms ammonia that can be emitted in the exhaust [9,10,11]. Real-world measurements have confirmed ammonia emissions from diesel vehicles, but ammonia is also emitted by gasoline vehicles with potentially higher emissions than diesel vehicles [12]. The study of ammonia in urban areas therefore needs to consider the influence of road traffic, which is likely to increase with the evolution of the vehicle fleet and the different engine types.
This work presents the first results of the comparison of two years of ammonia measurements between two sites in the agglomeration of Reims (North-East of France). The study sites are in the same agglomeration, but one is in the background and the other is close to a road axis in order to identify the traffic influence. Real-time measurements were used to understand better the spatial and temporal variations of ammonia concentrations.
2. Materials and Methods
2.1. Measurement Sites and Period
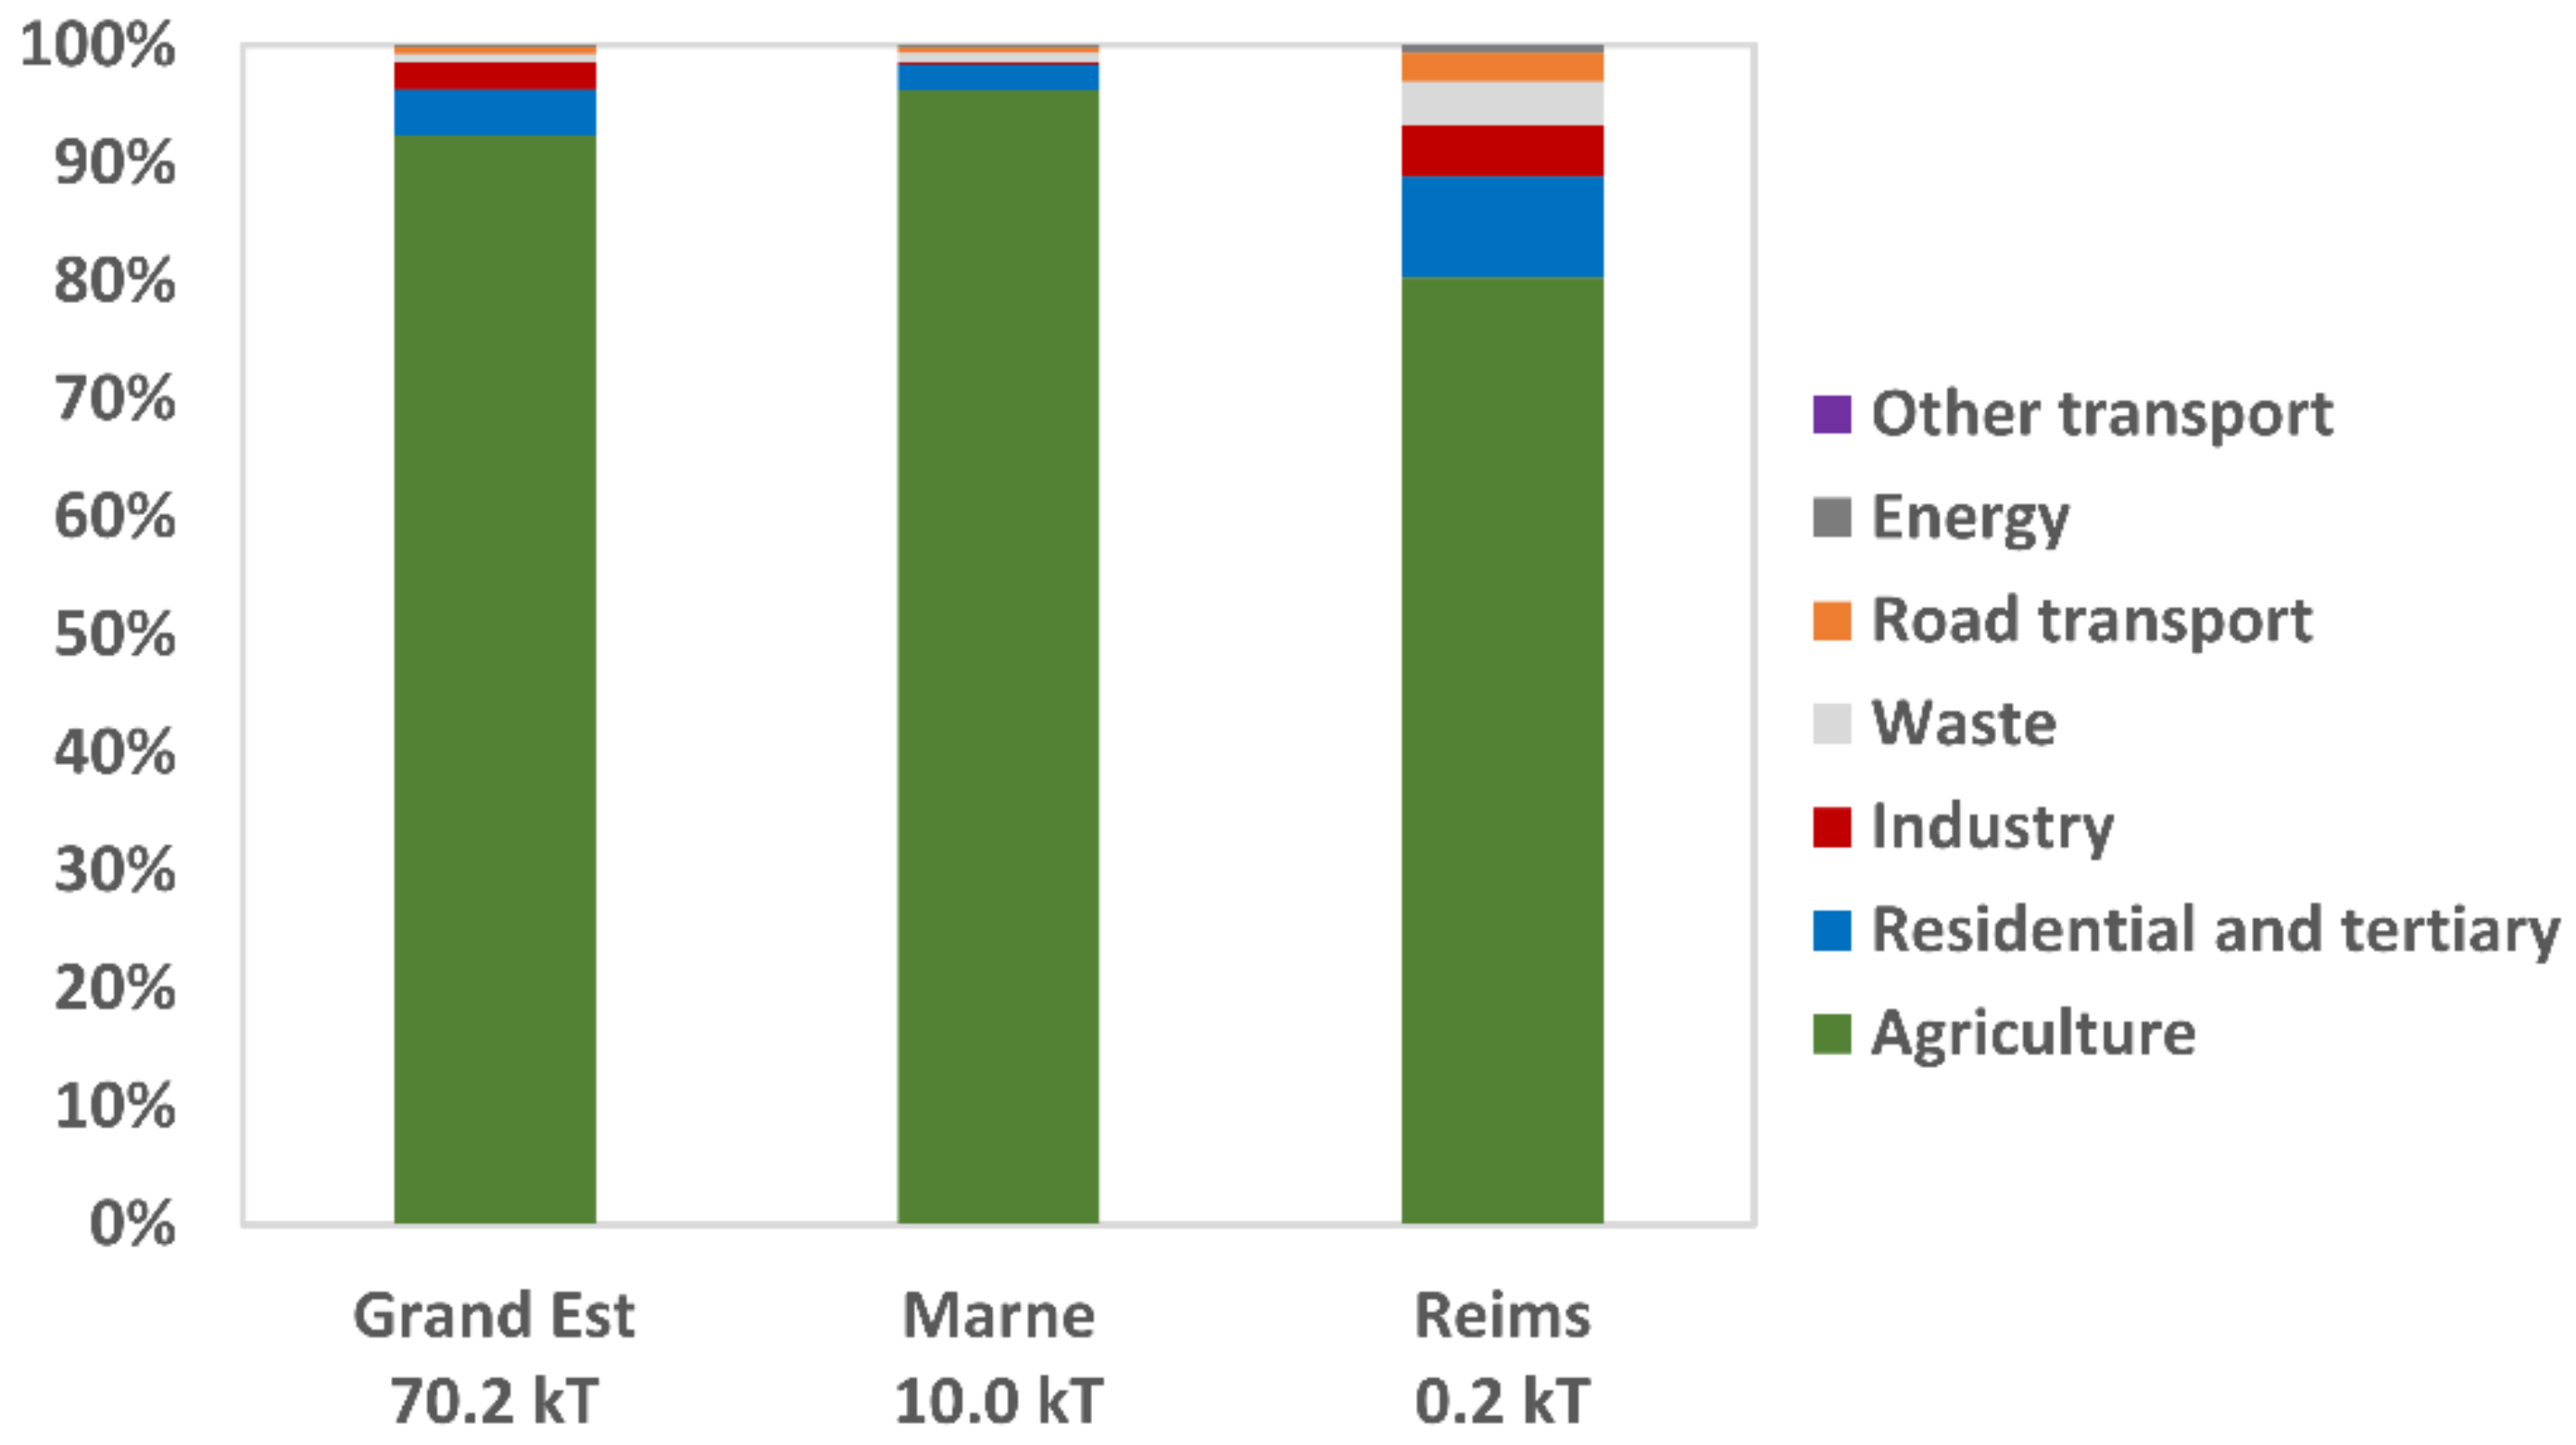
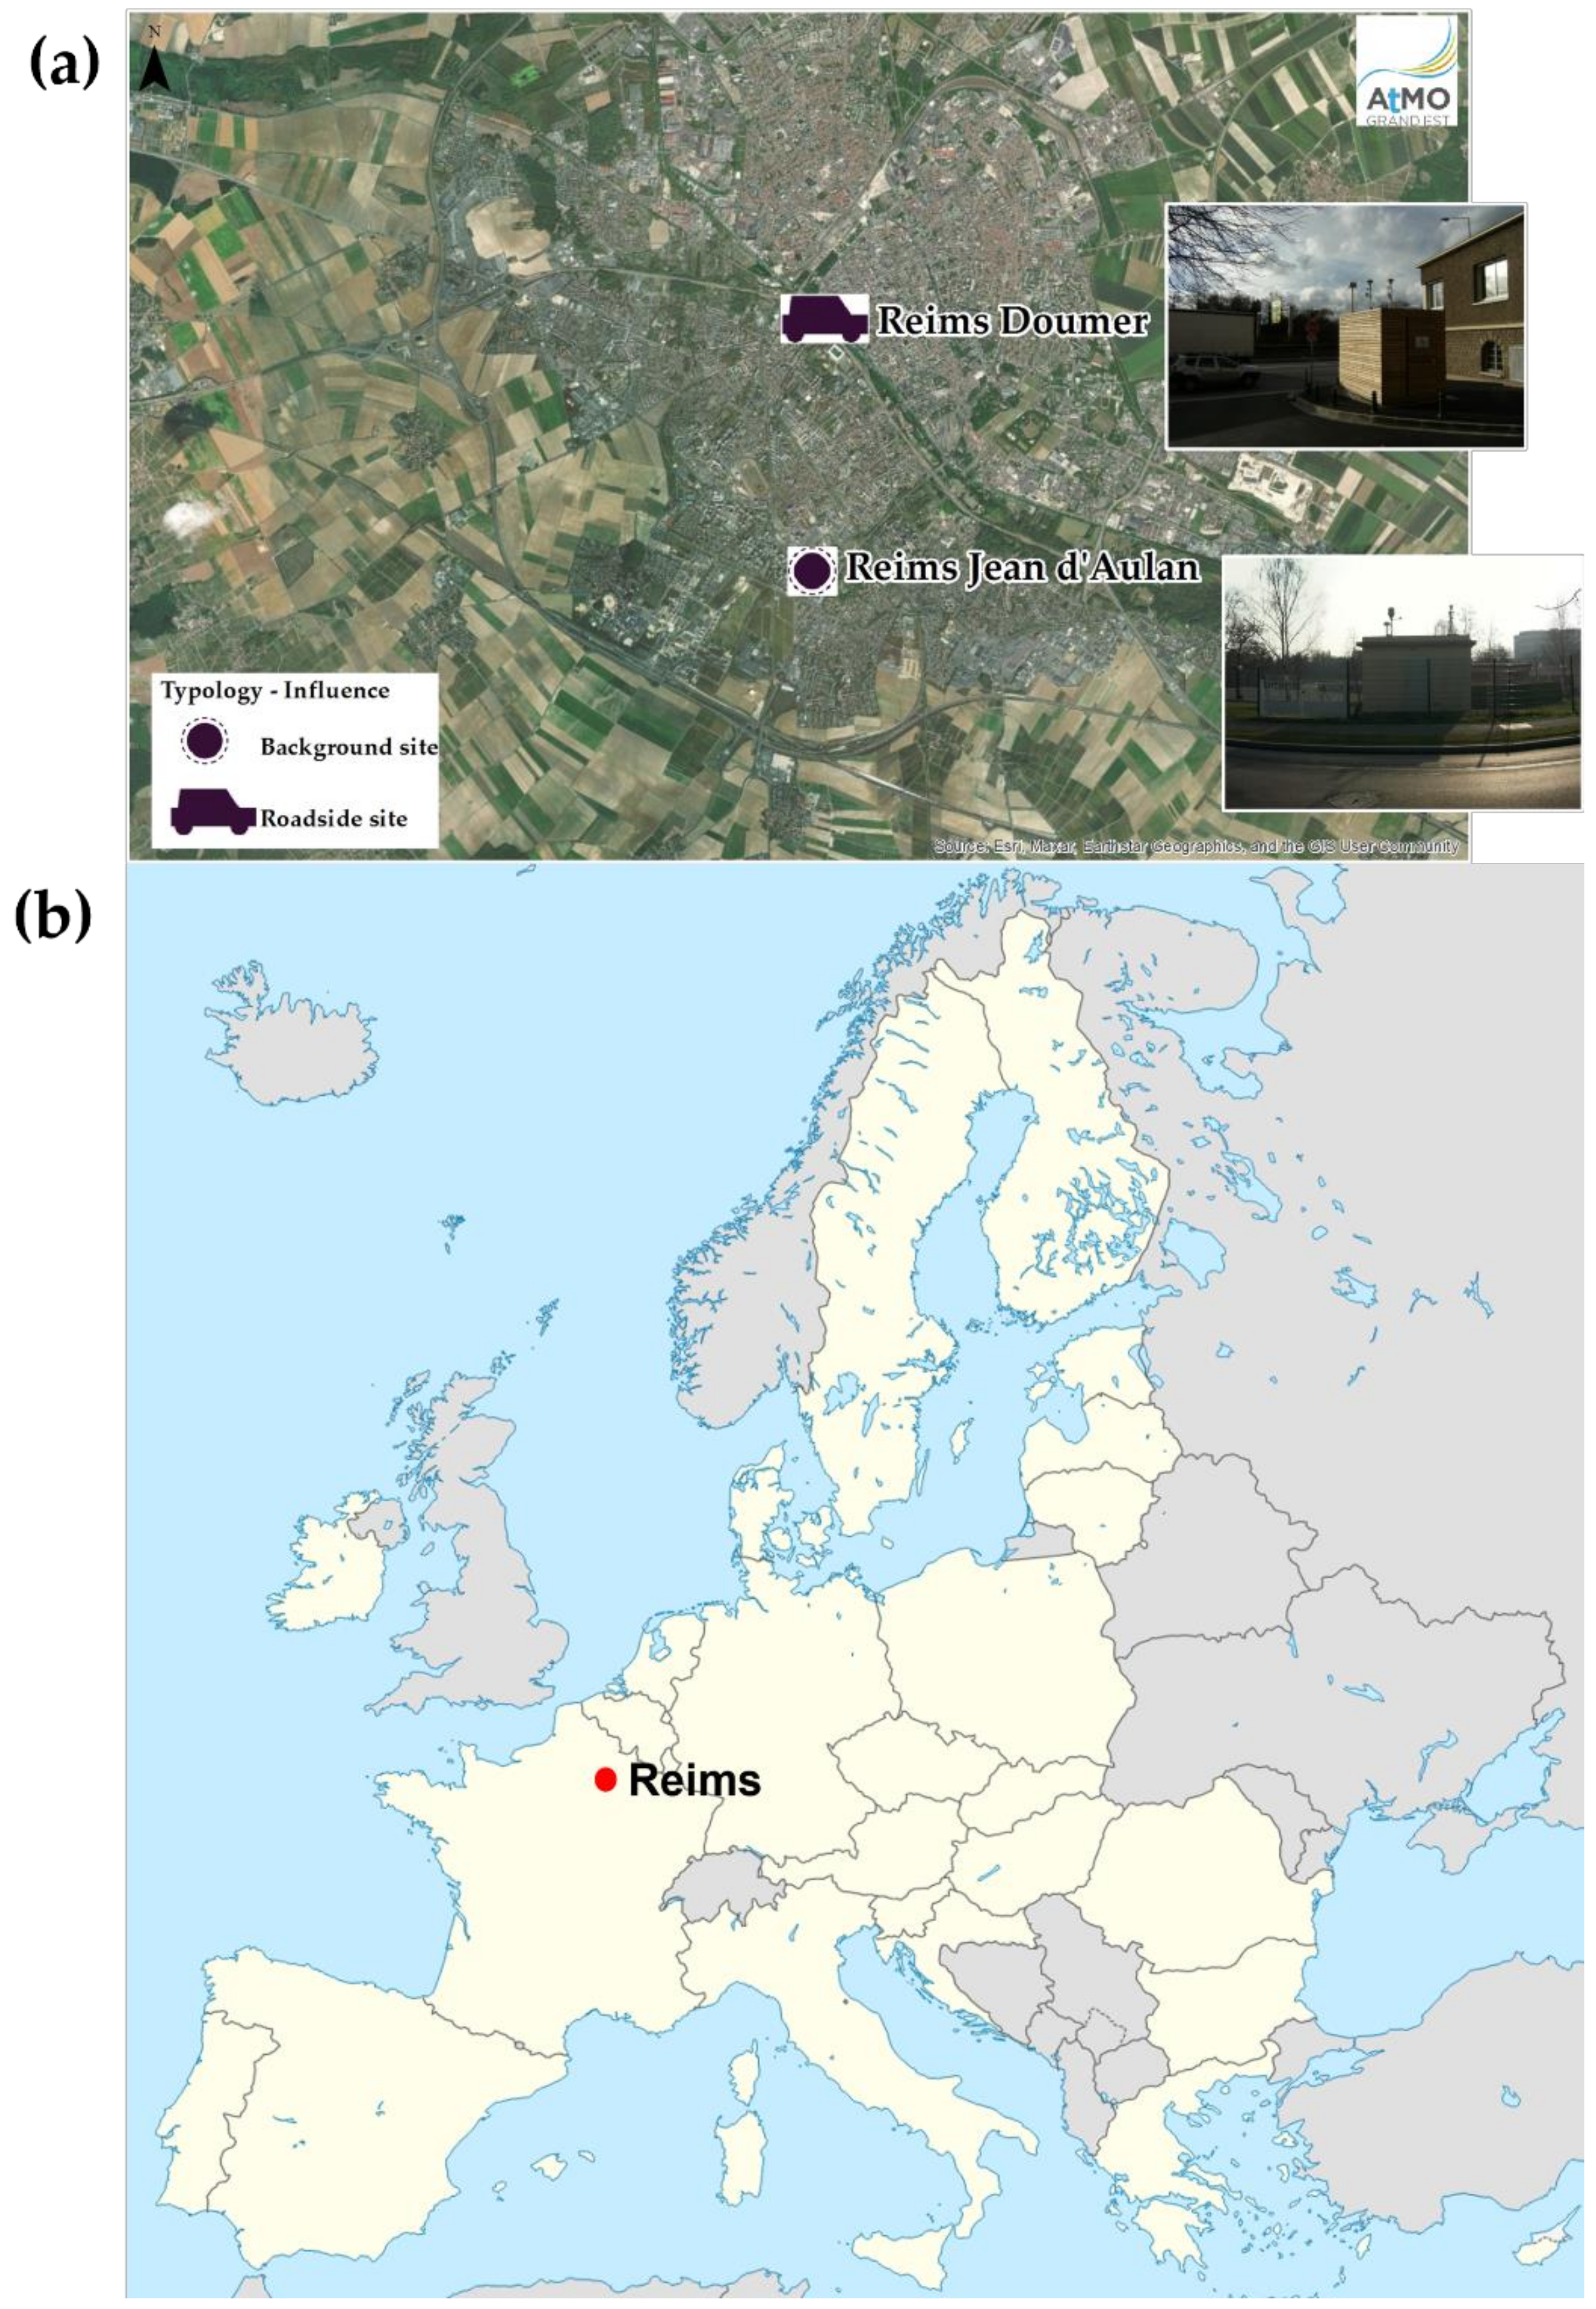
The data used in this study was collected at two sites in Reims: Reims-Jean d’Aulan, an urban background site, and Reims-Doumer, an urban roadside site. Both sites are part of the regional monitoring network of Atmo Grand-Est (www.atmo-grandest.eu, accessed on 30 April 2022). Reims is in the Grand Est region in the northeast of France. It is the 2nd Grand Est Region biggest city and the 12th largest French city in terms of population. The city of Reims is subject to a national Atmosphere Protection Plan (PPA) due to exceedances of regulatory values for nitrogen dioxide. The climate is semi-oceanic with air masses coming from the Atlantic Ocean and influenced by the Paris region. The prevailing winds come from the southwest or the west, based on the history over the last 5 years (data from ATMO Grand Est). Locally, this territory is highly urbanized, involving a large influence of local anthropogenic pollutant emissions such as district heating, but it also presents heterogeneous sectors of activity. Agriculture is dominant in the west and south, while the industry is predominantly found in the North [13]. The city is surrounded by two motorways to the west and to the east (A344 and A34) and the A344 motorway also runs east–west through the city. A study of the car fleet indicates that there will be more than 470,000 vehicles in 2021 at the department scale, with 56% diesel, 43% petrol, and 1% alternative fuels (hybrid, electric, gas) vehicles [14]. The department of Marne, in which the city of Reims is located, represents 15% of regional ammonia emissions (70,188 tons in 2019). The region, department, and city ammonia emissions are dominated by agriculture which represents between 80 and 96% of emissions according to the spatial scale in the region, as indicated in Figure 1. The influence of traffic-related ammonia emissions is mainly observed at the urban scale with 2% of total emissions. The residential and tertiary sectors mainly include emissions linked to district heating, which represent the second largest source after agriculture (with 9% of total emissions at the urban scale as an example).
The Reims-Jean d’Aulan site (background, 49°13′27.8′′ N; 4°1′13.9′′ E) is located on Jean d’Aulan street in the south of the city, as portrayed in Figure 2. This site was established in 2008 to provide a representation of the background levels in the South of the Reims agglomeration. Reims-Doumer (roadside, 49°15′02.5′′ N; 4°1′23.09′′ E) is located less than 10 m from Boulevard Paul Doumer, with a daily average traffic volume between 26,000 and 27,000 vehicles, and it is located 50 m from the highway A344 with a daily average traffic volume between 50,000 and 60,000 vehicles [15]. This station in operation since 2013 is representative of urban levels under the influence of traffic.
The influence of road traffic on the roadside site is clearly observed over the last six years of measurements. Annual nitrogen dioxide (NO2) averages—a road traffic tracer—at the roadside site are 2.4 to 2.5 times higher than at the background site, with annual averages between 32 to 44 µg/m3 and between 13 to 18 µg/m3 respectively. The difference between the annual averages of particulate matter mass concentrations is more contrasted between the two sites, depending on the particle size. Annual PM10 averages are 10 to 50% higher at the roadside site compared to the background site (21–25 µg/m3 and 16–19 µg/m3 respectively), while annual PM2.5 averages are more homogeneous at the city scale (10–15 µg/m3 at the roadside site and 10–14 µg/m3 at the background site). These data indicate a rather homogeneous distribution of fine particles compared to coarse fraction on the scale of the city and a larger share of the coarse fraction at the roadside site, which may be associated with the resuspension of road dust.
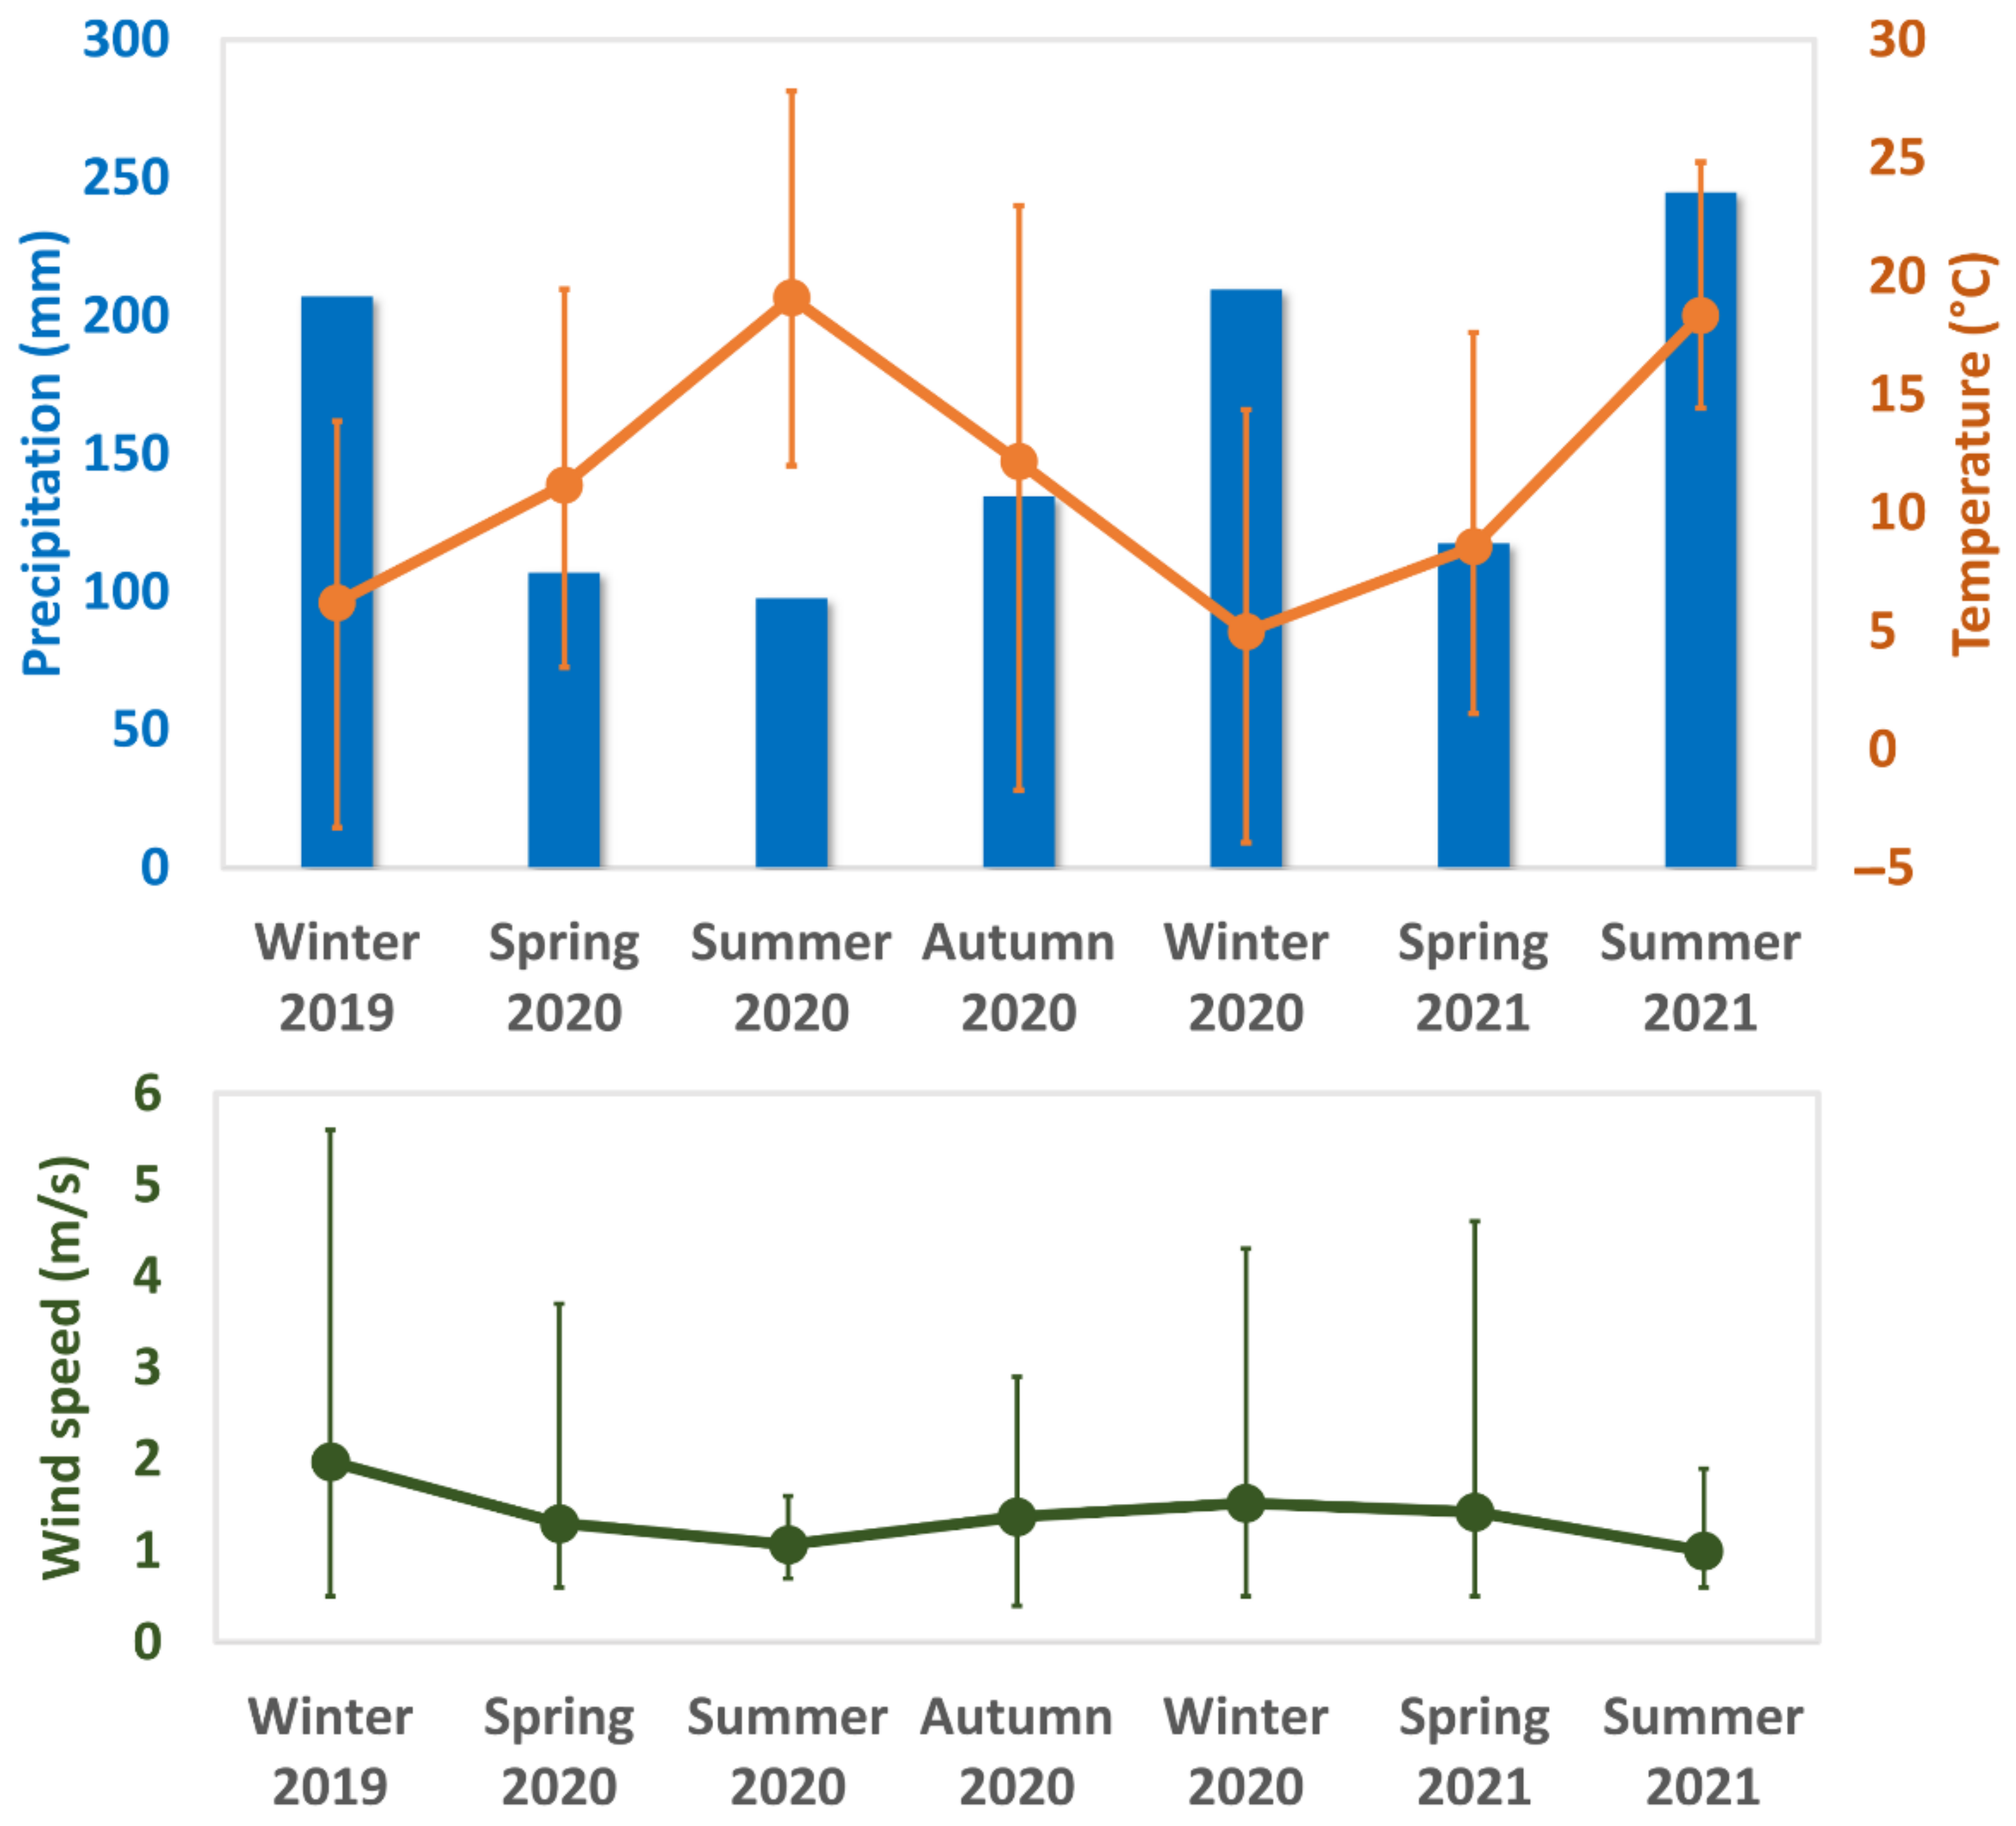
This study is based on data measured from December 2019 to September 2021 by automatic analyzers. This campaign is characterized by an expected high seasonal variability of meteorological conditions, as portrayed in Figure 3. The seasons are defined as following: winter corresponds to the months between December and February, spring from March to May, summer from June to August and autumn from September to November. Seasonal average daily temperatures were varying between of 5.0 °C (winter 2020) and 19.0 °C (summer 2020) and precipitations between 32.5 mm (summer 2020) and 69.8 mm (winter 2020). Overall, the warm season (summer) was associated with higher temperatures and lower precipitations than the cold season (winter) and conversely, except for the 2021 summer which was very rainy compared to all other seasons of the measurement campaign. The intermediate seasons (spring/autumn) are less contrasted. Seasonal variations of wind speeds were not very pronounced. Light winds were observed over the period with a maximum daily speed of 6 m/s and 98% of wind speeds were below 4 m/s.
2.2. Instrumental
Both study sites were equipped with ammonia analyzers. Other instruments were available depending on each site (gas and particles analyzers, meteorological instruments), as displayed in Table 1. The instruments were placed in a temperature-controlled measurement station at around 20 °C.
Ammonia concentrations were measured by real-time measurements with the G2103 analyzer (Picarro, Inc., Santa Clara, CA, USA) on both sites. The measurement principle is based on cavity ring-down spectroscopy (CRDS) which allows a lower detection limit and a better accuracy of the measured concentrations in comparison with other methods [4]. Ammonia measurements were also corrected using parallel measurements of water (H2O) and carbon dioxide (CO2) [4,16]. The air was sampled at 1.5 L/min, allowing a residence time in the analyzer smaller than the reactivity of ammonia.
Nitrogen dioxide concentrations were measured by chemiluminescence (Model APNA-370, Horiba Inc., Kyoto, Japan) according to the reference method EN 14211 [17]. As sulphur dioxide is no longer a problem in urban areas in the region, this pollutant was not measured during the campaign. Indeed, levels were less than or equal to 1 µg/m3 over the last 10 years at the background site, i.e., 20 times lower than the annual guidelines of the World Health Organization (WHO) [18,19]. Particle concentrations were measured continuously by a microbalance analyzer (Model TEOM-FDMS, Rupprecht & Patashnik Inc., Waltham, MA, USA) at the background site and by a Beta attenuation monitor type analyzer (Model BAM 1020, Met One Instrument Inc., Grants Pass, OR, USA) at the roadside site. These methods were demonstrated to be equivalent to the reference method EN 12341 [20]. Black Carbon (BC) concentrations were measured using a AE33 multi-wavelength aethalometer in the PM2.5 fraction. For ease of reading, the term Black Carbon (BC) is used in this paper, although the authors acknowledge that it is more appropriate to use the term “equivalent Black Carbon” (eBC) for an optical method. The measuring principle and corrections of Drinovec et al. [21] and the model from Sandradewi et al. [22] allowed the identification of the part related to biomass burning (BCwb) and the one related to fossil fuel combustion (BCff). Ozone concentrations were measured by UV absorption according to the standard EN 14625 (Model APOA-370, Horiba Inc., Japan).
The quality control of the instruments includes an initial calibration at the time of purchase, then on a regular basis in accordance with the frequency recommended by the manufacturer. The proper functioning of the instruments was also monitored throughout the measurement campaign by following the manufacturer’s recommendations and the methodological reference guides established by the Central Air Quality Monitoring Laboratory and based on available standards. The measurement errors for regulated pollutants respect the criteria of the European directives (15% for nitrogen dioxide and 25% for particulate matter). For non-regulated pollutants as ammonia, the measurement errors correspond to those of the instruments whose accuracy is ensured on a national scale through participation in both national and regional intercomparison exercises.
2.3. Data Quality and Statistics Analysis
The entire dataset was based on synchronized averaged hourly, daily, or monthly data. Only hours containing at least 75% of valid quarter-hourly data were reported and the same threshold applied to hourly data was used for daily average. A threshold of 85% was used for monthly or annual averages. A comparison between the two ammonia analyzers was performed after the campaign to confirm the reproducibility of the measurements. Results are displayed in Appendix A.
The methodology was based on the investigation of the influence of road traffic on ammonia concentrations from local data. To investigate this influence, this paper used parallel measurements over the same time period, allowing for a comparison of the two sites without external artefacts. Many additional measurements of gaseous and particulate pollutants and meteorological parameters were added to the campaign to better interpret the ammonia measurements and the influence of road traffic. The temporal variation and potential point influences were smoothed by a long data series (more than 1.5 years). This long dataset also allowed statistical studies to be performed that are acceptably representative in view of the size of the data set. The R software (4.1.3 version) was used to perform the statistical analysis.
3. Results
3.1. History and Variation at the Background Site
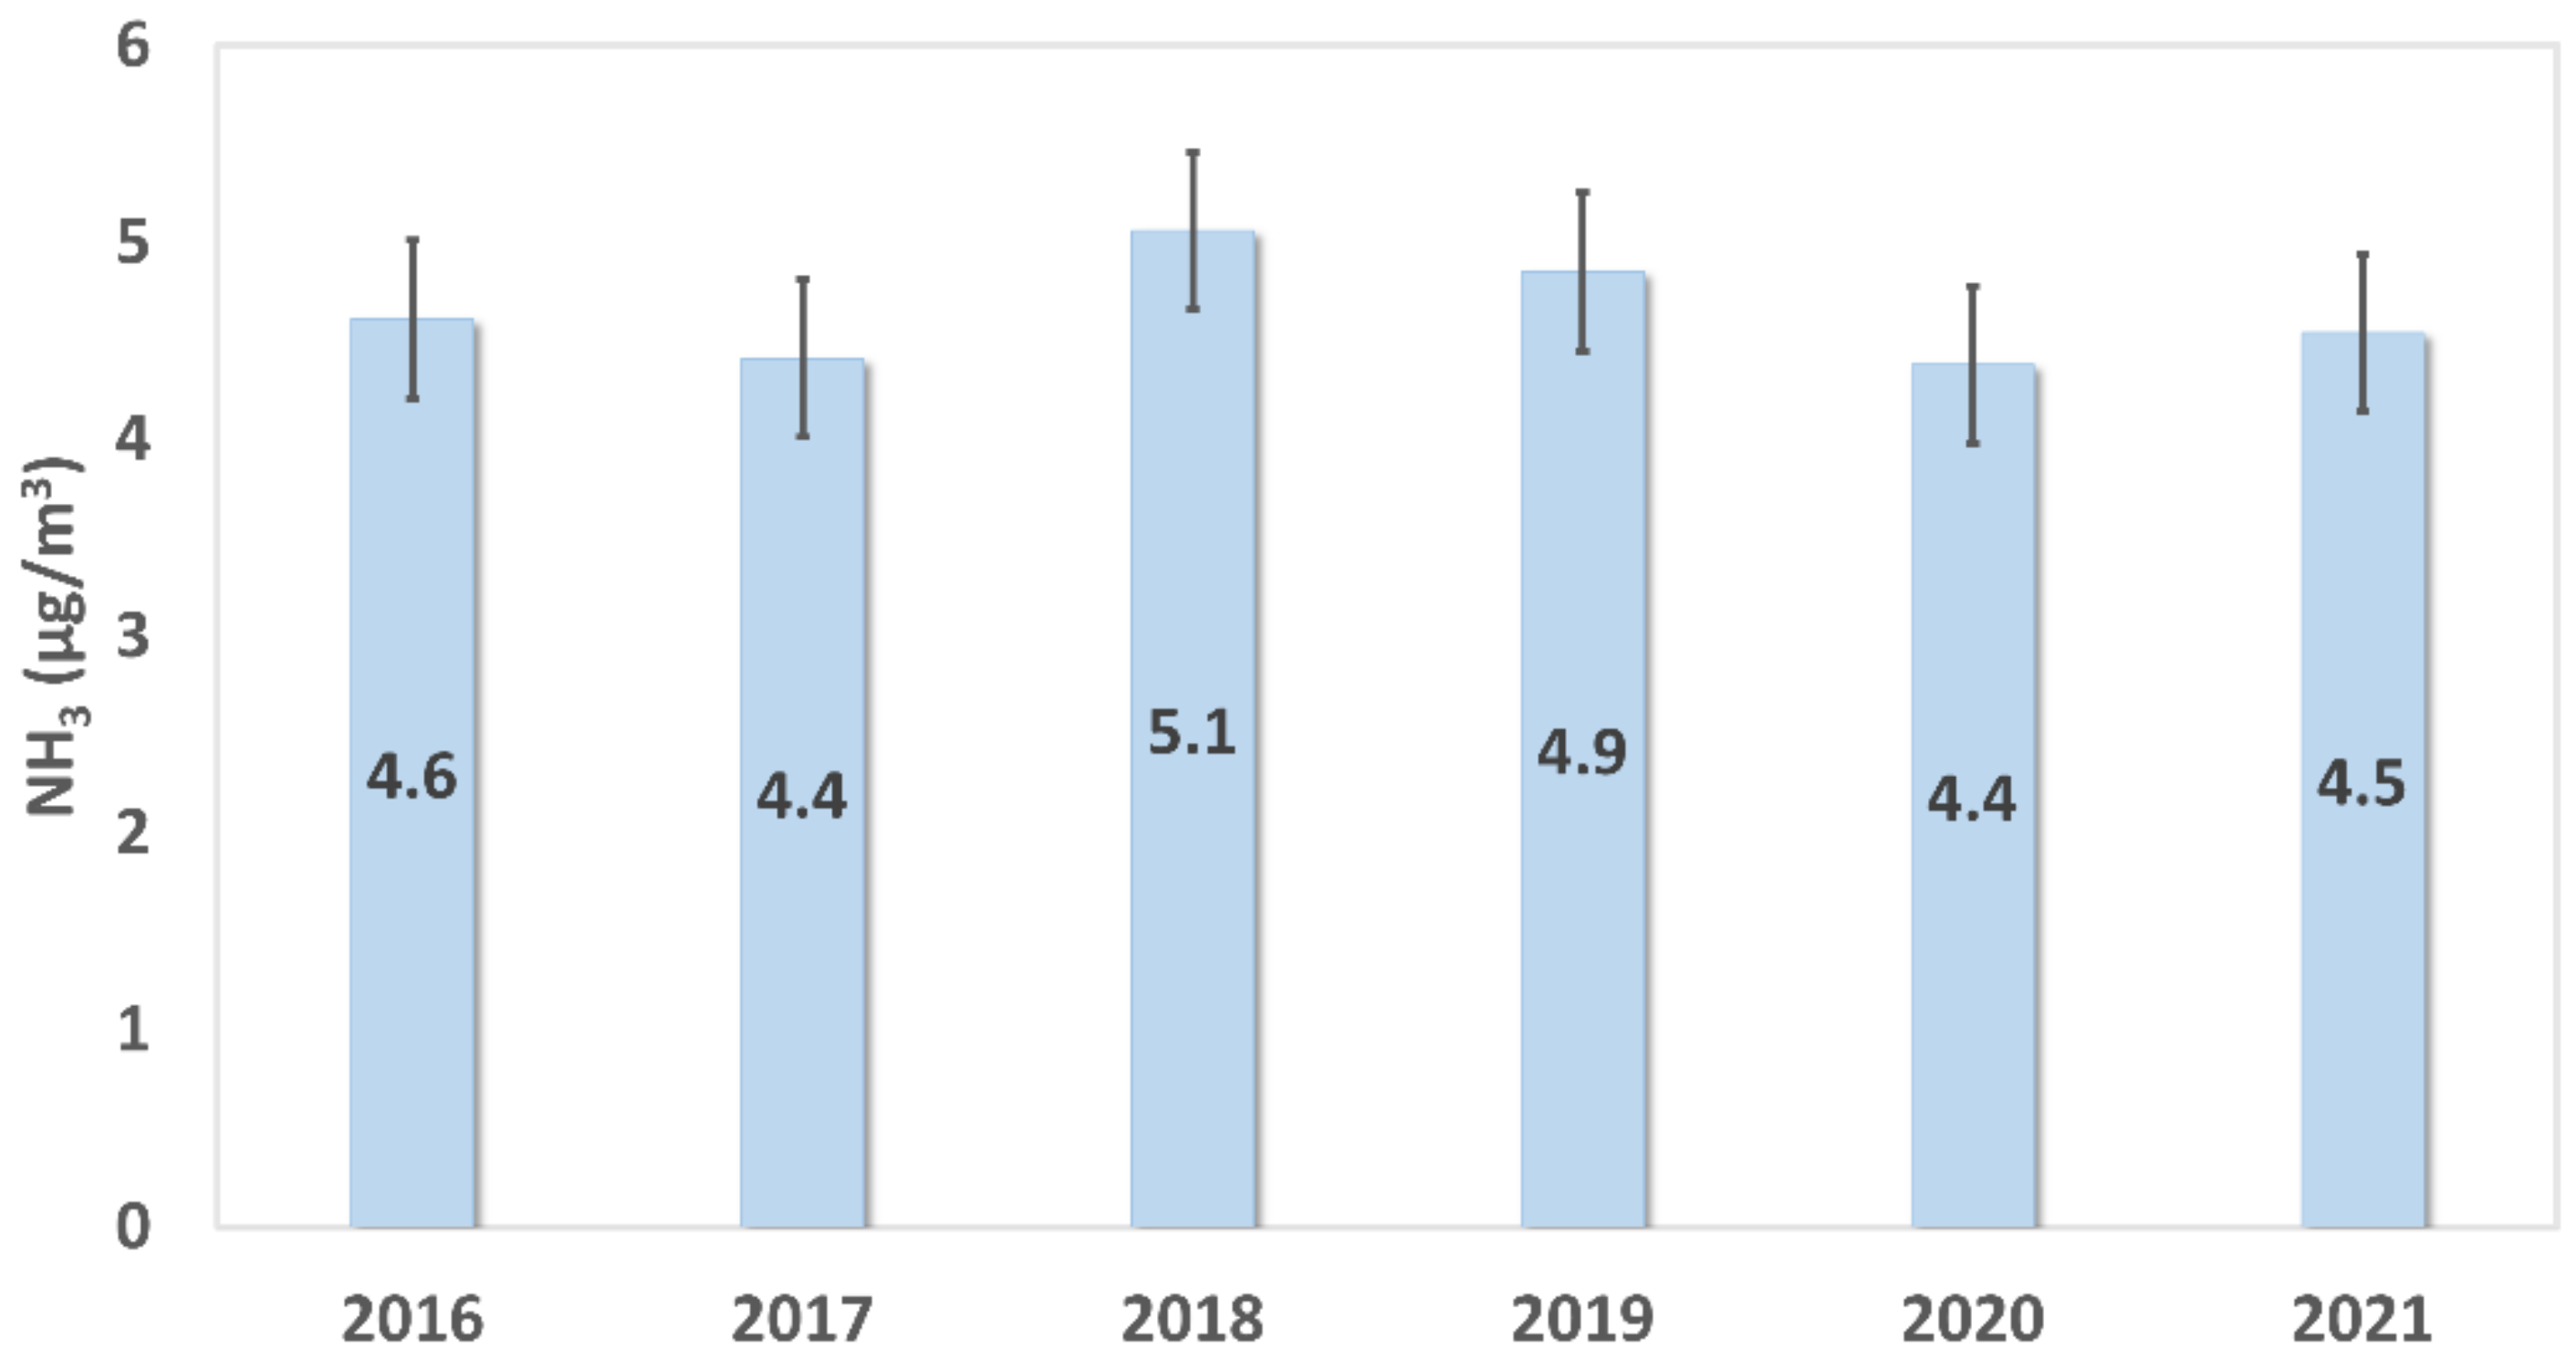
The historical urban background site of Reims indicated a relatively stable evolution of annual averages since 2016, as displayed in Figure 4. Annual ammonia concentrations varied between 4.4 (2017 and 2020) and 5.1 (2018). The observation of the last 6 years of concentrations did not allow us to discern a trend.
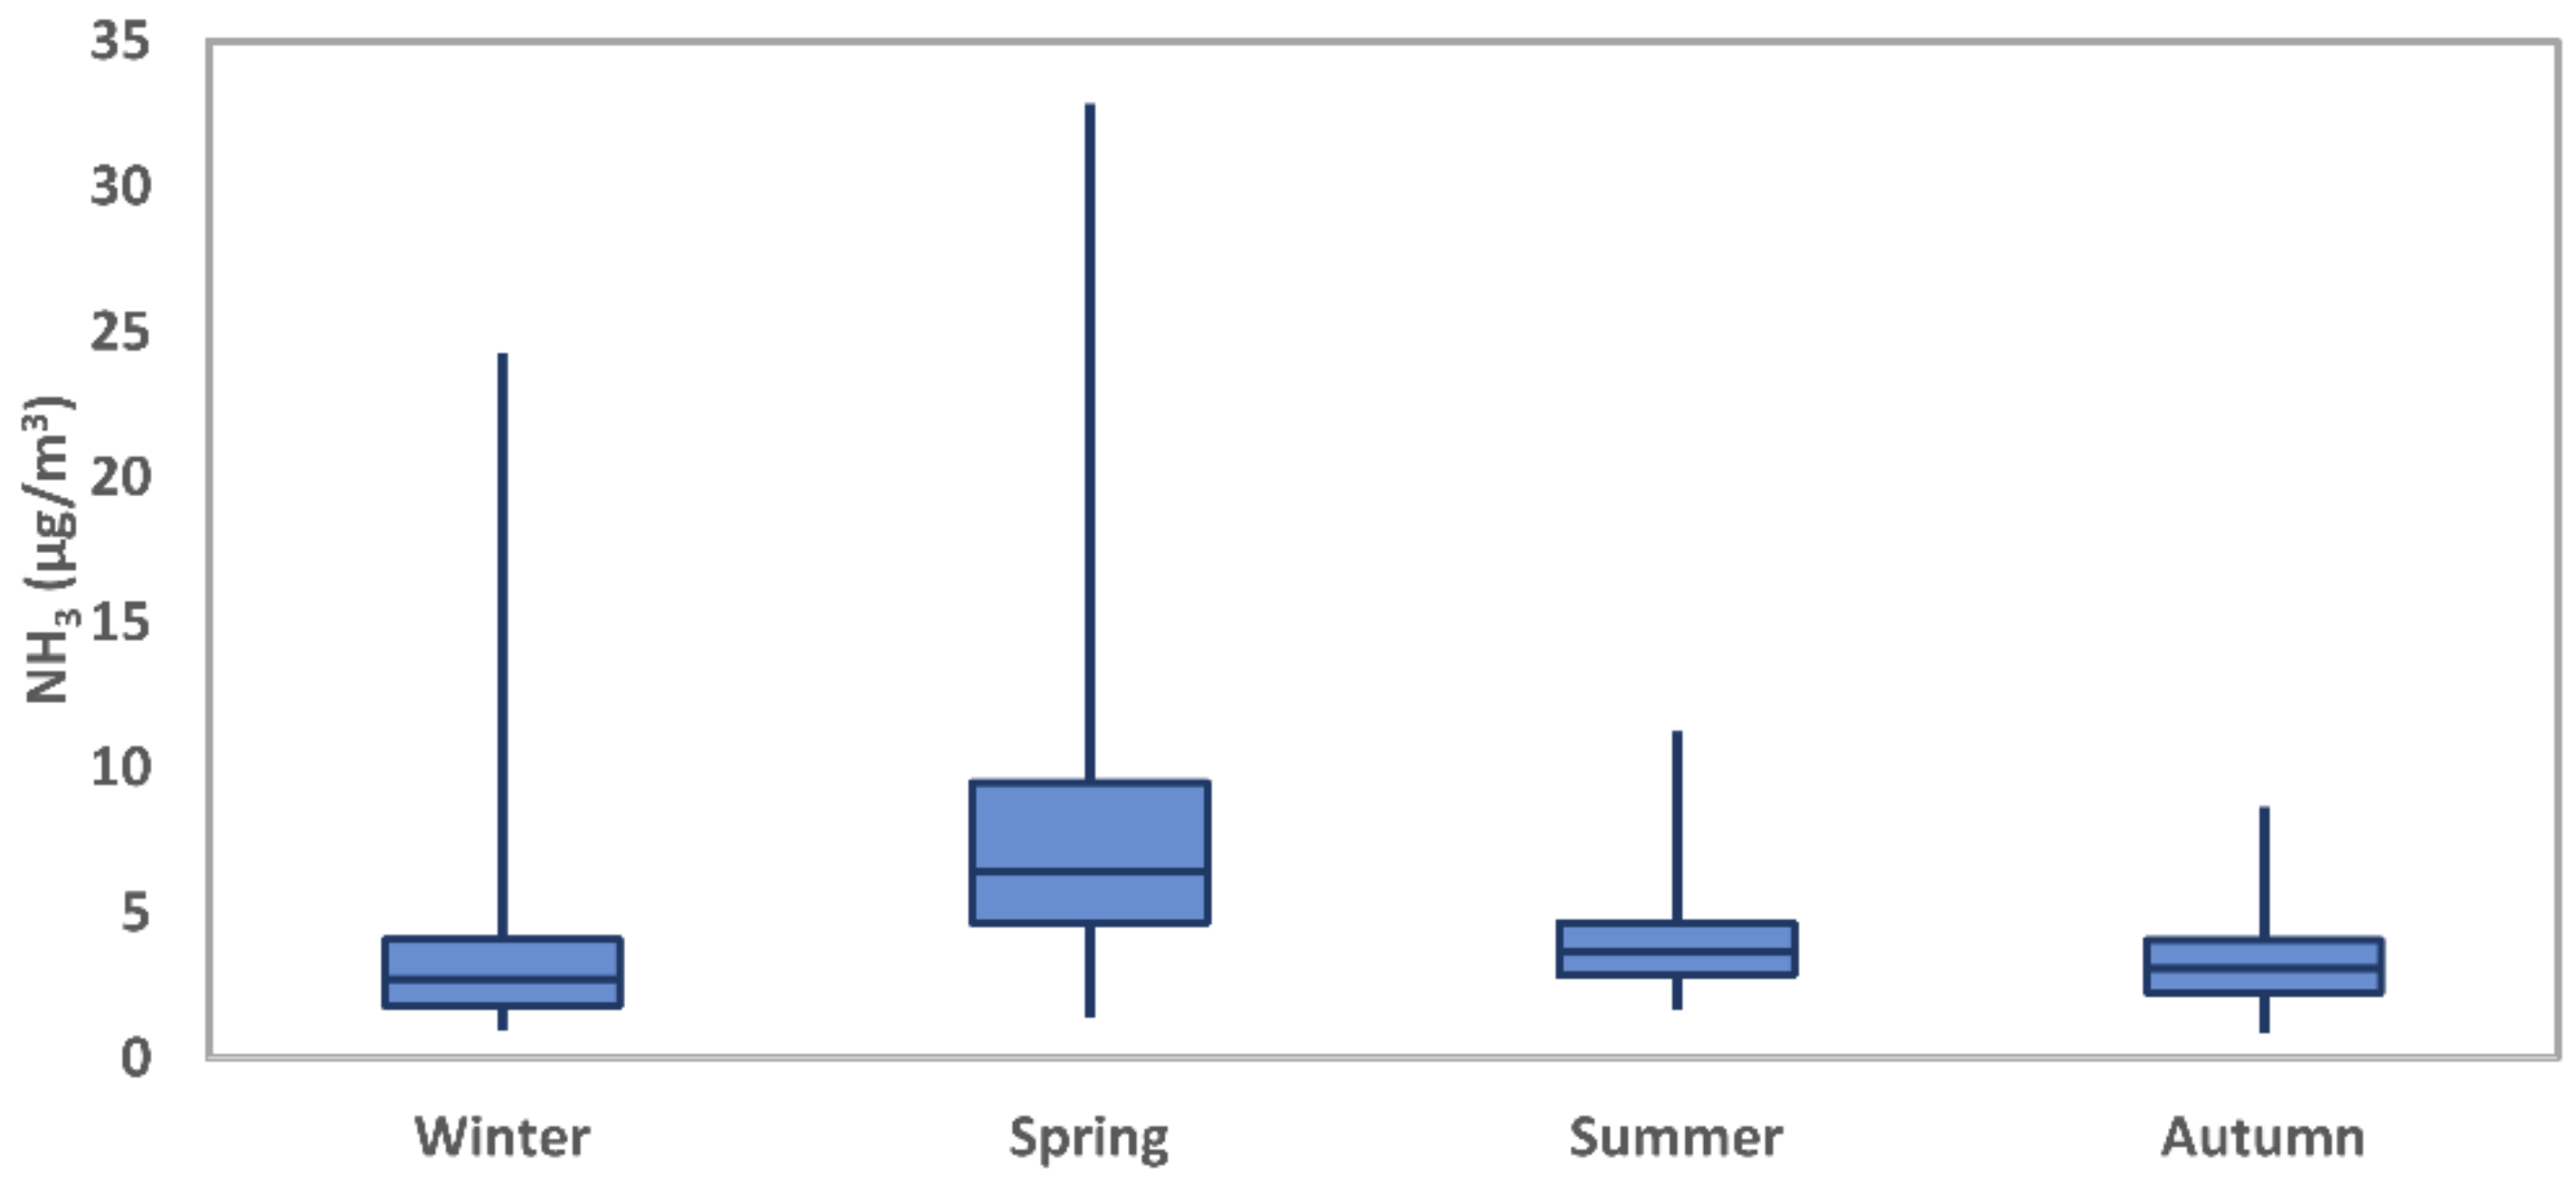
Figure 5 illustrates the seasonal boxplots of ammonia concentrations at the historical background site. The seasonal comparison indicated a marked variation, with the spring period significantly higher than the other seasons. Spring was also associated with more dispersed and asymmetric data compared to other seasons, highlighting an important variation of the concentrations during this season.
3.2. Temporal Variations during the Measurement Campaign
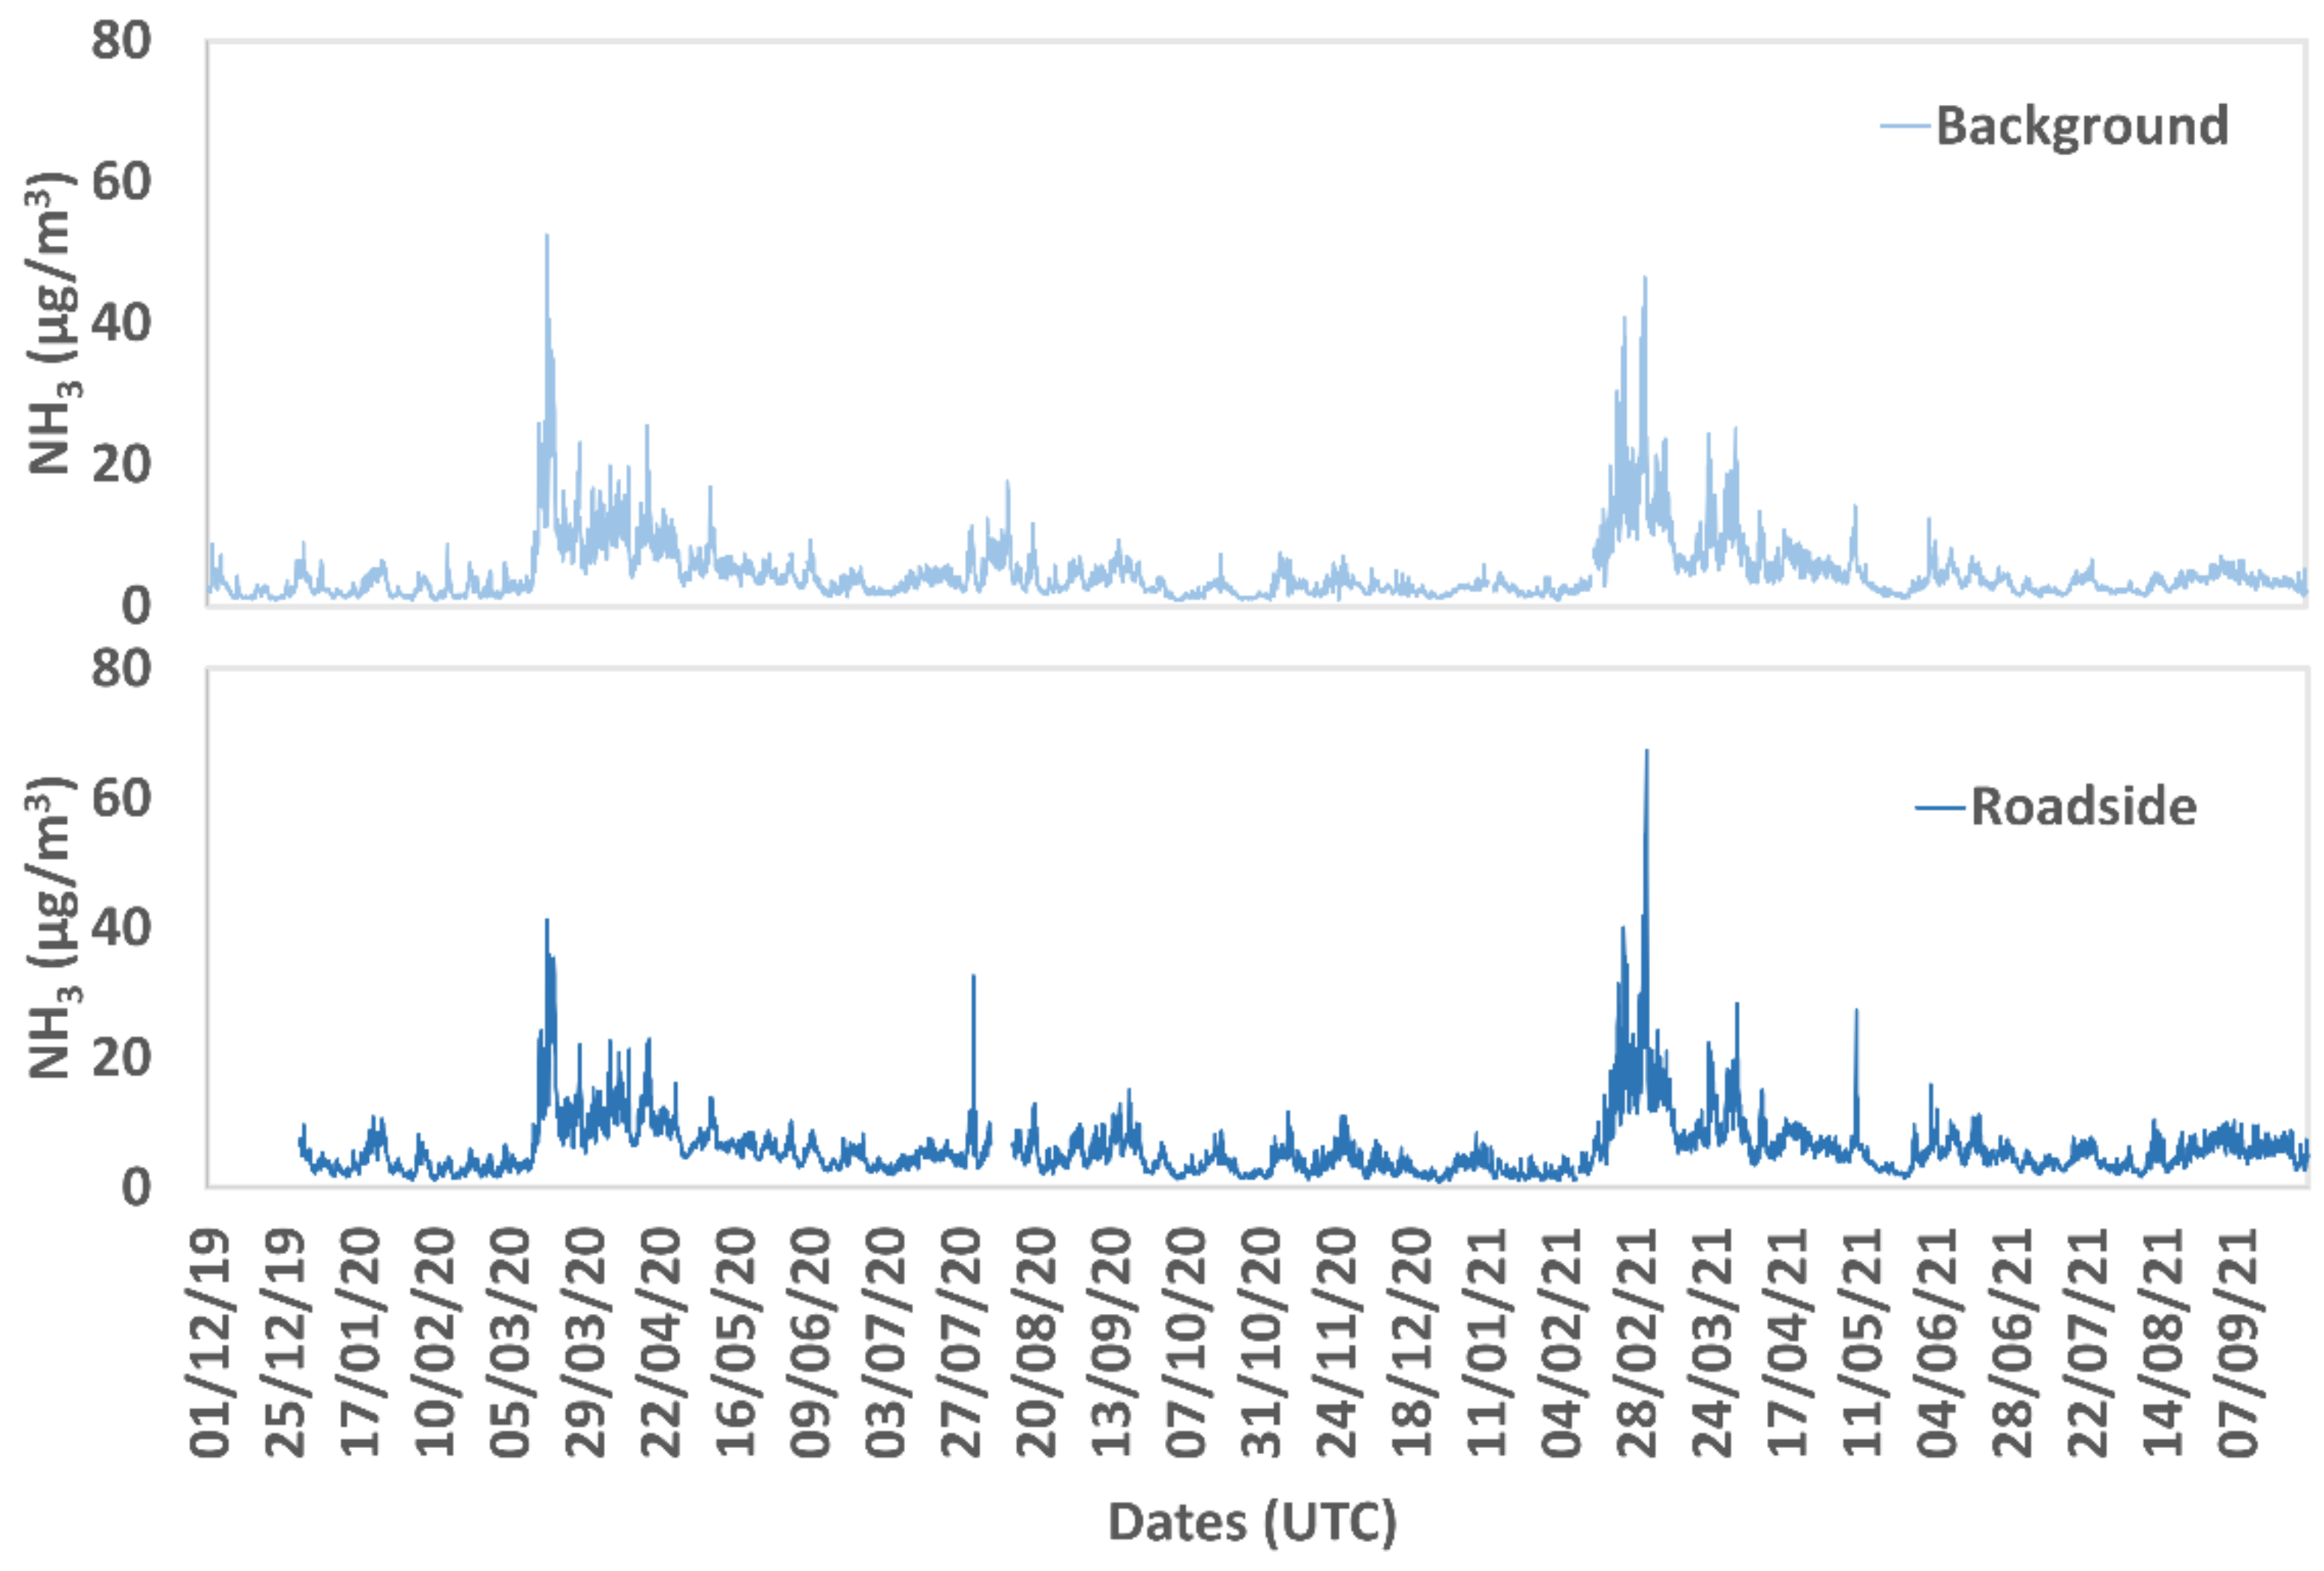
The hourly ammonia concentrations during the measurement campaign varied between 0.8 to 52.3 µg/m3 (n = 15,919) and between 1.0 to 67.5 µg/m3 (n = 15,156) at the background site and at the roadside site, respectively (descriptive statistics are presented in Appendix B). Figure 6 presents the hourly variations of ammoniac concentrations at both sites. The variations were similar between the two sites with concentrations in the same order of magnitude. However, the roadside site had periods with higher levels than the background site.
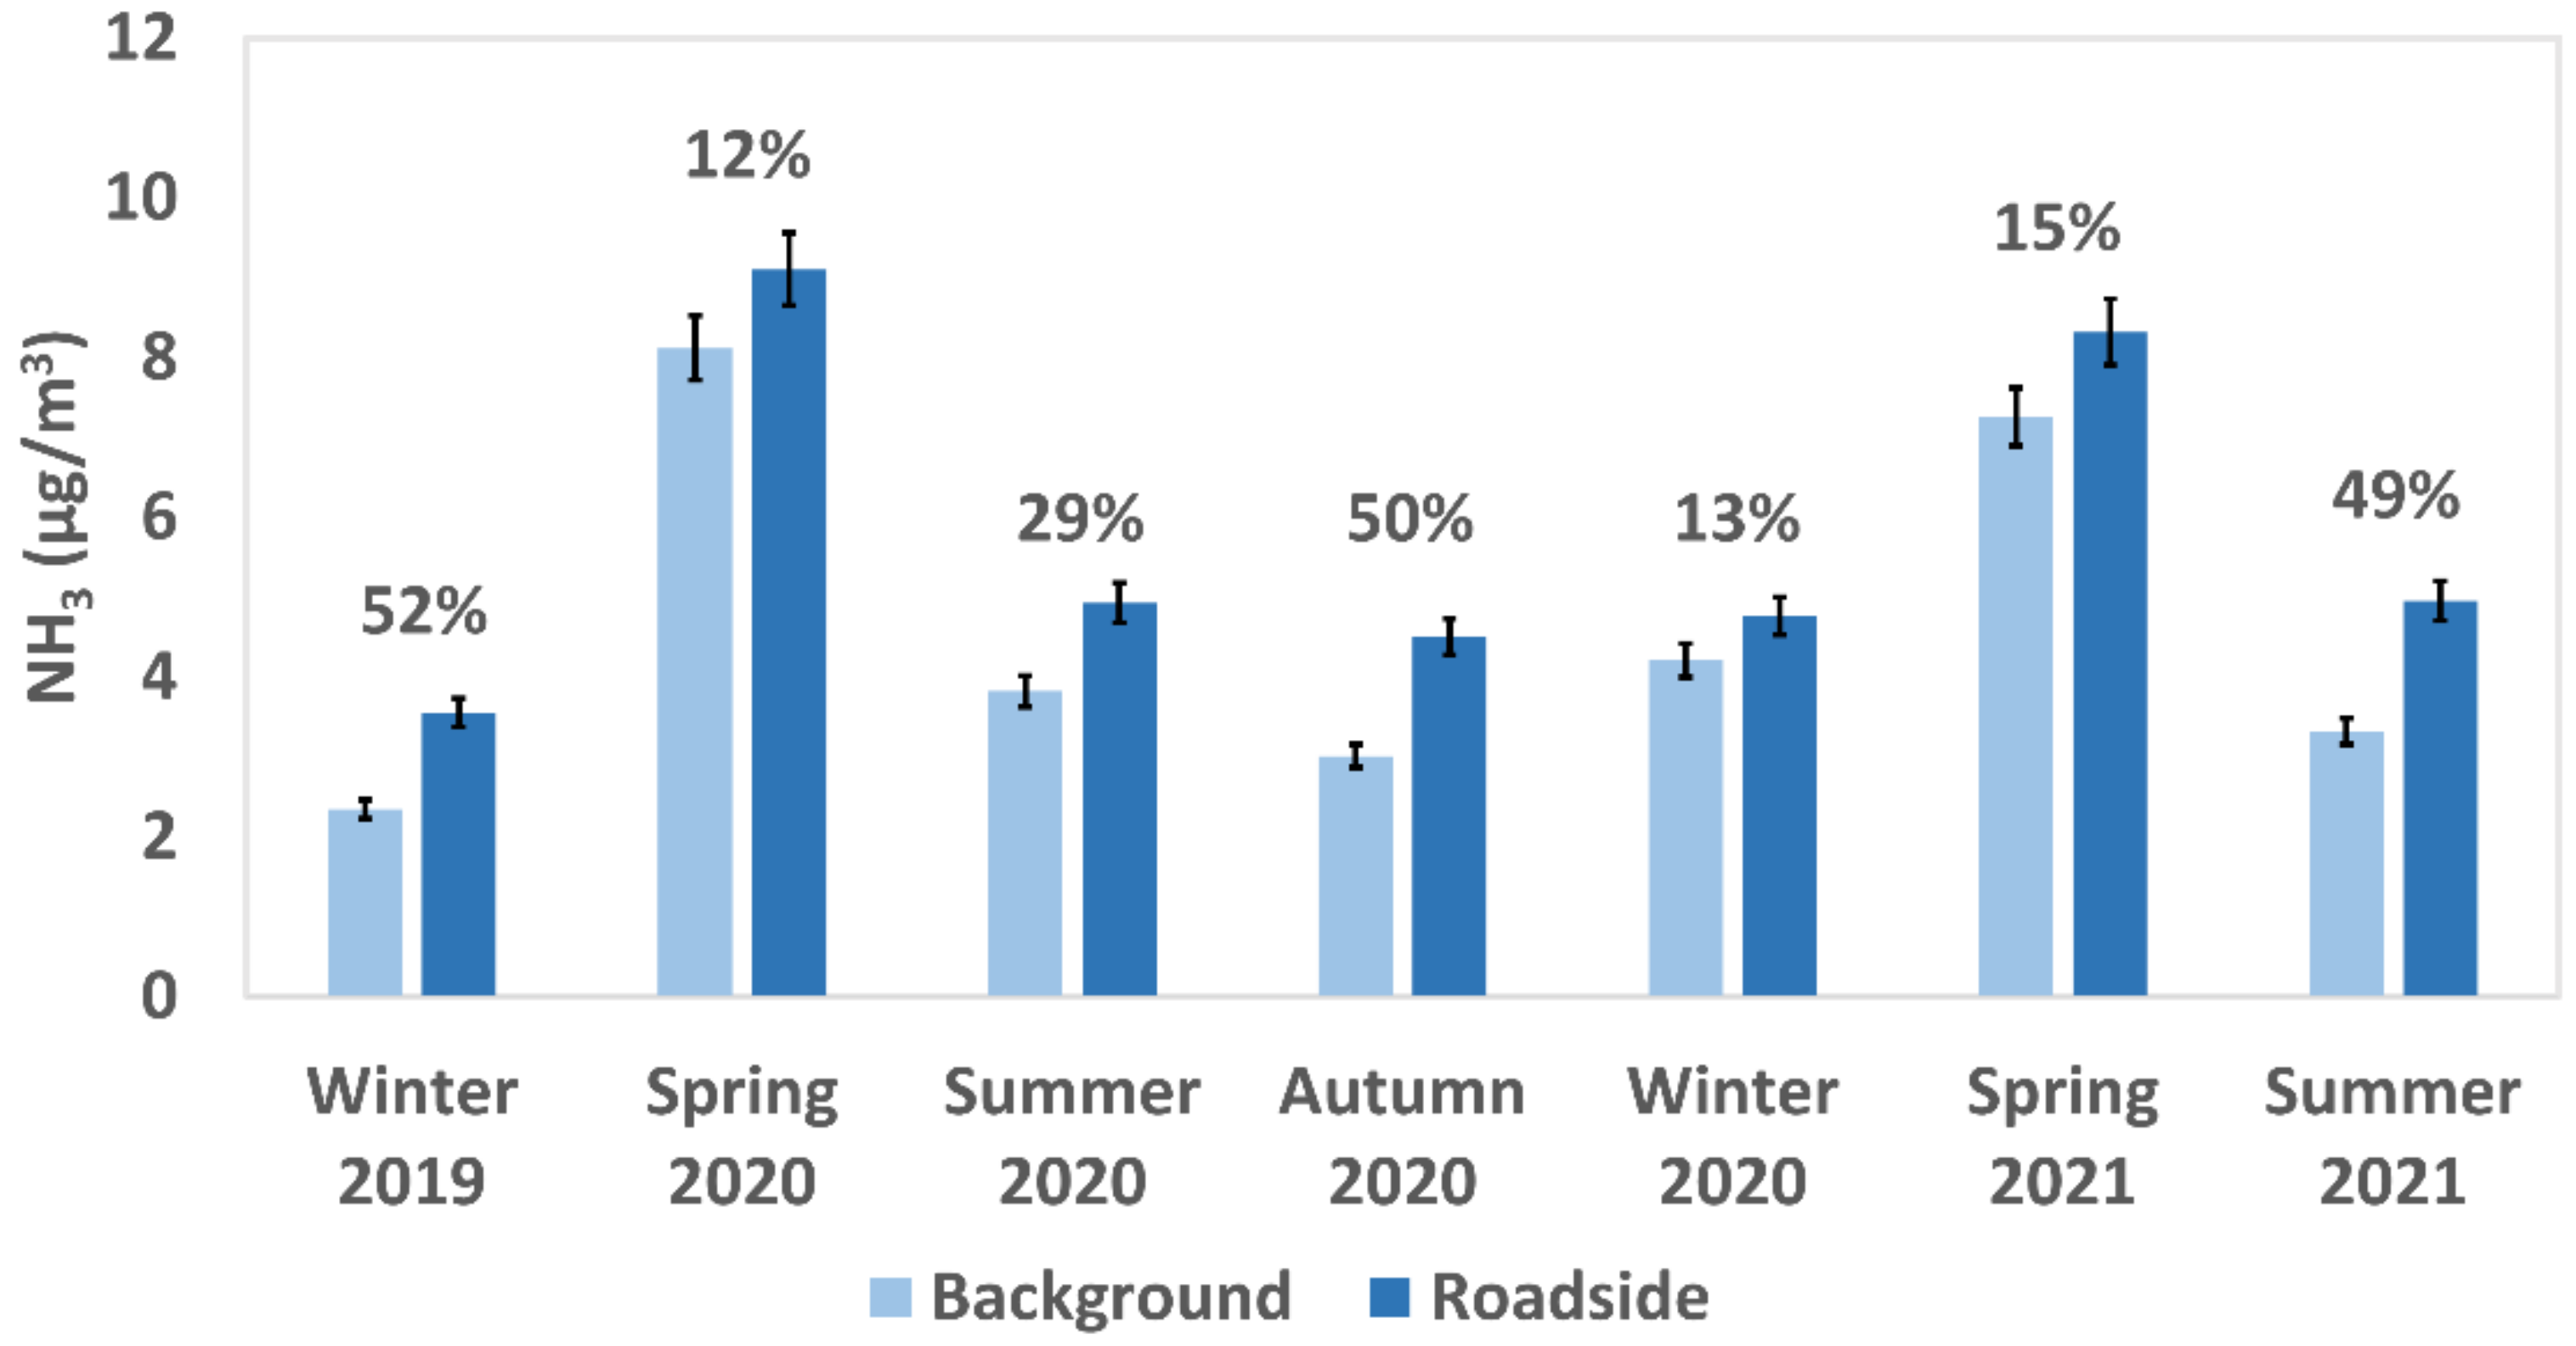
Seasonal ammonia concentrations varied between 2.3 µg/m3 (Winter 2019) and 8.1 µg/m3 (Spring 2020) for the background site and between 3.6 µg/m3 (Winter 2019) and 9.1 µg/m3 (Spring 2020) for the roadside site, as presented in Figure 7. Both sites indicated a marked seasonal variation, like previously observed in the historical background data, with significantly higher levels during the spring. The seasonal averages for the roadside site were always higher than for the background site, but not significantly for all seasons. This difference in levels between the two sites is more precise in the following section.
3.3. Traffic Influence: Background and Roadside Sites Comparison
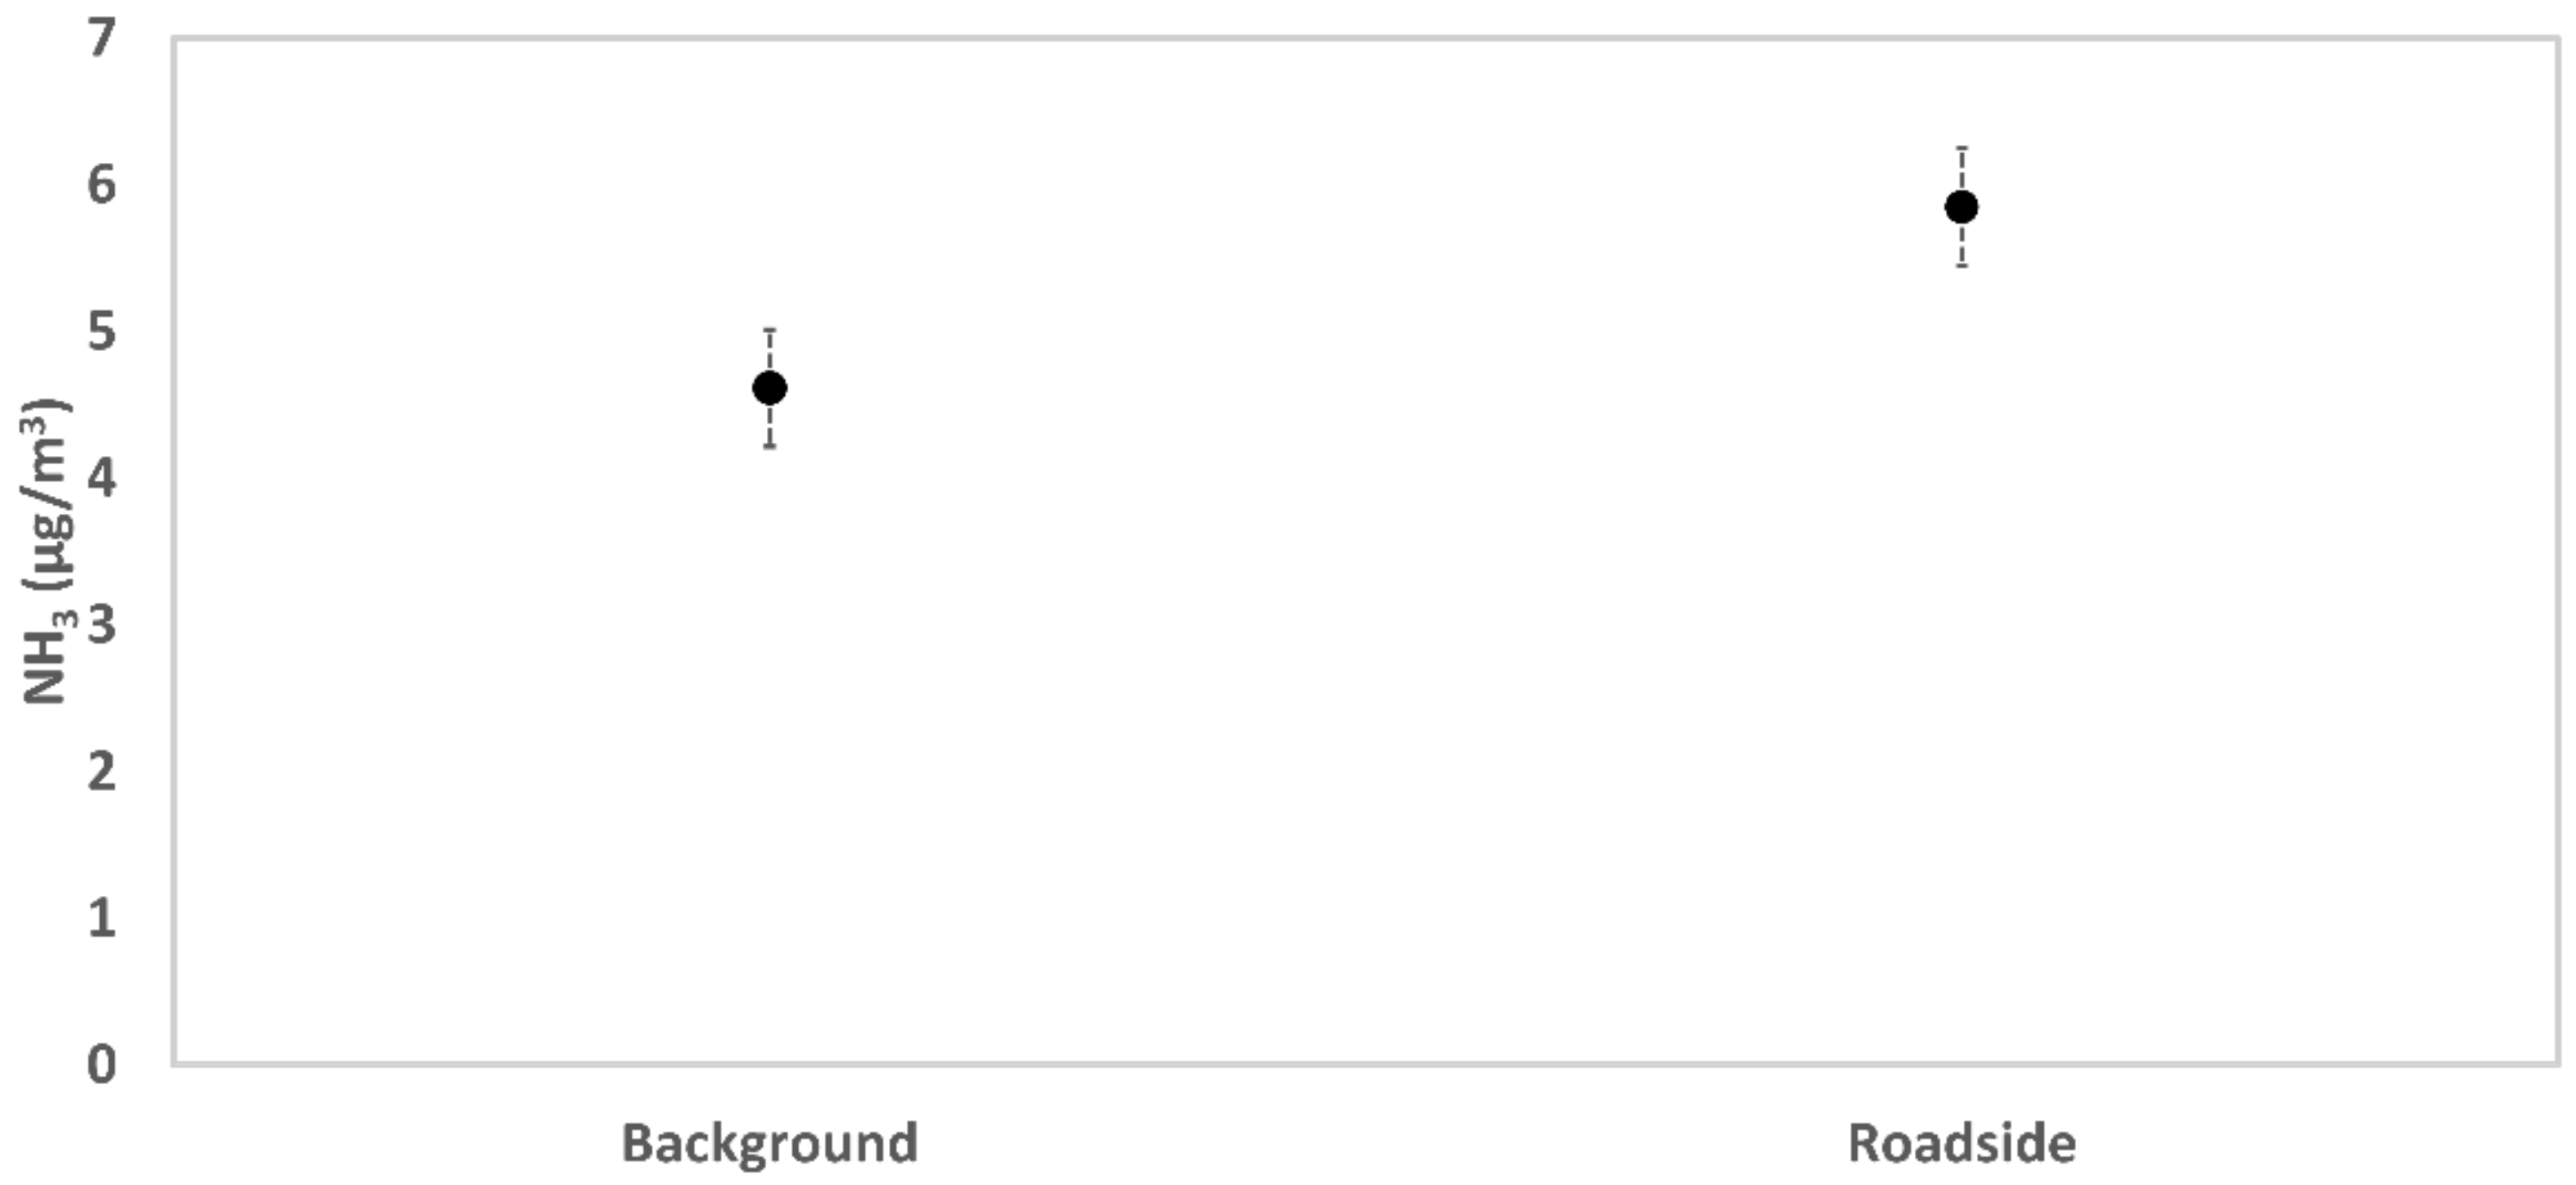
Figure 8 presents the comparison of the hourly ammonia averages during the measurement campaign. The roadside site was associated with a significantly higher average compared to the background site, as observed in the seasonal data. The averages were equal to 4.5 and 5.8 µg/m3 at the background site and at the roadside site, respectively. The difference between the two sites was less marked over the entire measurement period compared to some of the seasonal concentrations previously studied. This was due to the smoothing generated by averaging over a long period and the seasonal variabilities of ammonia sources and meteorological conditions.
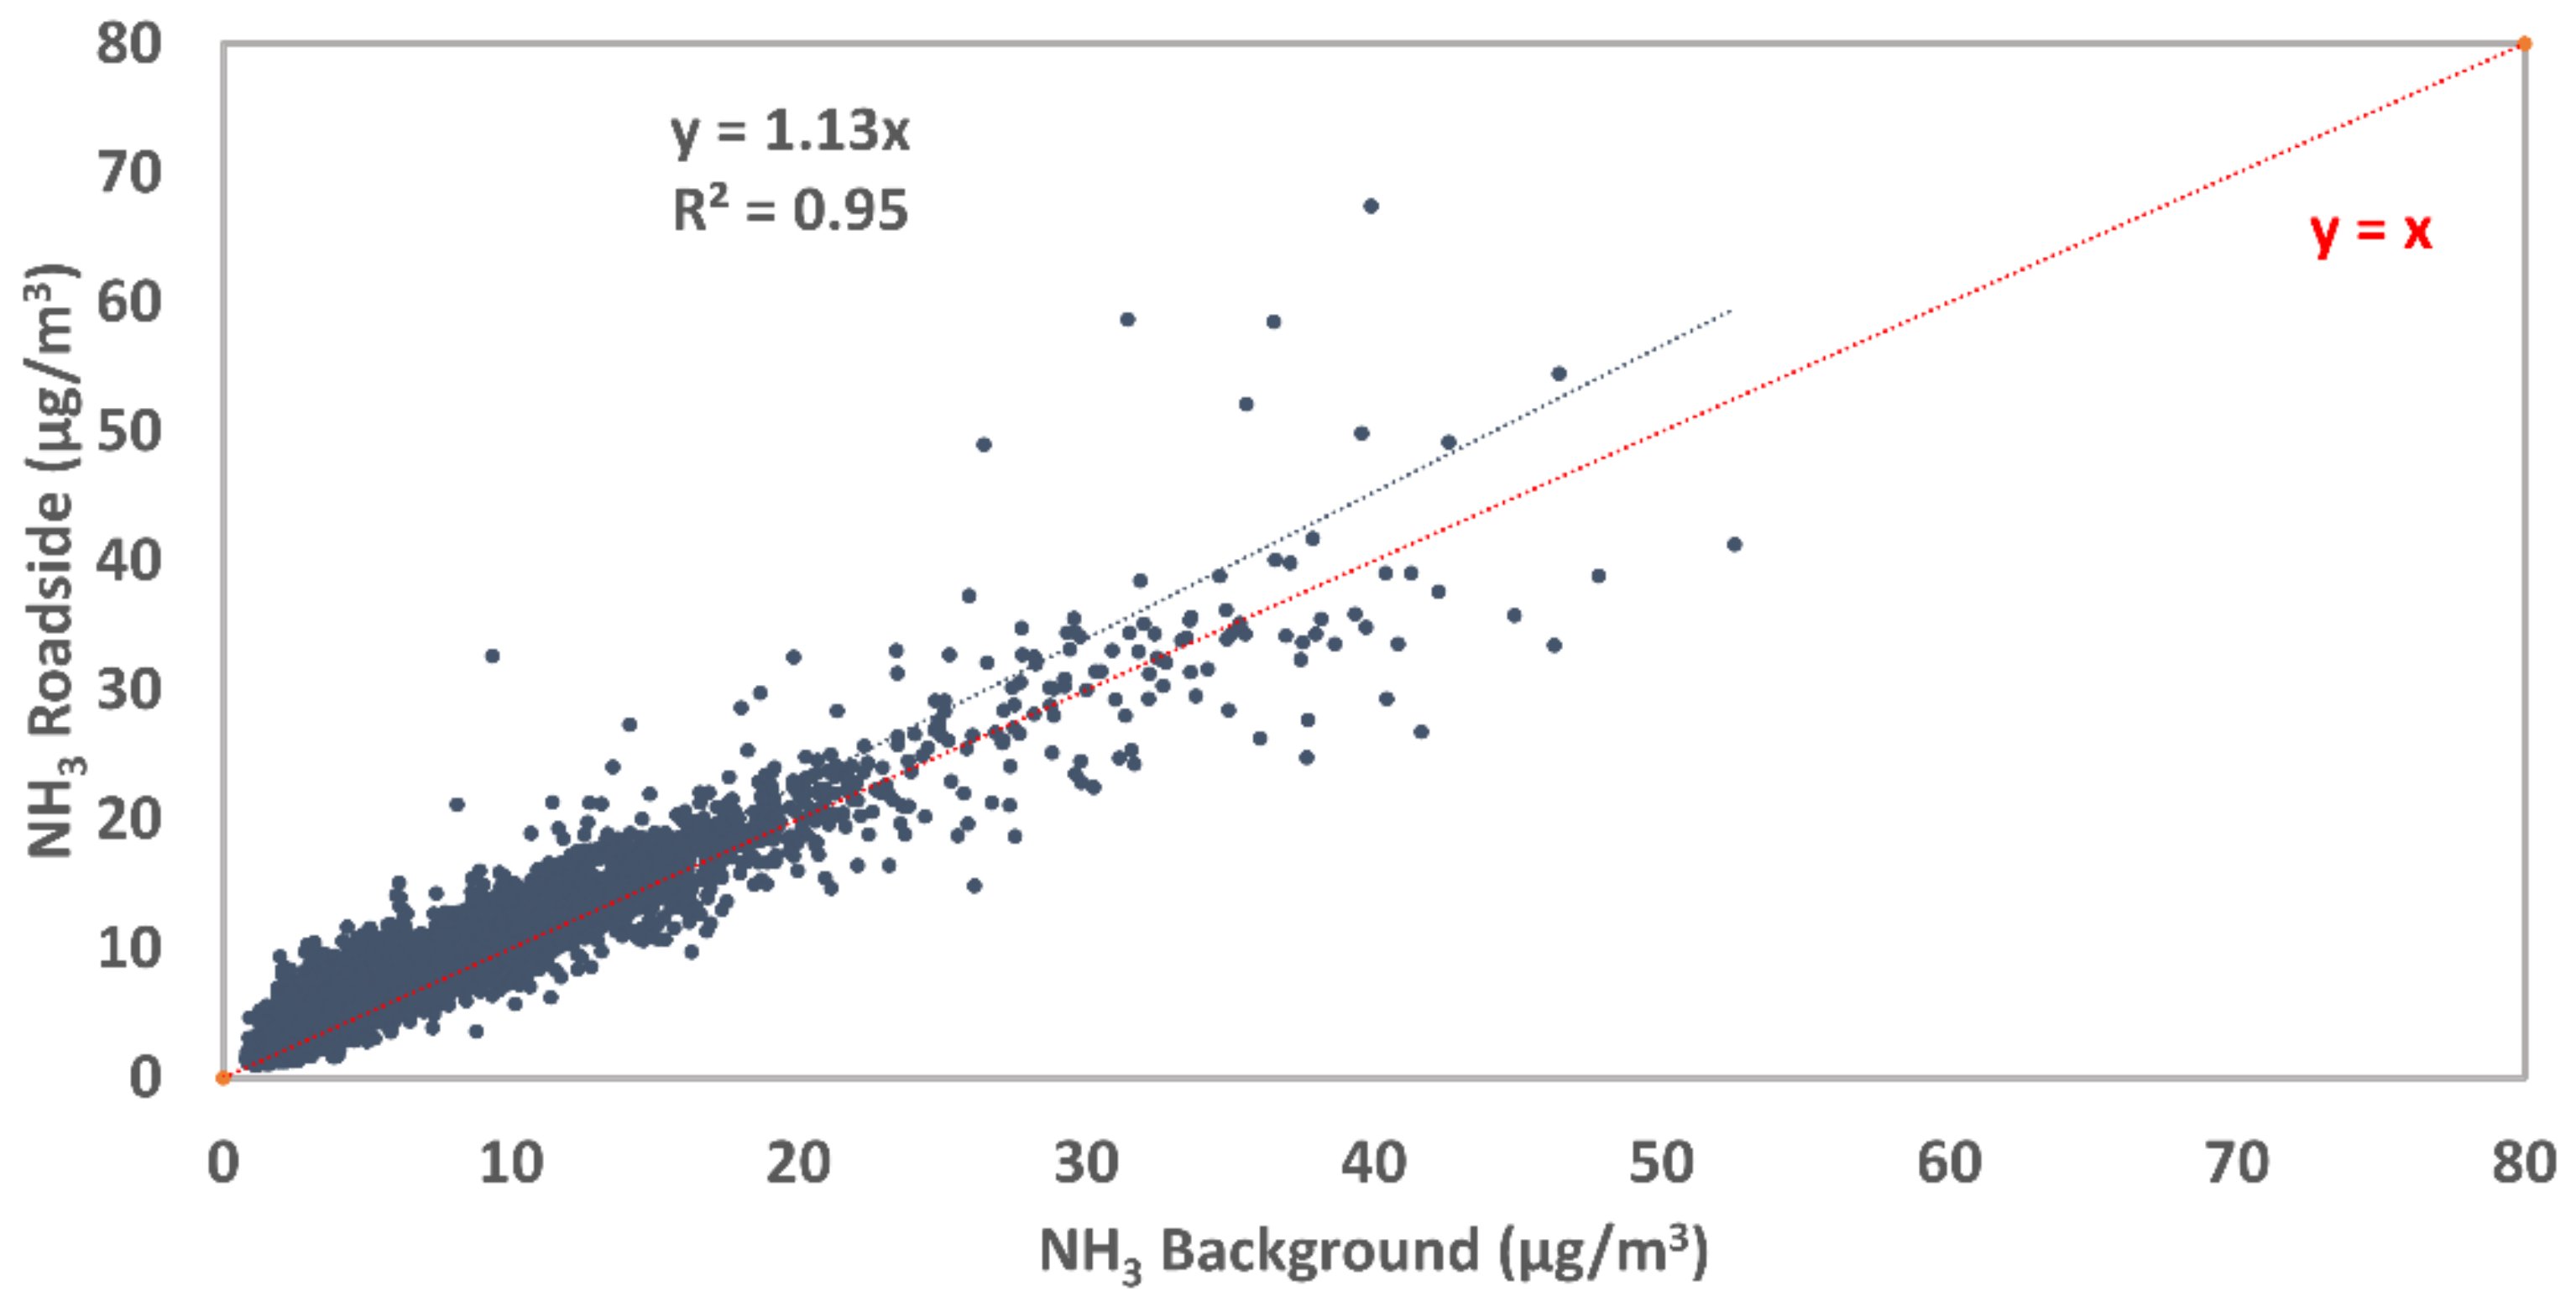
The correlation between the two sites is presented in Figure 9. Hourly ammonia averages indicated a strong correlation between both sites, with a Pearson correlation coefficient equal to 0.95. The slope value of 1.13 indicated 13% higher levels at the roadside site compared to the background site over the measurement campaign, which is consistent with the comparison of the measurement campaign averages. Seasonal variations of this correlation, presented in Table 2, were also observed with better correlation in spring and in the 2020 winter with a slope near 1.00 compared to other seasons which were weaker correlated and indicated a higher difference between the two sites.
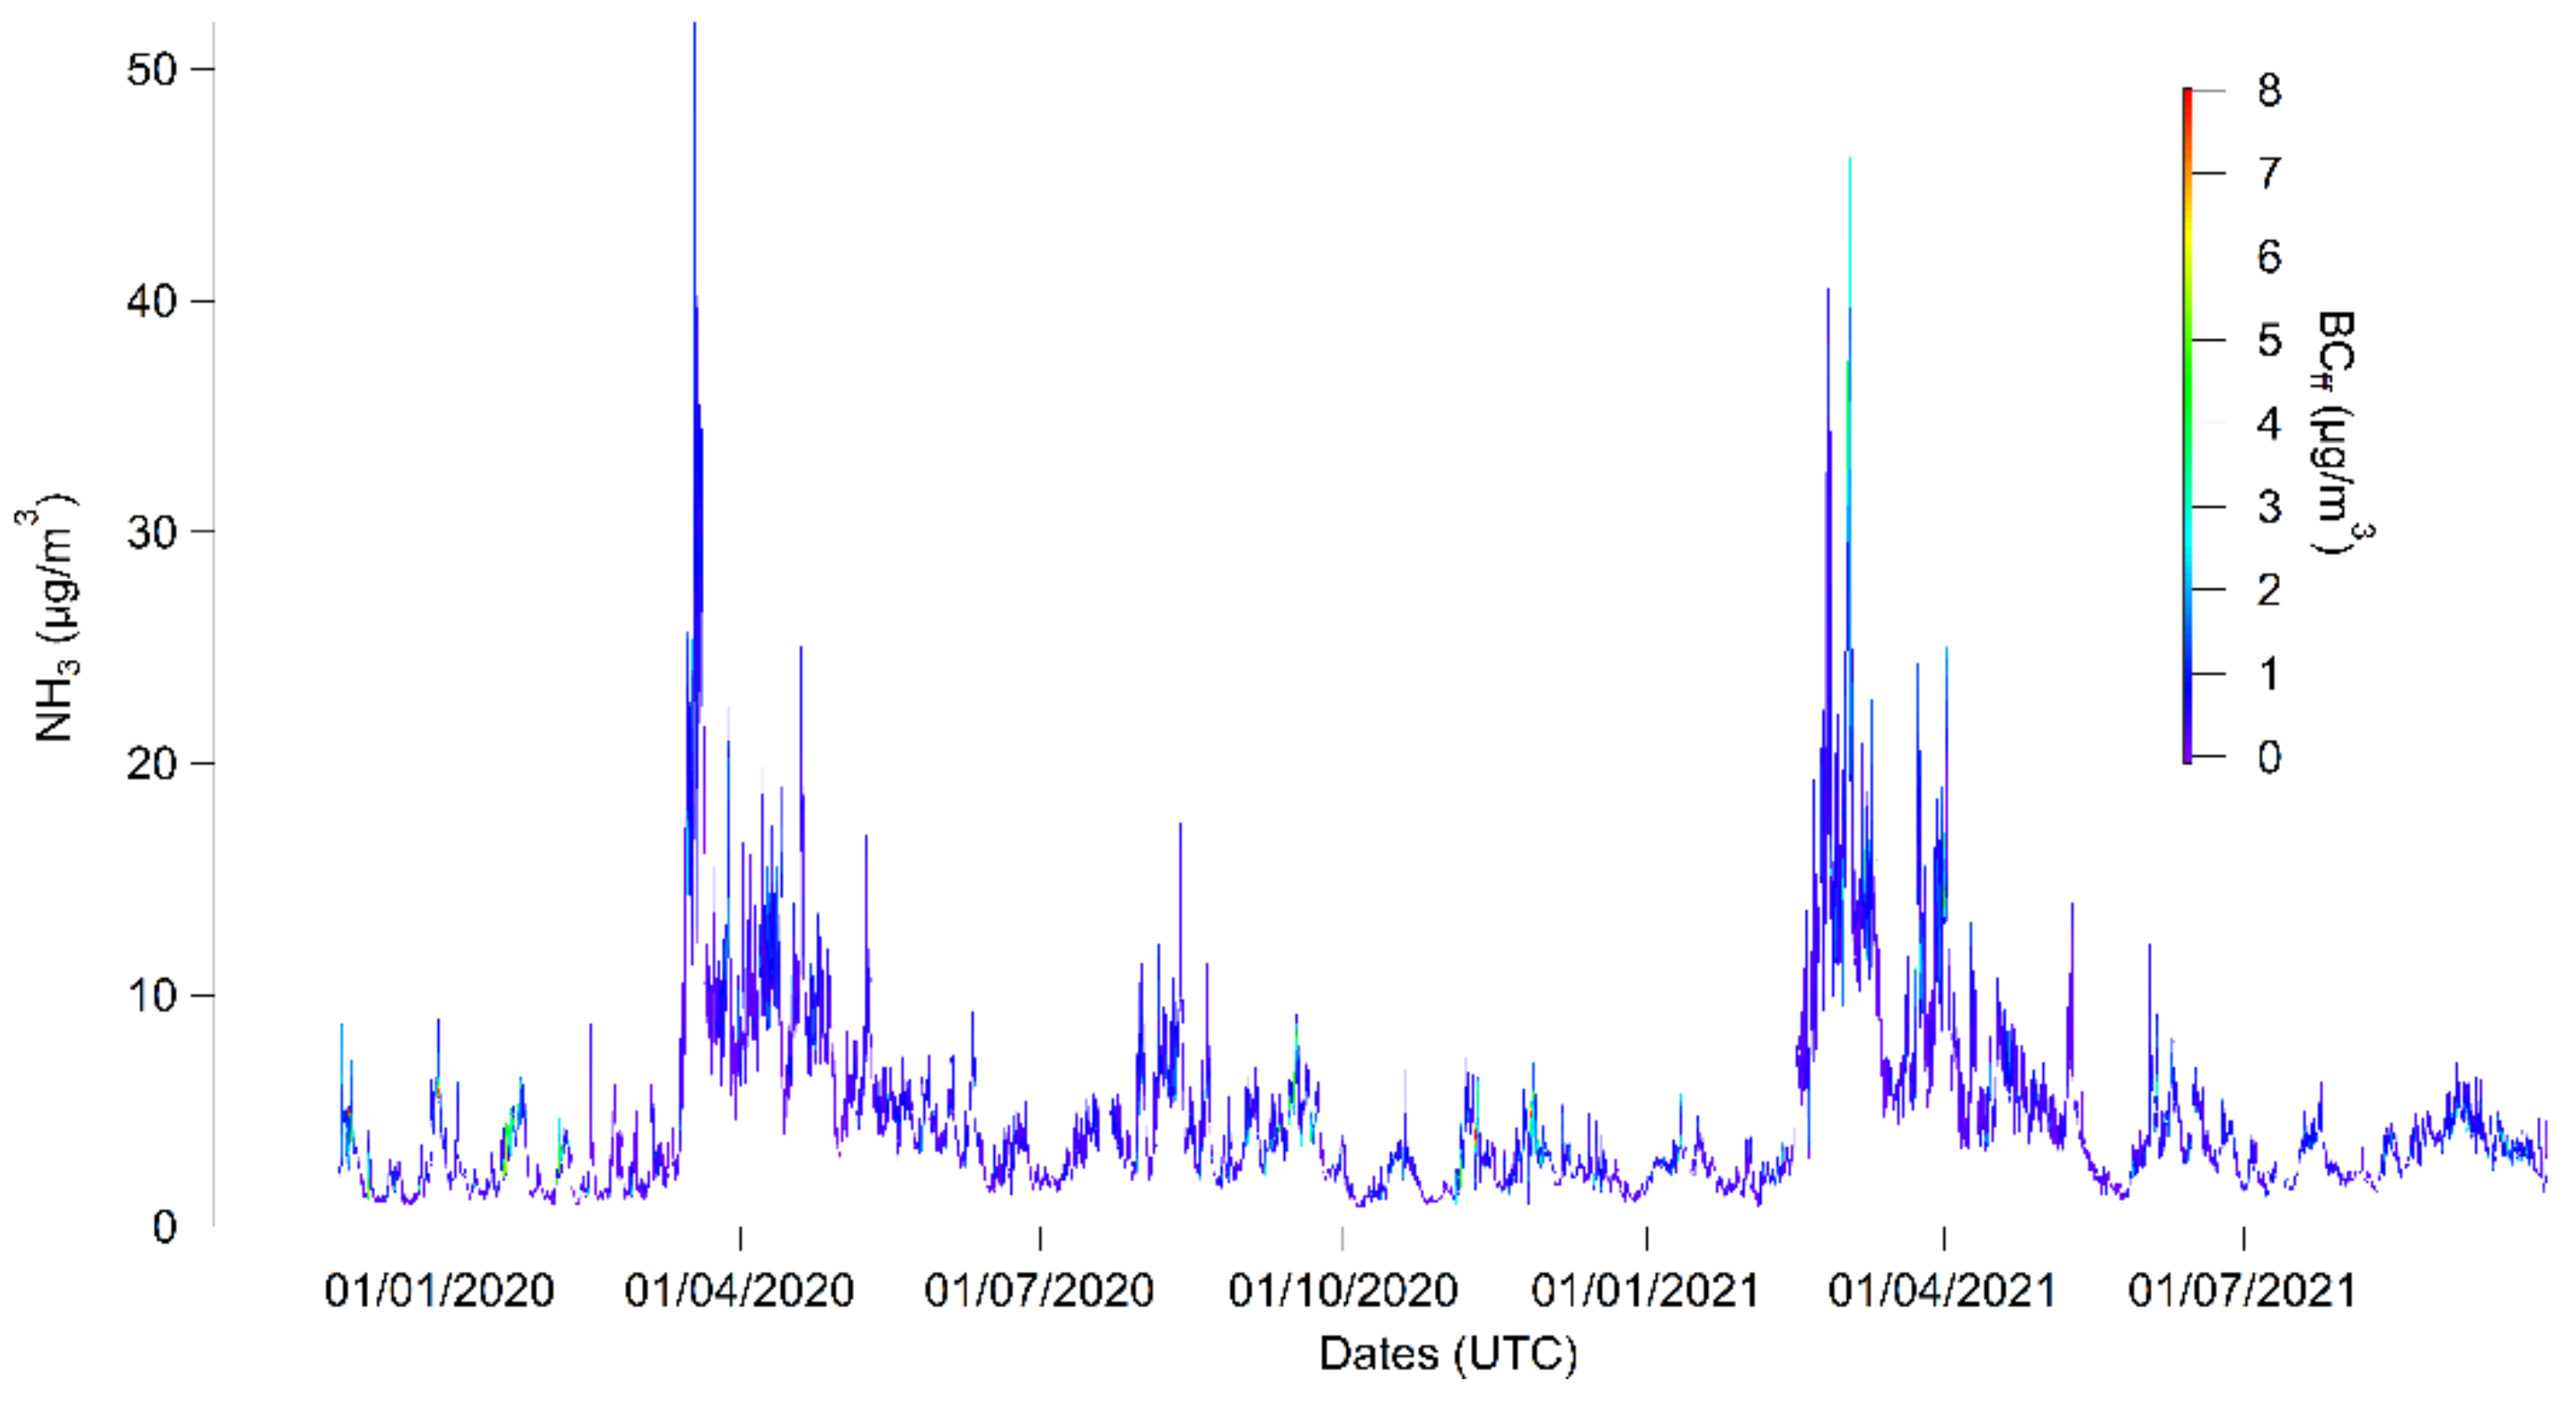
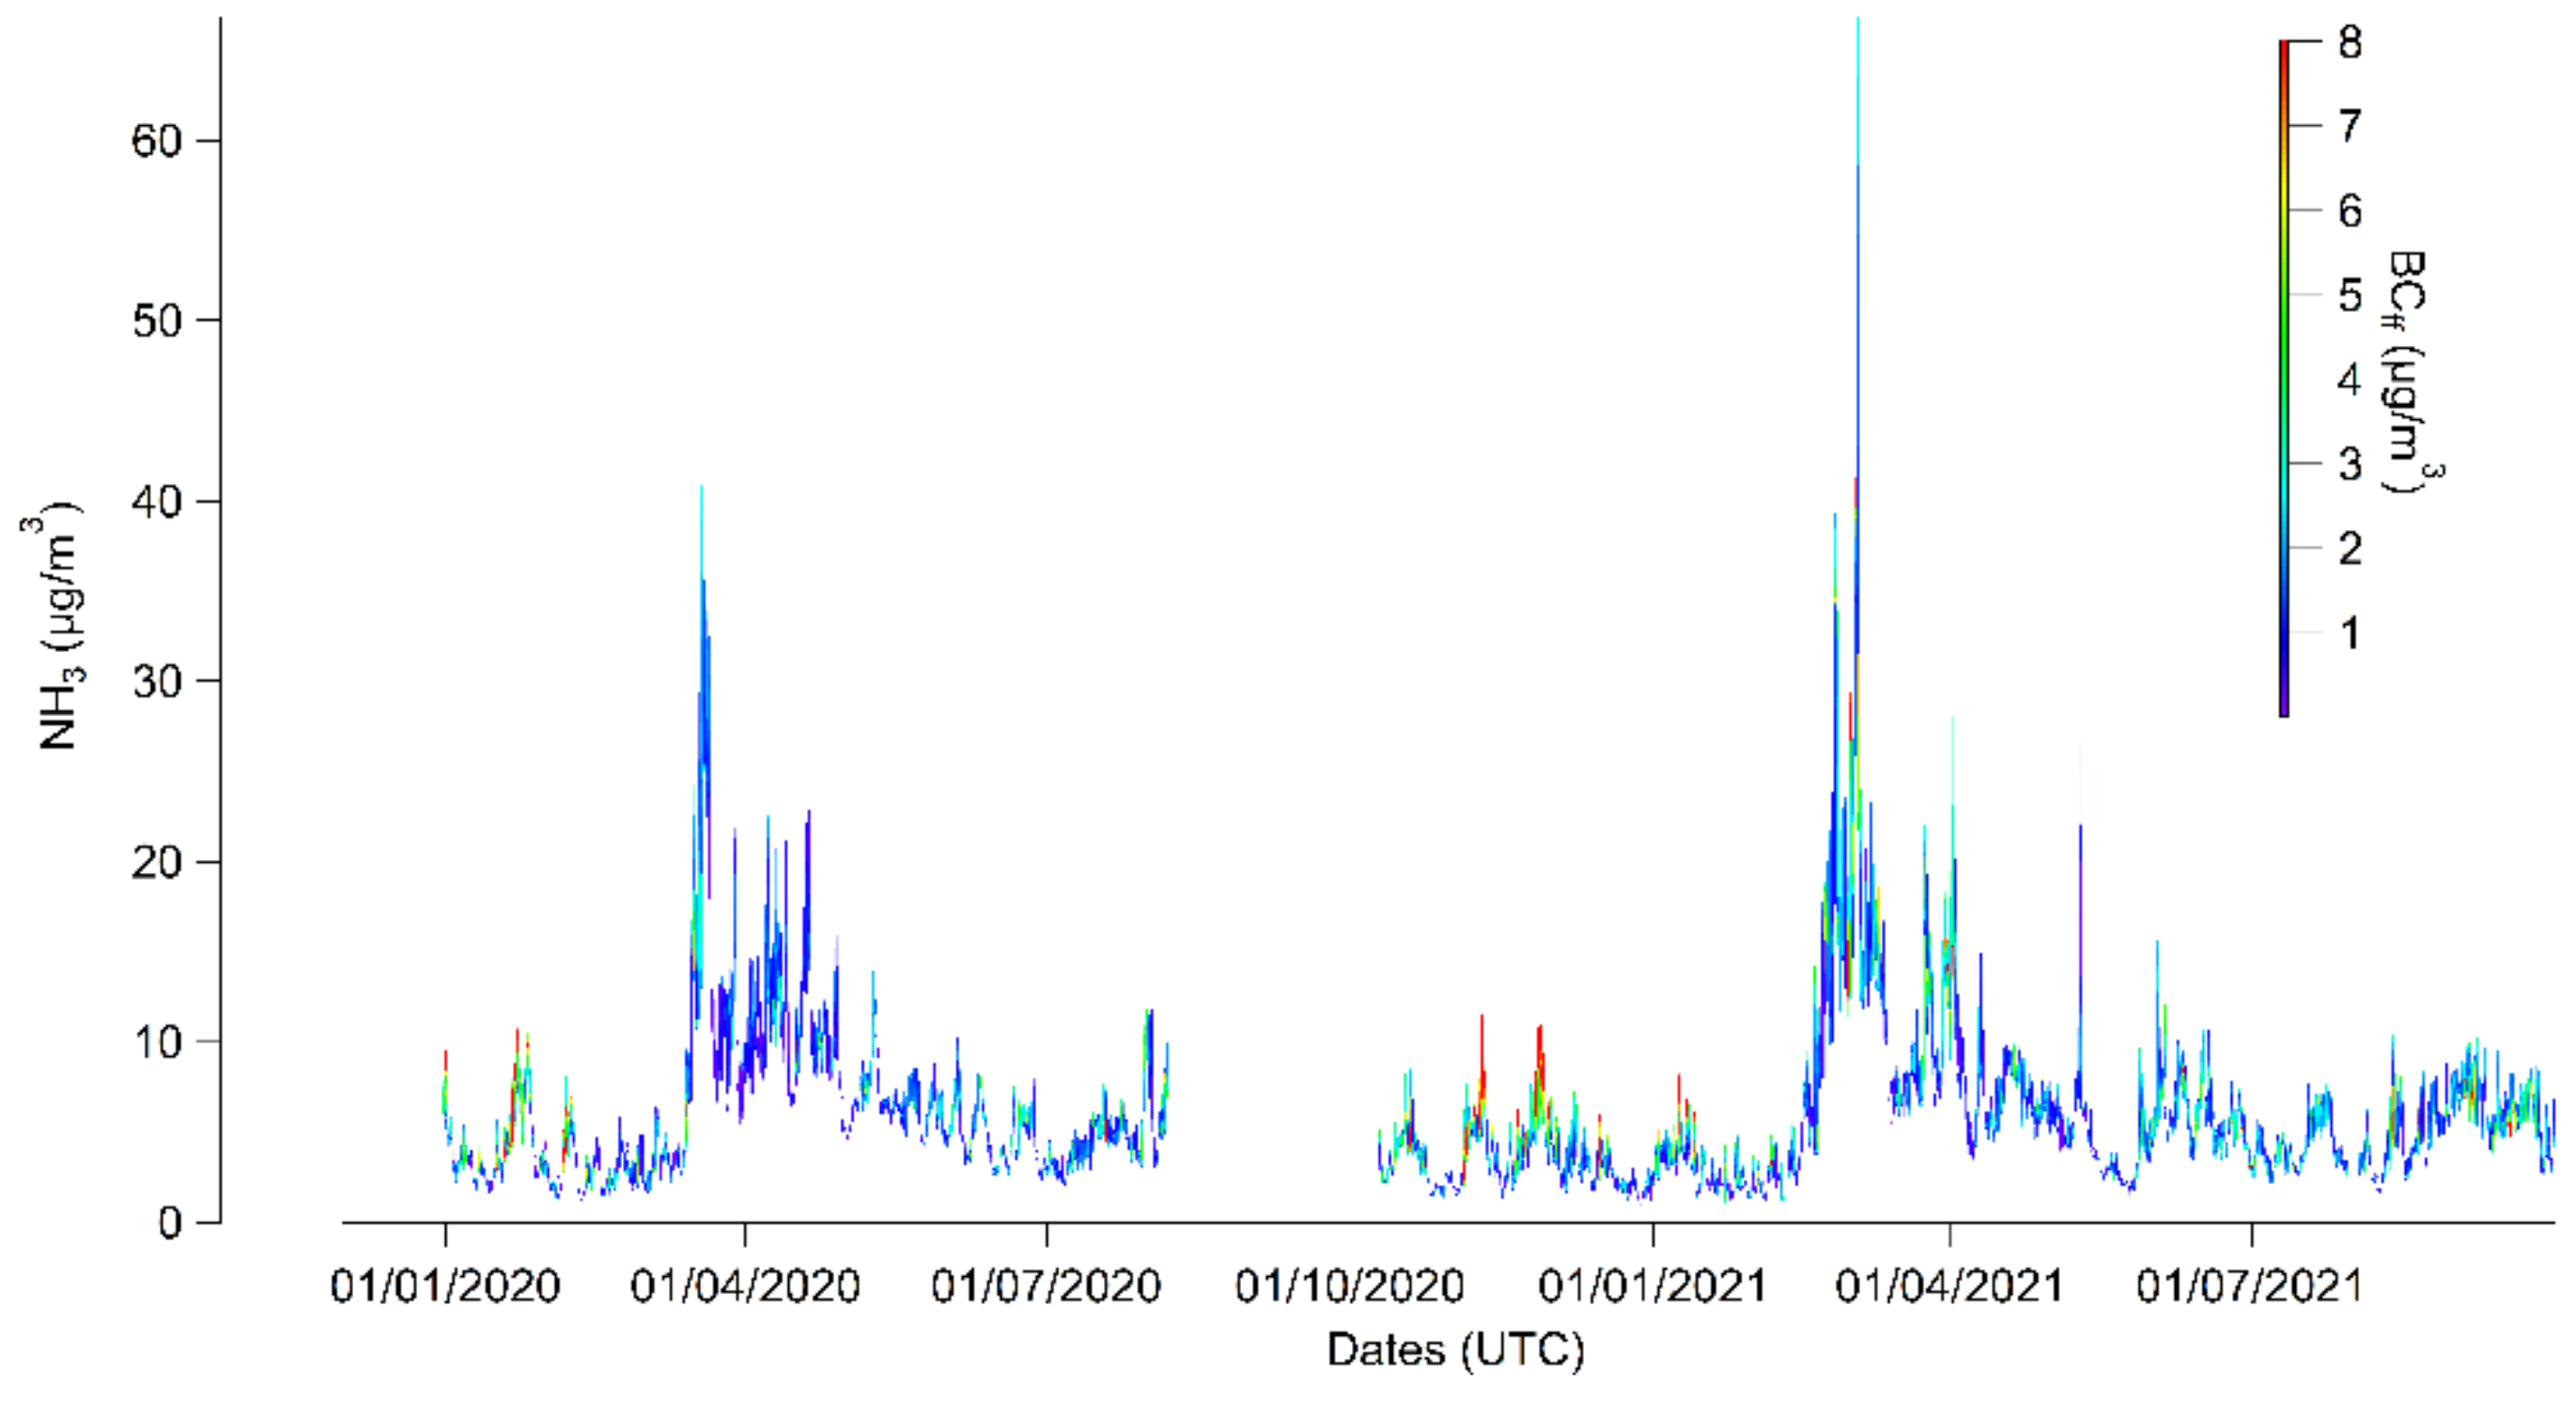
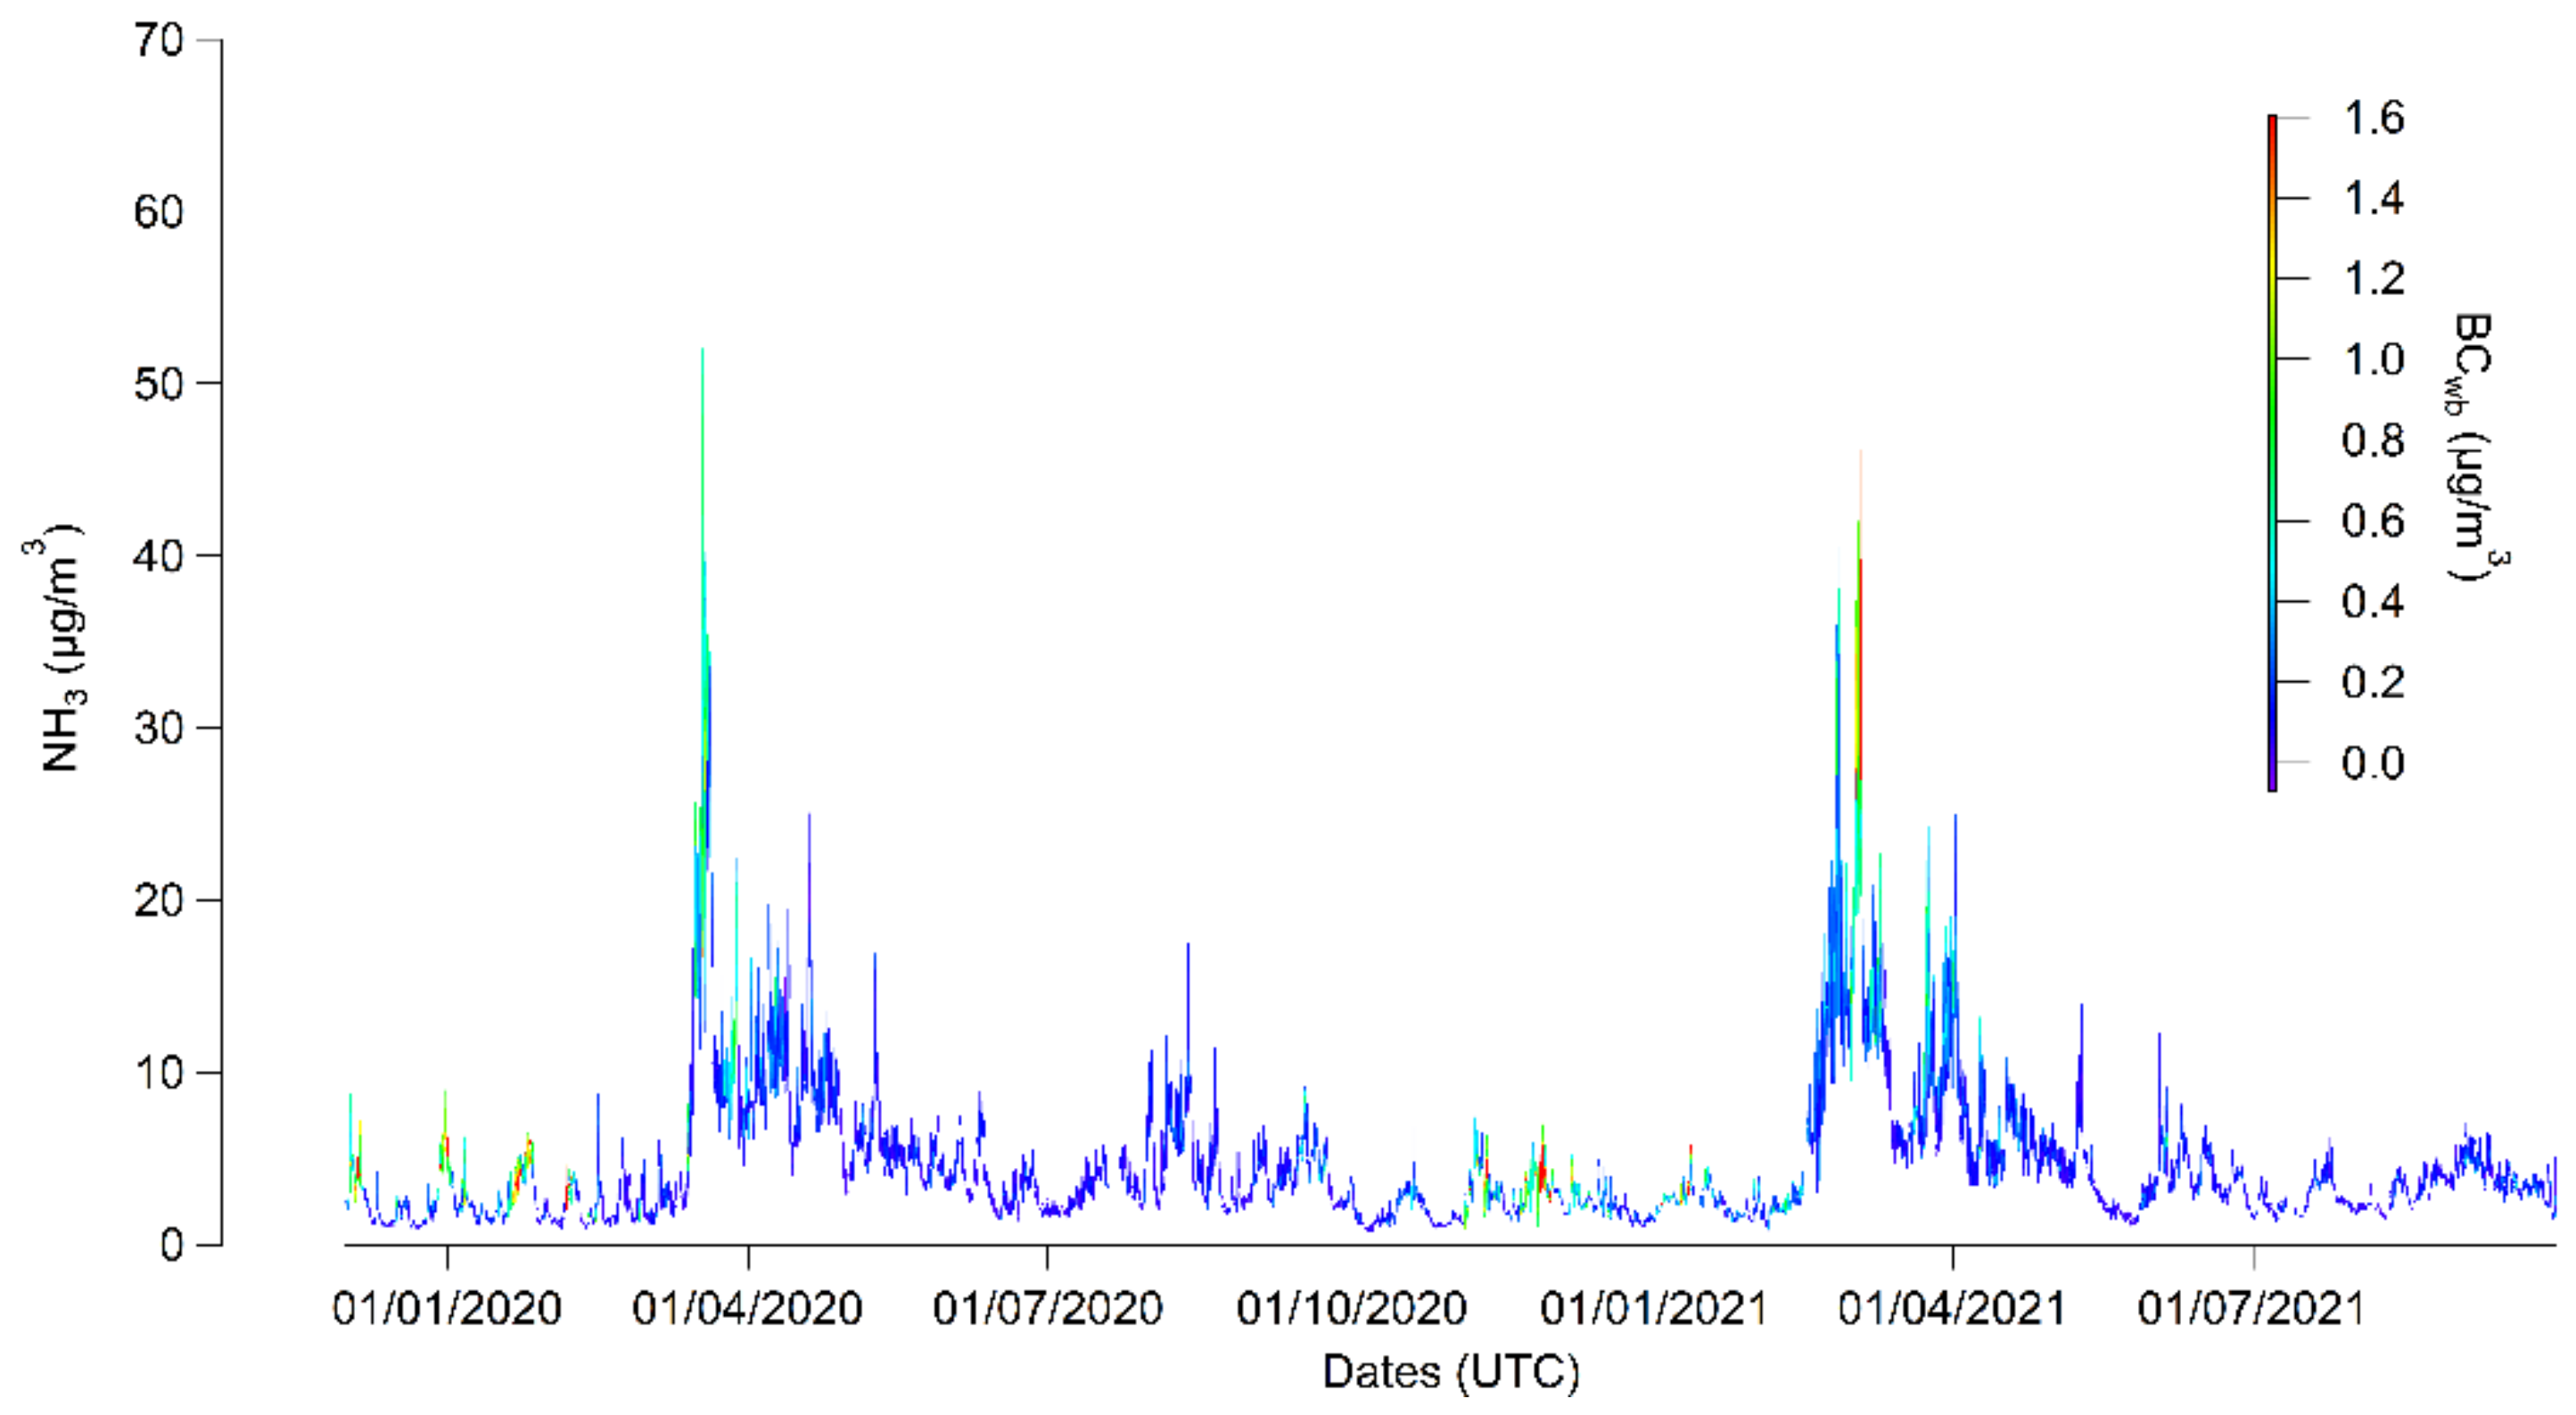
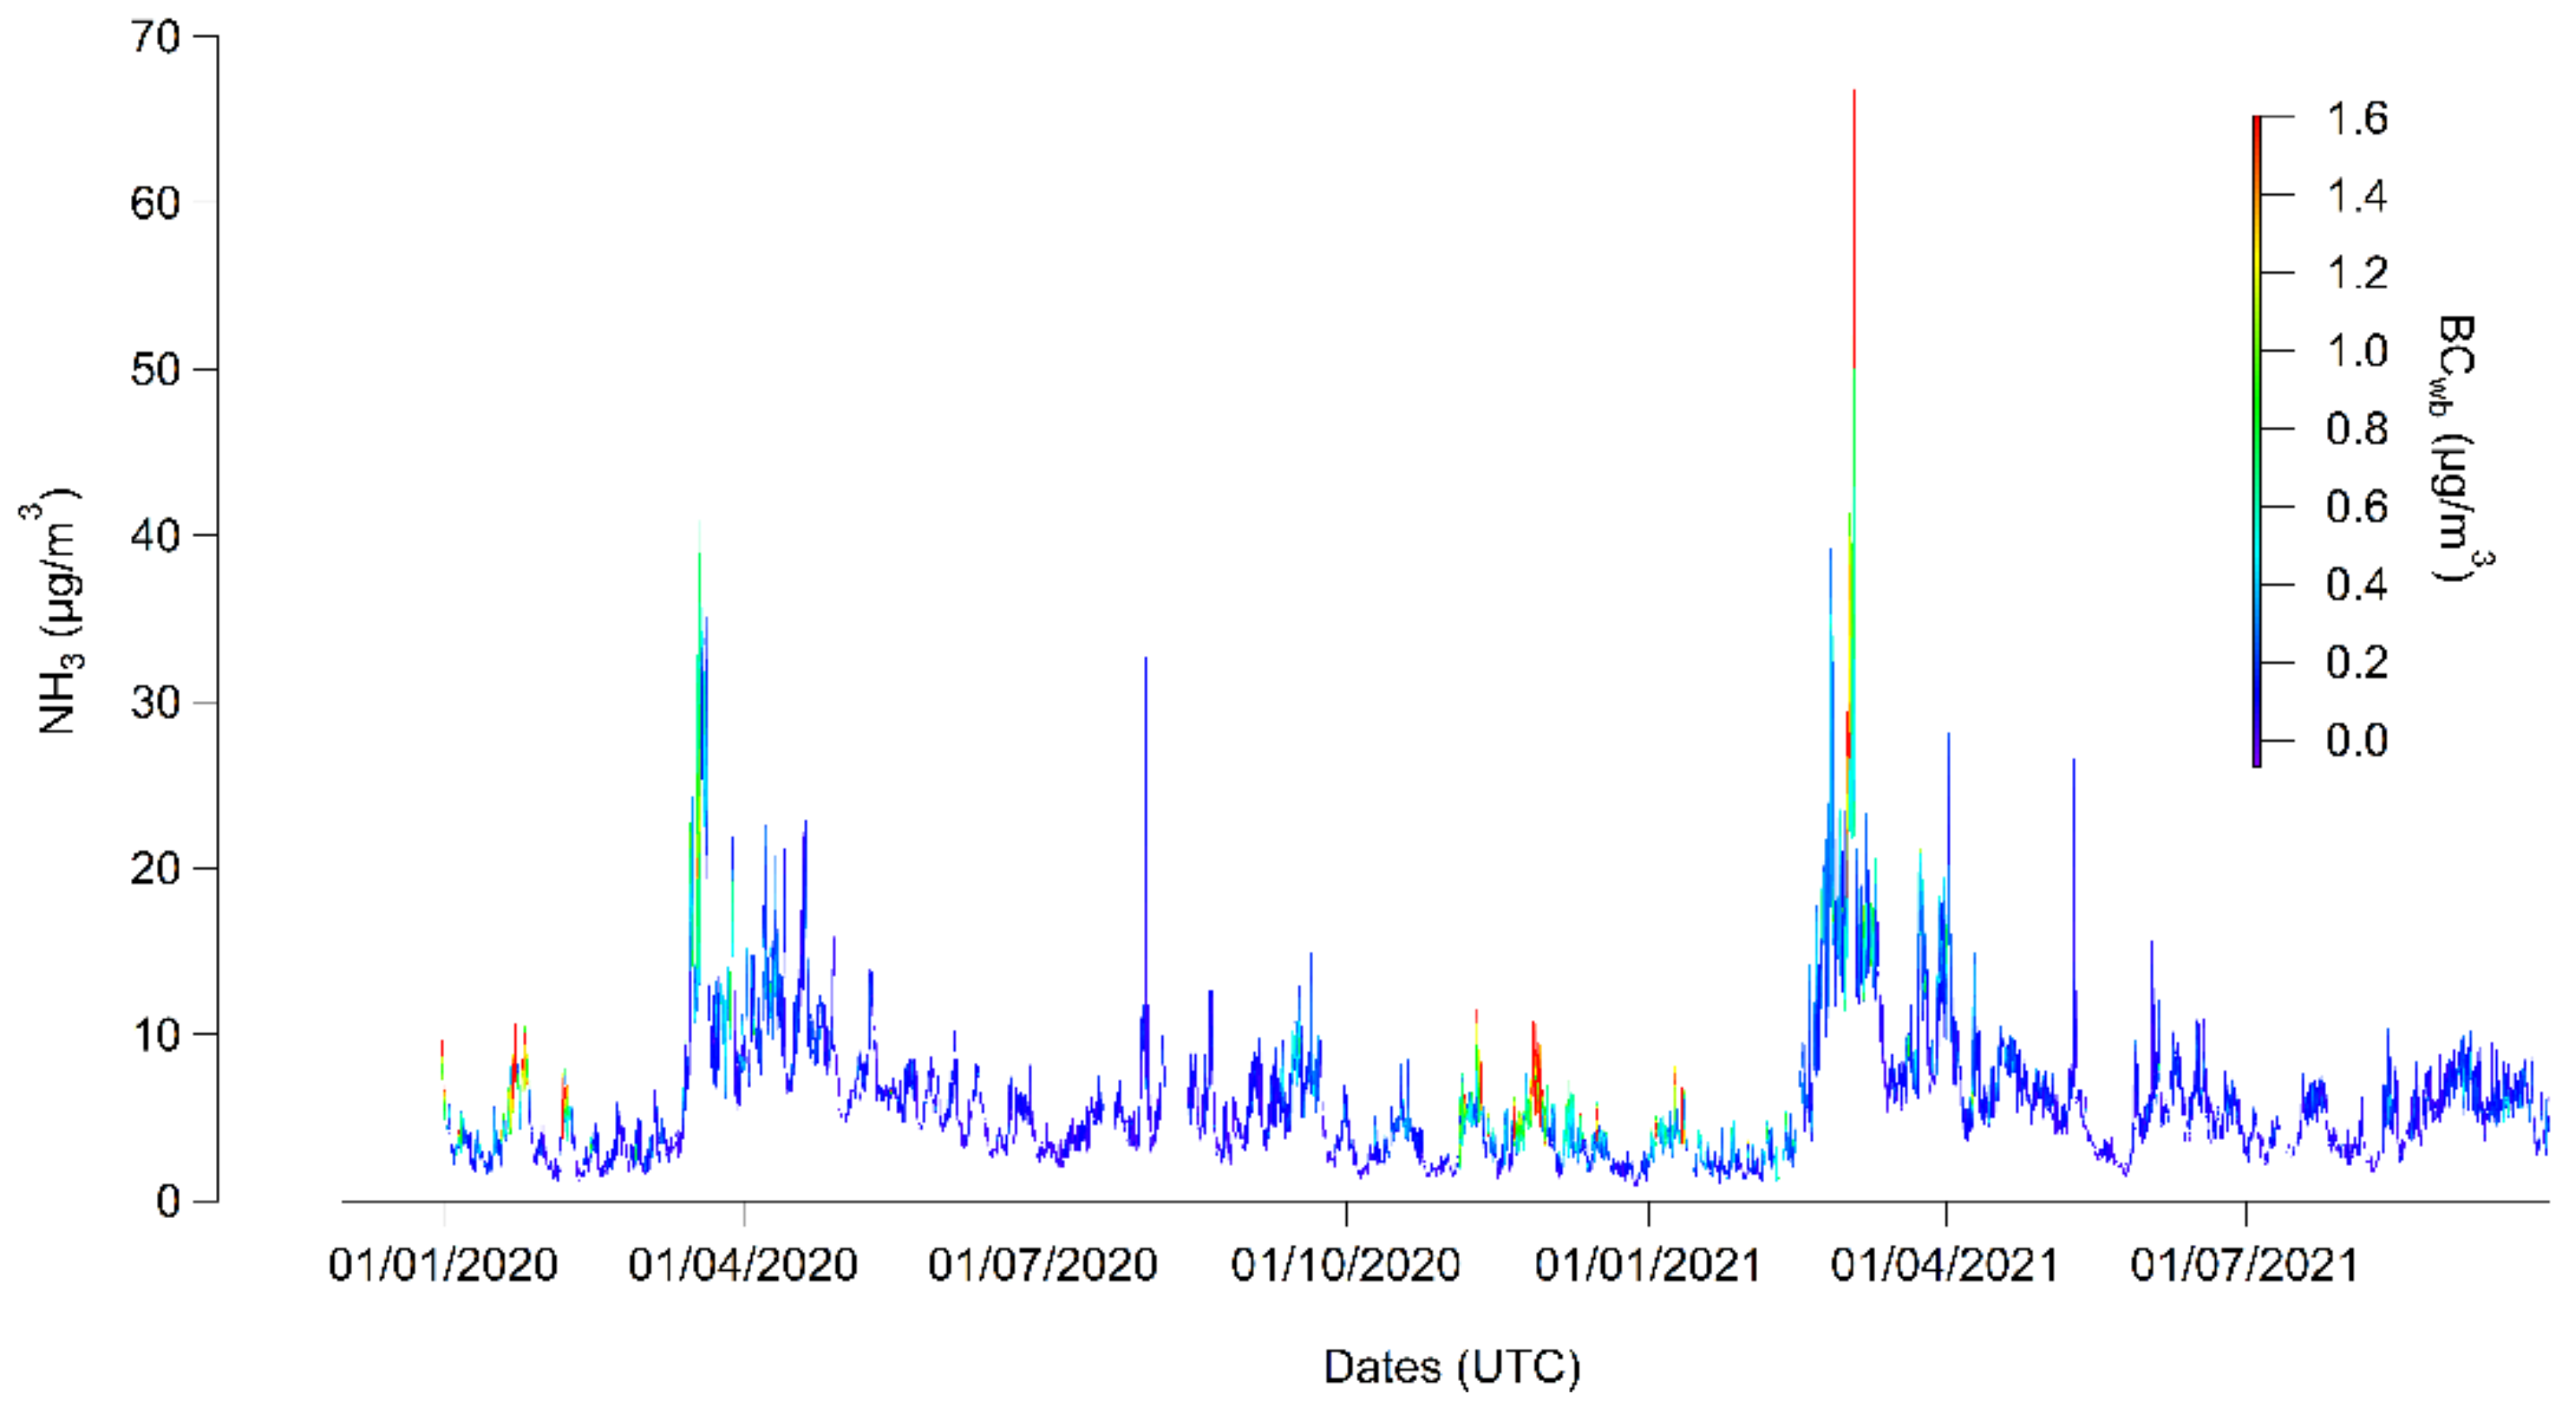
The temporal variations of ammonia concentrations as a function of Black Carbon from fossil fuel combustion (BCff) concentration are presented in Figure 10 for the background site and in Figure 11 for the roadside site. Over the entire measurement campaign, the increases in ammonia concentrations were not associated with increases in BCff at the background site, whereas at the roadside site, the maximum ammonia concentrations were associated with high BCff levels, except during the spring periods.
4. Discussion
4.1. Variations of Ammonia Concentrations
The annual ammonia averages at the background site and the average concentrations measured during the campaign at the two studied urban sites are like the levels usually found in the literature for urban sites (1–10 µg/m3) [23,24,25,26,27], particularly levels found in other French studies [28,29,30]. These levels are two to three times higher than the ubiquitous concentrations (0.4–2.1 µg/m3) [31,32,33] or the “clean” sites defined as sites far from known sources (below 1 µg/m3) [24,29], confirming the influence of ammonia sources in urban areas. However, the measured levels are 10 to 100 times lower than the concentrations under the direct influence of agriculture (livestock farming, land application) which can reach 100 to 1000 µg/m3. The different measurement methods used in the literature make the comparison difficult and may be part of the explanation for the observed differences. Levels measured by different technologies in parallel can vary up to twofold as highlighted by the comparison results of Twigg et al. [4]. These comparison results indicate correlation slopes between 0.74 and 1.47 for ammonia levels below 10 ppb and slopes between 0.64 and 1.37 for ammonia levels up to 100 ppb [4]. The observations of this paper are therefore consistent with the usual concentration gradients according to the type of site: rural under agricultural influence > urban > clean/remote [24,25]. The urban concentrations are more than four times higher compared to the annual limit for the protection of sensitive vegetation defined as 1 µg/m3 and higher compared to the annual limit for the protection of total vegetation (3 µg/m3), illustrating another environmental issue [34]. The measured ammonia levels confirm the influence of different ammonia sources, even in urban areas. The lack of decrease in observed concentrations over the last 6 years at the urban site highlights the importance of monitoring ammonia in ambient air.
On a regional scale, the agglomeration of Reims is associated with levels one and a half to two times higher than the other urban background sites [35]. This trend can be explained by the importance of agriculture on the scale of the Reims environment. The hourly averages measured during the measurement campaign indicate marked temporal variations with hourly peaks that can exceed 50 µg/m3 and 60 µg/m3 in spring at the background site and at the roadside site, respectively. The seasonal variability, with a maximum during spring, is different from that observed in most sites in the literature with higher levels during summer, in connection with the volatilization of ammonia favored by higher temperatures [24,27,29]. However, in this study, the seasonal ammonia concentrations vary differently compared to the temperature variations, confirming the important influence of agricultural emissions during spring. These observations are consistent with the agricultural sector variations because this activity is more important during spring (spreading particularly [36,37]), for the major crops of the department: vines and cereals (wheat in particular [38]), compared to the summer period. Furthermore, the similar seasonality between the two urban sites in Reims no matter the local influence confirms the impact of a larger source in terms of emissions, which is also observed in other studies [29,39].
4.2. Traffic Influence
The average ammonia concentrations measured at the roadside site range from about 3 to 10 µg/m3 and are therefore higher than at the “clean” or uninfluenced sites as previously discussed. However, these levels remain low for a site under traffic influence compared to available data in the literature, where the roadside site is associated with levels up to five times higher than the background site [40]. This difference may be associated with the distance to the road, as presented by Cape et al. [41] and Rose [42], ammonia concentrations decrease rapidly with increasing distance from the road. A 90% decrease in ammonia concentrations is observed at a 10 m distance from the road [41]. The type of vehicle fleet also has a direct influence on the measured concentrations in urban areas, as presented by Elser et al. [9]. As previously discussed, the multiple measurement methods used in the literature make comparisons of ammonia levels difficult.
Road traffic is responsible for ammonia emissions in urban areas, particularly near a road axis. Emission inventories highlight this source of ammonia, although the inclusion of current emissions is not always optimal, and an underestimation of vehicular ammonia emissions has already been observed [9,10,43]. In this study, the levels measured at the roadside site remain low compared to other similar sites but are significantly higher than those measured at background sites. The influence of road traffic is highlighted by the increase of ammonia concentrations in parallel with the BCff concentrations—mainly a tracer of road traffic—only at the traffic site and not at the background site as presented in Figure 10 and Figure 11. This trend does not appear in the spring period, which confirms the dominance of the agricultural influence over the road traffic one at the agglomeration scale. The influence of lockdown periods during the campaign including the spring period could also explain this observation, as discussed further. These similar variations between ammonia and road traffic tracers (NOx, CO) have already been highlighted in the literature [10,40,41,44]. The lack of seasonal variability between summer, autumn, and winter may also indicate the influence of road traffic on ammonia levels since other major sources of ammonia emissions (agriculture, biomass burning) are associated with seasonal variations but not road traffic [11]. The study of correlations indicates correlation coefficients between 0.6 and 0.7 with road traffic tracers (BCff and NOx) mainly in autumn and winter, as displayed in Table 3. These correlations are more important at the roadside site compared to the background site. These periods are associated with more stable atmospheric conditions compared to spring and summer [3,40], which may explain the more visible impact of local road traffic emissions. The seasonality of the correlations between the two sites also highlights the impact of road traffic. The Spring 2020, Winter 2020, and Spring 2021 periods were associated with the strongest correlations and the closest ammonia concentrations between the two sites compared to the other seasons. These seasons were impacted by periods of lockdown and massive teleworking in connection with the COVID-19 pandemic, leading to a decrease in road traffic with the highest impact during Spring 2020 (up to −70% decrease in road traffic over this season at the regional scale [45]). A decrease in pollutants emitted by road traffic as NOx has been observed on a regional and European scale [46,47], which could highlight that the road traffic influence on ammonia concentrations explain the more homogeneous levels for ammonia between the two sites during these periods.
The influence of agriculture on the agglomeration scale is clearly demonstrated in this measurement campaign and the local influence of road traffic is also presented. These observations appear on these sites and study period and highlight the road traffic influence on ammonia concentrations, but to a lesser extent compared to agriculture. Some studies also indicate a negligible impact of road traffic on ammonia levels in urban areas compared to other ammonia sources [48,49]. The influence of road traffic on ammonia concentrations continues to be highlighted in recent studies as observed in this paper [50,51], but the levels and associated emission factors may be low and remain dependent on numerous parameters such as the vehicle type, age, motorization, the type of road… [52,53,54,55,56]. To better understand the road traffic influence, the biomass combustion influence on ammonia concentrations has also been studied. These observations are discussed further in the next paragraph.
4.3. Other Ammonia Sources Influencing Urban Areas
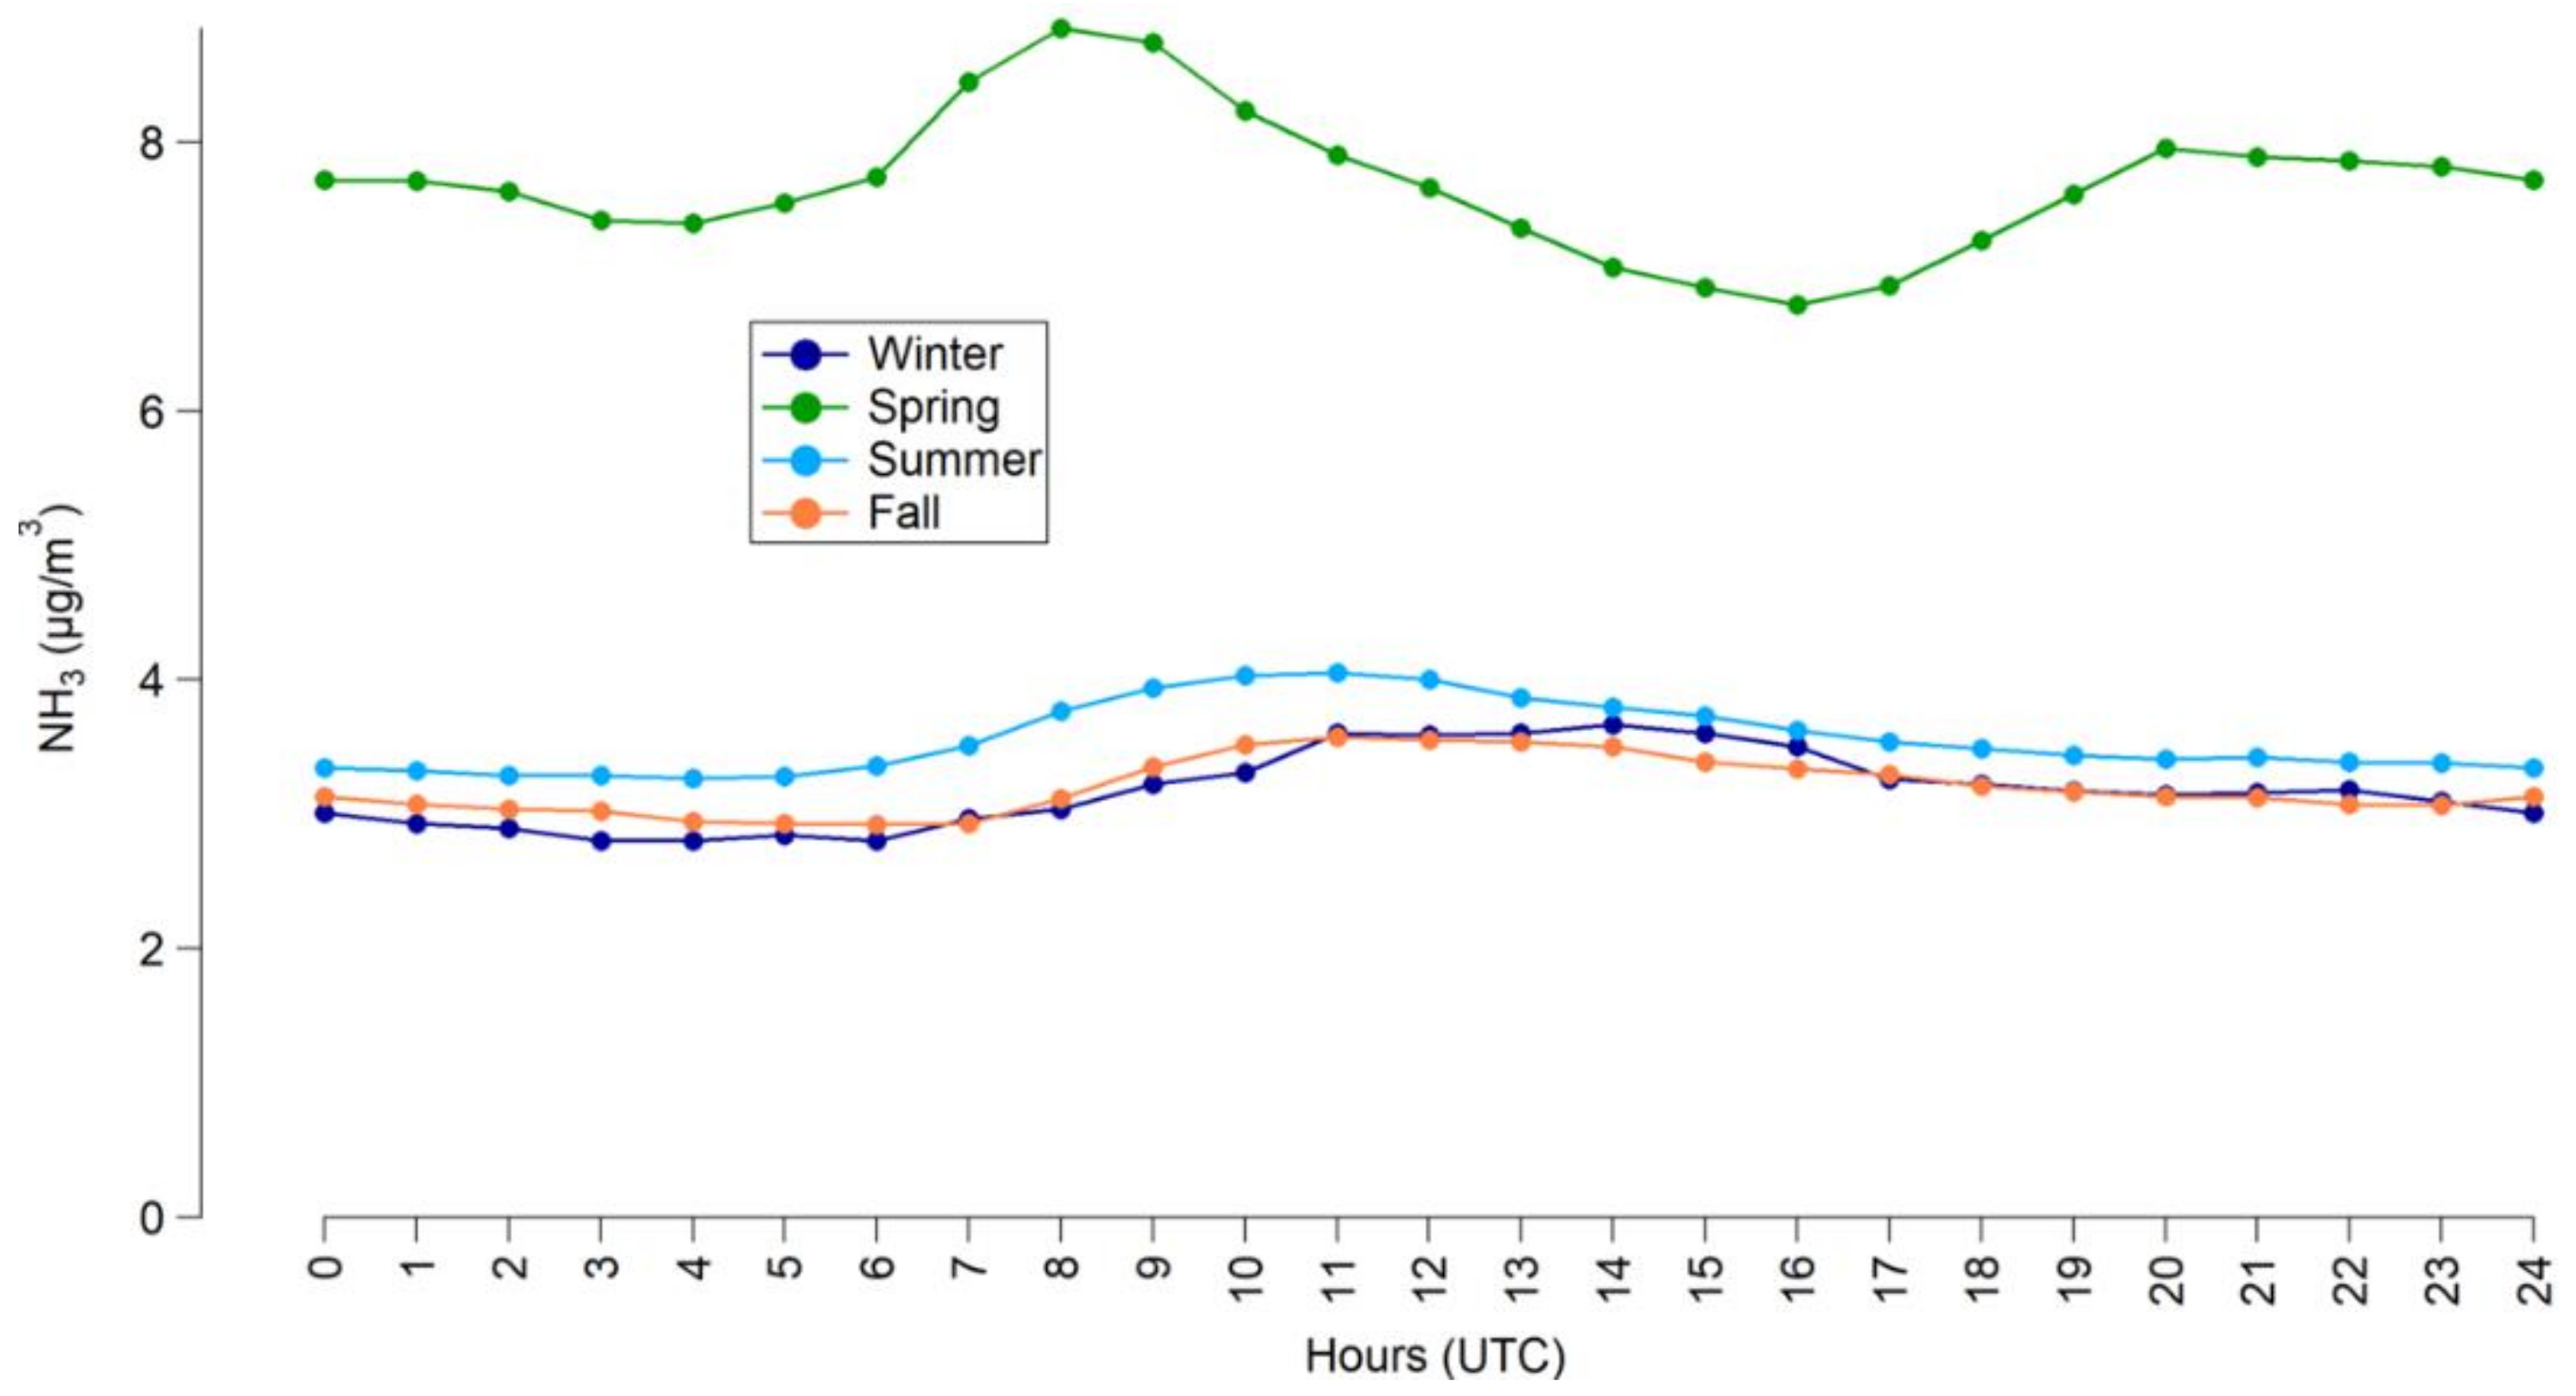
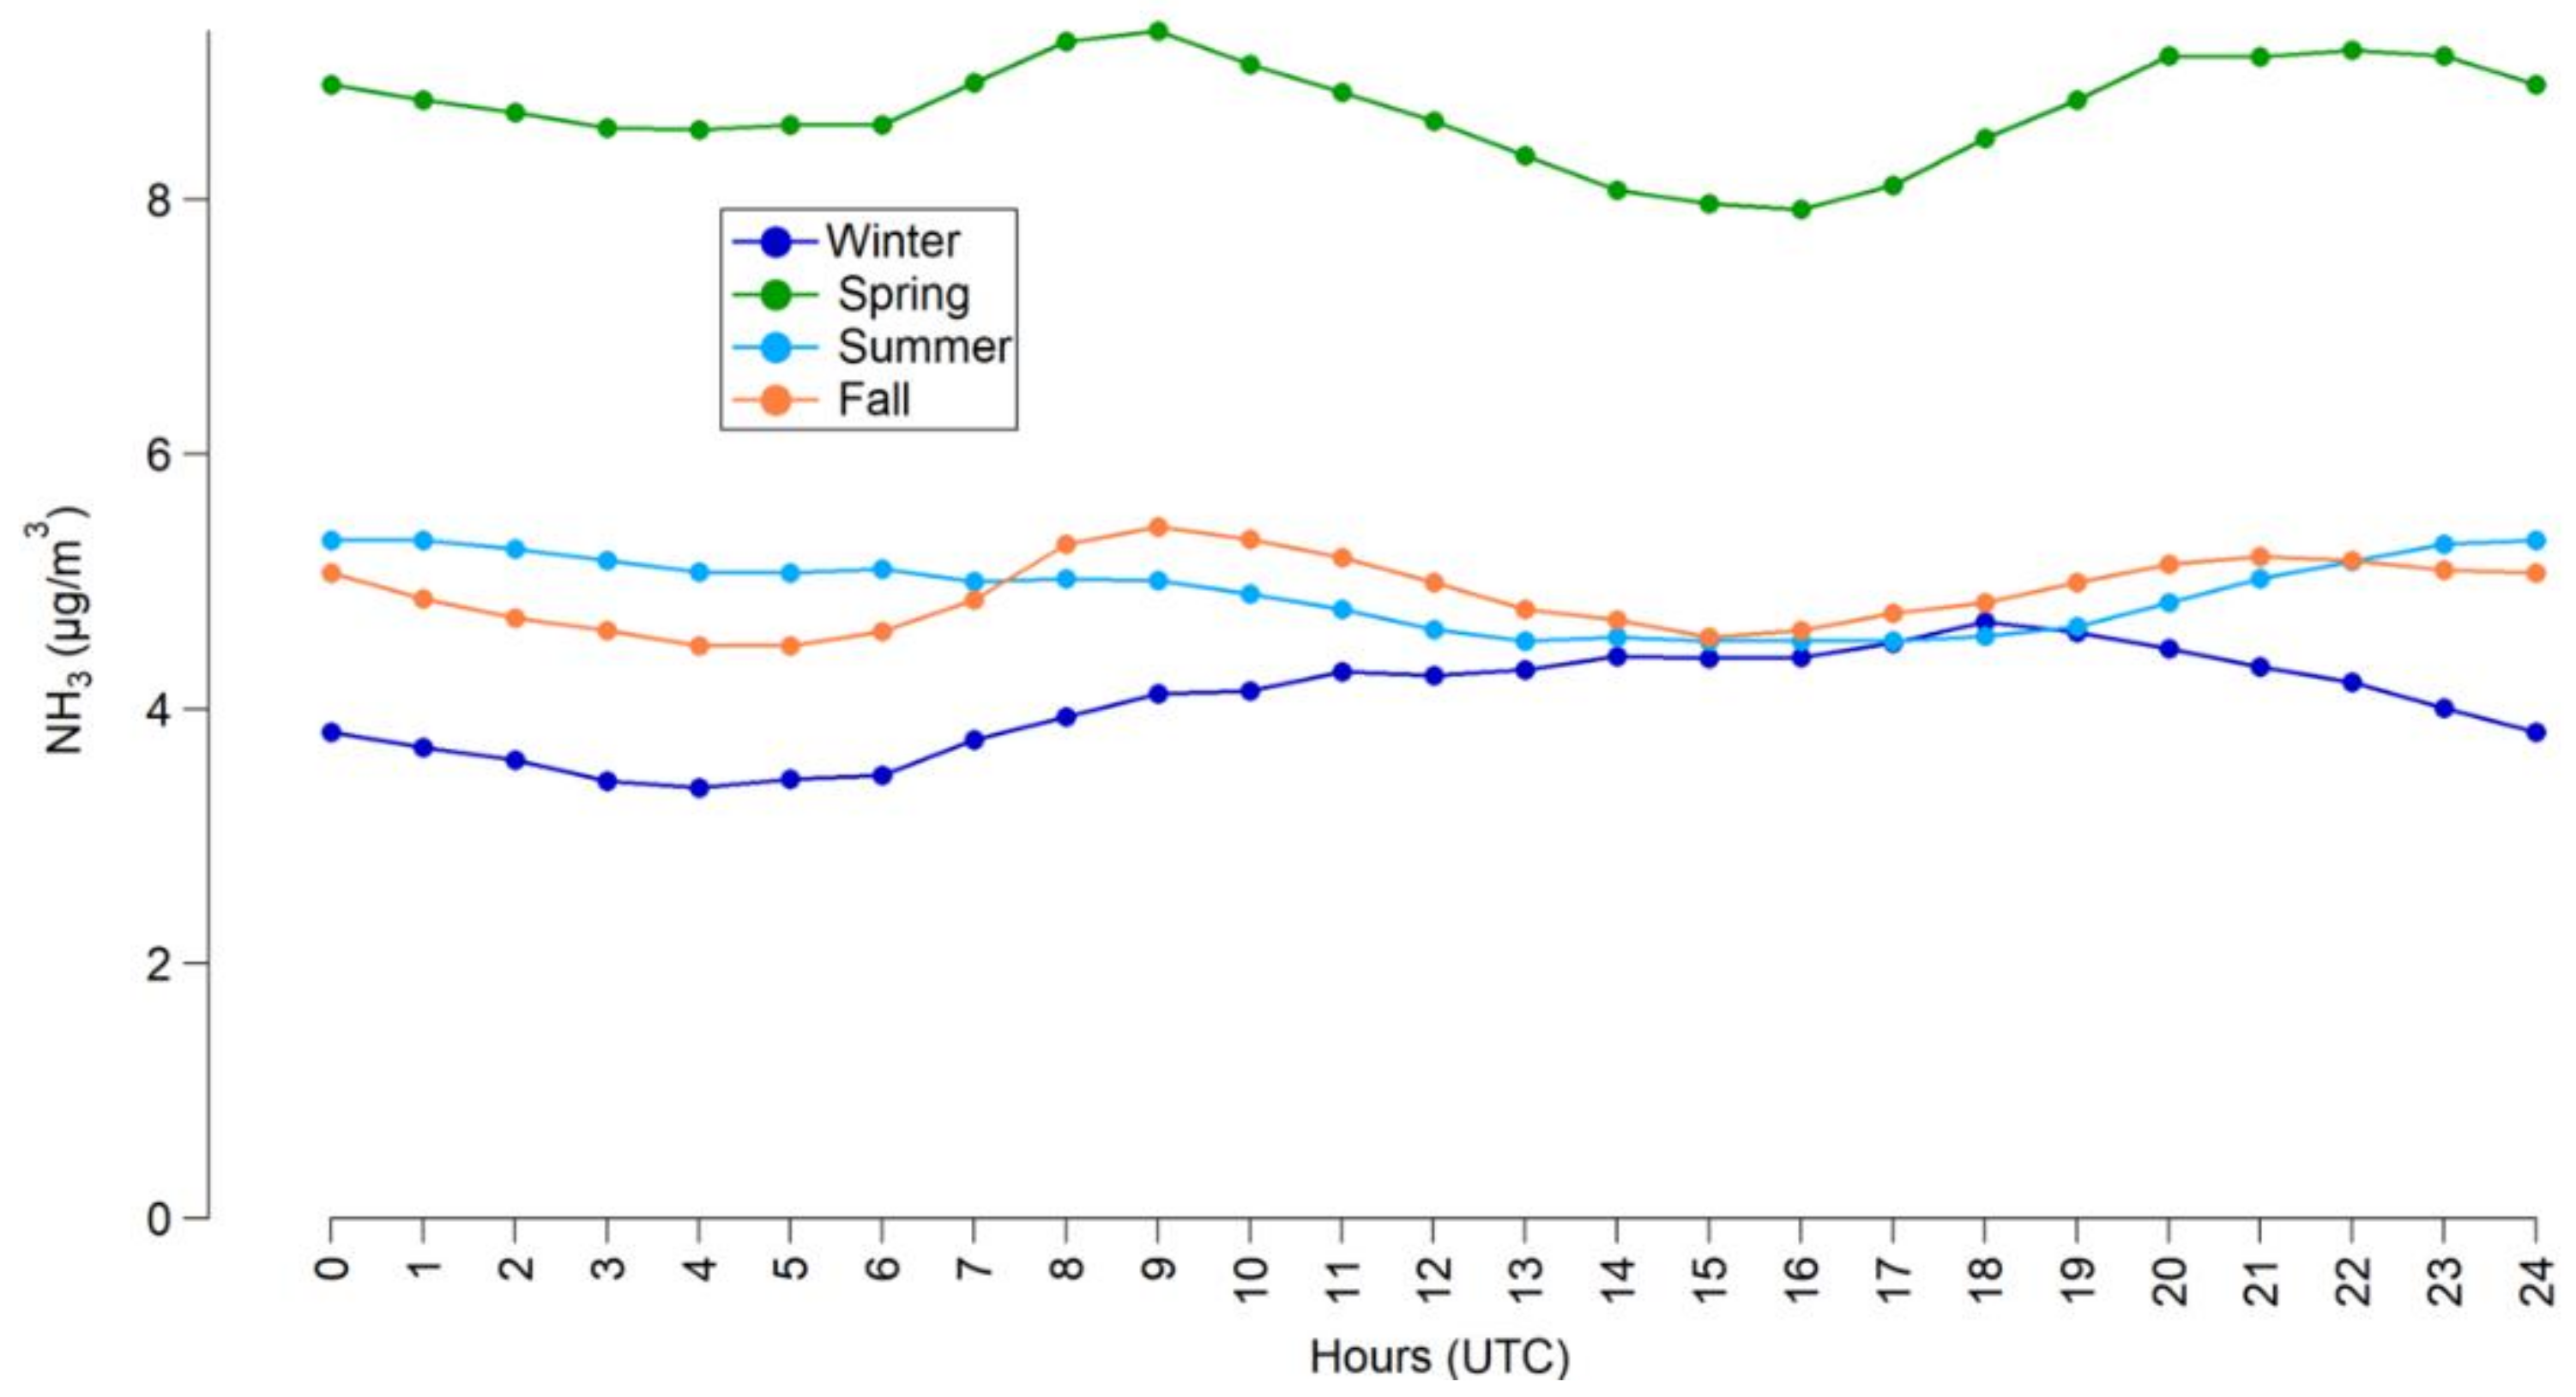
The dominance of agriculture in terms of ammonia emissions has already been discussed and was confirmed by this measurement campaign. The correlations clearly illustrate the importance of agriculture as better correlations and closer levels between the two sites appear in spring compared to other seasons, indicating a larger scale source related to agricultural activity. The temporal variability of agricultural emissions and the dominance of this sector during spring or summer compared to other seasons have already been observed in the literature [57]. The study of the daily mean profile on the two sites, indicated in Figure 12 and Figure 13, also highlights the influence of agriculture as the profiles and levels are similar between the two sites during spring, which is less marked for the other seasons. This profile tends to confirm once again the absence of a strong dependence on temperature on these sites, but it is important to note that the daily profiles remain flat. The morning peak can be attributed to evaporation of the ammonium-containing morning dew [58,59]. Meteorology and atmospheric conditions in more contrasted seasons such as spring favor the accumulation of ammonia in the dew during the night and its volatilization in the morning. This morning peak was also observed in other seasons but to a lesser extent, due to conditions that are less favorable to this phenomenon. However, recent campaigns may suggest a potential technical artefact, including the impact of the sampling system [4], which can also be influenced by weather and atmospheric conditions. This point needs to be further studied for future studies. The influence of agricultural ammonia on particulate levels is highlighted by the correlation study, which indicates correlation coefficients between ammonia and PM2.5 measured at both sites and PM10 measured in the urban background higher in spring (Appendix C). Meteorological conditions favorable to the formation of secondary ammonia nitrate particles may explain this trend in relation to the ammonia emissions. In this region, secondary particle pollution episodes are observed during spring when agricultural emissions are high, thus allowing a situation of NH3-rich coupled with adequate meteorological conditions [60,61].
As previously mentioned, biomass combustion appears to influence ammonia concentrations in the agglomeration. This emission source is consistent with the emission inventory, which includes it in the second major source with the residential and tertiary sector (see Figure 1). The study of correlations indicates significant correlation coefficients between BCwb—tracer of biomass combustion—and ammonia in winter particularly (Table 3). These correlations can therefore indicate the impact of this source at the scale of the agglomeration, in connection with the use of district heating by individuals and the presence of biomass heating plants. The potential influence of biomass combustion on ammonia levels is also highlighted at both sites because ammonia concentrations indicate increases in parallel with the increase in BCwb in winter as presented in the Appendix D.
Additional measurements would have allowed a better understanding of the origin of ammonia or its influence on the formation of particles. The monitoring of other pollutants such as carbon monoxide—tracer of road traffic—or access to traffic data could have provided additional information. The chemical composition of PM and the NH4+/NH3 ratio would have also provided a better understanding of the formation of particles. A nitrogen isotope study is also a major point of interest for future studies [62,63].
5. Conclusions
This study is based on nearly 2 years of parallel real-time ammonia measurements at a background site and a roadside site in Reims (France). The main objective of the study is to identify the impact of road traffic on ammonia in urban areas in relation to emissions from catalytic converters (road traffic), which is less documented compared to other sources of ammonia, such as agriculture. The main observations highlighted were as follows:
- -
- Levels between 1 and 10 µg/m3 at the two sites: at the background site over the last 6 years and at both sites during the measurement campaign. These levels are in the order of magnitude of the urban background sites but remain lower for this roadside site compared to other sites of the same influence.
- -
- The importance of agricultural emissions is observed on an annual scale with levels significantly higher during spring than during the other seasons in relation with the spreading periods in the region.
- -
- The influence of road traffic is highlighted with significantly higher levels at the roadside site compared to the background site. Similar variations of the BCff—tracer of road traffic—are observed according to the seasons.
As previously discussed, complementary measurements or an isotopic study are major assets for a better understanding of the origin of ammonia and its involvement in the particle’s formation. Although the levels measured were lower than in previous studies, the increased use of catalytic converters and the potential modification of the road fleet in the upcoming years, in addition to the lack of knowledge about ammonia emissions related to the catalytic converters aging confirm the need to continue these studies. In addition, a better knowledge of the methods for ammonia measurement in ambient air is also a major challenge for the upcoming years.
Author Contributions
Conceptualization, M.C. and E.J.; methodology, M.C., E.C., E.J. and S.C.; software, M.C.; validation, M.C.; investigation, M.C., E.C., E.J. and S.C.; writing—original draft preparation, M.C.; writing—review and editing, S.C., E.C., E.J. and M.C.; project administration, E.C., M.C. and E.J. All authors have read and agreed to the published version of the manuscript.
Funding
This research received no external funding.
Institutional Review Board Statement
Not applicable.
Data Availability Statement
The data presented in this study are available on request from the corresponding author.
Acknowledgments
The entire technical team of ATMO Grand Est is acknowledged for the technical support on analyzers.
Conflicts of Interest
The authors declare no conflict of interest.
Appendix A
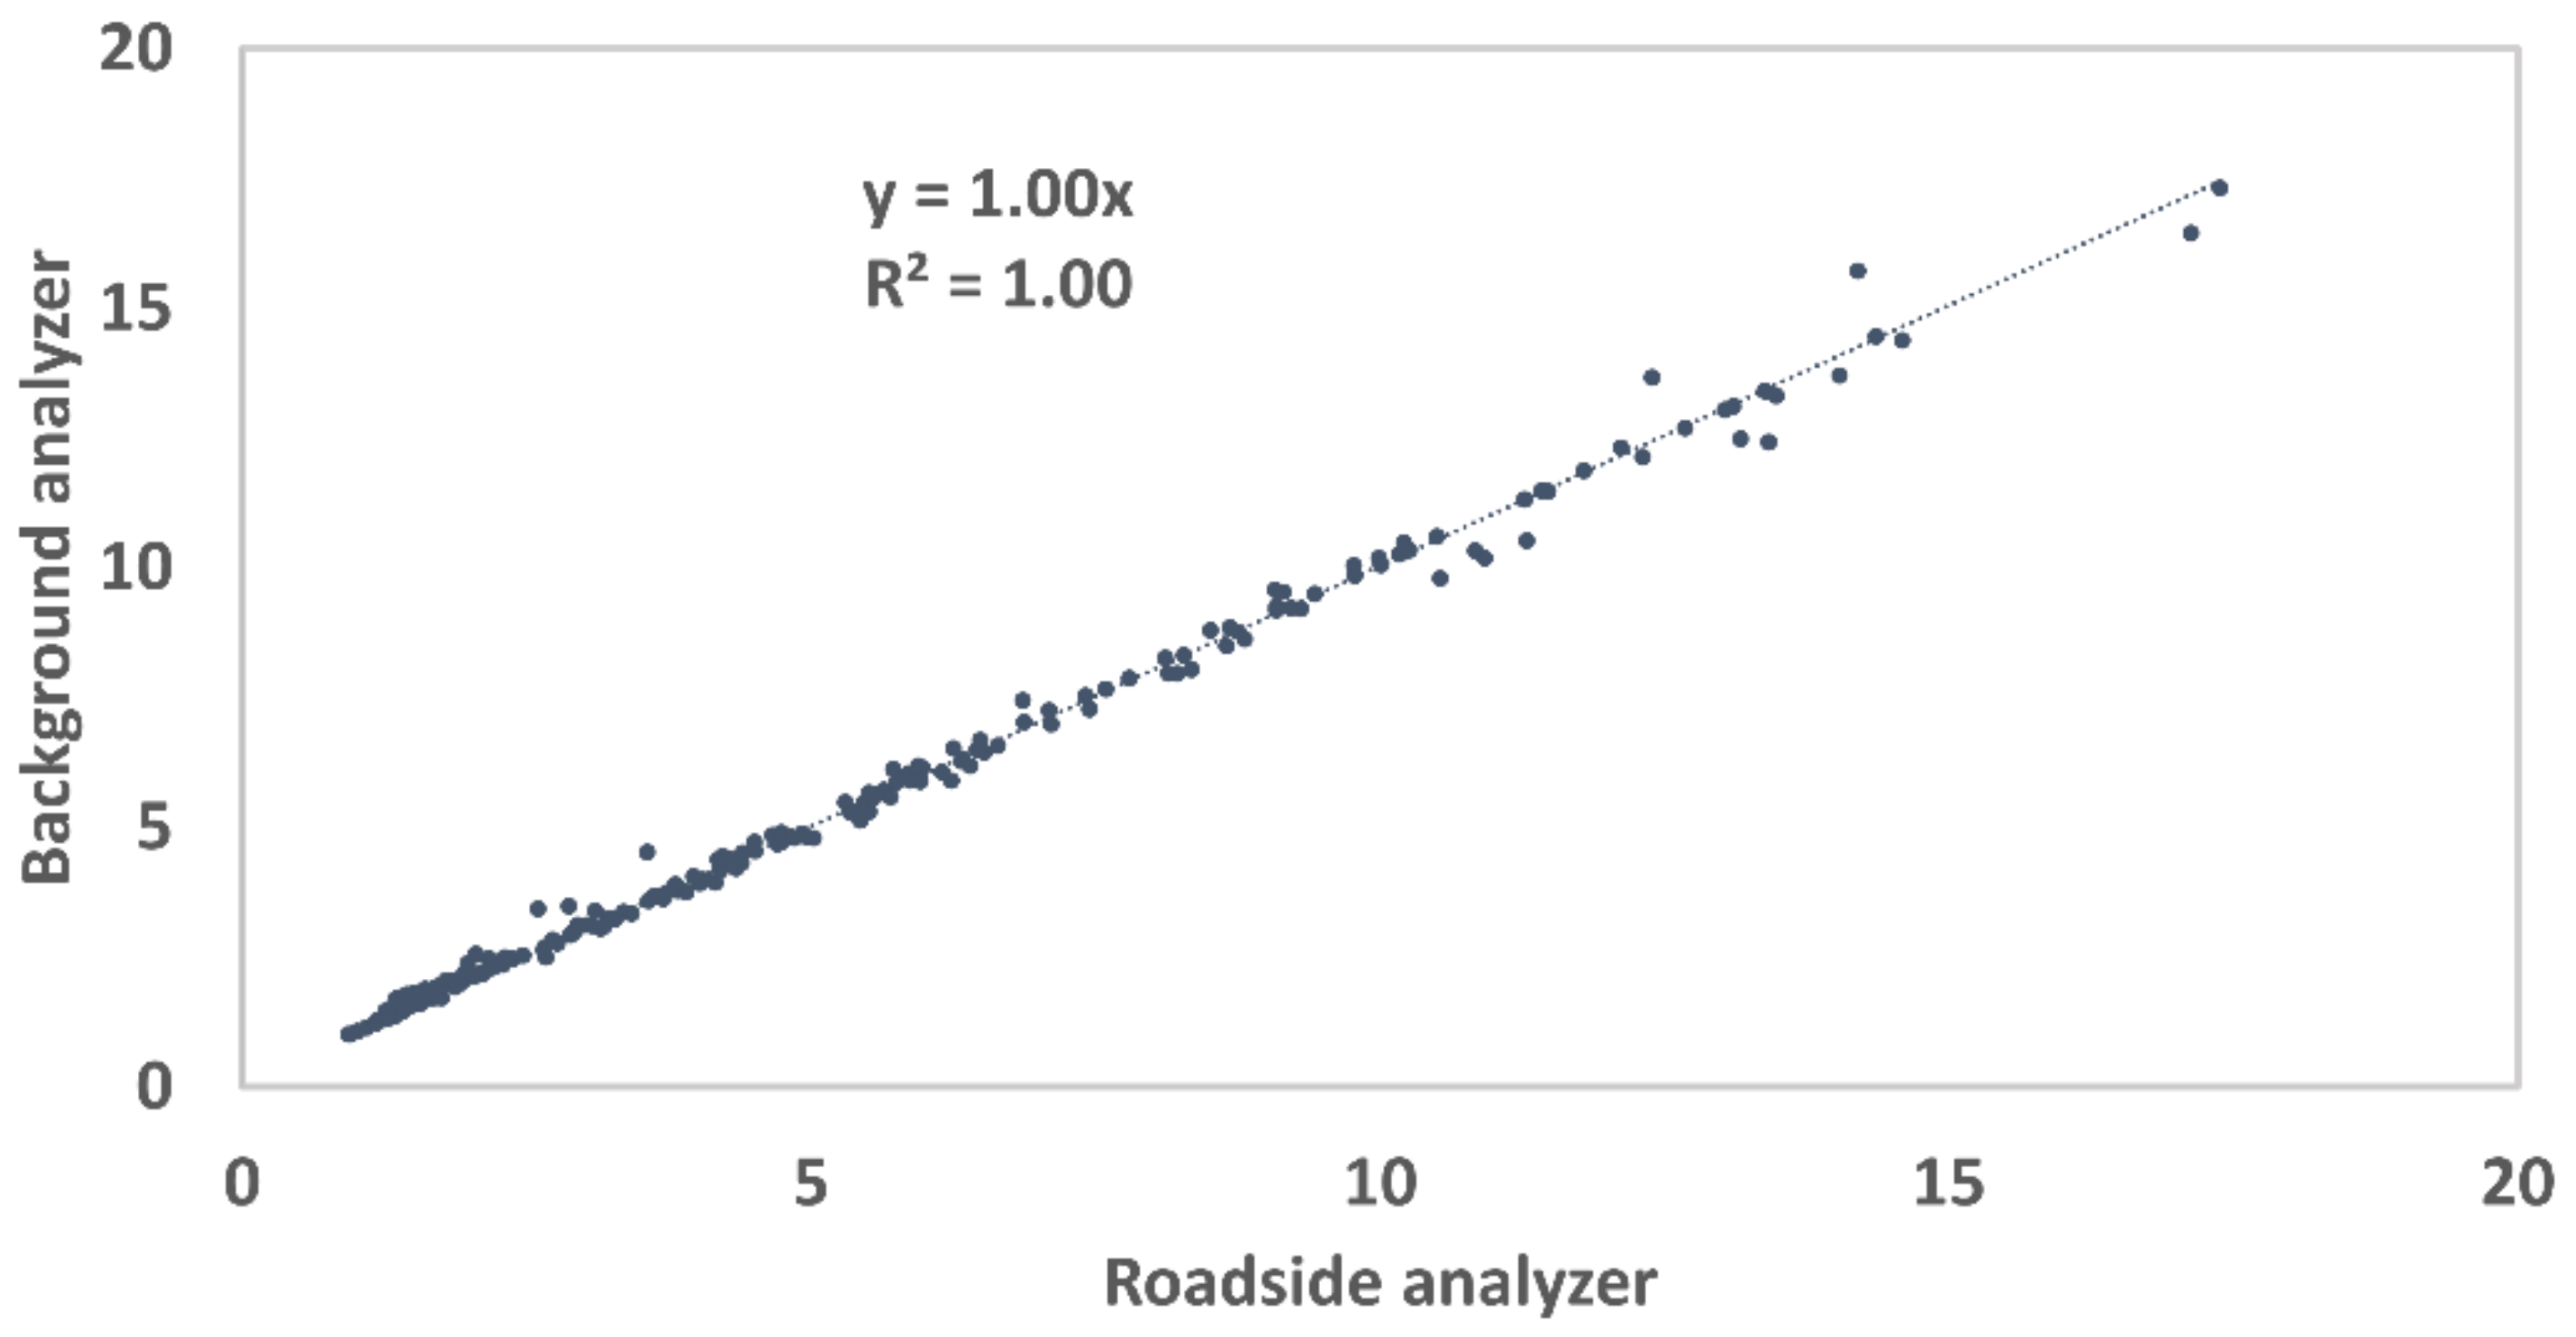
Both ammonia analyzers were compared for 2 weeks at the end of the campaign on another regional background site to check for drift and to quantify the potential difference between both. As indicated in Figure A1, the analyzers indicate a significant correlation with a correlation coefficient equal to 1.00, confirming the variations measured by both instruments. Furthermore, the linear relationship is determined for a slope equal to 1.00, which validates the comparison of the two analyzers using the uncertainty defined as the precision provided by the manufacturer (0.5 µg/m3). The difference between the two analyzers on the same measurement site is indeed lower than this uncertainty.
Figure A1.
Hourly data comparison between the two analyzers at the end of the measurement campaign—December 2021 (n = 266).
Figure A1.
Hourly data comparison between the two analyzers at the end of the measurement campaign—December 2021 (n = 266).

Appendix B
The descriptive statistics of ammonia hourly concentrations are presented in Table A1 for each measurement site.

Table A1.
Descriptive statistics of ammonia hourly concentrations at both sites.
| Compounds | Background Site | Roadside Site |
|---|---|---|
| Mean | 4.5 | 5.8 |
| Median | 3.3 | 4.9 |
| Minimum | 0.8 | 1.0 |
| Maximum | 52.5 | 67.5 |
| 1st quartile | 2.2 | 3.2 |
| 3rd quartile | 5.3 | 7.0 |
| Number of hourly data | 15,919 | 15,156 |
Appendix C
The correlation coefficients obtained for spring and summer, presented in Table A2 and Table A3, indicated lower correlations between ammonia and combustion particles (BCff and BCwb) or nitrogen oxides than in winter and autumn. Conversely, the strongest observed correlations at both sites appeared between ammonia and PM2.5 and PM10 particles, mainly at the background site with correlation coefficient between 0.7 and 0.8. A weaker correlation appeared between ammonia and PM10 at the roadside site, likely related to the coarse particles linked to the resuspension and to the road dust in the vicinity of the road traffic, associated with different dynamics compared to the other PM10 sources as exhaust or formation of secondary PM.
Table A2.
Pearson correlation coefficients between ammonia and other air pollutants and temperature at the background site.
Table A2.
Pearson correlation coefficients between ammonia and other air pollutants and temperature at the background site.
| Background Site Ammonia | ||||
|---|---|---|---|---|
| Compounds | Spring 2020 | Summer 2020 | Spring 2021 | Summer 2021 |
| BCff | 0.3 | 0.4 | 0.5 | 0.1 |
| BCwb | 0.4 | 0.3 | 0.6 | 0.1 |
| PM10_Roadside | 0.4 | 0.4 | 0.7 | 0.3 |
| PM10_Background | 0.6 | 0.6 | 0.8 | 0.3 |
| PM2.5 both sites | 0.6 | 0.7 | 0.7 | 0.4 |
| NOx | 0.0 | 0.2 | 0.5 | 0.1 |
| Ozone | −0.2 | 0.2 | −0.4 | 0.5 |
| Temperature | 0.0 | 0.0 | −0.1 | 0.5 |
Table A3.
Pearson correlation coefficients between ammonia and other air pollutants and temperature at the roadside site.
Table A3.
Pearson correlation coefficients between ammonia and other air pollutants and temperature at the roadside site.
| Roadside Site Ammonia | ||||
|---|---|---|---|---|
| Compounds | Spring 2020 | Summer 2020 | Spring 2021 | Summer 2021 |
| BCff | 0.3 | 0.5 | 0.5 | 0.2 |
| BCwb | 0.4 | 0.2 | 0.6 | 0.2 |
| PM10_Roadside | 0.4 | 0.4 | 0.7 | 0.3 |
| PM10_Background | 0.6 | 0.6 | 0.7 | 0.3 |
| PM2.5 both sites | 0.6 | 0.7 | 0.7 | 0.4 |
| NOx | 0.1 | 0.3 | 0.4 | 0.1 |
| Ozone | −0.2 | 0.1 | −0.4 | 0.2 |
| Temperature | 0.1 | 0.0 | −0.1 | 0.2 |
Appendix D
The ammonia time series as a function of Black-Carbon from biomass combustion (BCwb) are presented in Figure A2 and Figure A3 for the background site and the roadside site, respectively. Both sites were associated with an increase of ammonia concentrations in parallel with BCwb concentration, except during spring and summer periods.
Figure A2.
Temporal variation of hourly ammonia concentration as a function of Black Carbon from biomass combustion (BCwb in colored axis) concentration at the background site.
Figure A2.
Temporal variation of hourly ammonia concentration as a function of Black Carbon from biomass combustion (BCwb in colored axis) concentration at the background site.

Figure A3.
Temporal variation of hourly ammonia concentration as a function of Black Carbon from biomass combustion (BCwb in colored axis) concentration at the roadside site.
Figure A3.
Temporal variation of hourly ammonia concentration as a function of Black Carbon from biomass combustion (BCwb in colored axis) concentration at the roadside site.

References
- Behera, S.N.; Sharma, M.; Aneja, V.P.; Balasubramanian, R. Ammonia in the Atmosphere: A Review on Emission Sources, Atmospheric Chemistry and Deposition on Terrestrial Bodies. Environ. Sci. Pollut. Res. 2013, 20, 8092–8131. [Google Scholar] [CrossRef] [PubMed]
- Tang, Y.S.; Flechard, C.R.; Dämmgen, U.; Vidic, S.; Djuricic, V.; Mitosinkova, M.; Uggerud, H.T.; Sanz, M.J.; Simmons, I.; Dragosits, U.; et al. Pan-European Rural Atmospheric Monitoring Network Shows Dominance of NH3 Gas and NH4NO3 Aerosol in Inorganic Pollution Load. Atmos. Chem. Phys. 2020, 10, 1–61. [Google Scholar] [CrossRef]
- Pandolfi, M.; Amato, F.; Reche, C.; Alastuey, A.; Otjes, R.P.; Blom, M.J.; Querol, X. Summer Ammonia Measurements in a Densely Populated Mediterranean City. Atmos. Chem. Phys. 2012, 12, 7557–7575. [Google Scholar] [CrossRef] [Green Version]
- Twigg, M.; Berkhout, A.; Cowan, N.; Crunaire, S.; Dammers, E.; Ebert, V.; Gaudion, V.; Haaima, M.; Häni, C.; John, L.; et al. In-Situ Measurements of NH3: Instrument Performance and Applicability. Atmos. Meas. Tech. Discuss. 2022; in press. [Google Scholar] [CrossRef]
- Guo, H.; Otjes, R.; Schlag, P.; Kiendler-Scharr, A.; Nenes, A.; Weber, R.J. Effectiveness of Ammonia Reduction on Control of Fine Particle Nitrate. Atmos. Chem. Phys. 2018, 18, 12241–12256. [Google Scholar] [CrossRef] [Green Version]
- Santé Publique France. Impact de Pollution de l’Air Ambiant Sur la Mortalité en France Métropolitaine. Réduction en Lien Avec le Confinement du Printemps 2020 et Nouvelles Données Sur le Poids Total Pour la Période 2016–2019; Santé Publique France: Paris, France, 2021. [Google Scholar]
- European Environment Agency. Air Quality in Europe 2021; EEA: Copenhagen, Denmark, 2021. [Google Scholar]
- Air Breizh. L’Ammoniac. Air Breizh. Available online: https://www.airbreizh.asso.fr/air-exterieur/les-polluants/lammoniac/ (accessed on 30 April 2021).
- Elser, M.; El-Haddad, I.; Maasikmets, M.; Bozzetti, C.; Wolf, R.; Ciarelli, G.; Slowik, J.G.; Richter, R.; Teinemaa, E.; Hüglin, C.; et al. High Contributions of Vehicular Emissions to Ammonia in Three European Cities Derived from Mobile Measurements. Atmos. Environ. 2018, 175, 210–220. [Google Scholar] [CrossRef]
- Marner, D.B. Ammonia Emissions from Roads for Assessing Impacts on Nitrogen-Sensitive Habitats; Air Quality Consultants: Bristol, UK, 2020. [Google Scholar]
- Sun, K.; Tao, L.; Miller, D.J.; Pan, D.; Golston, L.M.; Zondlo, M.A.; Griffin, R.J.; Wallace, H.W.; Leong, Y.J.; Yang, M.M.; et al. Vehicle Emissions as an Important Urban Ammonia Source in the United States and China. Environ. Sci. Technol. 2017, 51, 2472–2481. [Google Scholar] [CrossRef]
- Suarez-Bertoa, R.; Pechout, M.; Vojtíšek, M.; Astorga, C. Regulated and Non-Regulated Emissions from Euro 6 Diesel, Gasoline and CNG Vehicles under Real-World Driving Conditions. Atmosphere 2020, 11, 204. [Google Scholar] [CrossRef] [Green Version]
- Agence d’Urbanisme. Les Établissements du Grand Reims—Chifres Clés N°1; Agence d’Urbanisme Région de Reims: Reims, France, 2019. [Google Scholar]
- Agence d’Urbanisme. Quels Profils Automobiles Pour Nos Territoires? Agence d’Urbanisme Région de Reims: Reims, France, 2021. [Google Scholar]
- ATMO Champagne-Ardenne. Etude des Charges Critiques des Axes en Situation de Dépassement Réglementaire; ATMO Champagne-Ardenne: Reims, France, 2013. [Google Scholar]
- Martin, N.; Ferracci, V.; Cassidy, N.; Hoffnagle, J. The Application of a Cavity Ring-down Spectrometer to Measurements of Ambient Ammonia Using Traceable Primary Standard Gas Mixtures. Appl. Phys. B 2016, 122, 219. [Google Scholar] [CrossRef] [Green Version]
- EN 14211; Ambient Air—Standard Method for the Measurement of the Concentration of Nitrogen Dioxide and Nitrogen Monoxide by Chemiluminescence. European Committee for Standardization: Brussels, Belgium, 2012.
- Ministère de la Transition Ecologique. Données et Etudes Statistiques—Concentrations Annuelles SO2, NO2, O3, Particules PM10 et PM2.5-Indice Base 100. 2022. Available online: https://www.statistiques.developpement-durable.gouv.fr/concentrations-annuelles-so2-no2-o3-particules-pm10-et-pm25-indice-base-100 (accessed on 3 May 2022).
- Ministère de la Transition Ecologique. Données et Etudes Statistiques—La Pollution de l’Air par le Dioxyde de Soufre (SO2). 2021. Available online: https://www.statistiques.developpement-durable.gouv.fr/la-pollution-de-lair-par-le-dioxyde-de-soufre-so2 (accessed on 3 May 2022).
- EN 12341; Ambient Air—Standard Gravimetric Measurement Method for the Determination of the PM10 or PM2.5 Mass Concentration of Suspended Particulate Matter. European Committee for Standarization: Brussels, Belgium, 2014.
- Drinovec, L.; Močnik, G.; Zotter, P.; Prévôt, A.S.H.; Ruckstuhl, C.; Coz, E.; Rupakheti, M.; Sciare, J.; Müller, T.; Wiedensohler, A.; et al. The “Dual-Spot” Aethalometer: An Improved Measurement of Aerosol Black Carbon with Real-Time Loading Compensation. Atmos. Meas. Tech. 2015, 8, 1965–1979. [Google Scholar] [CrossRef] [Green Version]
- Sandradewi, J.; Prévôt, A.S.H.; Szidat, S.; Perron, N.; Alfarra, R.; Lanz, V.A.; Weingartner, E.; Baltensperger, U. Using Aerosol Light Absorption Measurements for the Quantitative Determination of Wood Burning and Traffic Emission Contributions to Particulate Matter. Environ. Sci. Technol. 2008, 42, 3316–3323. [Google Scholar] [CrossRef] [PubMed]
- EN 14625; Ambient Air—Standard Method for the Measurement of the Concentration of Ozone by Ultraviolet Photometry. European Committee for Standardization: Brussels, Belgium, 2012.
- Larios, A.D.; Chebana, F.; Godbout, S.; Brar, S.K.; Valera, F.; Palacios, J.H.; Avalos Ramirez, A.; Saldoval-Salas, F.; Larouche, J.P.; Medina-Hernández, D.; et al. Analysis of Atmospheric Ammonia Concentration from Four Sites in Quebec City Region over 2010–2013. Atmos. Pollut. Res. 2018, 9, 476–482. [Google Scholar] [CrossRef] [Green Version]
- Lovarelli, D.; Fugazza, D.; Costantini, M.; Conti, C.; Diolaiuti, G.; Guarino, M. Comparison of Ammonia Air Concentration before and during the Spread of COVID-19 in Lombardy (Italy) Using Ground-Based and Satellite Data. Atmos. Environ. 2021, 259, 118534. [Google Scholar] [CrossRef]
- Nair, A.A.; Yu, F. Quantification of Atmospheric Ammonia Concentrations: A Review of Its Measurement and Modeling. Atmosphere 2020, 11, 1092. [Google Scholar] [CrossRef]
- Wang, S.; Nan, J.; Shi, C.; Fu, Q.; Gao, S.; Wang, D.; Cui, H.; Saiz-Lopez, A.; Zhou, B. Atmospheric Ammonia and Its Impacts on Regional Air Quality over the Megacity of Shanghai, China. Sci. Rep. 2015, 5, 15842. [Google Scholar] [CrossRef] [Green Version]
- ATMO AURA. Mesures de l’Ammoniac dans l’Atmosphère; ATMO AURA: Bron, France, 2016. [Google Scholar]
- ATMO Sud. Plan de Surveillance de l’Ammoniac NH3 dans l’Air Ambiant; ATMO Sud: Marseille, France, 2016. [Google Scholar]
- ATMO Hauts-de-France. Evaluation de la Qualité de l’Air: Mesures de l’Ammoniac dans les Hauts-de-France en 2016; ATMO Hauts-de-France: Lille, France, 2019. [Google Scholar]
- Aneja, V.P.; Murthy; Battye, W.; Battye, R.; Benjey, W.G. Analysis of Ammonia Is an Important Sediment-Associated Toxicant in the Lower Fox River and Green Bay, Wisconsin. Atmos. Environ. 1998, 9, 313–322. [Google Scholar]
- Crutzen, P.J. Atmospheric Interactions-Homogeneous Gas Reactions of C, N and S Containing Compounds. In The Major Biogeochemical Cycles and Their Interactions; Bolin, B., Cook, R.B., Eds.; Wiley: Chichester, UK, 1983. [Google Scholar]
- Georgii, H.W.; Gravenhorst, G. The Ocean Source as Source or Sink of Relative Trace Gases. Pure Appl. Geophys. 1977, 115, 503–511. [Google Scholar] [CrossRef]
- Cape, J.; Eerden, L.; Sheppard, L.; Leith, I.; Sutton, M.A. Evidence for Changing the Critical Level for Ammonia. Environ. Pollut. 2008, 157, 1033–1037. [Google Scholar] [CrossRef] [Green Version]
- ATMO Grand Est. Mesures de l’Ammoniac dans la Région Grand Est. Available online: https://portailsig.atmo-grandest.eu/portal/apps/opsdashboard/index.html#/8c387c7d007c47b98473259cafd99e86 (accessed on 28 April 2022).
- Chambre d’Agriculture de la Marne. Calendrier et Conditions d’Epandage. Available online: https://marne.chambre-agriculture.fr/environnement-et-reglementation/directive-nitrates/calendrier-et-conditions-depandage/ (accessed on 27 April 2022).
- Genermont, S.; Arteta, J.; Couvidat, F.; Crunaire, S.; Dufossé, K.; Dufour, G.; El Msayryb, A.; Fortems-Cheiney, A.; Gilliot, J.-M.; Meleux, F. AMP’AIR: Amélioration de la Représentation des Émissions Agricoles d’Ammoniac pour Une Meilleure Prévision de la Qualité de l’Air en France; Rapport Final; Convention ADEME 16600C0013; ADEME: Valbonne, France, 2021; p. 82. [Google Scholar]
- Direction Régionale de l’Alimentation, de l’Agriculture et de la Fôret (DRAAF). Recensement Agricole 2020—Premiers Résultats de la Marne; DRAAF: Lyon, France, 2022. [Google Scholar]
- Levine, J.S.; Hoell, J.M.; Augustsson, T.R. The Vertical Distribution of Tropospheric Ammonia. Geophys. Res. Lett. 1980, 7, 317–320. [Google Scholar] [CrossRef]
- Perrino, C.; Catrambone, M.; Di Menno di Bucchianico, A.; Allegrini, I. Gaseous Ammonia in the Urban Area of Rome, Italy and Its Relationship with Traffic Emissions. Atmos. Environ. 2002, 36, 5385–5394. [Google Scholar] [CrossRef]
- Cape, J.N.; Tang, Y.S.; van Dijk, N.; Love, L.; Sutton, M.A.; Palmer, S.C.F. Concentrations of Ammonia and Nitrogen Dioxide at Roadside Verges, and Their Contribution to Nitrogen Deposition. Environ. Pollut. 2004, 132, 469–478. [Google Scholar] [CrossRef] [PubMed]
- Rose, R. Real World Measurements of Ammonia Emissions from Vehicles. In Routes to Clean Air, Birmingham, England, 29–30 October 2018; Ricardo Energy & Environment: Oxford, UK, 2018. [Google Scholar]
- Farren, N.J.; Davison, J.; Rose, R.A.; Wagner, R.L.; Carslaw, D.C. Underestimated Ammonia Emissions from Road Vehicles. Environ. Sci. Technol. 2020, 54, 15689–15697. [Google Scholar] [CrossRef]
- Bishop, G.A.; Stedman, D.H. Reactive Nitrogen Species Emission Trends in Three Light-/Medium-Duty United States Fleets. Environ. Sci. Technol. 2015, 49, 11234–11240. [Google Scholar] [CrossRef] [PubMed]
- ATMO Grand Est. Quel a Eté l’Impact du Confinement Sur la Qualité de l’Air en 2020? Available online: http://www.atmo-grandest.eu/actualite/quel-a-ete-limpact-du-confinement-sur-la-qualite-de-lair-en-2020 (accessed on 22 June 2022).
- ATMO Grand Est. Note Sur l’Impact du Confinement en 2020; ATMO Grand Est: Schiltigheim, France, 2021. [Google Scholar]
- Skirienė, A.F.; Stasiškienė, Ž. COVID-19 and Air Pollution: Measuring Pandemic Impact to Air Quality in Five European Countries. Atmosphere 2021, 12, 290. [Google Scholar] [CrossRef]
- Yao, X. Is Vehicular Emission a Significant Contributor to Ammonia in the Urban Atmosphere? Atmos. Environ. 2013, 80, 499–506. [Google Scholar] [CrossRef]
- Artíñano, B.; Pujadas, M.; Alonso-Blanco, E.; Becerril-Valle, M.; Coz, E.; Gómez-Moreno, F.J.; Salvador, P.; Nuñez, L.; Palacios, M.; Diaz, E. Real-Time Monitoring of Atmospheric Ammonia during a Pollution Episode in Madrid (Spain). Atmos. Environ. 2018, 189, 80–88. [Google Scholar] [CrossRef]
- Li, S.; Liu, T.; Song, W.; Pei, C.; Huang, Z.; Wang, Y.; Chen, Y.; Yan, J.; Zhang, R.; Zhang, Y.; et al. Emission Factors of Ammonia for On-Road Vehicles in Urban Areas from a Tunnel Study in South China with Laser-Absorption Based Measurements. Environ. Pollut. 2021, 280, 116972. [Google Scholar] [CrossRef]
- Reche, C.; Pérez, N.; Alastuey, A.; Cots, N.; Pérez, E.; Querol, X. 2011–2020 Trends of Urban and Regional Ammonia in and around Barcelona, NE Spain. Chemosphere 2022, 304, 135347. [Google Scholar] [CrossRef]
- Hu, Q.; Zhang, L.; Evans, G.J.; Yao, X. Variability of Atmospheric Ammonia Related to Potential Emission Sources in Downtown Toronto, Canada. Atmos. Environ. 2014, 99, 365–373. [Google Scholar] [CrossRef]
- Ehrnsperger, L.; Klemm, O. Source Apportionment of Urban Ammonia and Its Contribution to Secondary Particle Formation in a Mid-Size European City. Aerosol Air Qual. Res. 2021, 21, 200404. [Google Scholar] [CrossRef]
- Abualqumboz, M.S.; Martin, R.S.; Thomas, J. On-Road Tailpipe Characterization of Exhaust Ammonia Emissions from in-Use Light-Duty Gasoline Motor Vehicles. Atmos. Pollut. Res. 2022, 13, 101449. [Google Scholar] [CrossRef]
- Zhang, Q.; Wei, N.; Zou, C.; Mao, H. Evaluating the Ammonia Emission from In-Use Vehicles Using on-Road Remote Sensing Test. Environ. Pollut. 2021, 271, 116384. [Google Scholar] [CrossRef] [PubMed]
- Yang, D.; Zhu, S.; Ma, Y.; Zhou, L.; Zheng, F.; Wang, L.; Jiang, J.; Zheng, J. Emissions of Ammonia and Other Nitrogen-Containing Volatile Organic Compounds from Motor Vehicles under Low-Speed Driving Conditions. Environ. Sci. Technol. 2022, 56, 5440–5447. [Google Scholar] [CrossRef] [PubMed]
- Zhou, C.; Zhou, H.; Holsen, T.M.; Hopke, P.K.; Edgerton, E.S.; Schwab, J.J. Ambient Ammonia Concentrations Across New York State. J. Geophys. Res. Atmos. 2019, 124, 8287–8302. [Google Scholar] [CrossRef] [Green Version]
- He, Y.; Pan, Y.; Zhang, G.; Ji, D.; Tian, S.; Xu, X.; Zhang, R.; Wang, Y. Tracking Ammonia Morning Peak, Sources and Transport with 1 Hz Measurements at a Rural Site in North China Plain. Atmos. Environ. 2020, 235, 117630. [Google Scholar] [CrossRef]
- Wentworth, G.R.; Murphy, J.G.; Benedict, K.B.; Bangs, E.J.; Collett Jr., J. L. The Role of Dew as a Night-Time Reservoir and Morning Source for Atmospheric Ammonia. Atmos. Chem. Phys. 2016, 16, 7435–7449. [Google Scholar] [CrossRef] [Green Version]
- Laboratoire Central de Surveillance de la Qualité de l’Air (LCSQA). Evolution Long Terme de la Composition Chimique des PM2.5 en France MERA; LCSQA: Lyon, France, 2020. [Google Scholar]
- Laboratoire Central de Surveillance de la Qualité de l’Air (LCSQA). Episode de Pollution de Mi-Février 2018: Eléments de Compréhension à Partir de Mesures Automatiques Lors des Premiers Jours de l’épisode (21 Au 23 Février 2018); LCSQA: Lyon, France, 2018. [Google Scholar]
- Bhattarai, N.; Wang, S.; Pan, Y.; Xu, Q.; Zhang, Y.; Chang, Y.; Fang, Y. Δ15N-Stable Isotope Analysis of NHx: An Overview on Analytical Measurements, Source Sampling and Its Source Apportionment. Front. Environ. Sci. Eng. 2021, 15, 126. [Google Scholar] [CrossRef]
- Gu, M.; Pan, Y.; Walters, W.W.; Sun, Q.; Song, L.; Wang, Y.; Xue, Y.; Fang, Y. Vehicular Emissions Enhanced Ammonia Concentrations in Winter Mornings: Insights from Diurnal Nitrogen Isotopic Signatures. Environ. Sci. Technol. 2022, 56, 1578–1585. [Google Scholar] [CrossRef]
Figure 1.
Ammonia emissions contributions by sector of activity at the regional scale (Grand Est), departmental scale (Marne) and urban scale (Reims) in 2019 (Source: ATMO Grand Est, Invent’Air V2021).
Figure 1.
Ammonia emissions contributions by sector of activity at the regional scale (Grand Est), departmental scale (Marne) and urban scale (Reims) in 2019 (Source: ATMO Grand Est, Invent’Air V2021).

Figure 2.
Location of the two measurement sites at the agglomeration scale (a) and location of Reims at the western European scale (b).
Figure 2.
Location of the two measurement sites at the agglomeration scale (a) and location of Reims at the western European scale (b).

Figure 3.
Seasonal meteorological data over the measurement period: precipitation, temperature and wind speed with daily minimum and maximum (Source of data: Météo France—Radome).
Figure 3.
Seasonal meteorological data over the measurement period: precipitation, temperature and wind speed with daily minimum and maximum (Source of data: Météo France—Radome).

Figure 4.
Evolution of annual ammonia concentrations at the background site with uncertainty (±0.5 µg/m3, see Appendix A) (2016–2021).
Figure 4.
Evolution of annual ammonia concentrations at the background site with uncertainty (±0.5 µg/m3, see Appendix A) (2016–2021).

Figure 5.
Seasonal boxplots at the background site from the 2016–2021 daily averages.

Figure 6.
Hourly ammonia concentrations at the background site (bright blue) and at the roadside site (dark blue) during the measurement campaign.
Figure 6.
Hourly ammonia concentrations at the background site (bright blue) and at the roadside site (dark blue) during the measurement campaign.

Figure 7.
Seasonal variations of ammonia concentrations at both sites with uncertainty bars (±0.5 µg/m3, see Appendix A) and the seasonal relative deviation between the two sites defined as: [(roadside-background)/background] × 100.
Figure 7.
Seasonal variations of ammonia concentrations at both sites with uncertainty bars (±0.5 µg/m3, see Appendix A) and the seasonal relative deviation between the two sites defined as: [(roadside-background)/background] × 100.

Figure 8.
Comparison of the hourly ammonia averages with a 95% confidence interval of the two sites over the measurement campaign (n = 14,998).
Figure 8.
Comparison of the hourly ammonia averages with a 95% confidence interval of the two sites over the measurement campaign (n = 14,998).

Figure 9.
Correlation between the hourly ammonia concentrations of the two sites (n = 14,998).

Figure 10.
Temporal variation of hourly ammonia concentration as a function of Black Carbon from fossil fuel combustion, mainly associated with road traffic (BCff in colored axis) concentration at the background site.
Figure 10.
Temporal variation of hourly ammonia concentration as a function of Black Carbon from fossil fuel combustion, mainly associated with road traffic (BCff in colored axis) concentration at the background site.

Figure 11.
Temporal variation of hourly ammonia concentration as a function of Black Carbon from fossil fuel combustion, mainly associated with road traffic (BCff in colored axis) concentration at the roadside site.
Figure 11.
Temporal variation of hourly ammonia concentration as a function of Black Carbon from fossil fuel combustion, mainly associated with road traffic (BCff in colored axis) concentration at the roadside site.

Figure 12.
Diurnal profile of ammonia concentrations according to the season at the background site.
Figure 12.
Diurnal profile of ammonia concentrations according to the season at the background site.

Figure 13.
Diurnal profile of ammonia concentrations according to the season at the roadside site.

Table 1.
Gas and particle analyzers for each measurement site.
| Compounds | Reims-Jean d’Aulan (Background) | Reims-Doumer (Roadside) |
|---|---|---|
| Ammonia | Yes | Yes |
| Nitrogen dioxide | Yes | Yes |
| Particles (PM10, PM2.5) | Yes | Yes |
| Black-Carbon | Yes | Yes |
| Ozone | Yes | No |
Table 2.
Seasonal variation of correlation parameters (slope and correlation coefficient).
| Season | Slope | Correlation Coefficient (R2) |
|---|---|---|
| Winter 2019 | 1.36 | 0.69 |
| Spring 2020 | 1.04 | 0.93 |
| Summer 2020 | 1.32 | 0.68 |
| Autumn 2020 | 1.44 | 0.75 |
| Winter 2020 | 1.11 | 0.92 |
| Spring 2021 | 1.12 | 0.93 |
| Summer 2021 | 1.44 | 0.68 |
Table 3.
Pearson correlation coefficients between ammonia and other air pollutants and temperature at the background site (top) and roadside site (bottom) according to the season. The winter and autumn seasons are presented below; the other seasons of the measurement campaign are available in Appendix C.
| Background Site Ammonia | |||
|---|---|---|---|
| Compounds | Winter 2019 | Autumn 2020 | Winter 2020 |
| BCff | 0.6 | 0.3 | 0.1 |
| BCwb | 0.5 | 0.4 | 0.1 |
| PM10_Roadside | 0.5 | 0.4 | 0.6 |
| PM10_Background | 0.6 | 0.5 | 0.8 |
| PM2.5 both sites | 0.6 | 0.6 | 0.4 |
| NOx | 0.4 | 0.3 | 0.0 |
| Ozone | −0.5 | −0.4 | 0.1 |
| Temperature | −0.4 | −0.2 | 0.4 |
| Roadside Site Ammonia | |||
| Compounds | Winter 2019 | Autumn 2020 | Winter 2020 |
| BCff | 0.6 | 0.6 | 0.2 |
| BCwb | 0.7 | 0.5 | 0.1 |
| PM10_Roadside | 0.7 | 0.7 | 0.6 |
| PM10_Background | 0.7 | 0.7 | 0.8 |
| PM2.5 both sites | 0.7 | 0.8 | 0.4 |
| NOx | 0.6 | 0.6 | 0.1 |
| Ozone | −0.7 | −0.6 | 0.0 |
| Temperature | −0.3 | −0.4 | 0.4 |
Publisher’s Note: MDPI stays neutral with regard to jurisdictional claims in published maps and institutional affiliations. |
© 2022 by the authors. Licensee MDPI, Basel, Switzerland. This article is an open access article distributed under the terms and conditions of the Creative Commons Attribution (CC BY) license (https://creativecommons.org/licenses/by/4.0/).
Share and Cite
MDPI and ACS Style
Chatain, M.; Chretien, E.; Crunaire, S.; Jantzem, E. Road Traffic and Its Influence on Urban Ammonia Concentrations (France). Atmosphere 2022, 13, 1032. https://0-doi-org.brum.beds.ac.uk/10.3390/atmos13071032
AMA Style
Chatain M, Chretien E, Crunaire S, Jantzem E. Road Traffic and Its Influence on Urban Ammonia Concentrations (France). Atmosphere. 2022; 13(7):1032. https://0-doi-org.brum.beds.ac.uk/10.3390/atmos13071032
Chicago/Turabian StyleChatain, Mélodie, Eve Chretien, Sabine Crunaire, and Emmanuel Jantzem. 2022. "Road Traffic and Its Influence on Urban Ammonia Concentrations (France)" Atmosphere 13, no. 7: 1032. https://0-doi-org.brum.beds.ac.uk/10.3390/atmos13071032
Note that from the first issue of 2016, this journal uses article numbers instead of page numbers. See further details here.