
Analyzing Thermal Comfort Sensations in Semi-Outdoor Space on a University Campus: On-Site Measurements in Tehran’s Hot and Cold Seasons


Abstract
:1. Introduction
2. Materials and Methods
2.1. Research Area
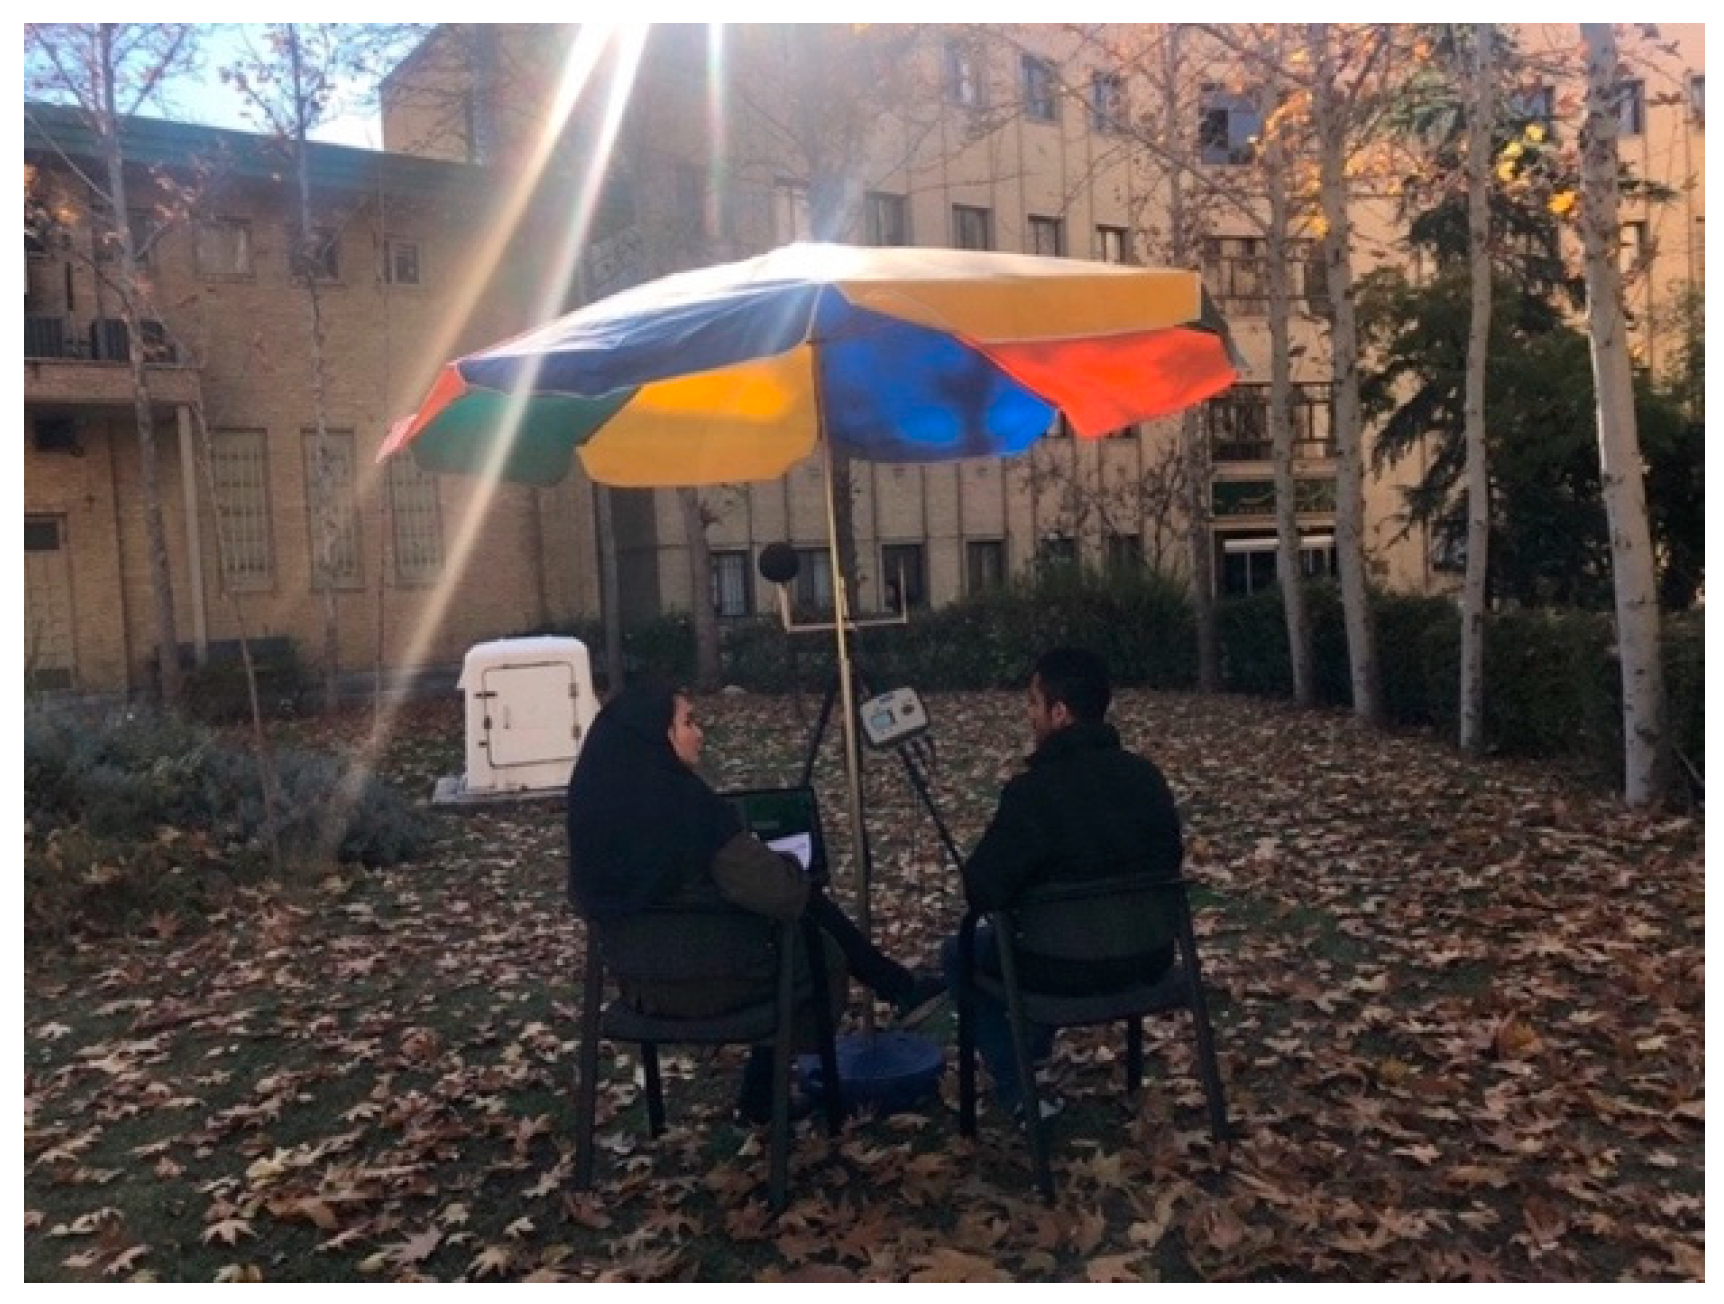
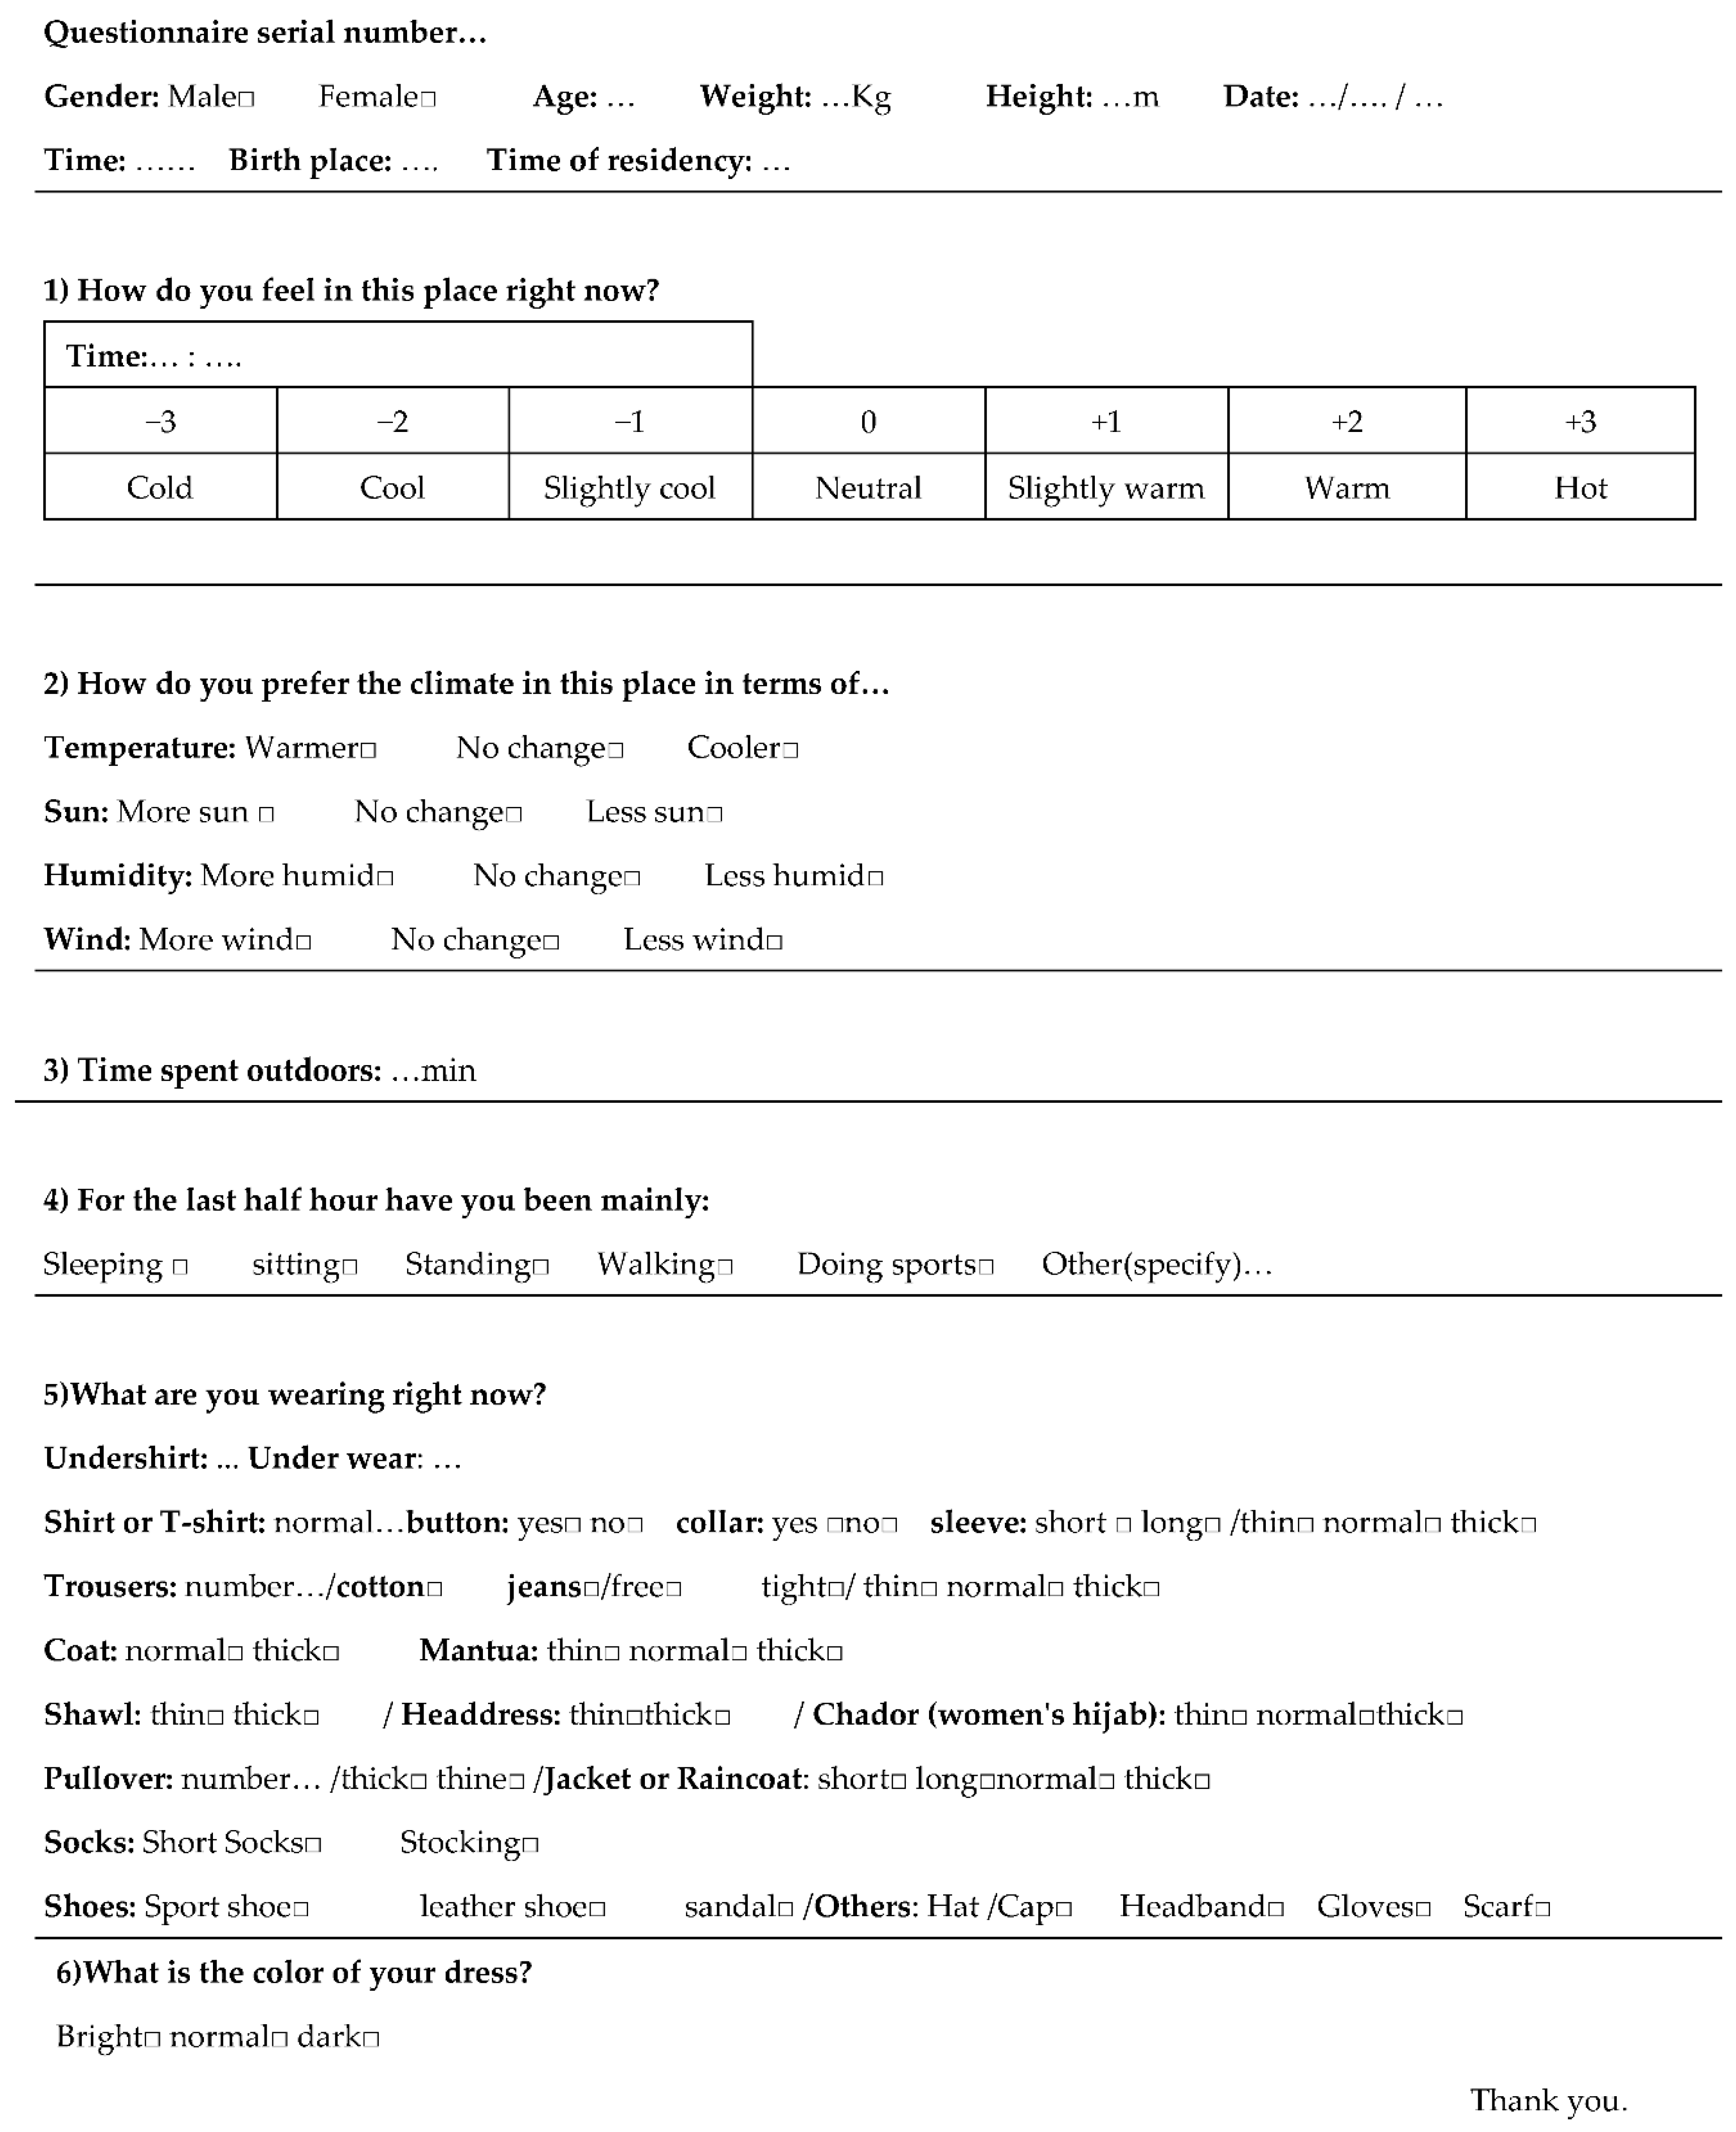
2.2. Field Survey
2.3. Acquiring Additional Data about Indices Calculation
3. Results
3.1. Micrometeorological Measurement
3.2. Thermal Comfort during the Survey
3.2.1. Impact of Personal Variables on Thermal Sensation and Thermal Preferences
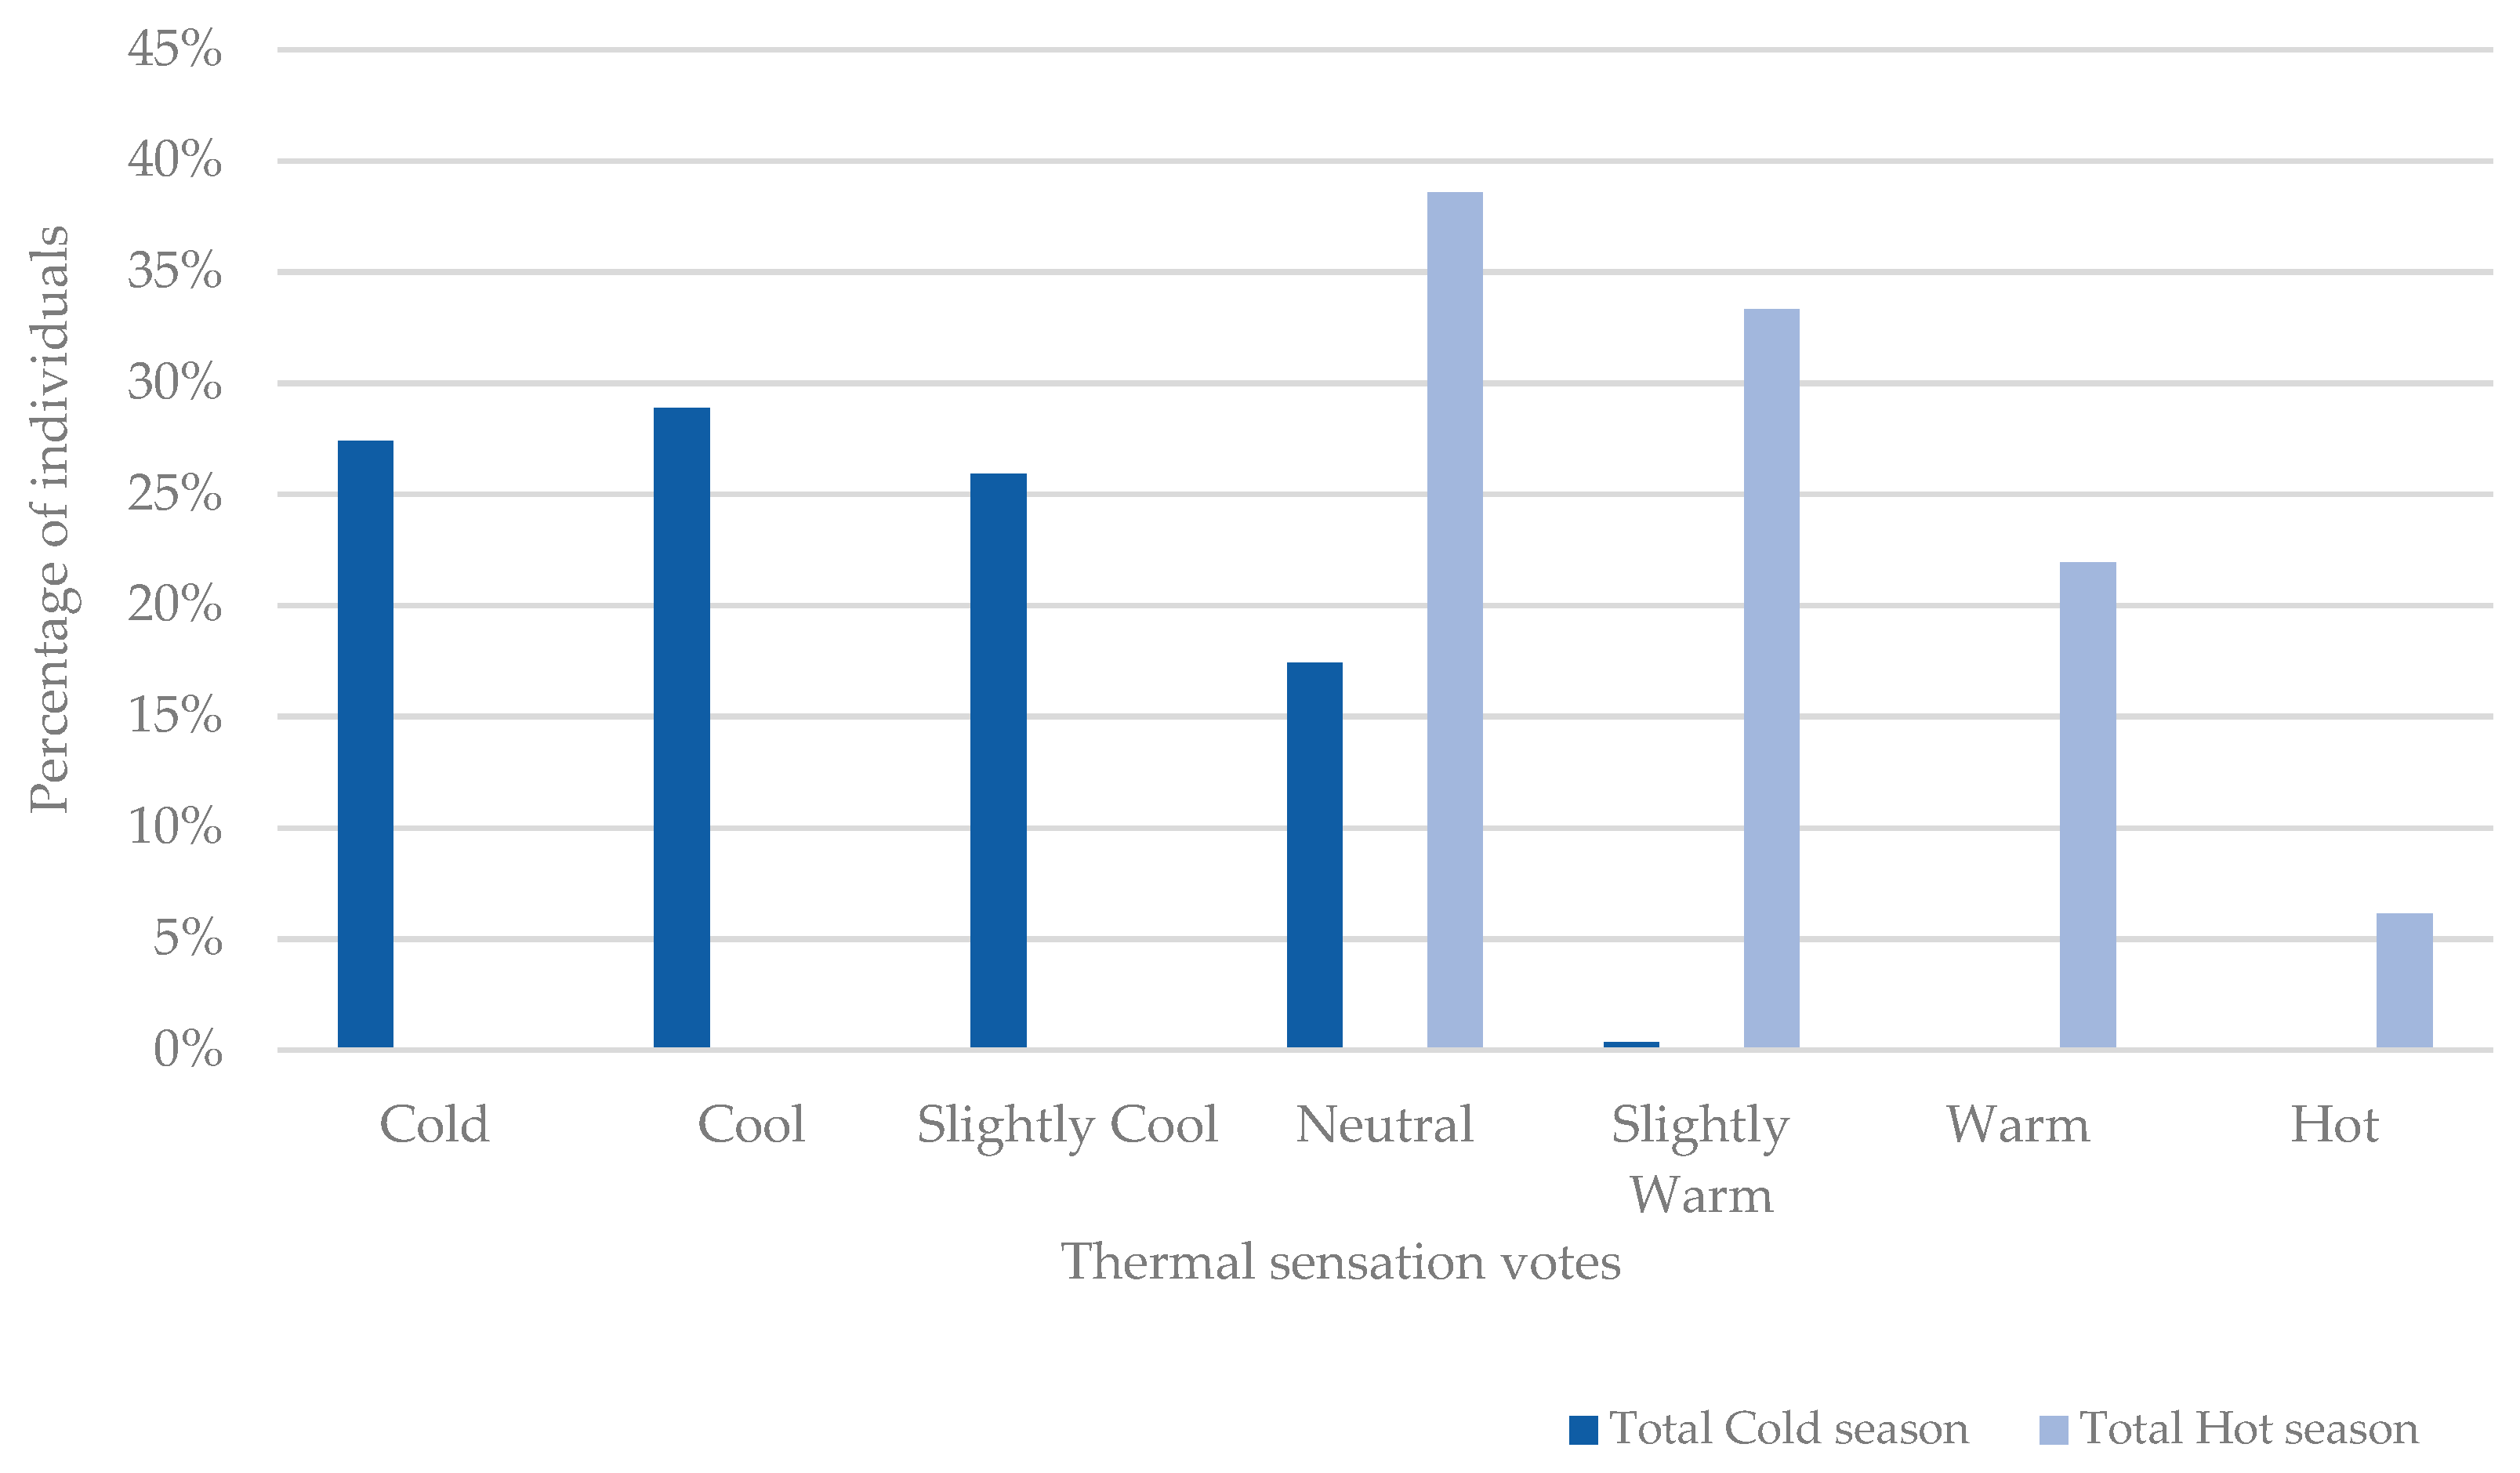
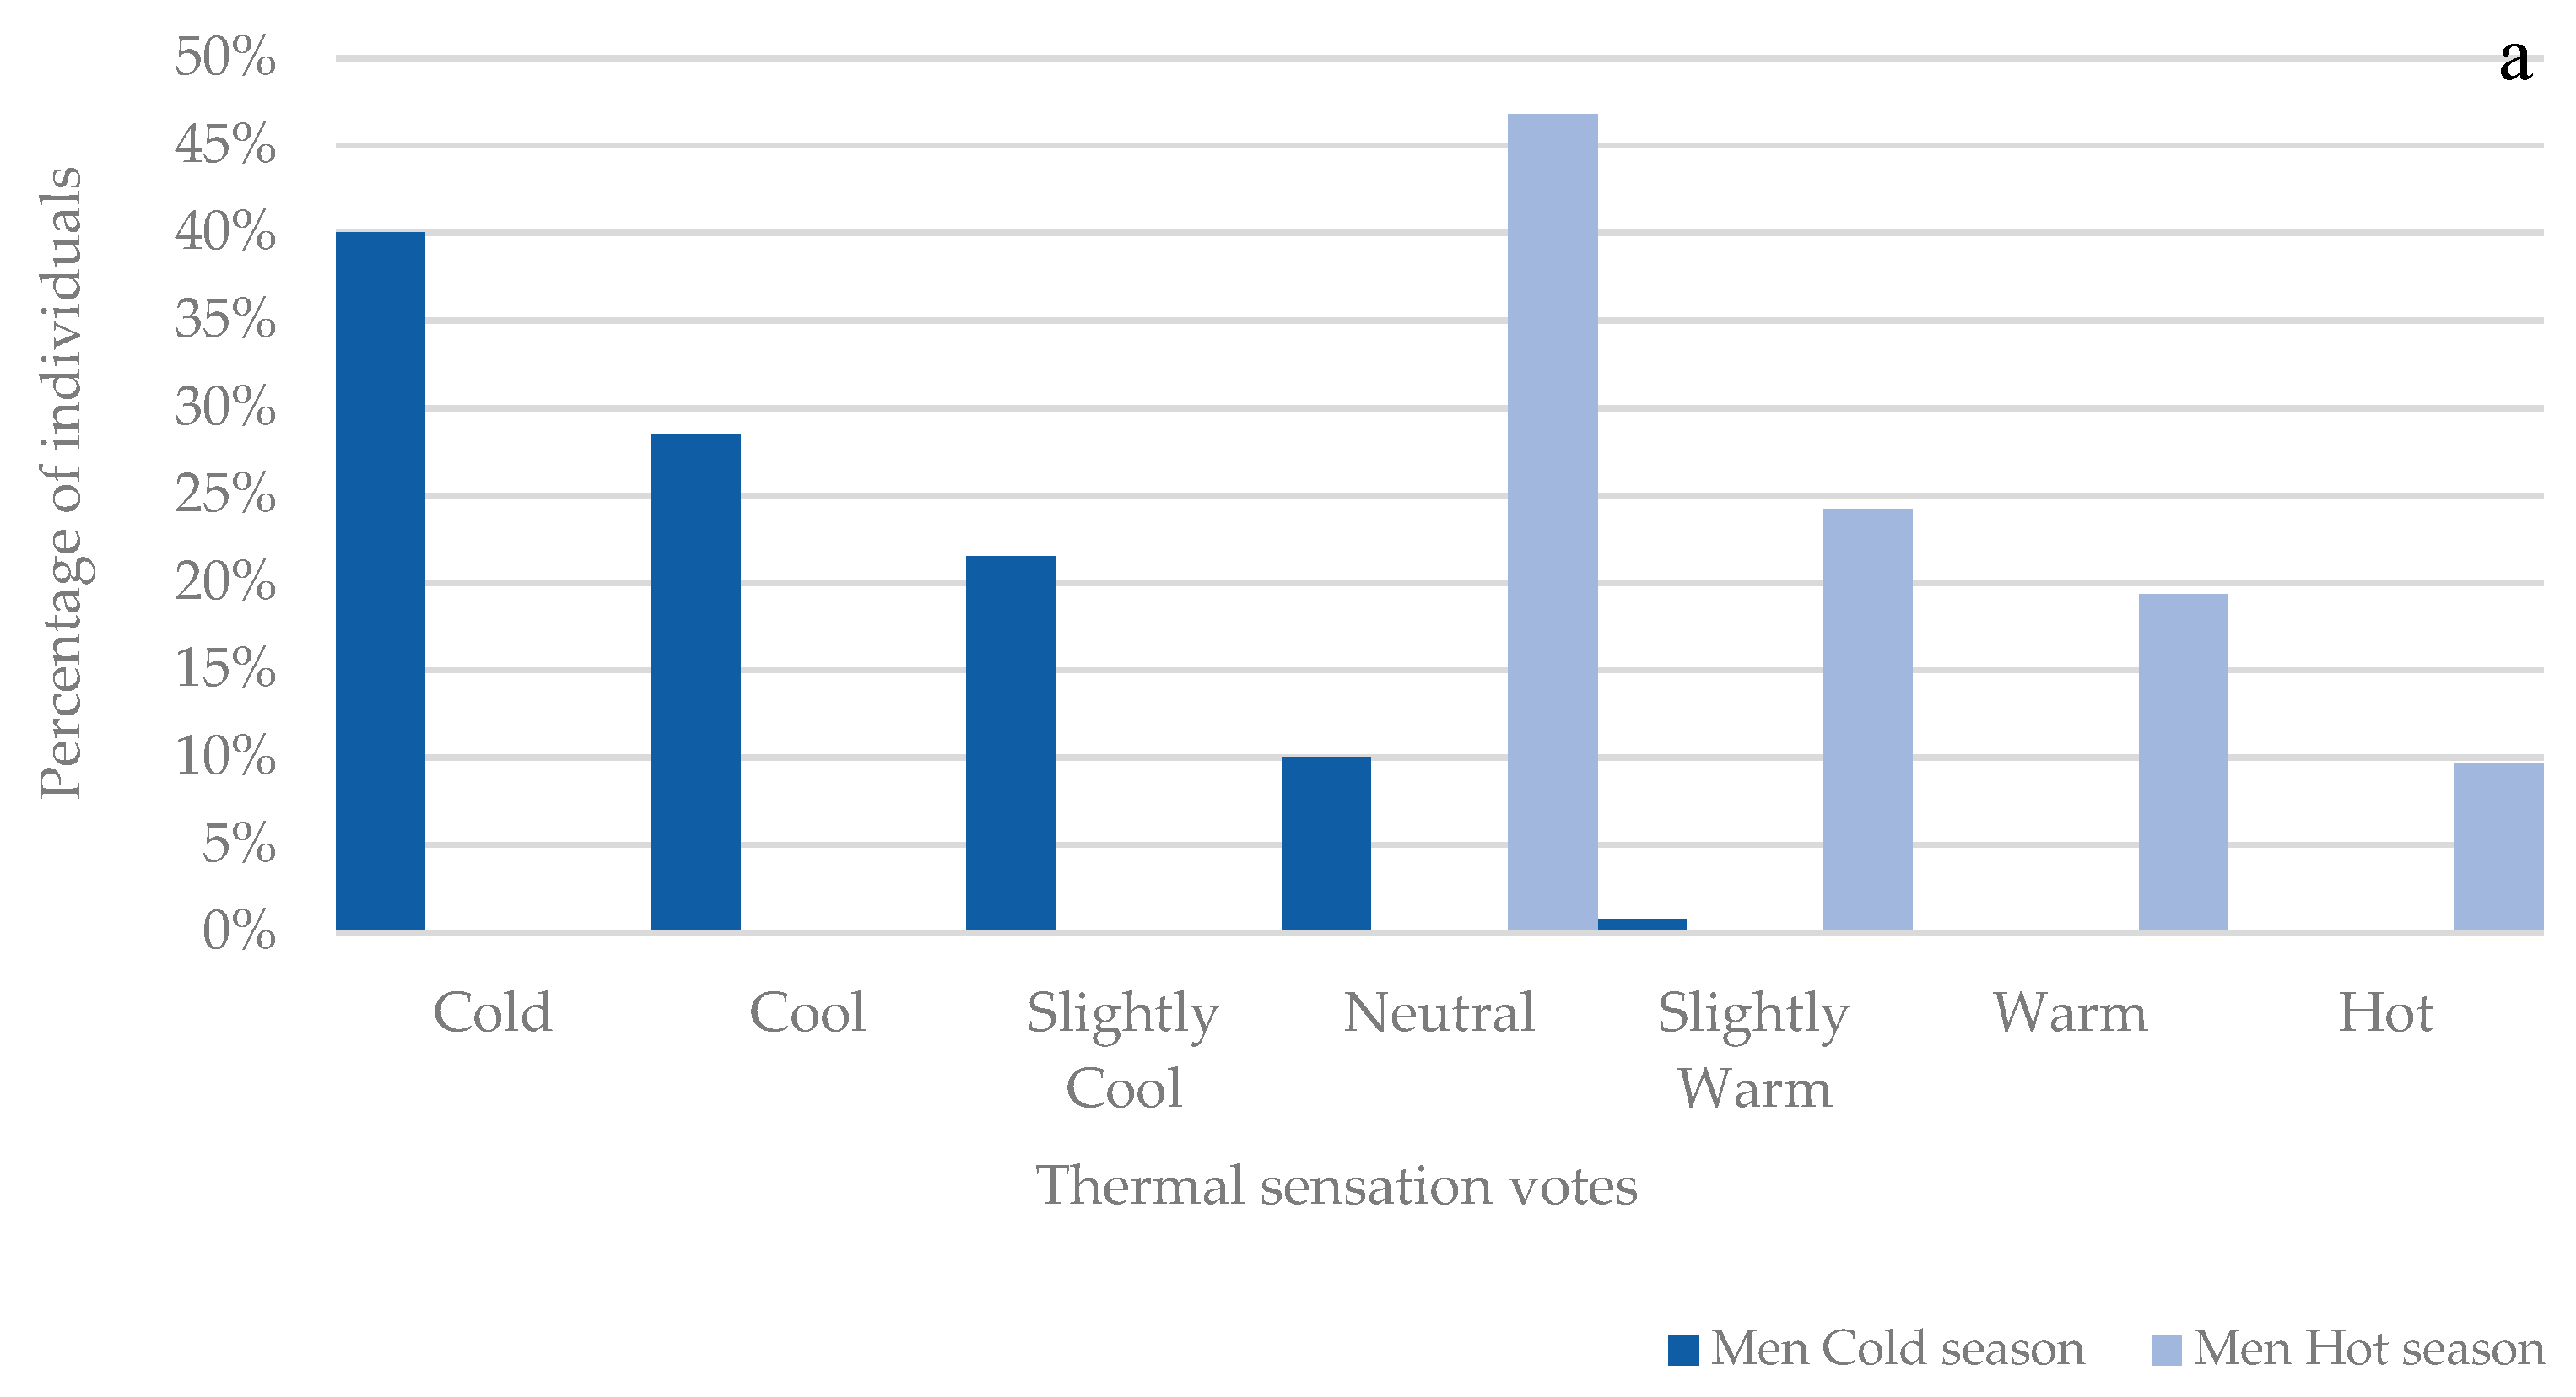
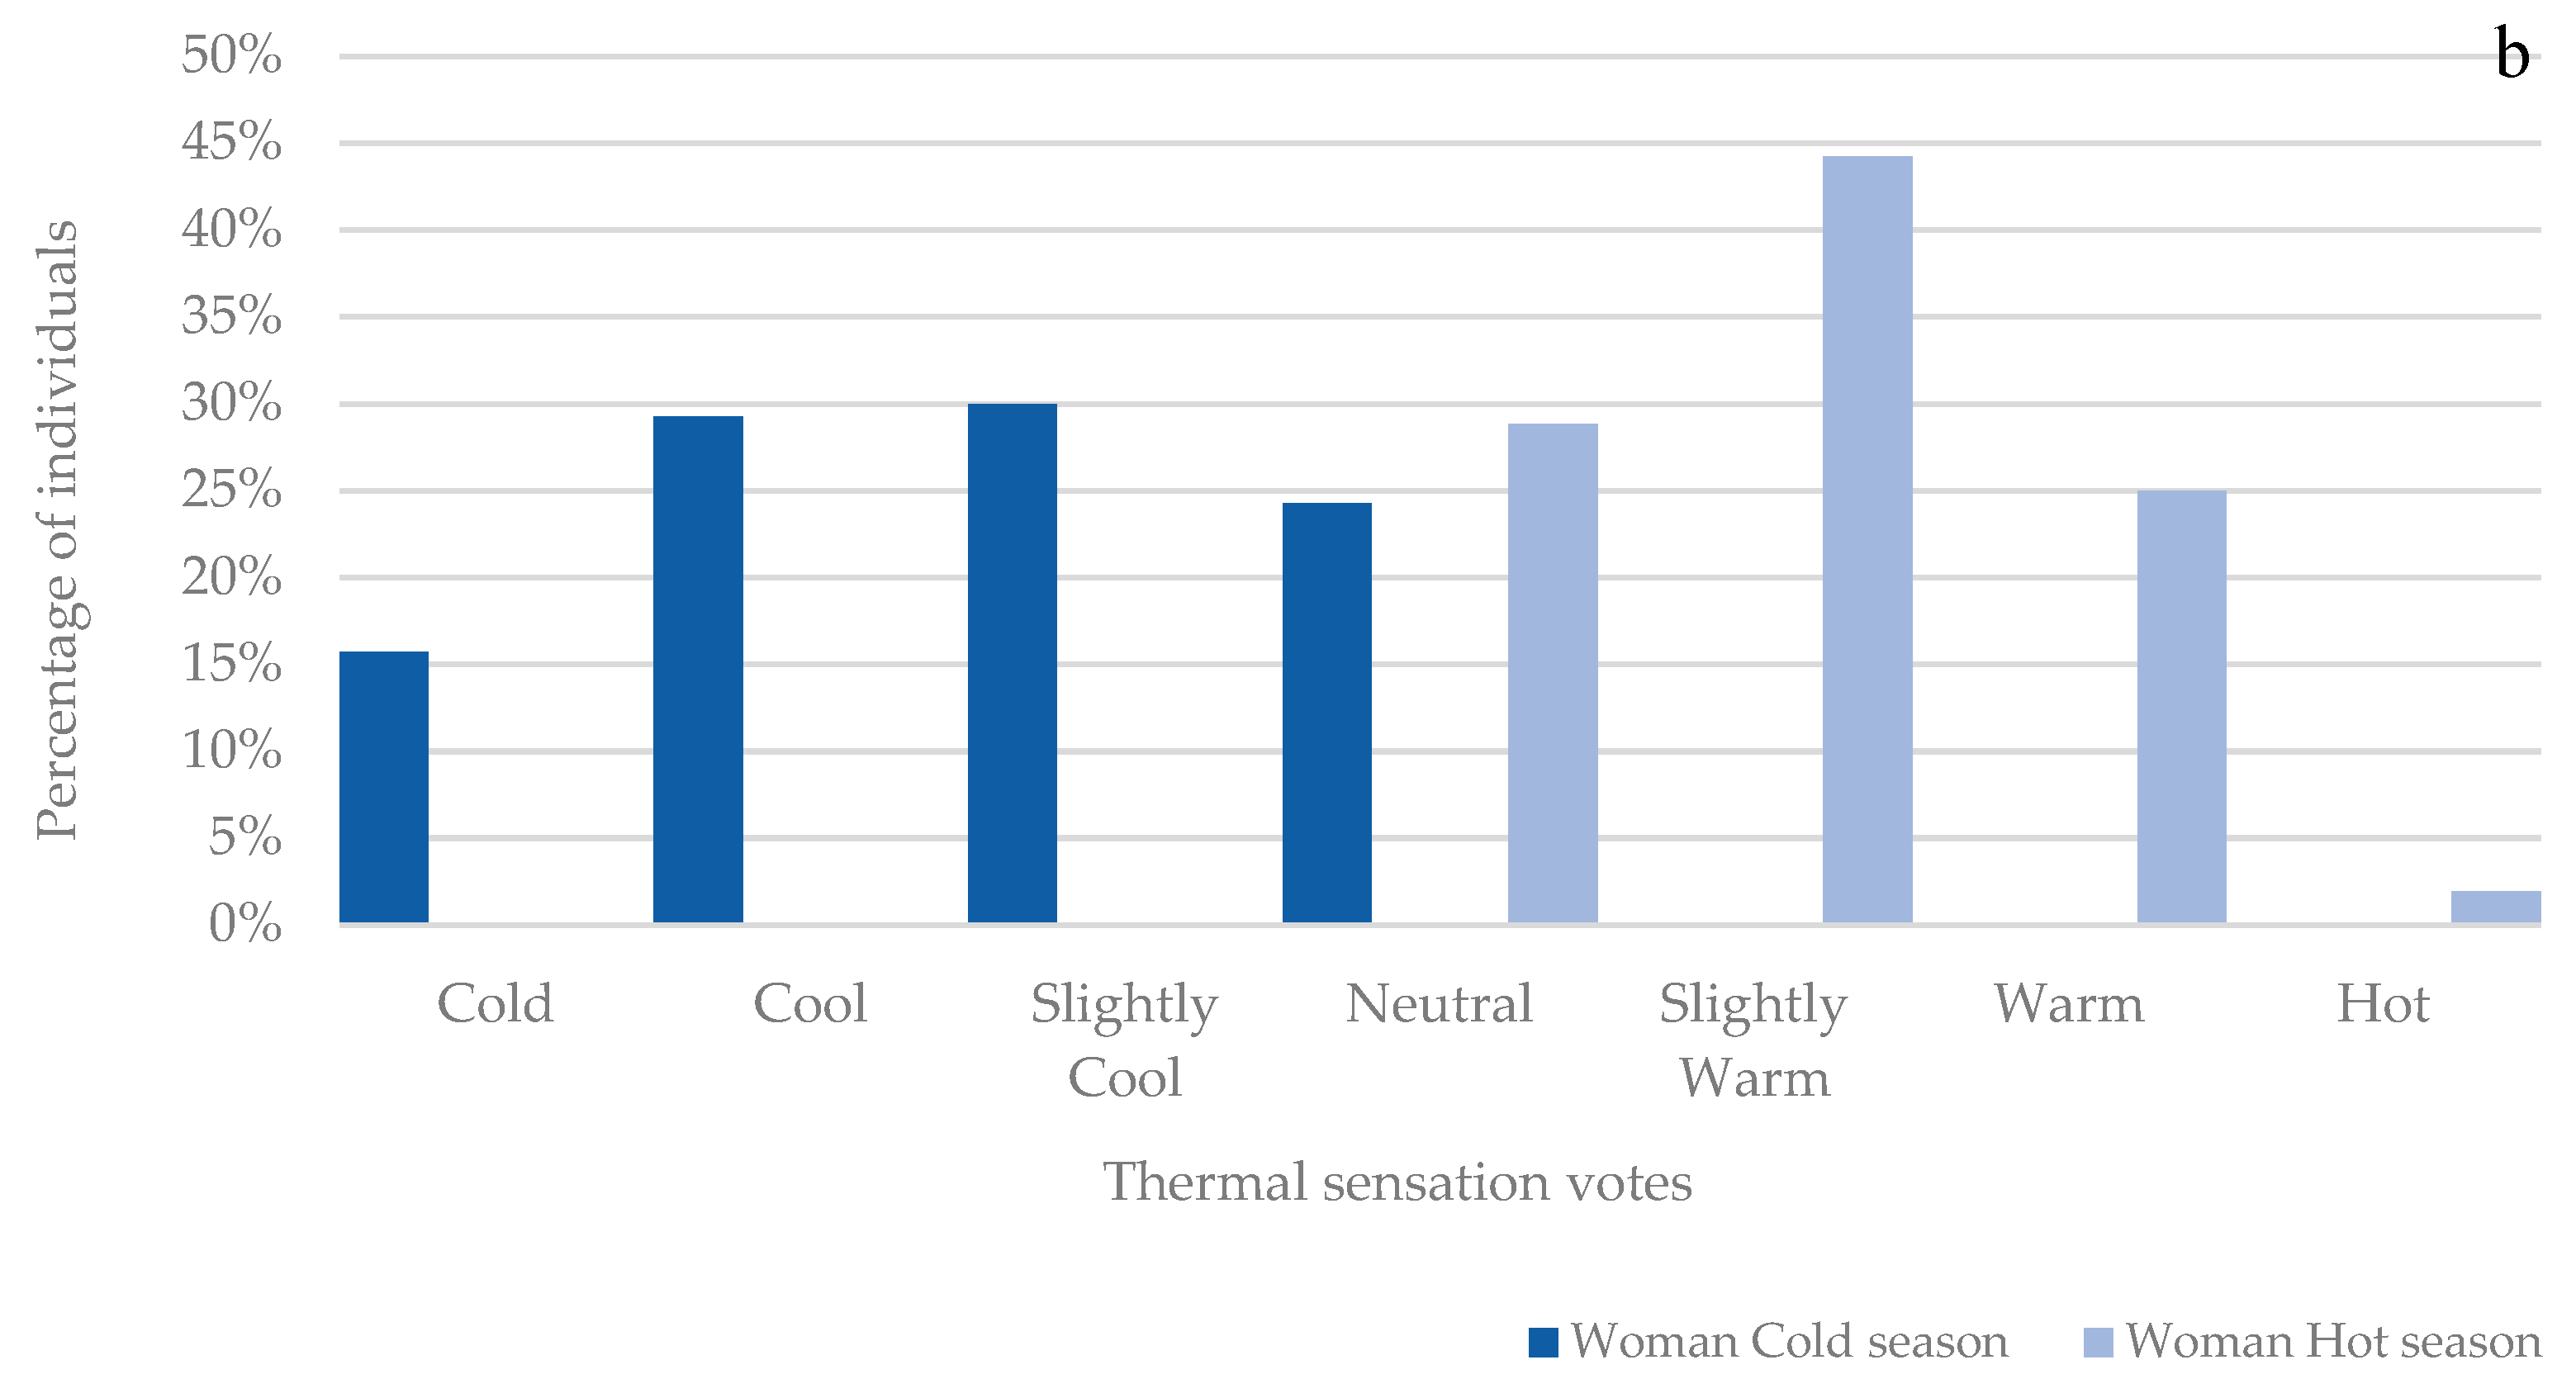
Thermal Sensation Votes and Gender Differences
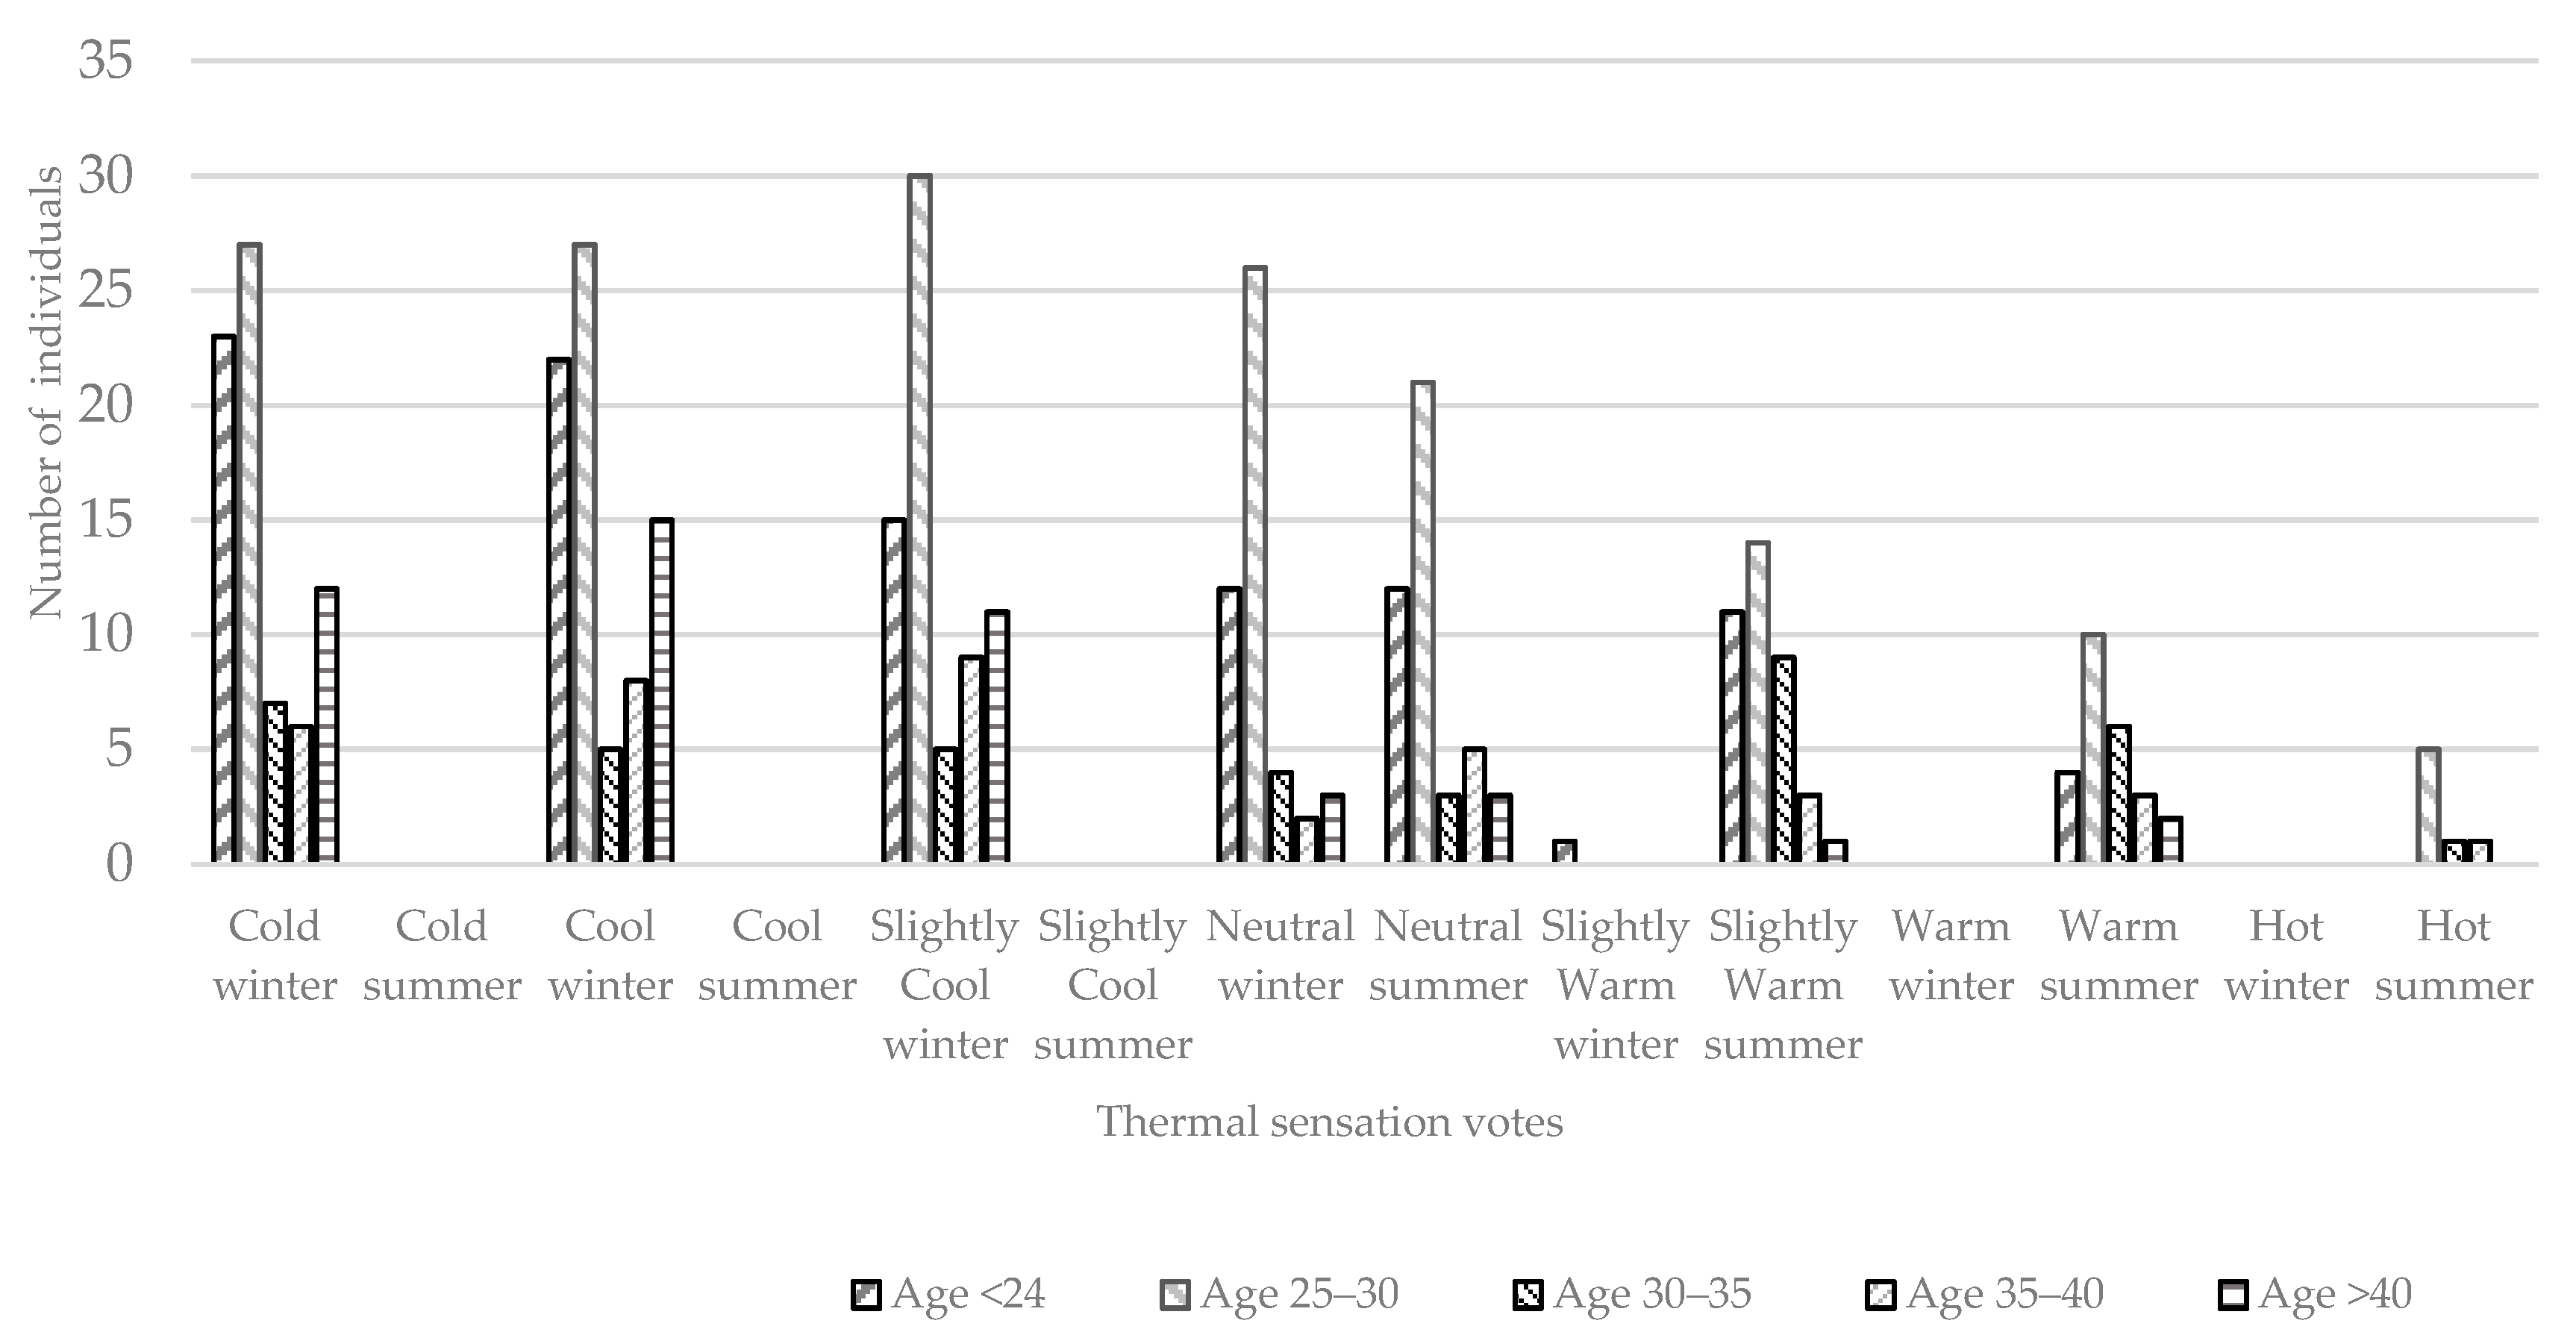
Age Differences
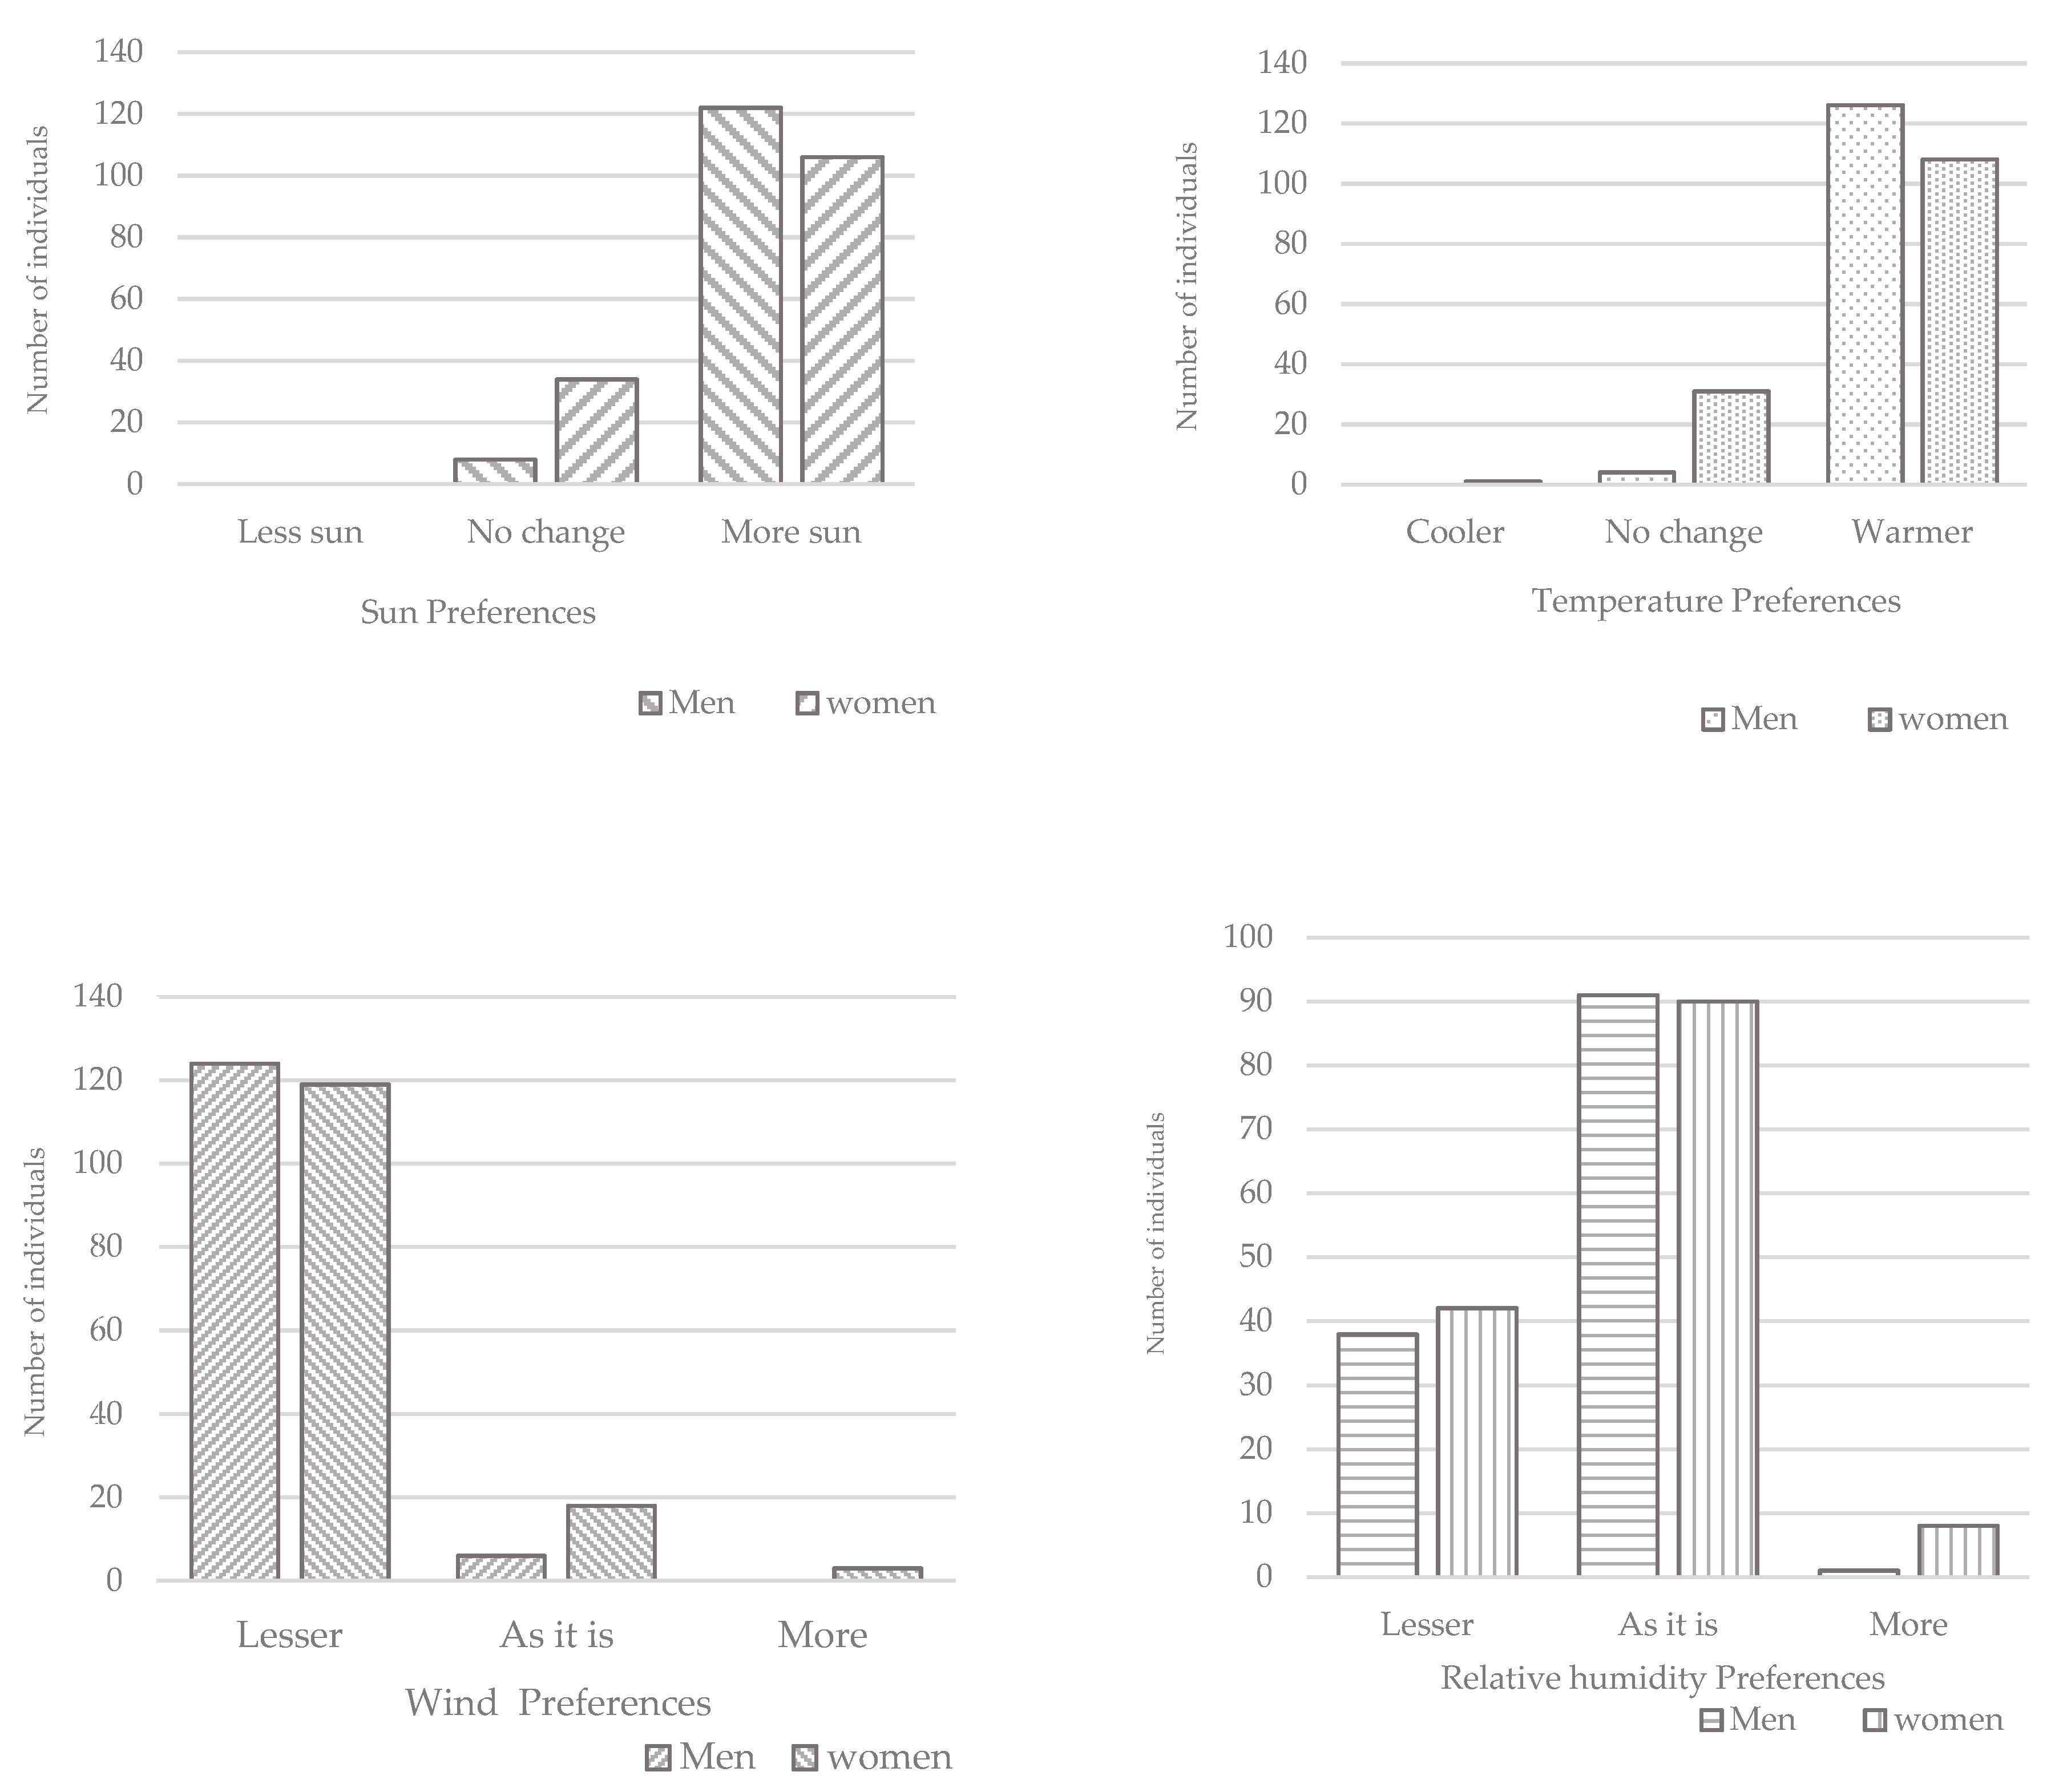
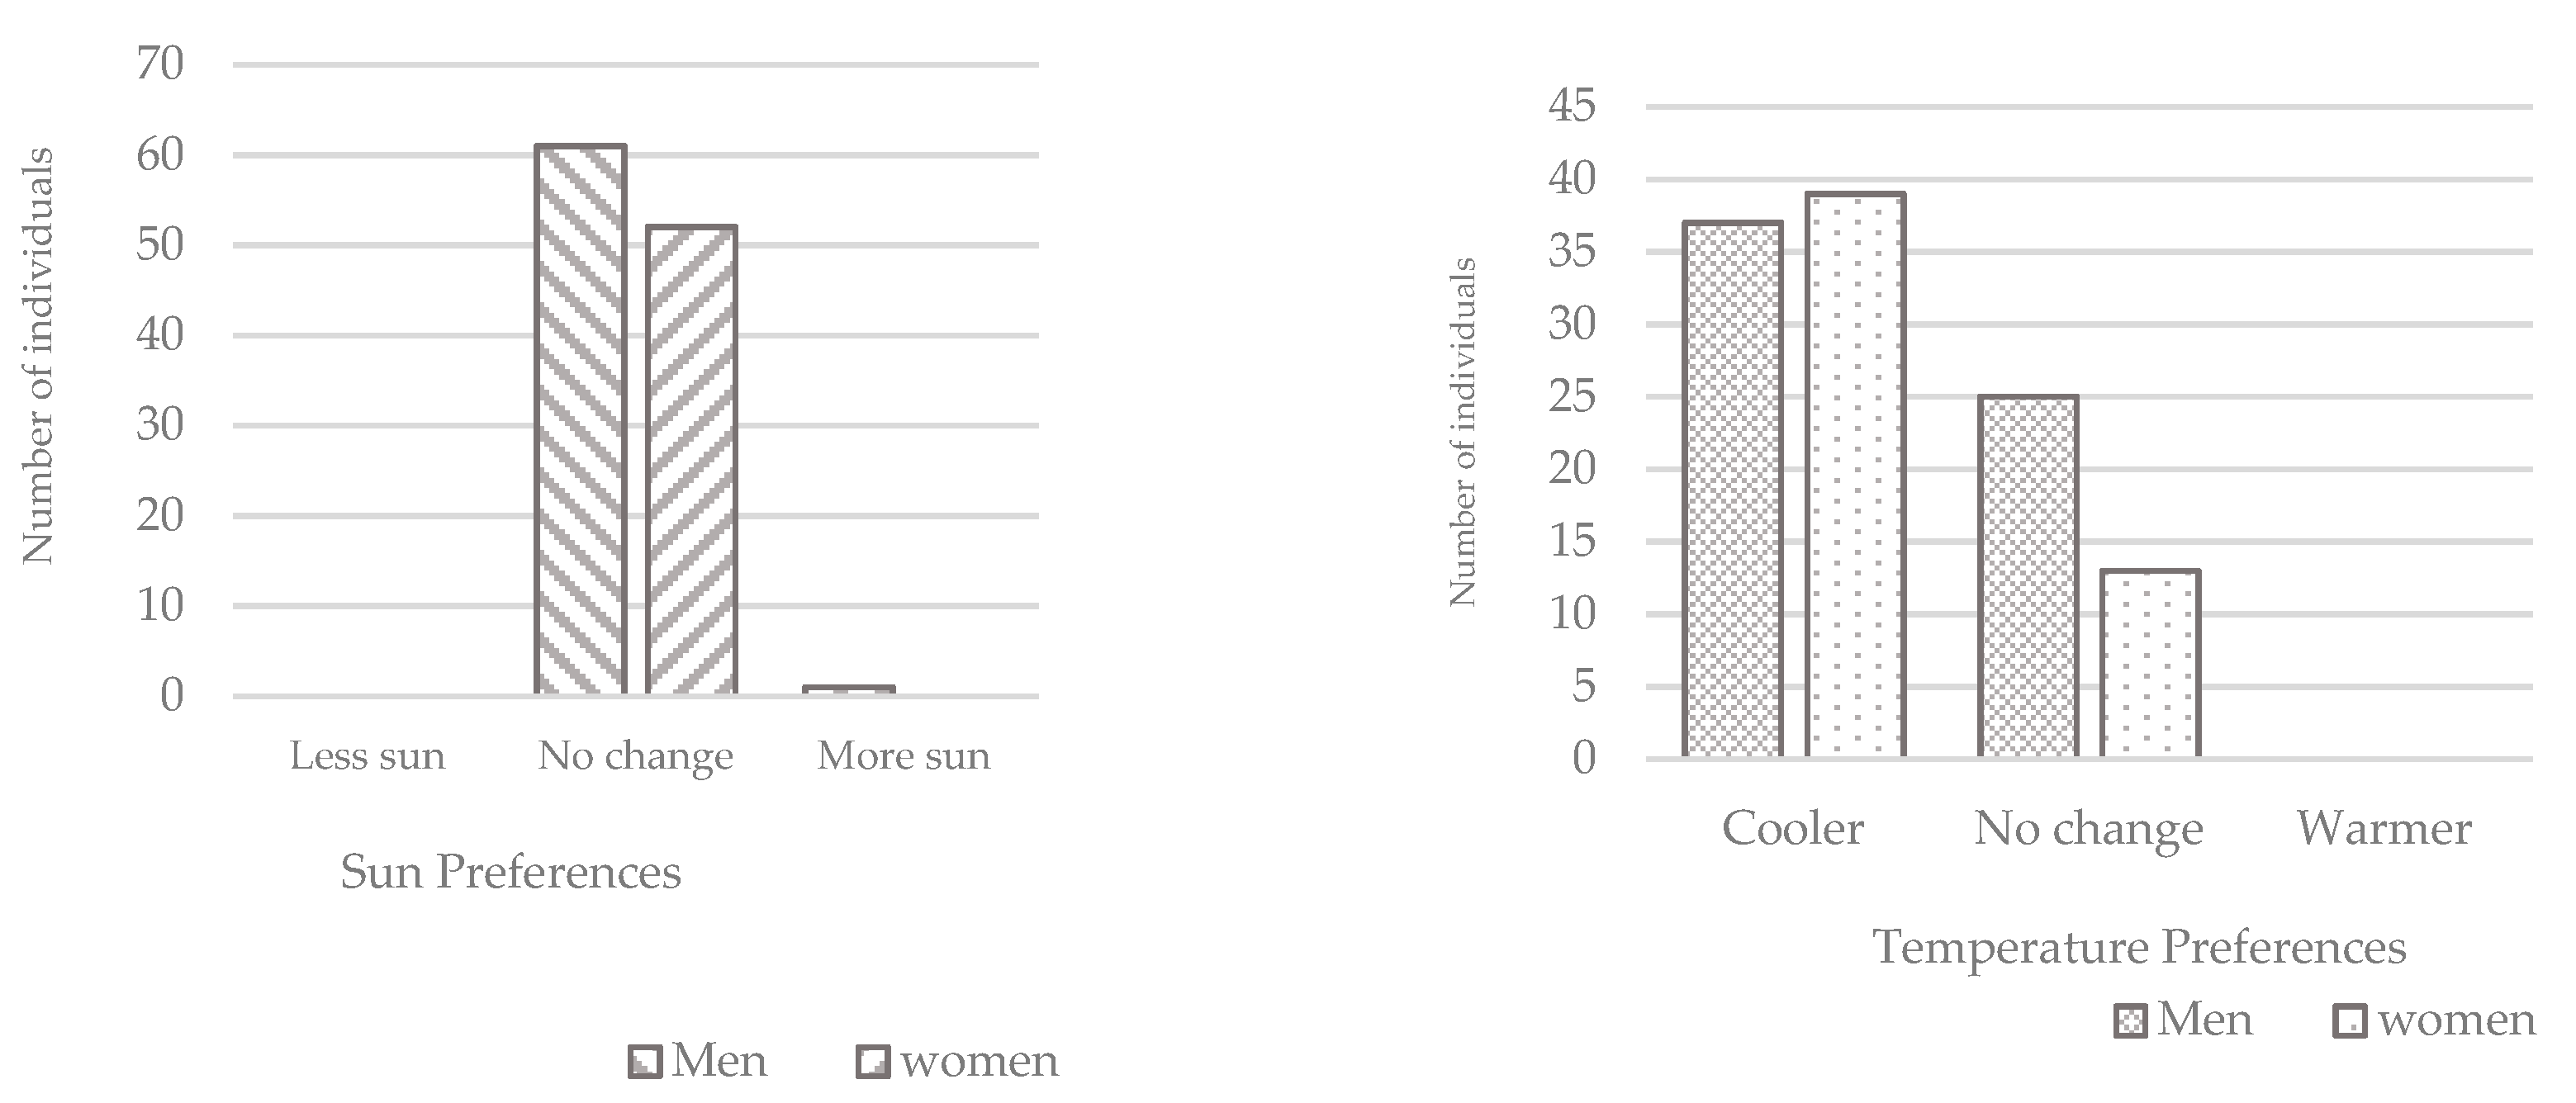
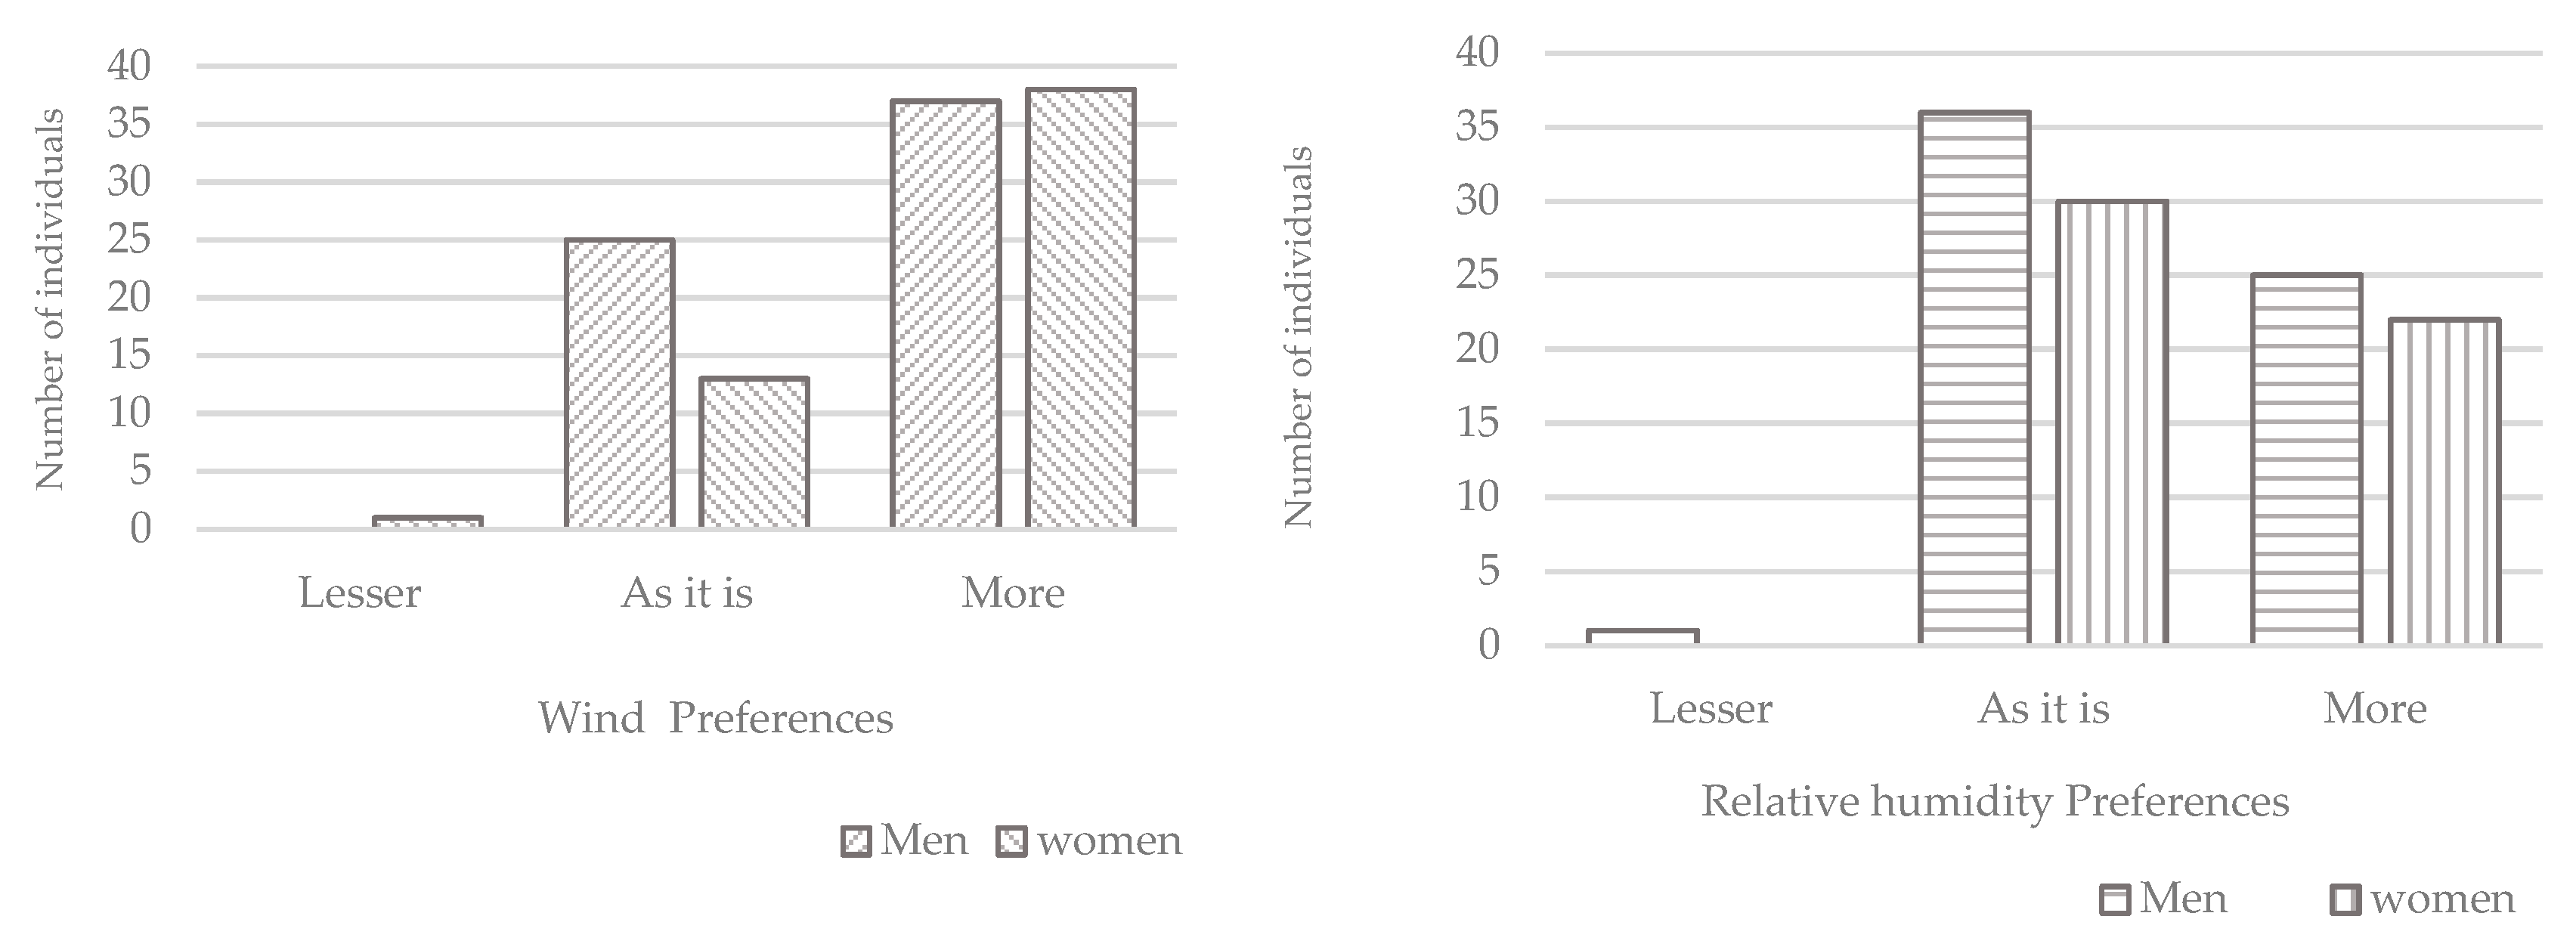
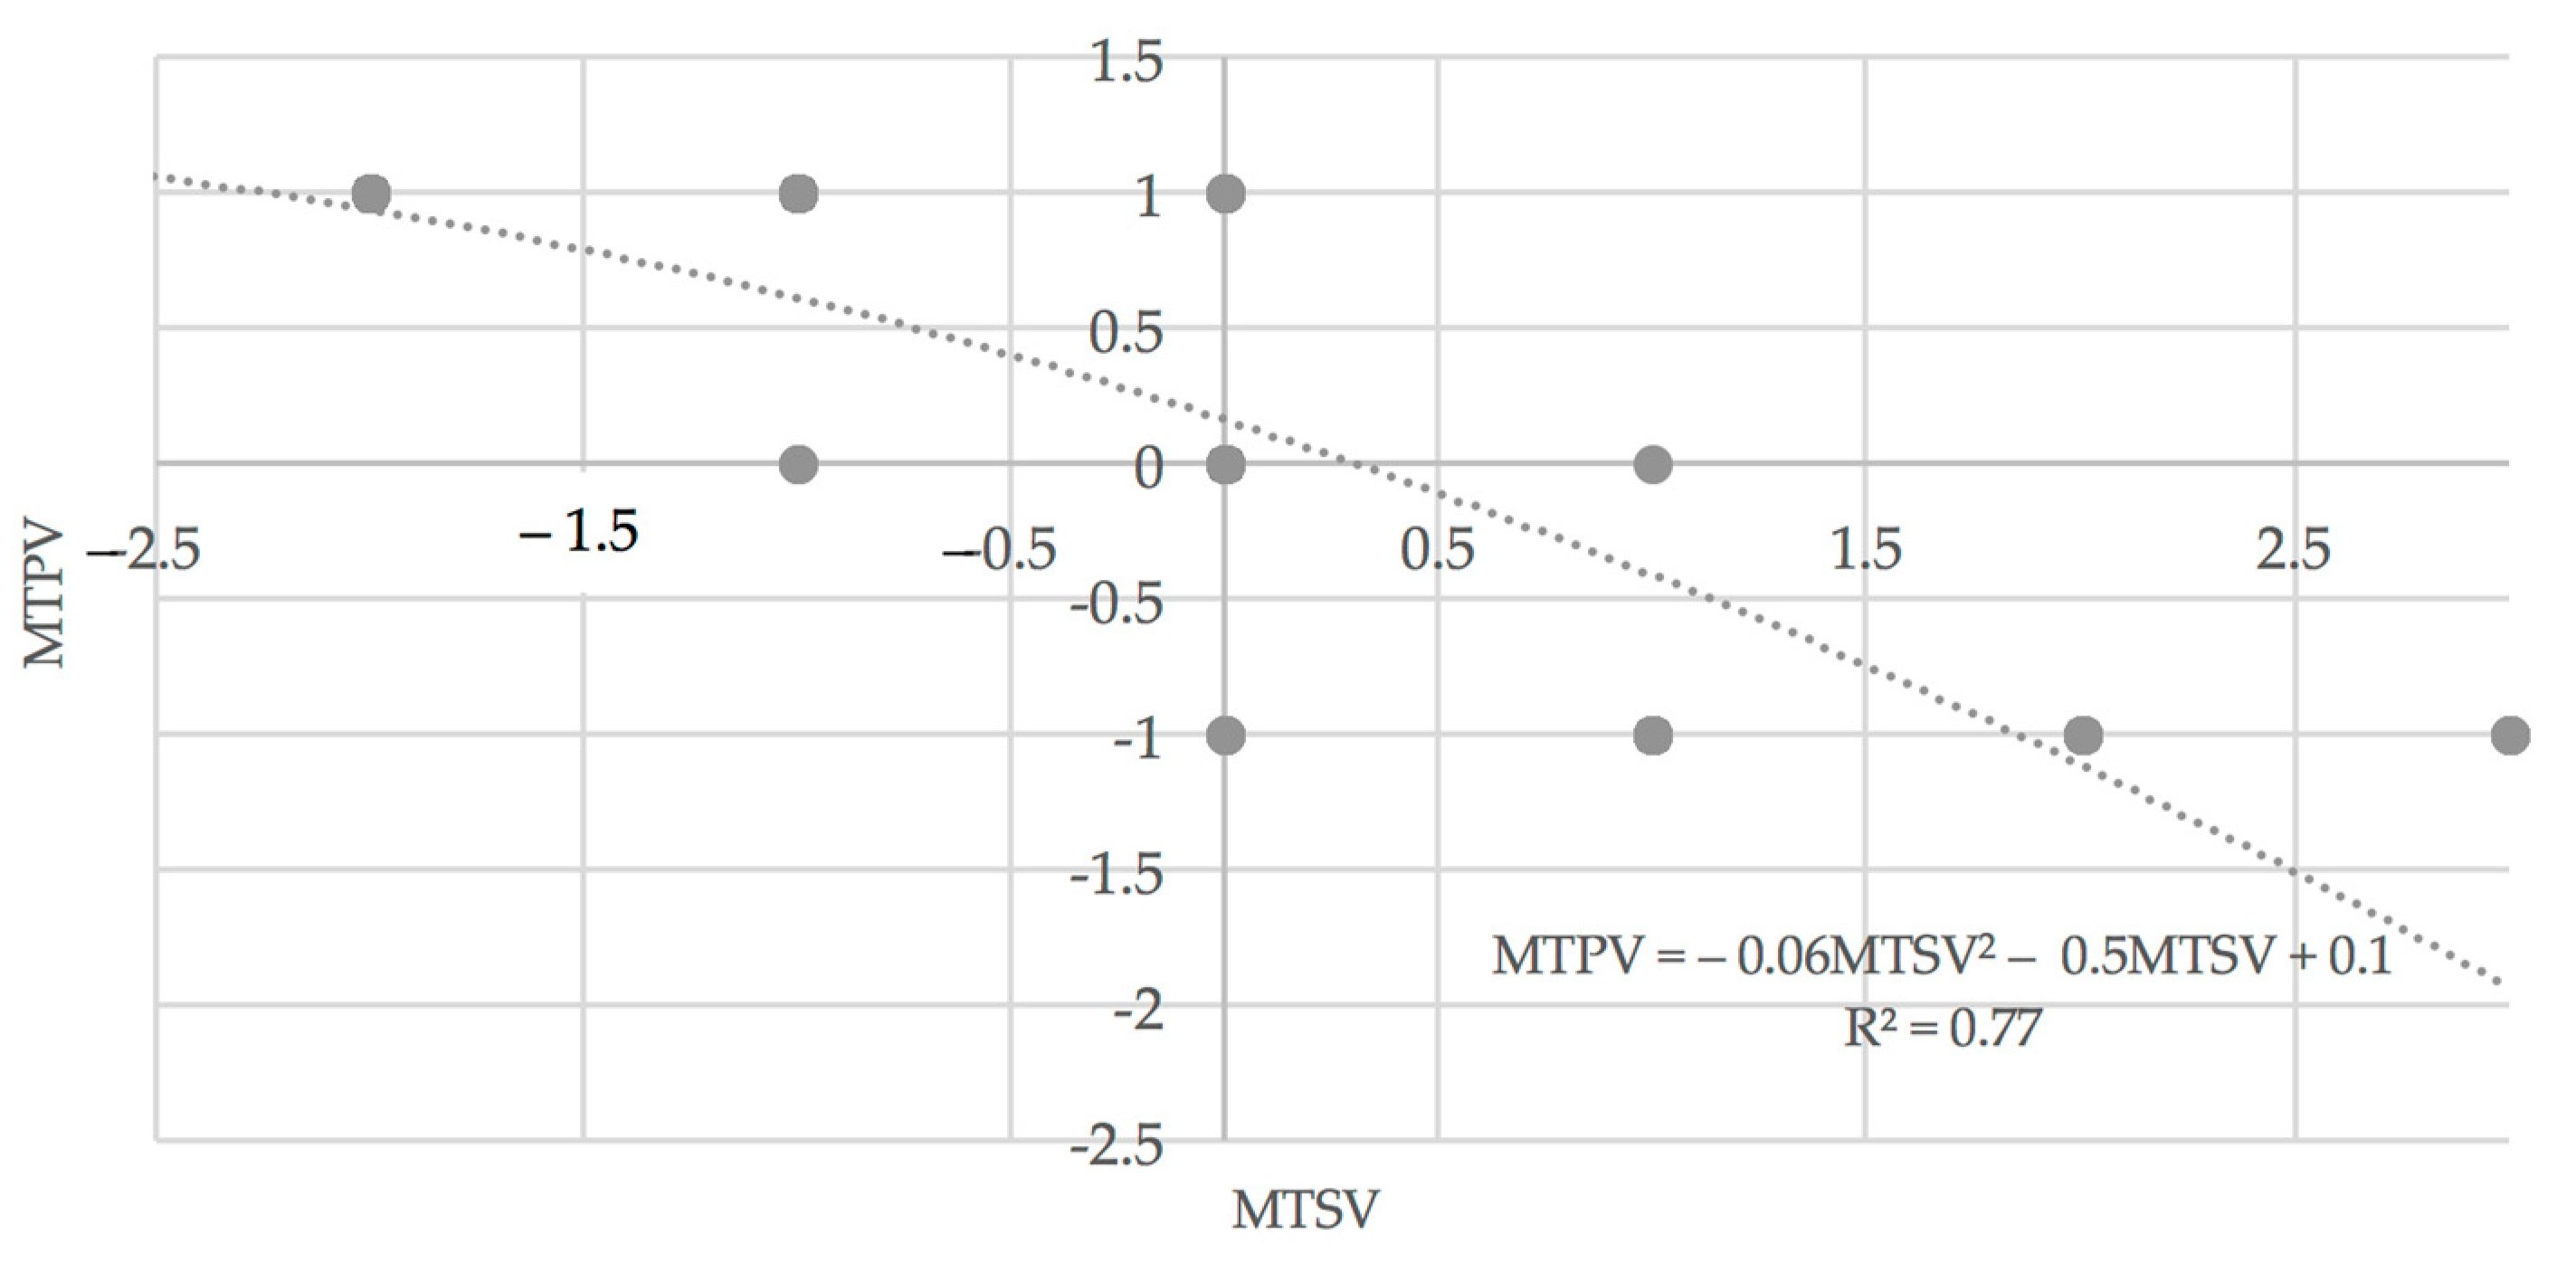
3.2.2. A Comparison of Thermal Sensations with Thermal Preferences
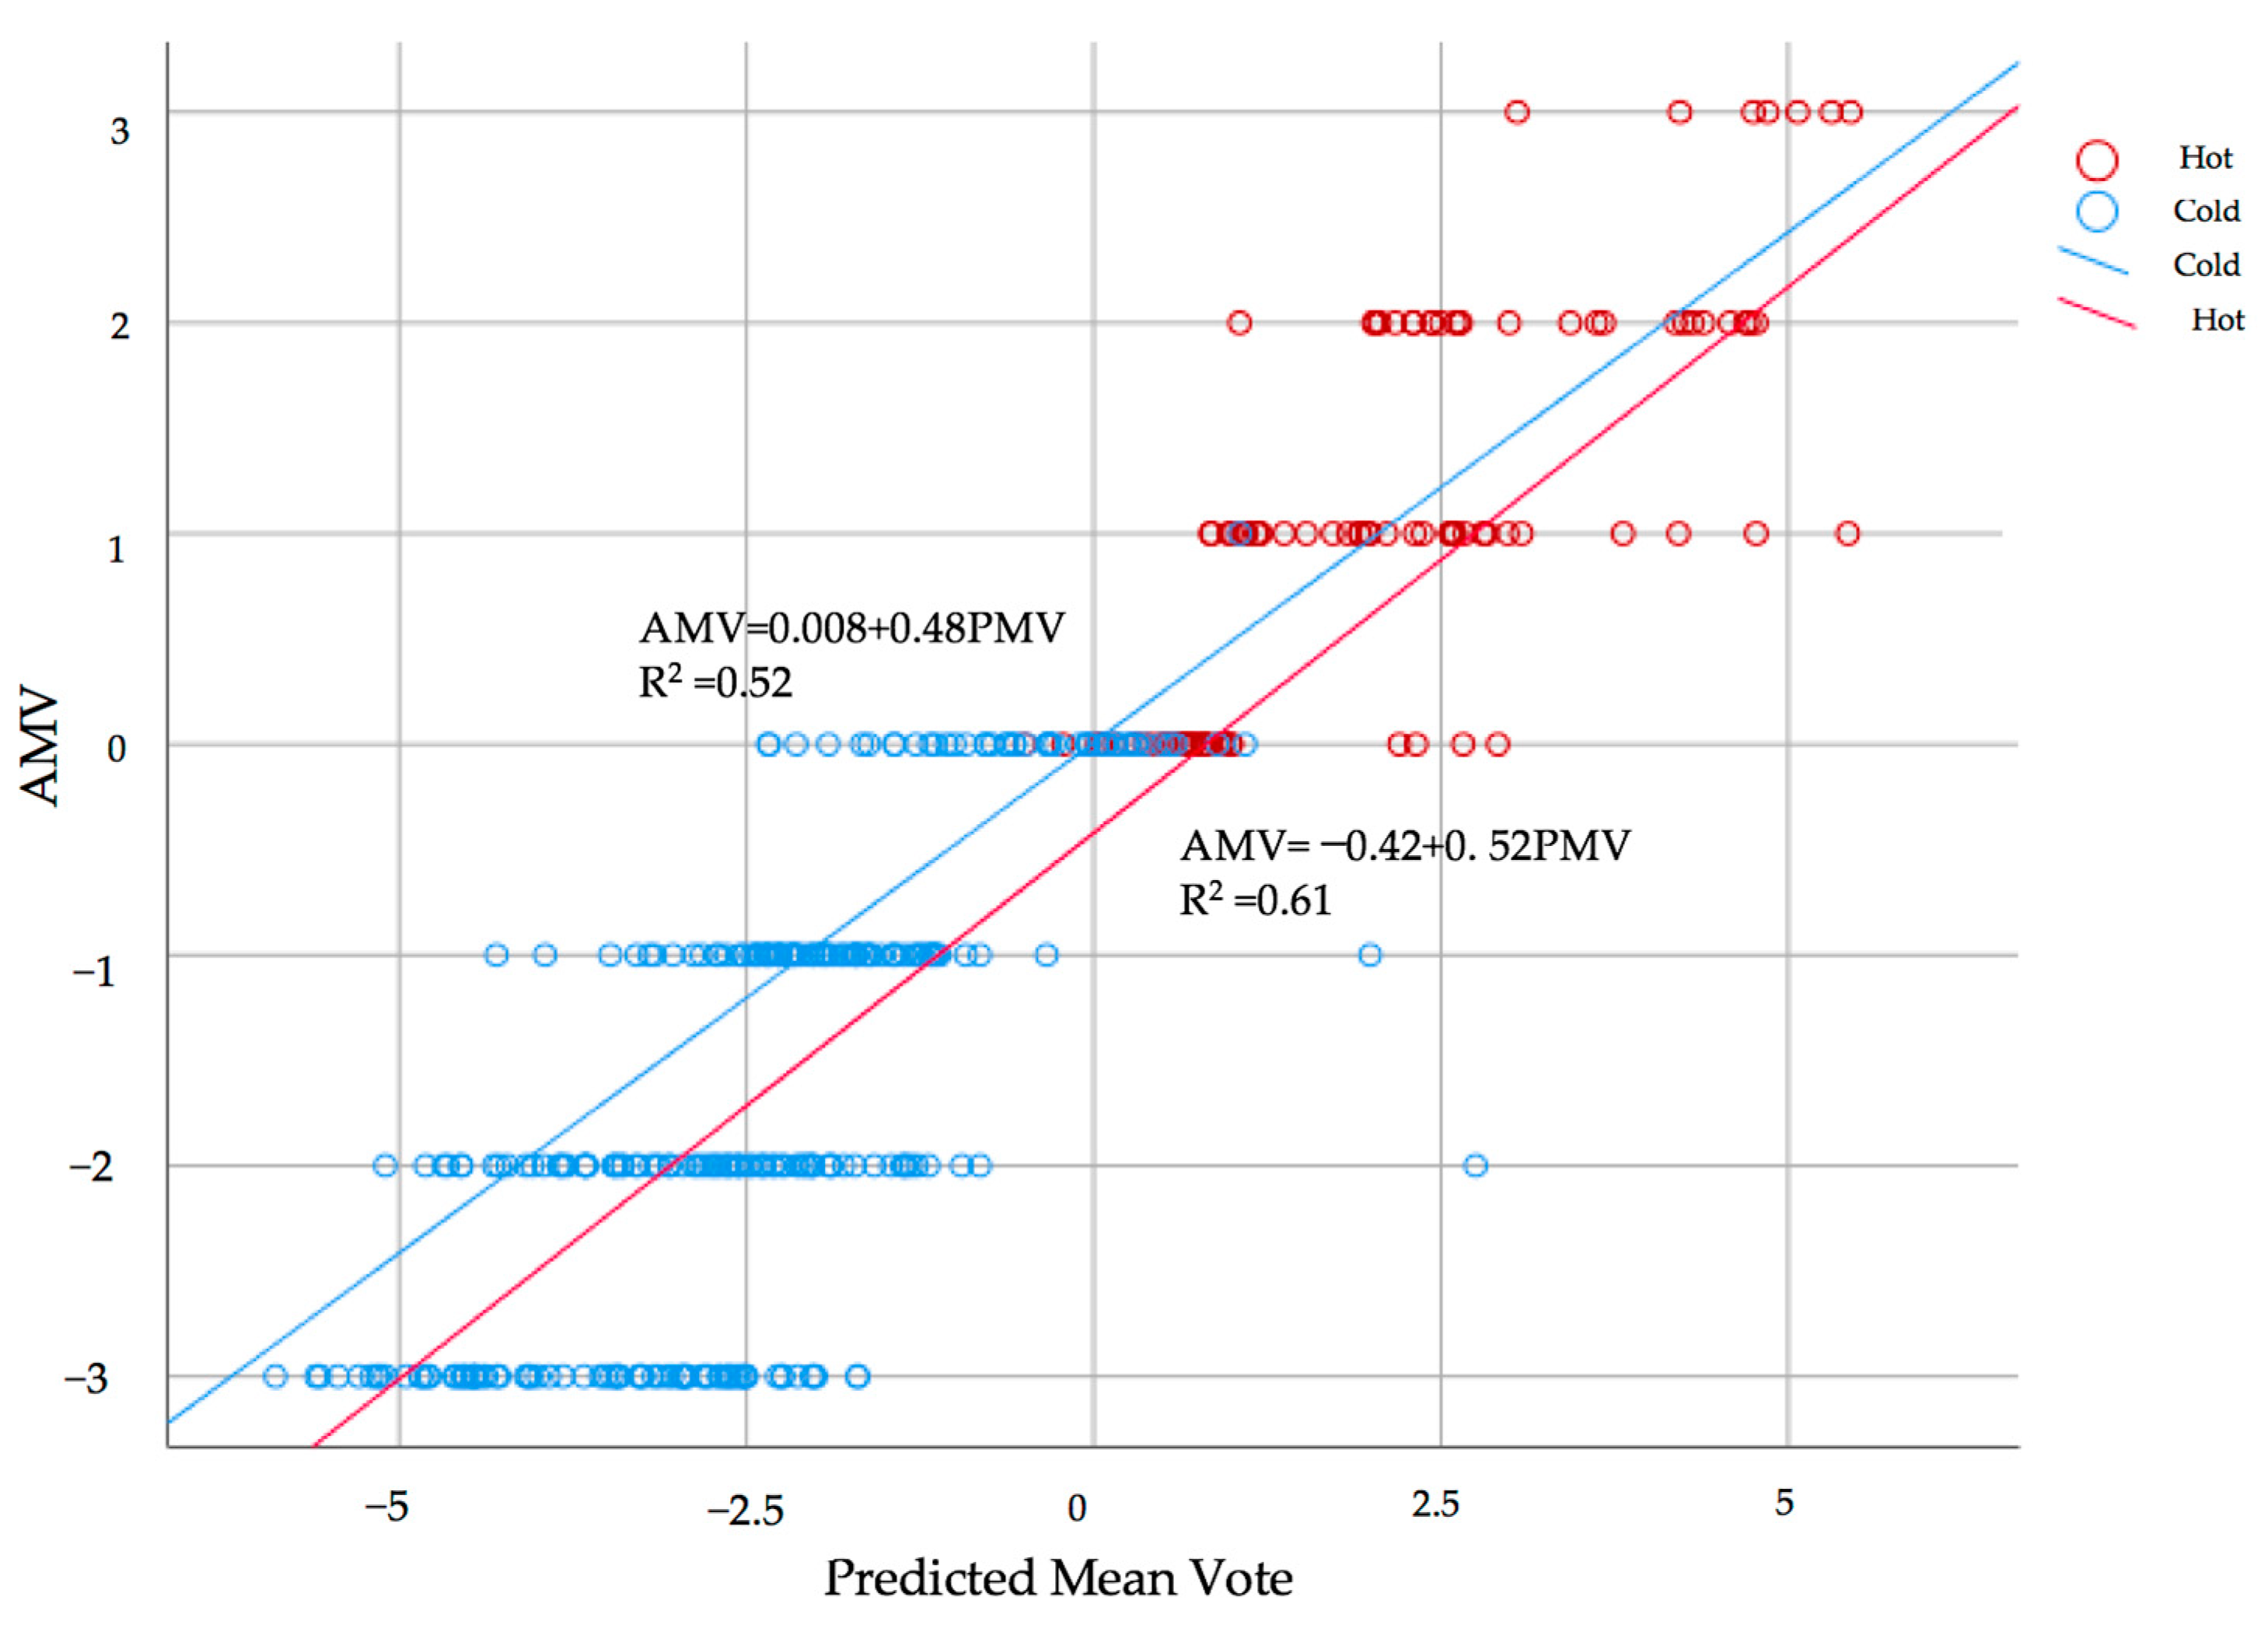
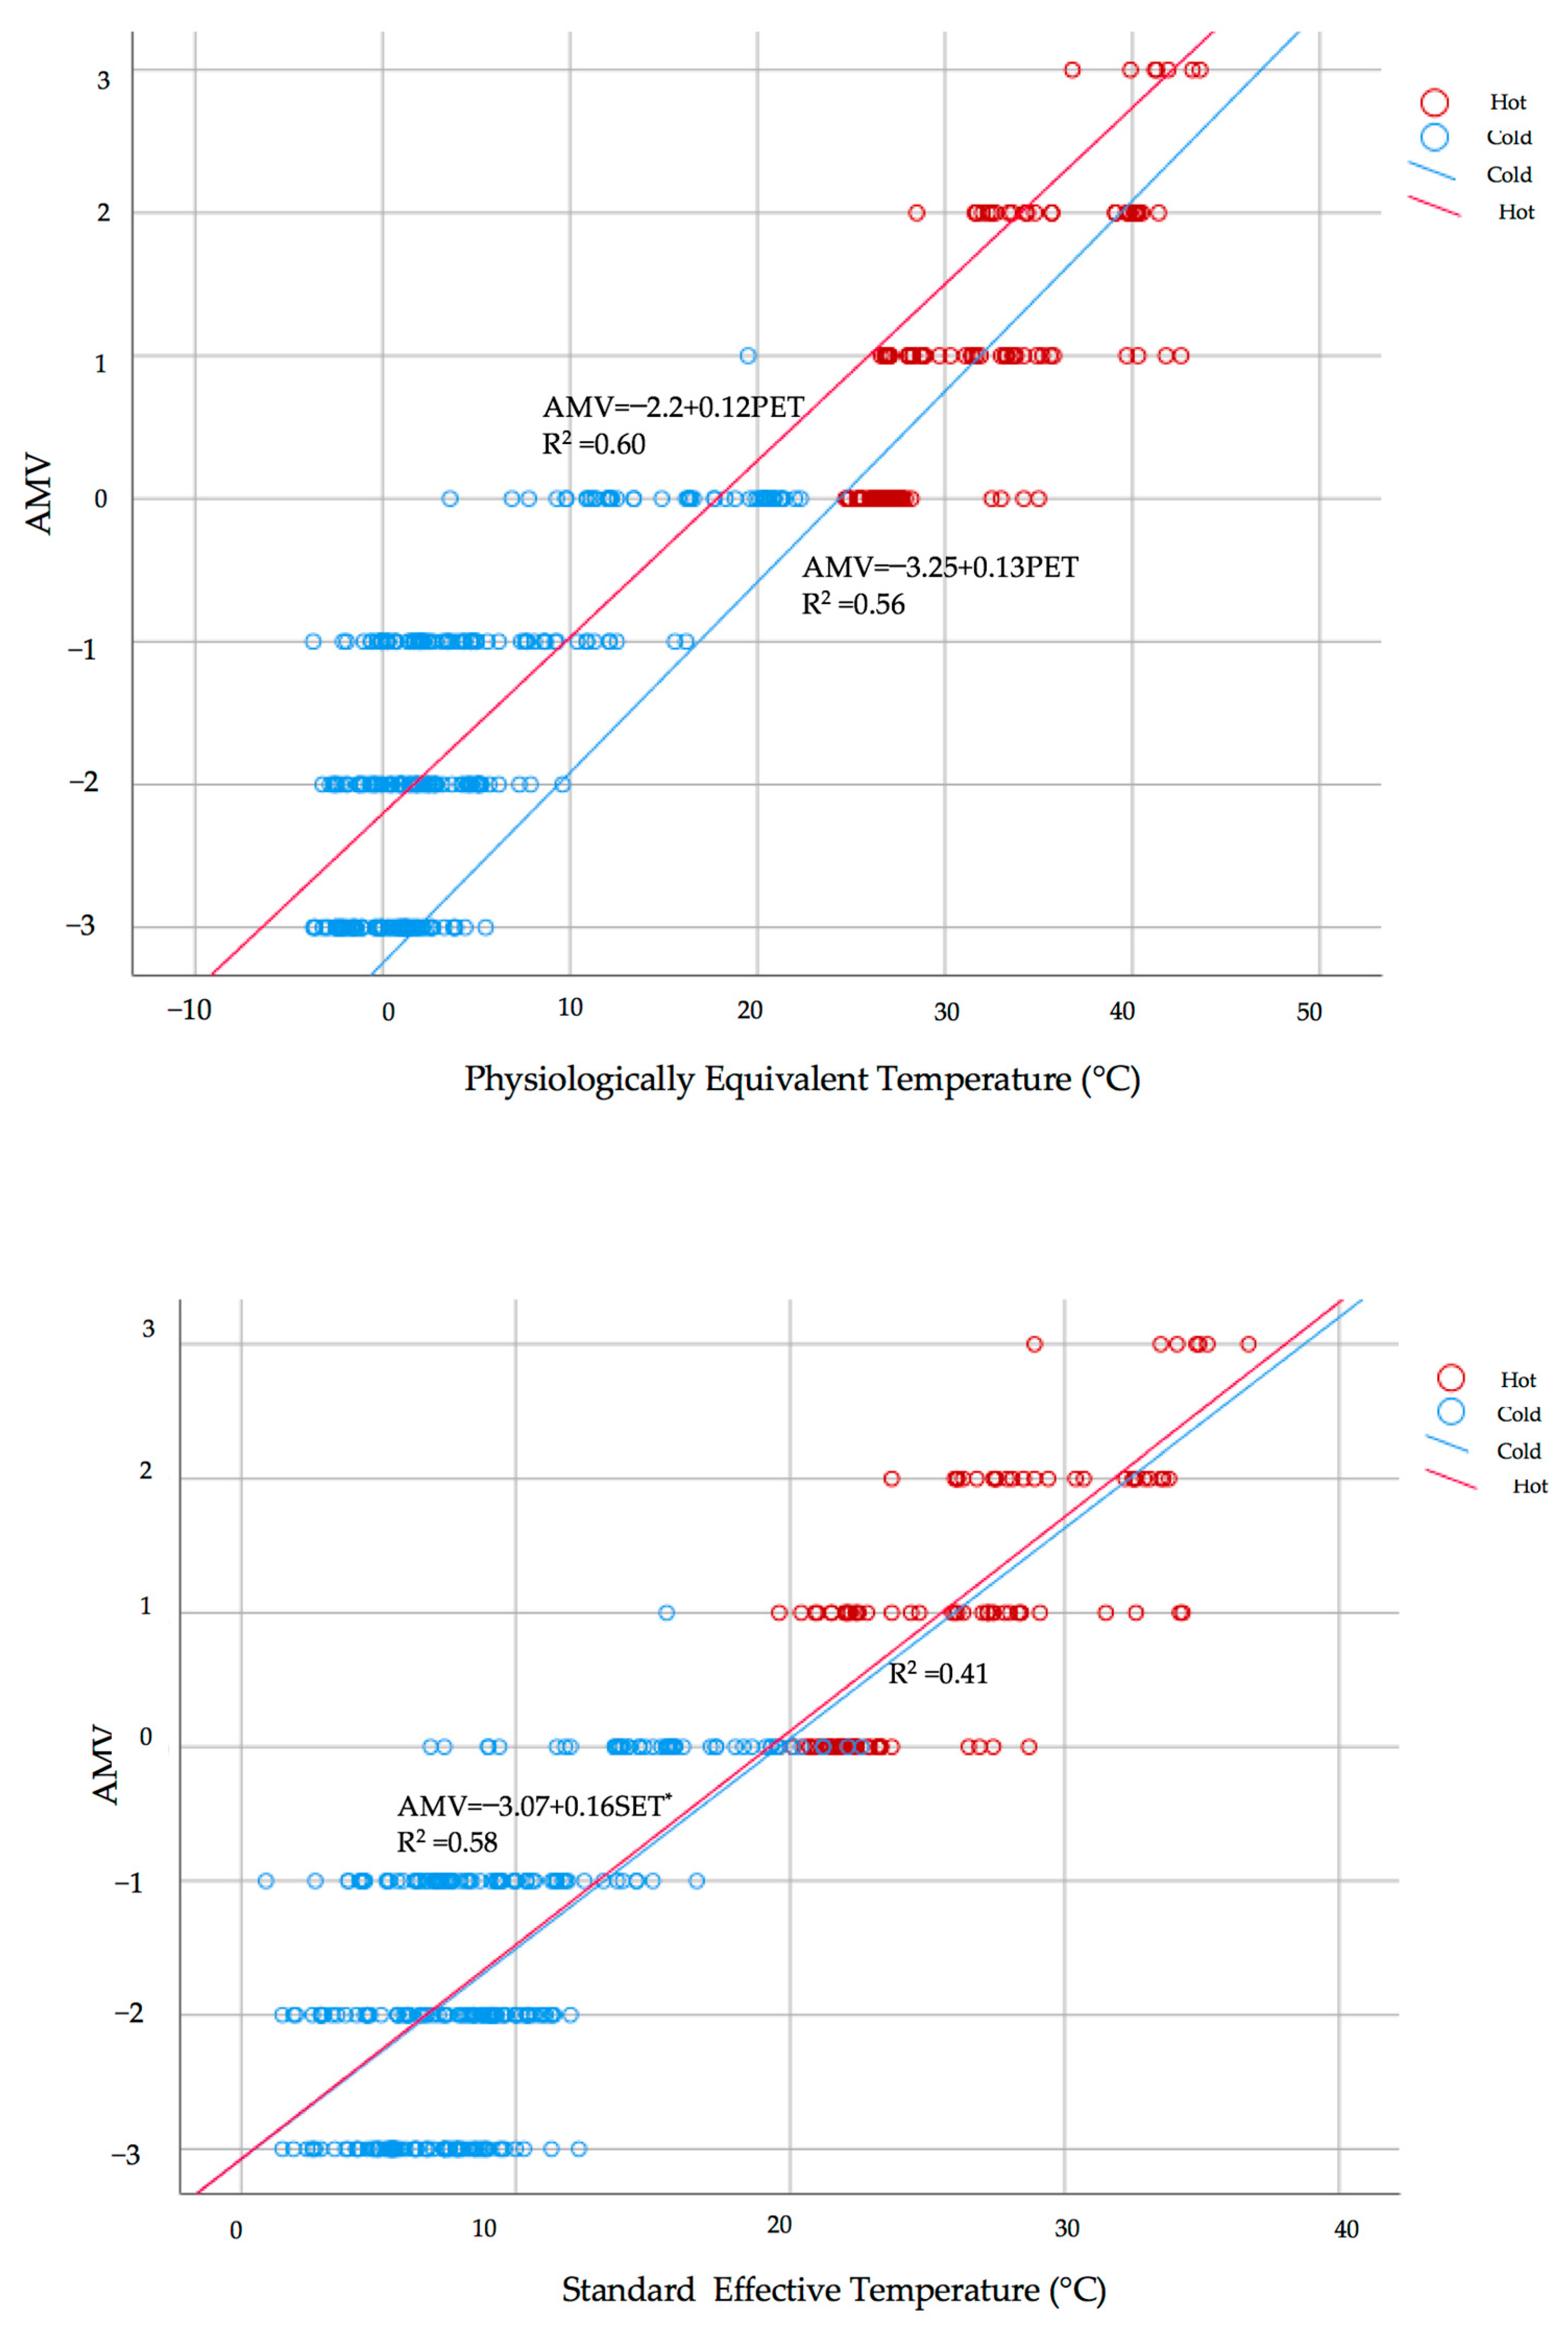
3.2.3. Evaluated Thermal Indices during Tehran’s Cold and Hot Season
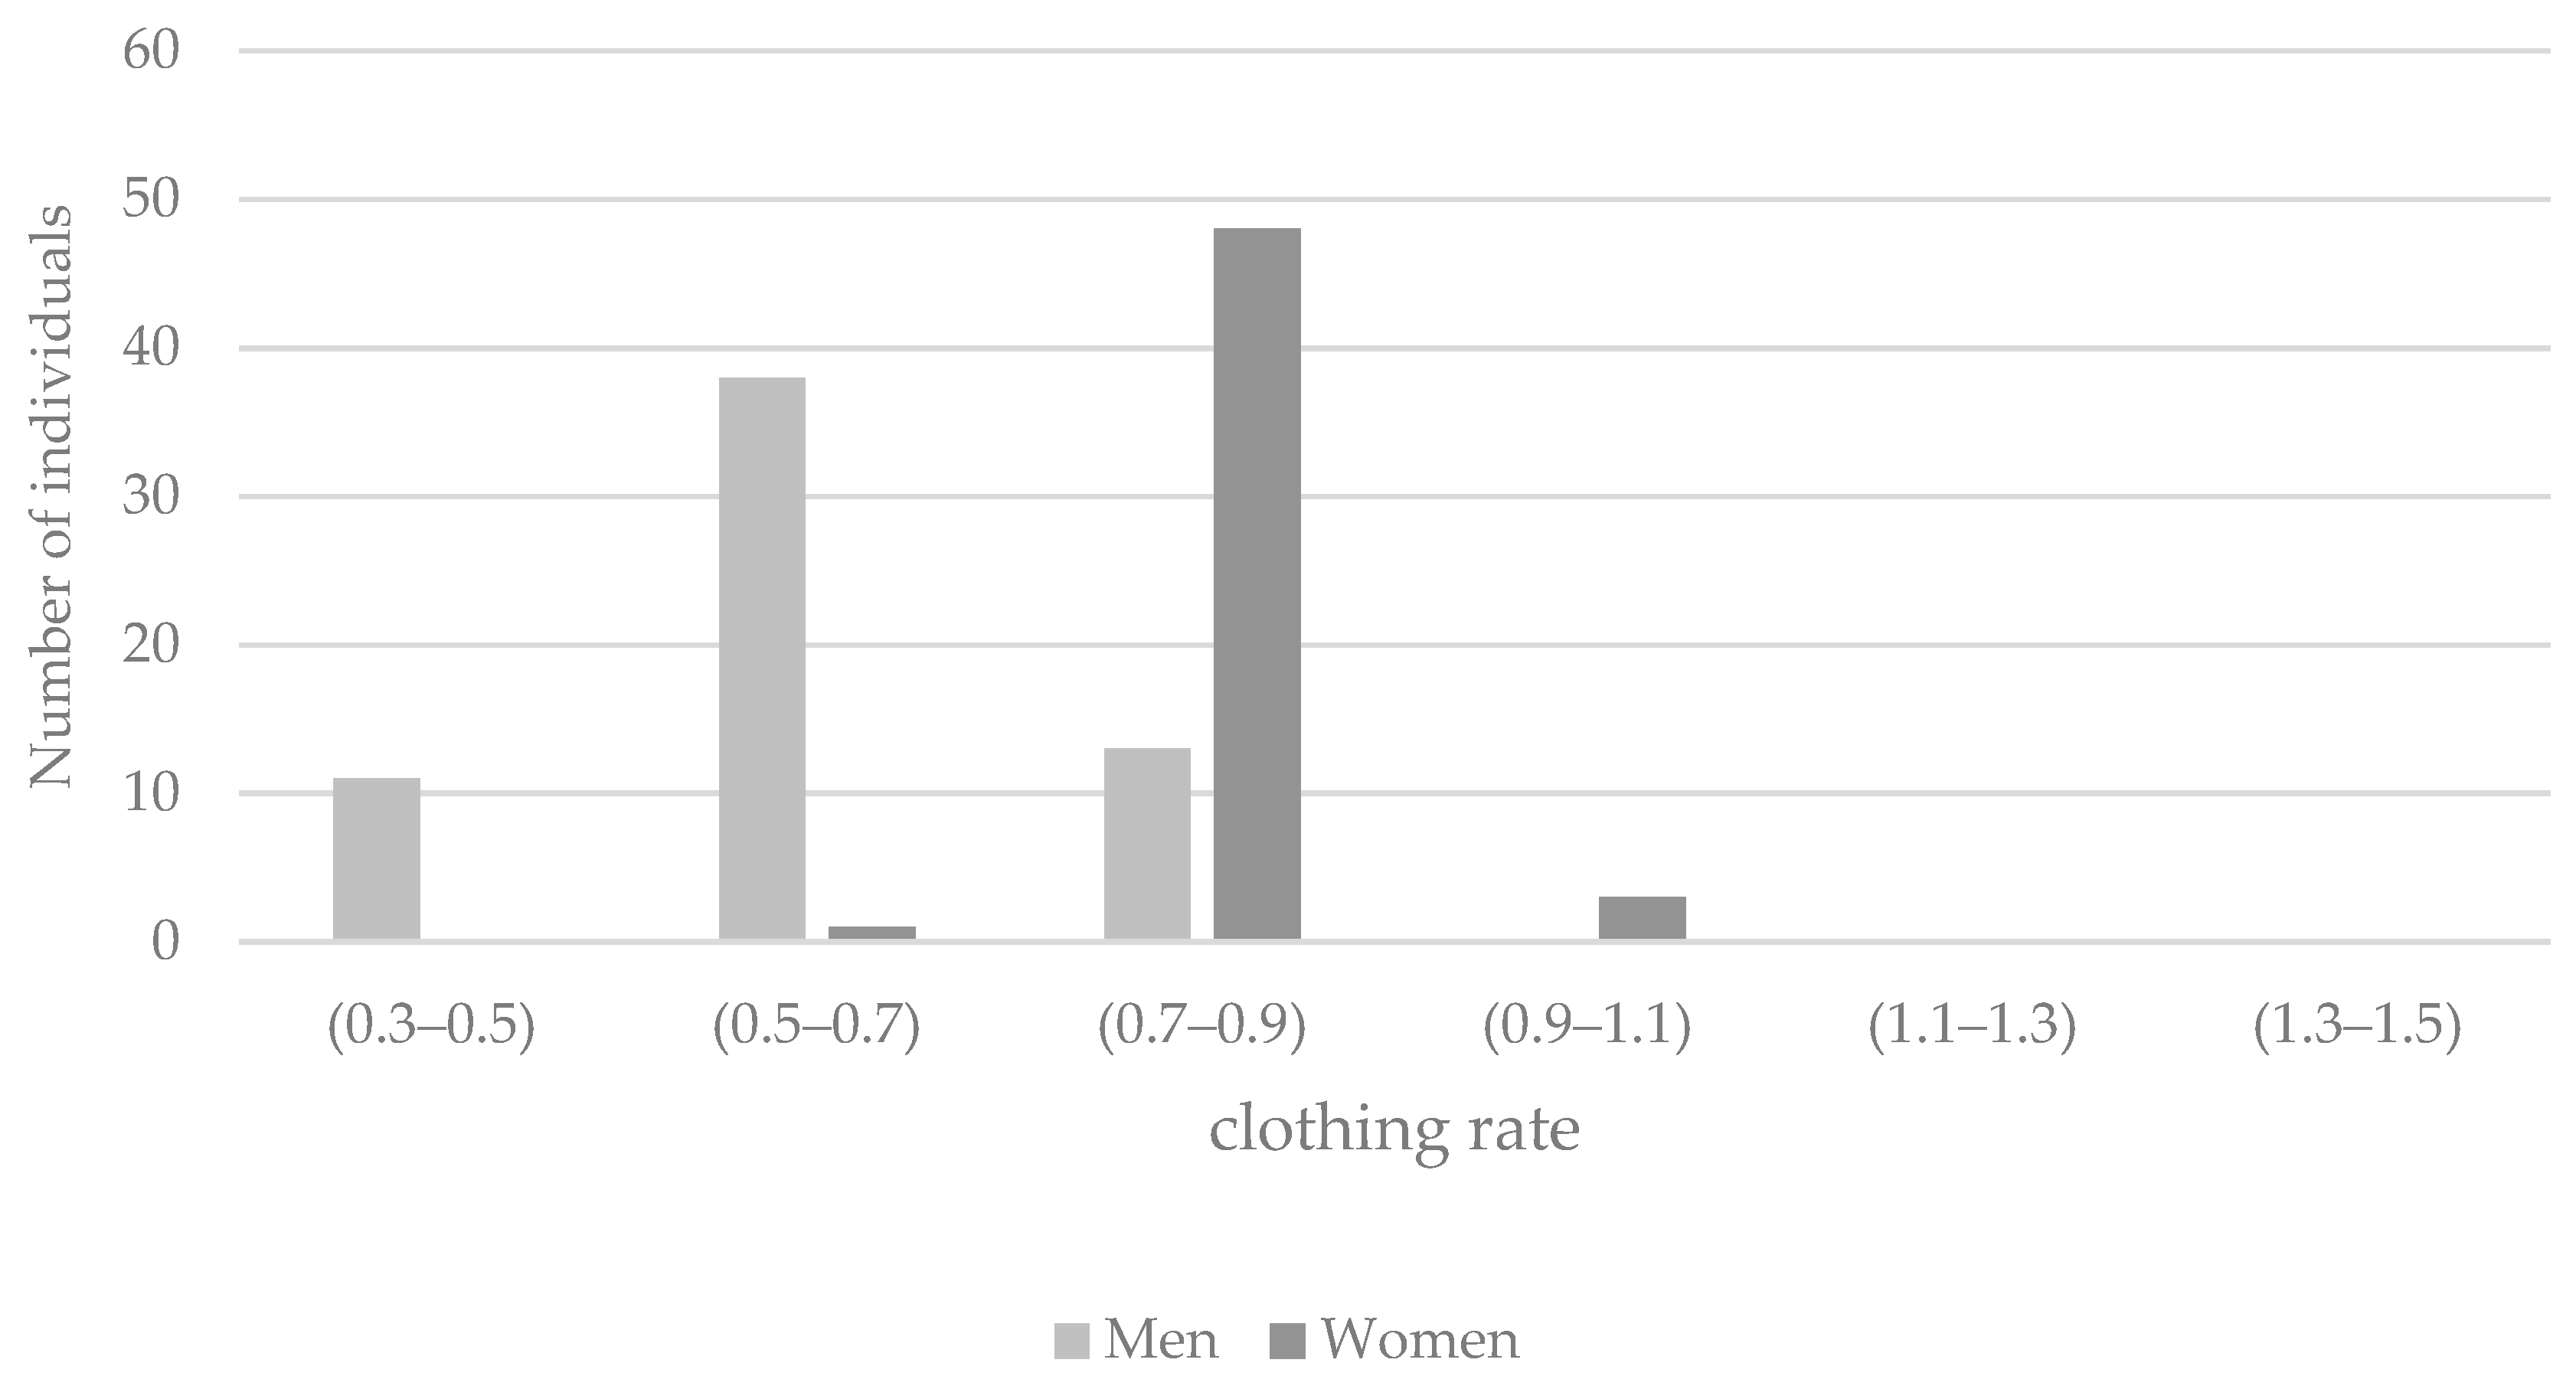
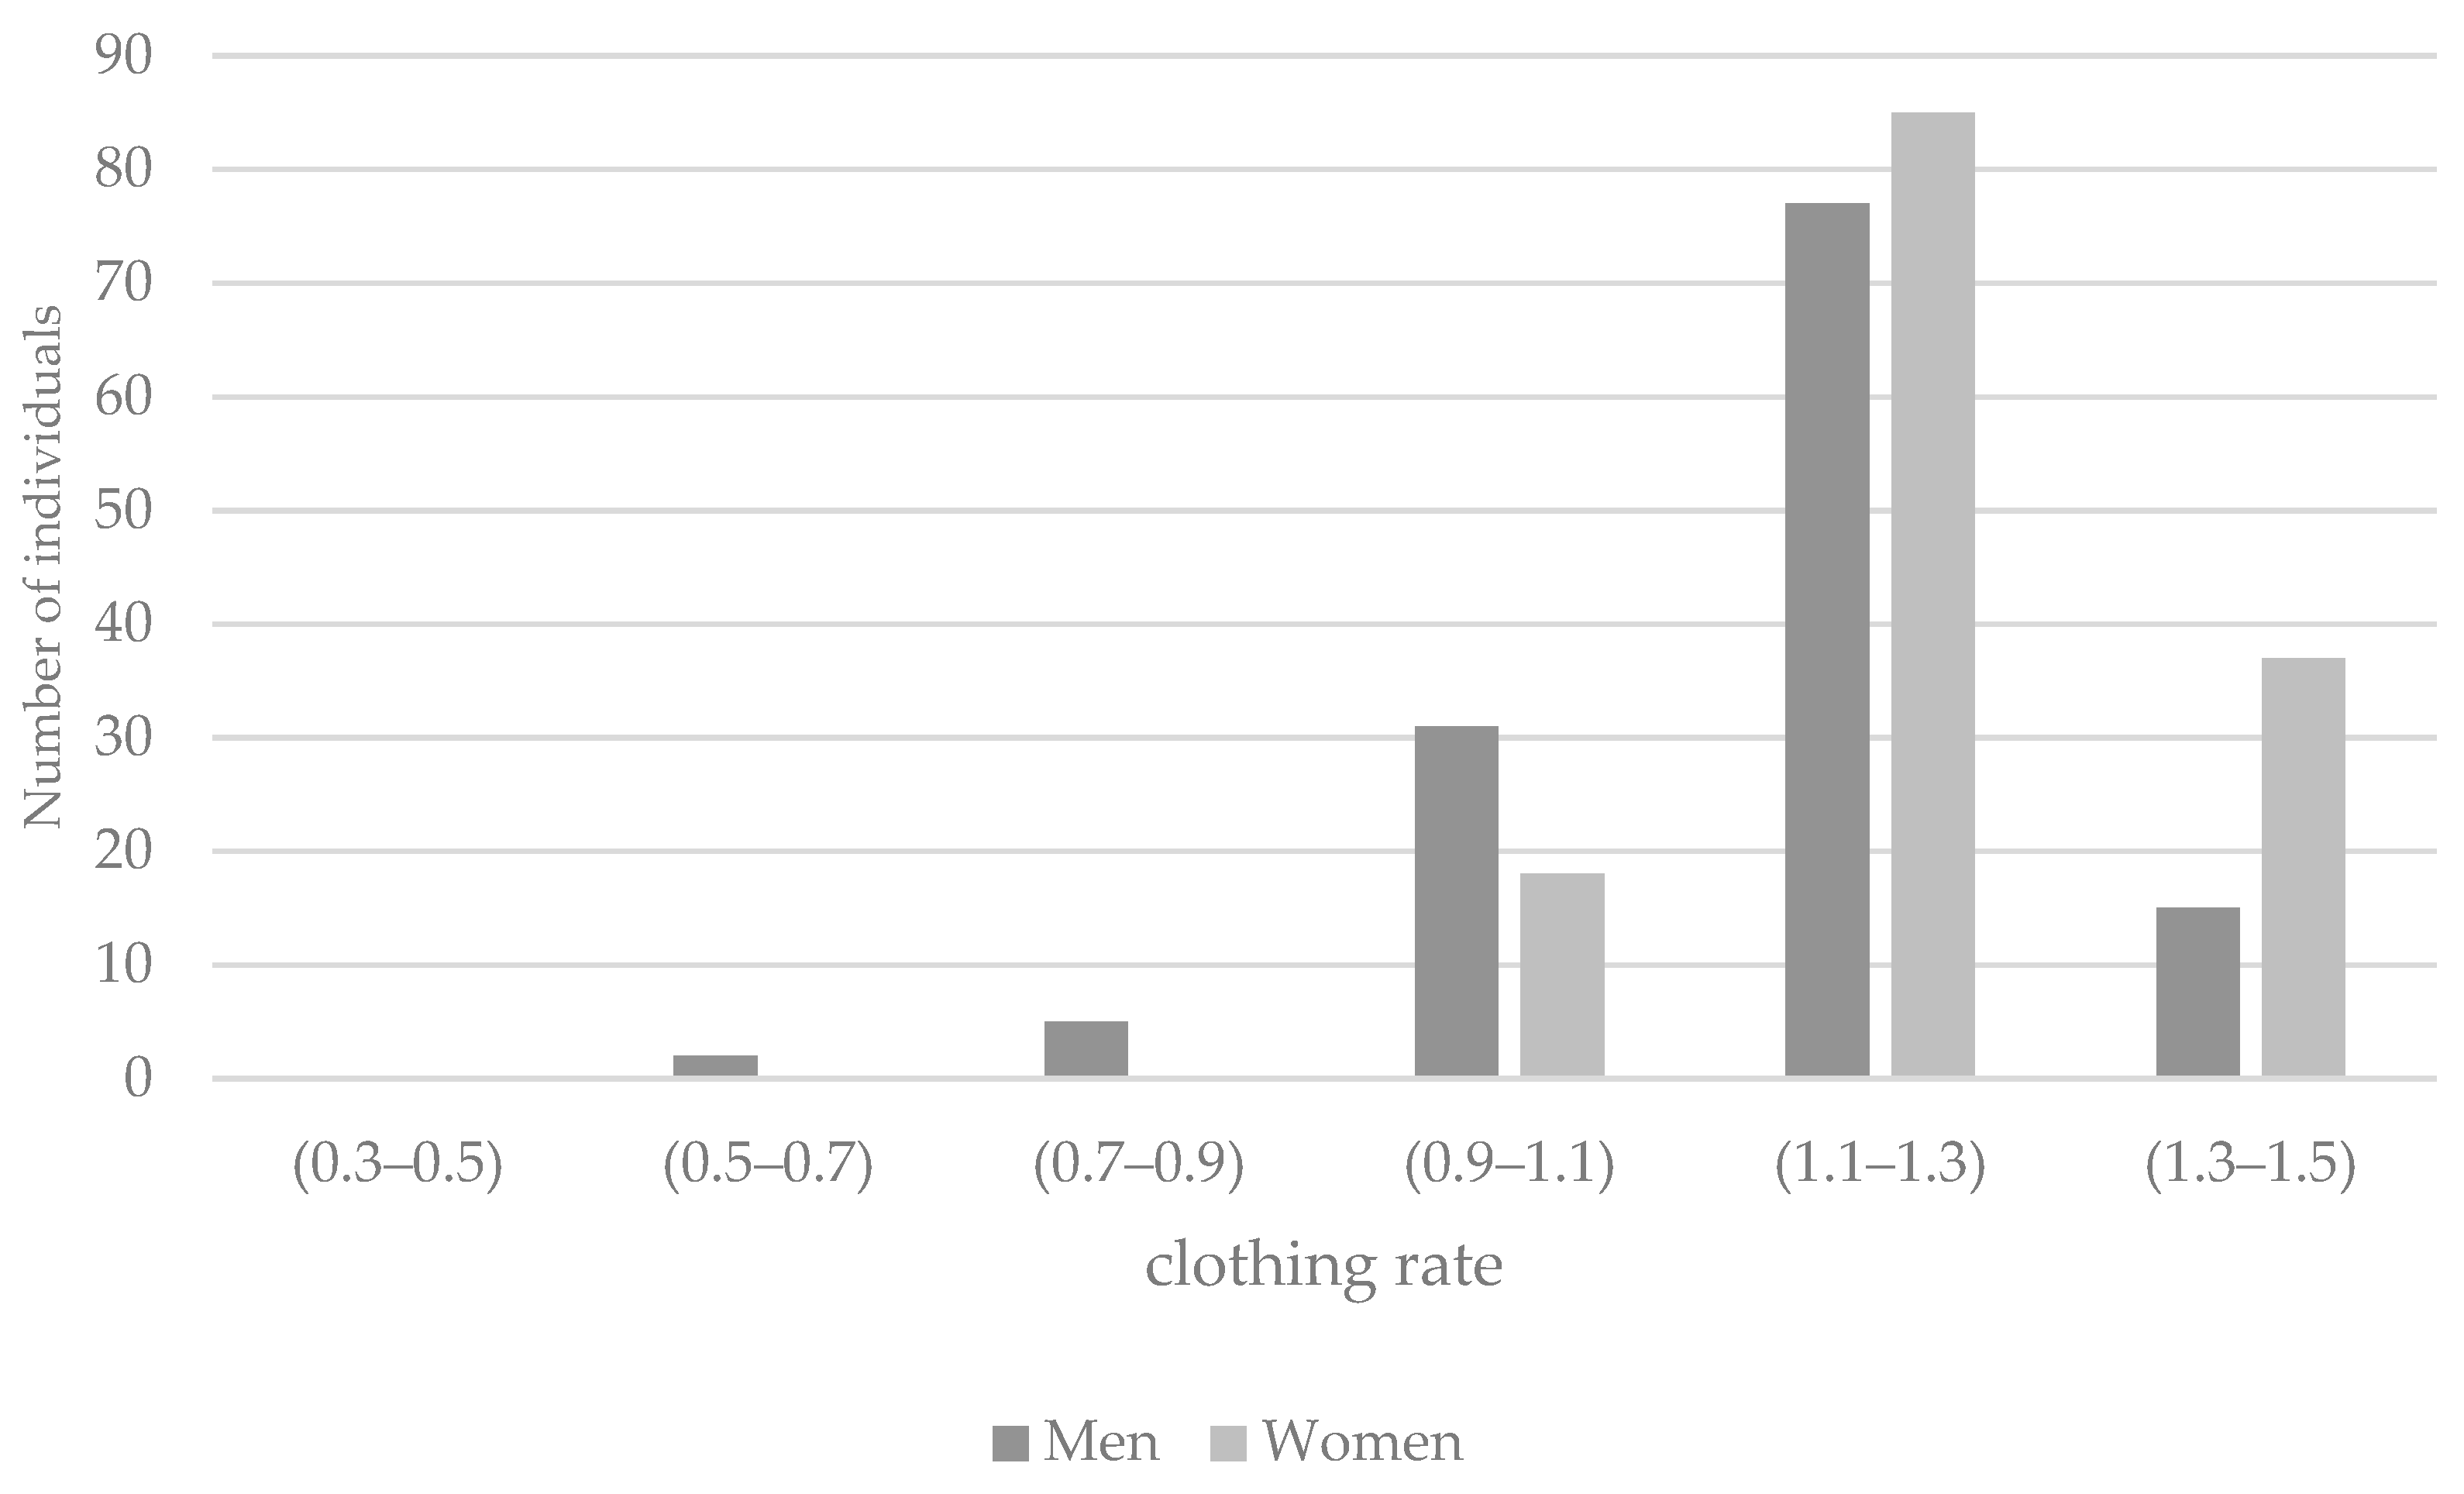
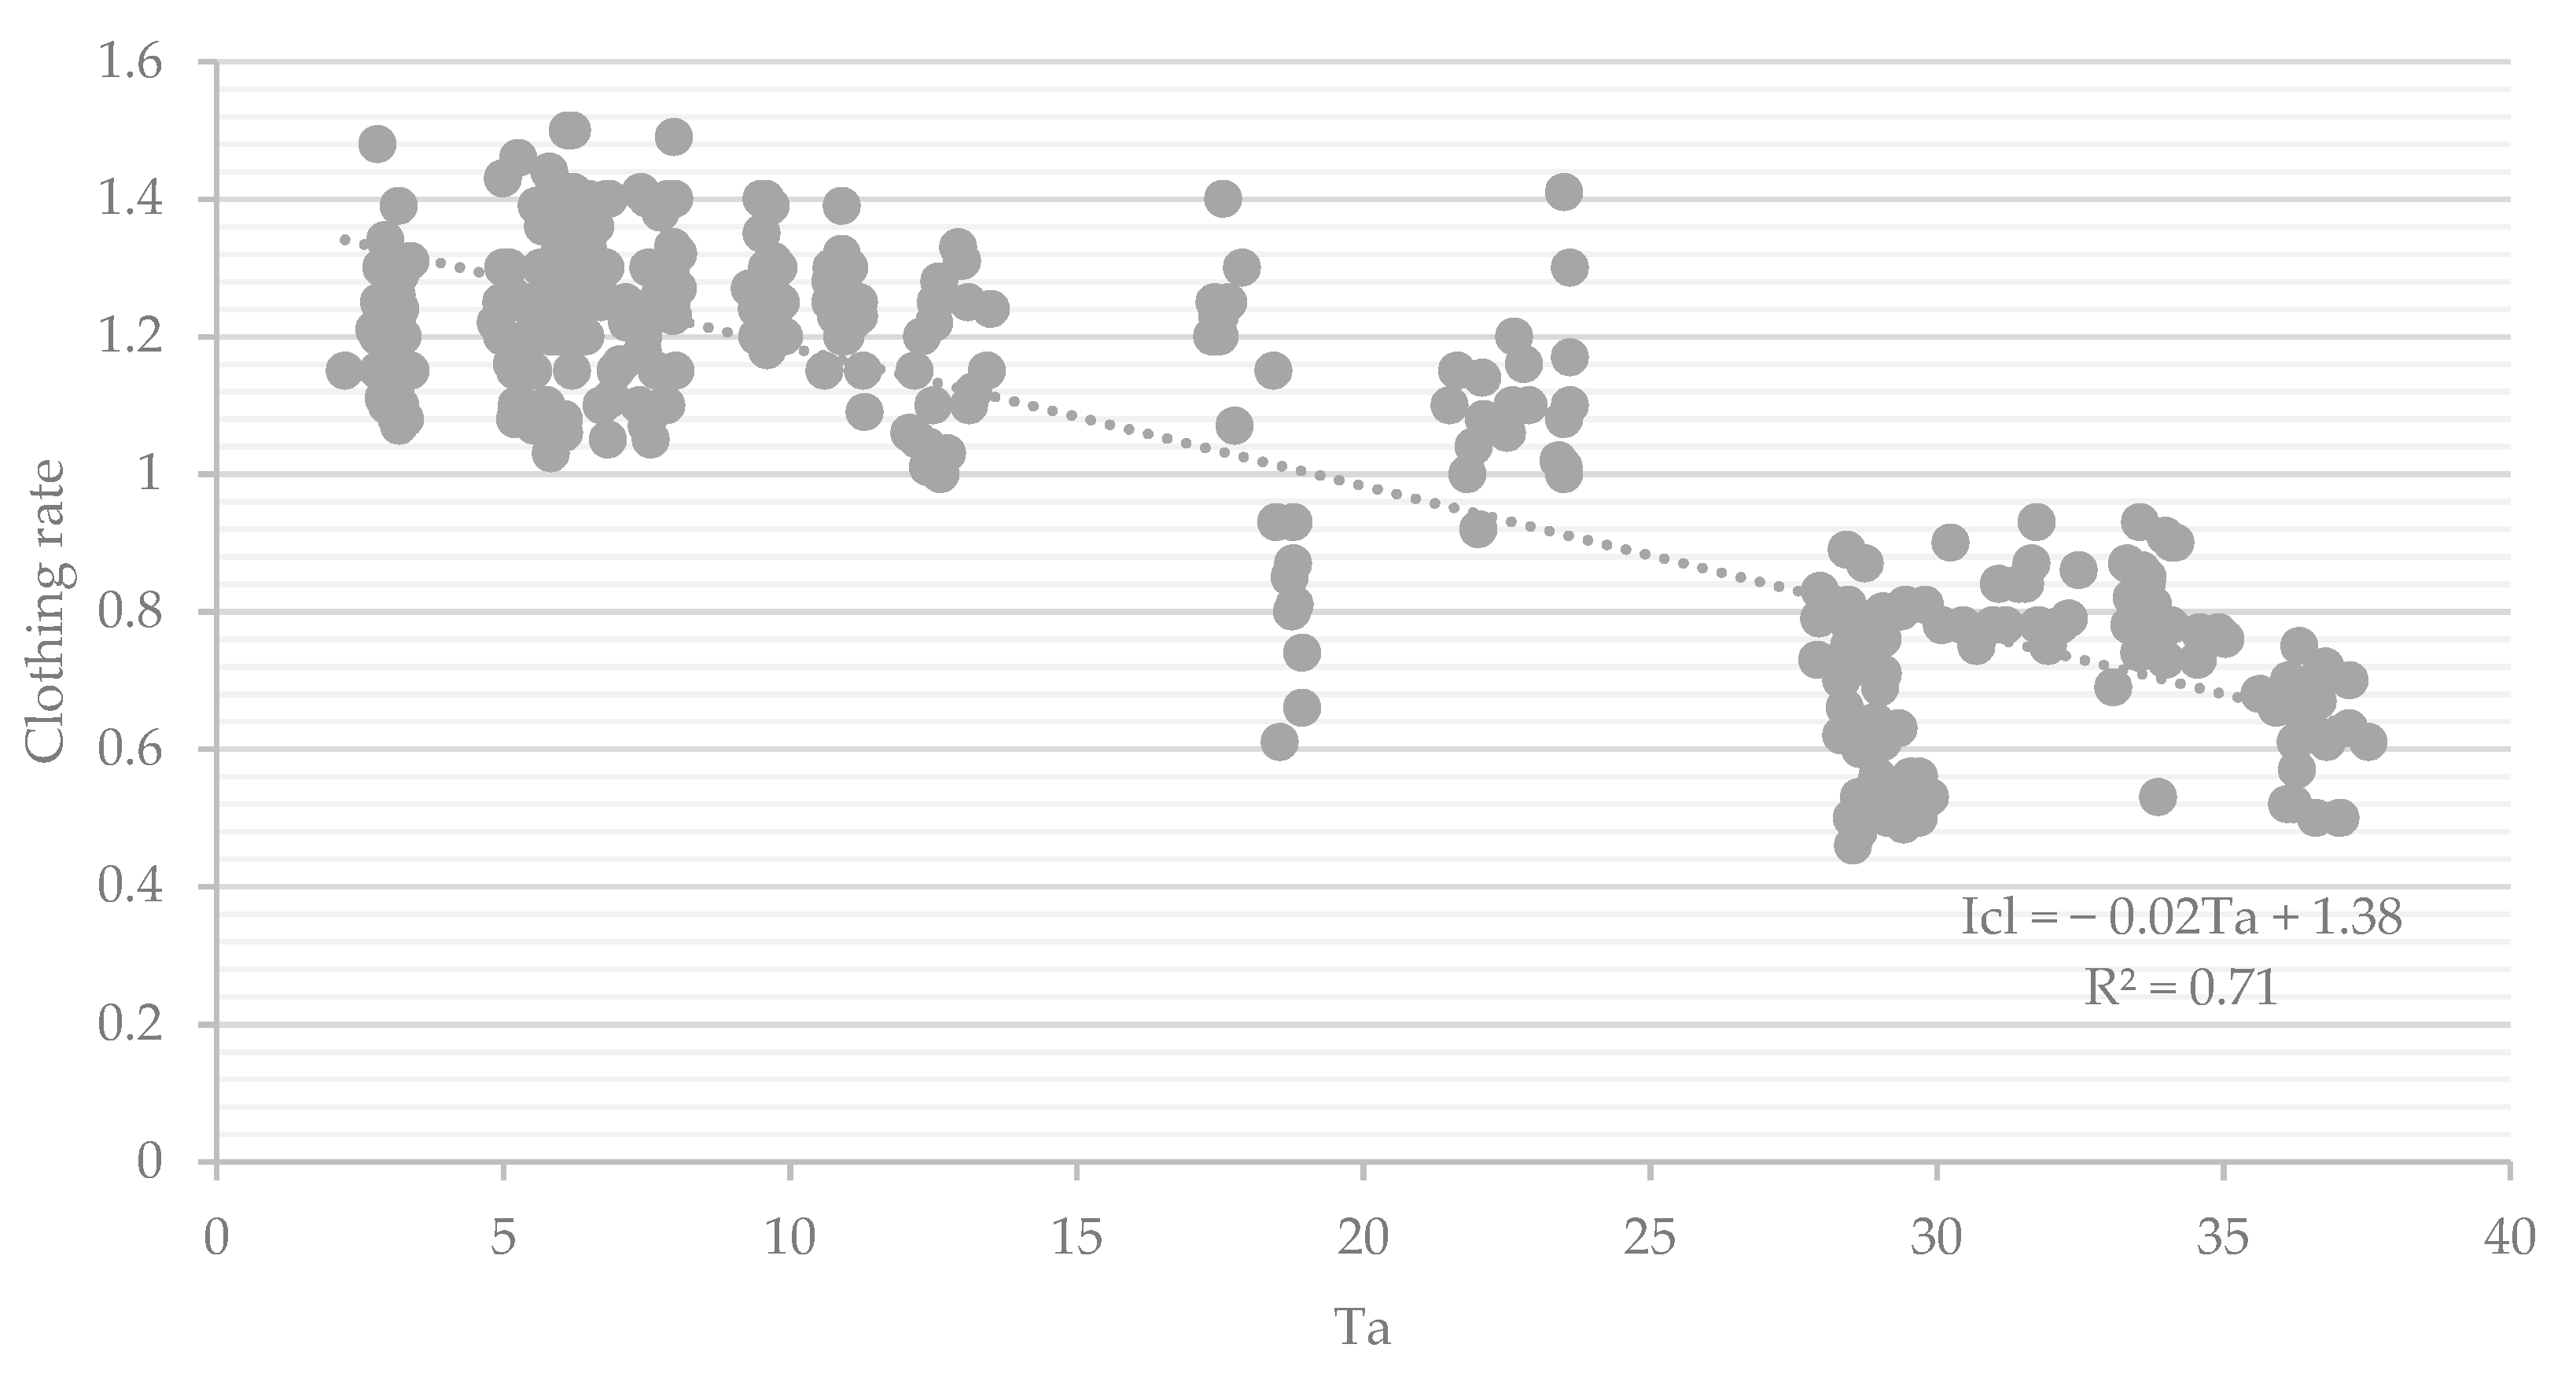
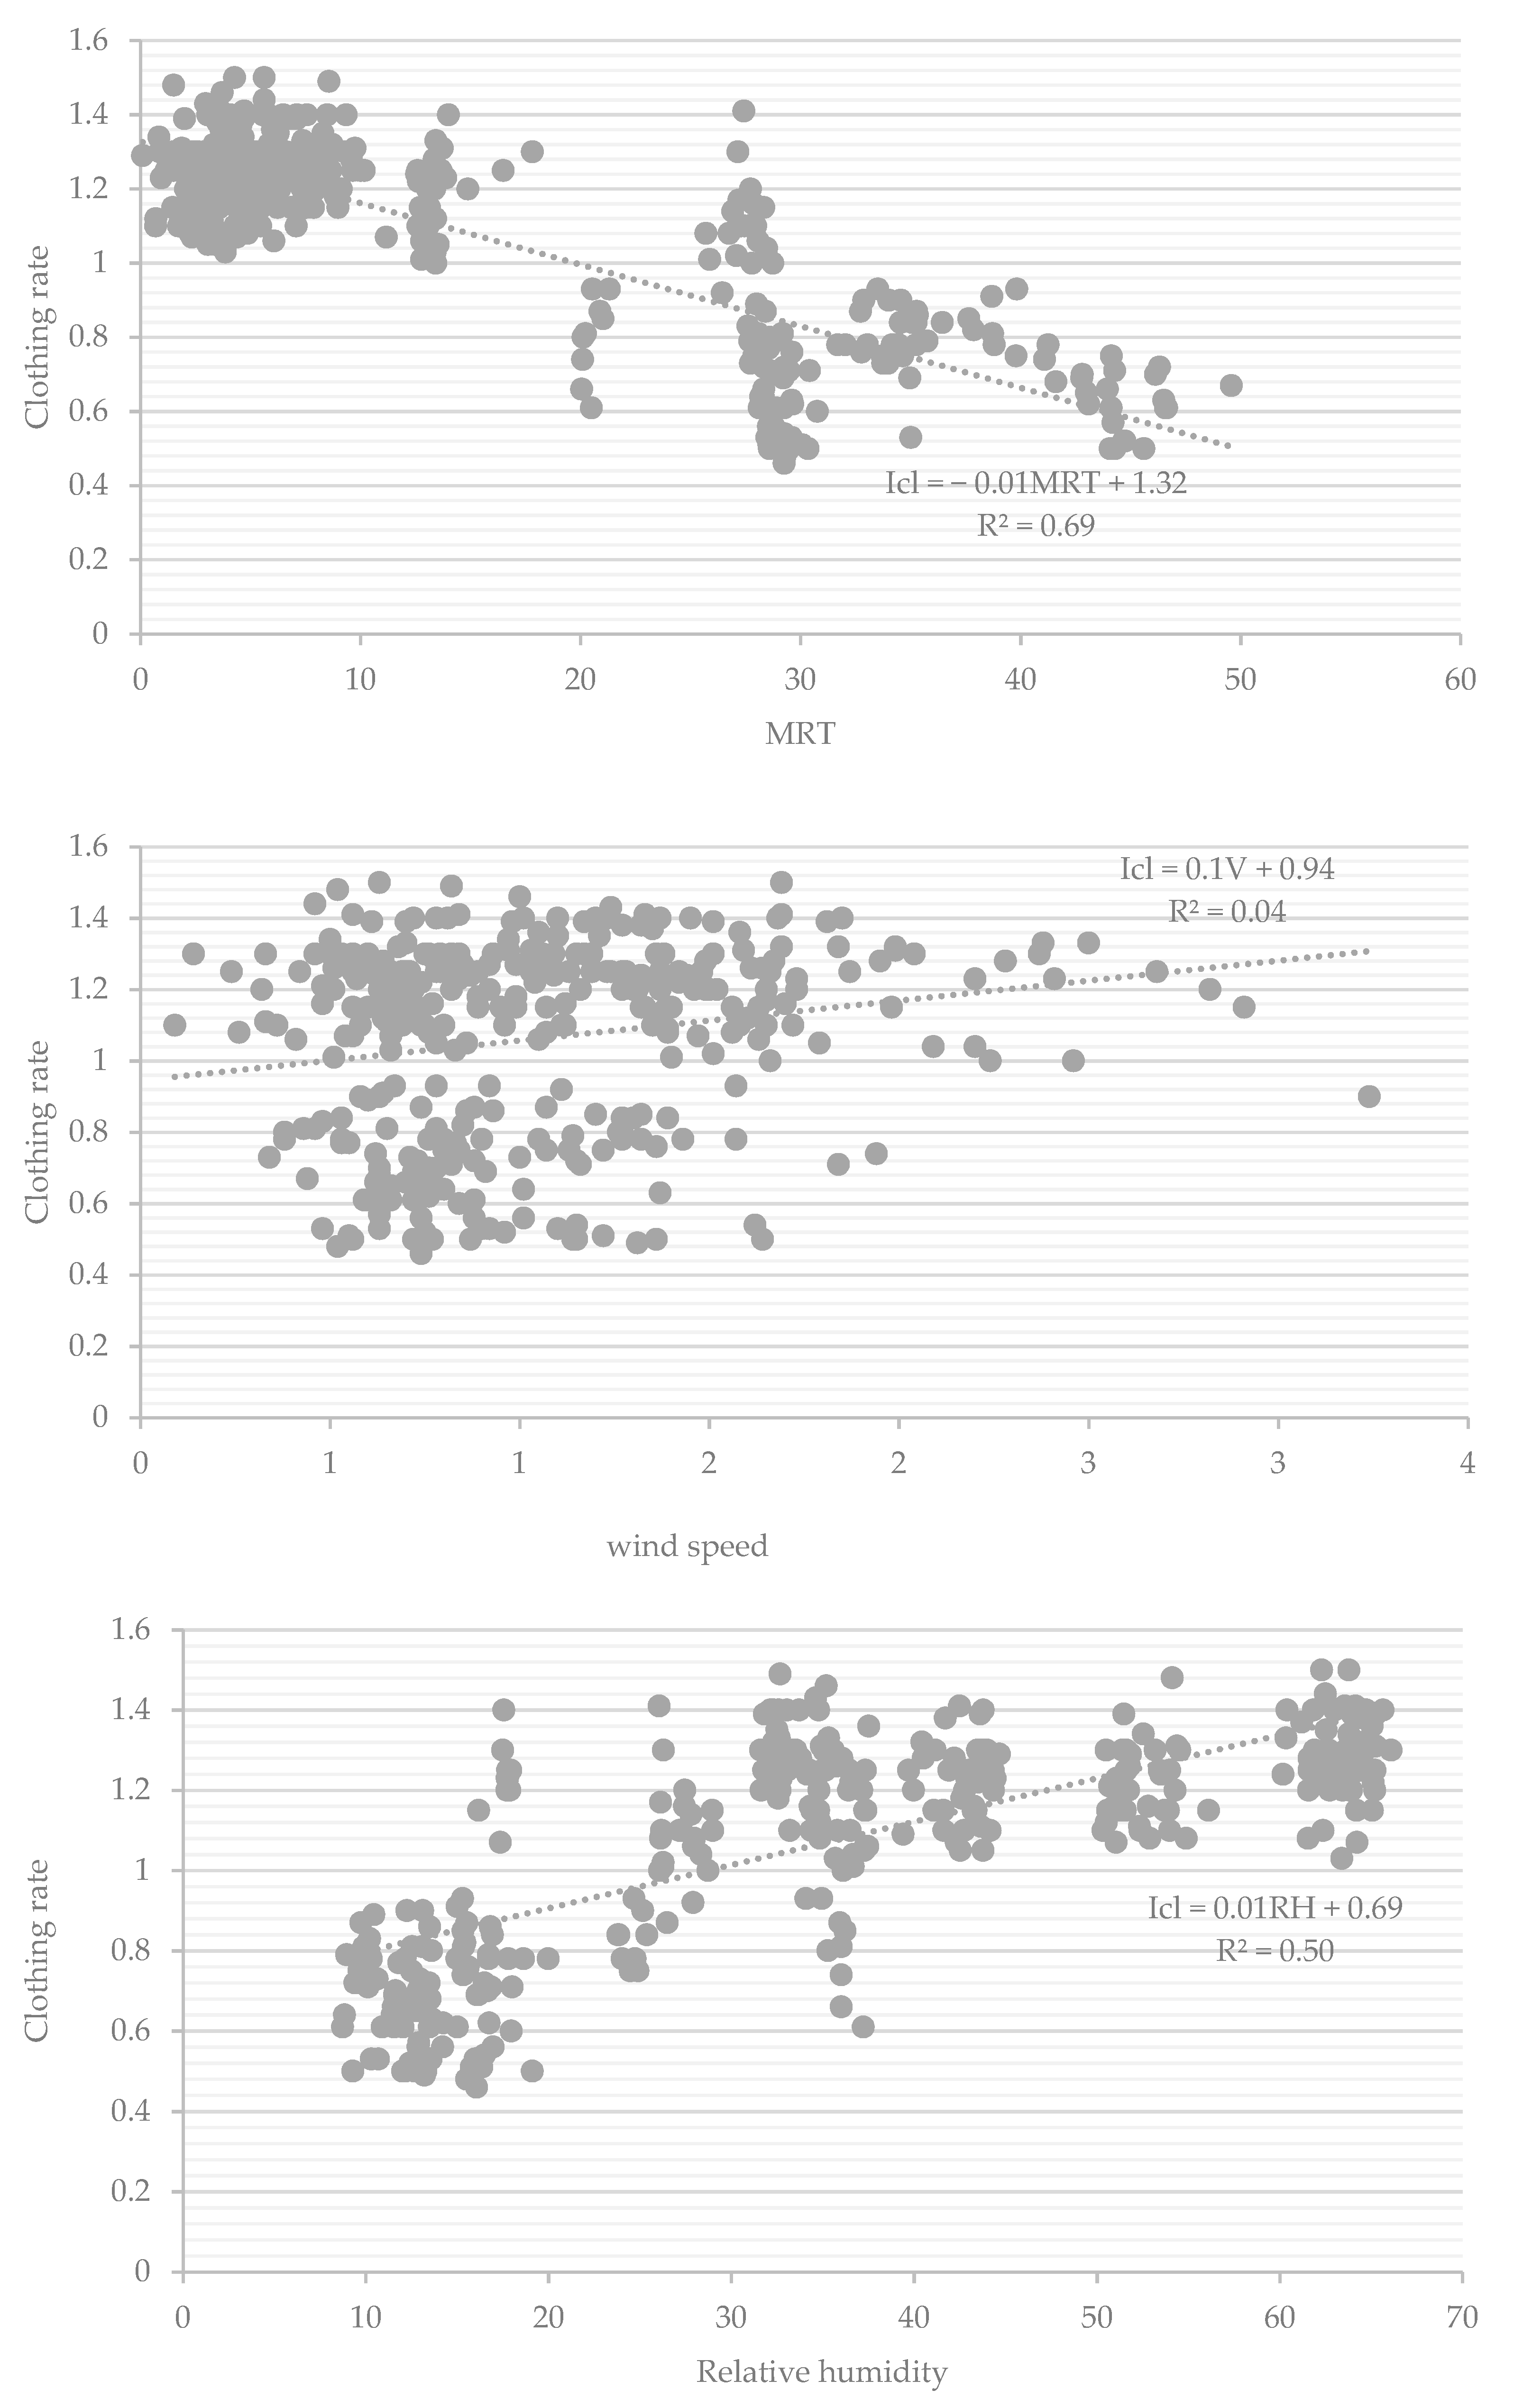
3.3. Clothing Adaption and Thermal Comfort
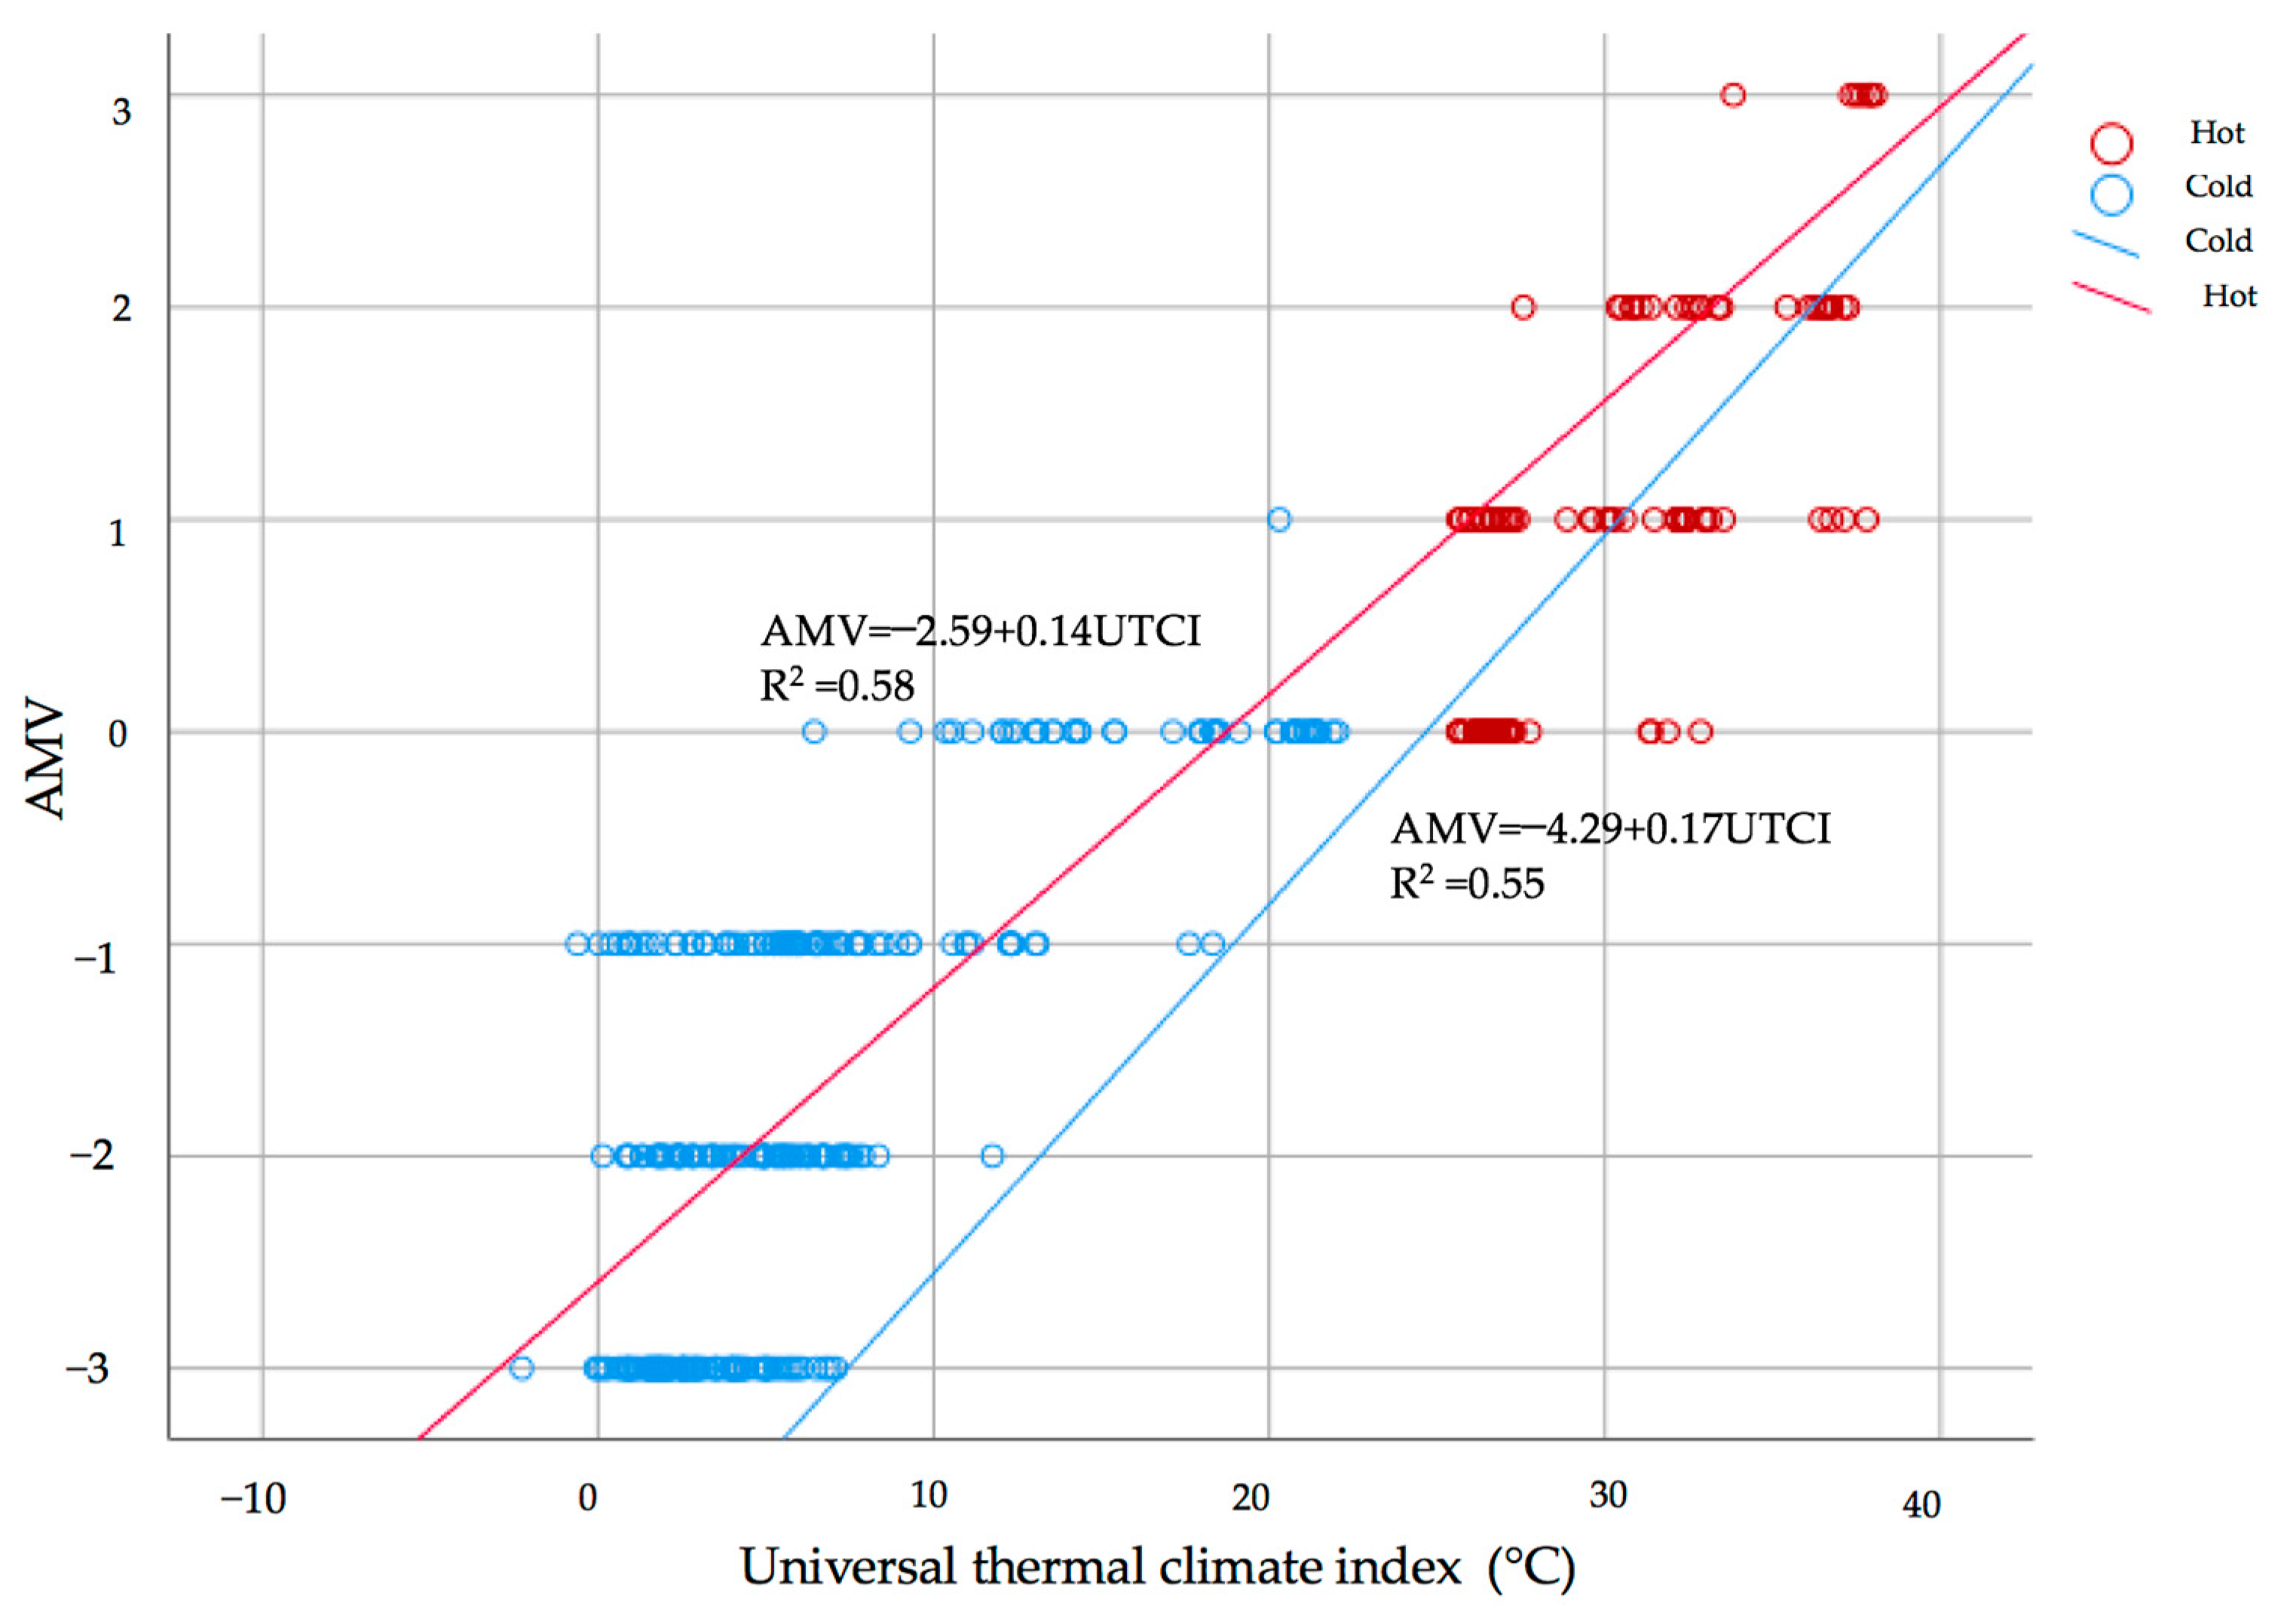
3.4. The Empirical TSV Model for Tehran
4. Discussion
5. Conclusions
Author Contributions
Funding
Institutional Review Board Statement
Informed Consent Statement
Data Availability Statement
Conflicts of Interest
Abbreviations
References
- Nakano, J.; Tanabe, S.-I. Thermal Adaptation and Comfort Zones in Urban Semi-Outdoor Environments. Front. Built Environ. 2020, 6, 34. [Google Scholar] [CrossRef]
- Ruiz, M.A.; Correa, E.N. Adaptive model for outdoor thermal comfort assessment in an Oasis city of arid climate. Build. Environ. 2015, 85, 40–51. [Google Scholar] [CrossRef]
- Cohen, P.; Potchter, O.; Matzarakis, A. Human thermal perception of Coastal Mediterranean outdoor urban environments. Appl. Geogr. 2013, 37, 1–10. [Google Scholar] [CrossRef]
- Fang, Z.; Feng, X.; Liu, J.; Lin, Z.; Mak, C.M.; Niu, J.; Tse, K.-T.; Xu, X. Investigation into the differences among several outdoor thermal comfort indices against field survey in subtropics. Sustain. Cities Soc. 2019, 44, 676–690. [Google Scholar] [CrossRef]
- Potchter, O.; Cohen, P.; Lin, T.-P.; Matzarakis, A. Outdoor human thermal perception in various climates: A comprehensive review of approaches, methods and quantification. Sci. Total Environ. 2018, 631–632, 390–406. [Google Scholar] [CrossRef]
- Huang, Z.; Cheng, B.; Gou, Z.; Zhang, F. Outdoor thermal comfort and adaptive behaviors in a university campus in China’s hot summer-cold winter climate region. Build. Environ. 2019, 165, 106414. [Google Scholar] [CrossRef]
- de Dear, R.; Xiong, J.; Kim, J.; Cao, B. A review of adaptive thermal comfort research since 1998. Energy Build. 2020, 214, 109893. [Google Scholar] [CrossRef]
- Kumar, P.; Sharma, A. Study on importance, procedure, and scope of outdoor thermal comfor—A review. Sustain. Cities Soc. 2020, 61, 102297. [Google Scholar] [CrossRef]
- He, X.; An, L.; Hong, B.; Huang, B.; Cui, X. Cross-cultural differences in thermal comfort in campus open spaces: A longitudinal field survey in China’s cold region. Build. Environ. 2020, 172, 106739. [Google Scholar] [CrossRef]
- Lai, D.; Lian, Z.; Liu, W.; Guo, C.; Liu, W.; Liu, K.; Chen, Q. A comprehensive review of thermal comfort studies in urban open spaces. Sci. Total Environ. 2020, 742, 140092. [Google Scholar] [CrossRef]
- Zhang, L.; Wei, D.; Hou, Y.; Du, J.; Liu, Z.A.; Zhang, G.; Shi, L. Outdoor Thermal Comfort of Urban Park—A Case Study. Sustainability 2020, 12, 1961. [Google Scholar] [CrossRef] [Green Version]
- Sikram, T.; Ichinose, M.; Sasaki, R. Assessment of Thermal Comfort and Building-Related Symptoms in Air-Conditioned Offices in Tropical Regions: A Case Study in Singapore and Thailand. Front. Built Environ. 2020, 6, 567787. [Google Scholar] [CrossRef]
- Bedford, T.; Council, M.R. The Warmth Factor in Comfort at Work: A Physiological Study of Heating and Ventilation; H. M. Stationery Office: London, UK, 1936. [Google Scholar]
- Jing, S.; Lei, Y.; Wang, H.; Song, C.; Yan, X. Thermal comfort and energy-saving potential in university classrooms during the heating season. Energy Build. 2019, 202, 109390. [Google Scholar] [CrossRef]
- Ghaffarianhoseini, A.; Berardi, U.; Ghaffarianhoseini, A.; Al-Obaidi, K. Analyzing the thermal comfort conditions of outdoor spaces in a university campus in Kuala Lumpur, Malaysia. Sci. Total Environ. 2019, 666, 1327–1345. [Google Scholar] [CrossRef] [PubMed] [Green Version]
- Fang, Z.; Zheng, Z.; Feng, X.; Shi, D.; Lin, Z.; Gao, Y. Investigation of outdoor thermal comfort prediction models in South China: A case study in Guangzhou. Build. Environ. 2021, 188, 107424. [Google Scholar] [CrossRef]
- Yao, J.; Yang, F.; Zhuang, Z.; Shao, Y.; Yuan, P.F. The effect of personal and microclimatic variables on outdoor thermal comfort: A field study in a cold season in Lujiazui CBD, Shanghai. Sustain. Cities Soc. 2018, 39, 181–188. [Google Scholar] [CrossRef]
- Liu, H.; Wu, Y.; Lei, D.; Li, B. Gender differences in physiological and psychological responses to the thermal environment with varying clothing ensembles. Build. Environ. 2018, 141, 45–54. [Google Scholar] [CrossRef]
- Parsons, K.C. The effects of gender, acclimation state, the opportunity to adjust clothing and physical disability on requirements for thermal comfort. Energy Build. 2002, 34, 593–599. [Google Scholar] [CrossRef]
- Spagnolo, J.; de Dear, R. A field study of thermal comfort in outdoor and semi-outdoor environments in subtropical Sydney Australia. Build. Environ. 2003, 38, 721–738. [Google Scholar] [CrossRef] [Green Version]
- Blazejczyk, K.; Epstein, Y.; Jendritzky, G.; Staiger, H.; Tinz, B. Comparison of UTCI to selected thermal indices. Int. J. Biometeorol. 2012, 56, 515–535. [Google Scholar] [CrossRef] [Green Version]
- Humphreys, M.A. Field studies of thermal comfort compared and applied. Adv. Build. Energy 2012, 1, 55–88. [Google Scholar] [CrossRef]
- Ruiz, A.; Correa, E. Suitability of different comfort indices for the prediction of thermal conditions in tree-covered outdoor spaces in arid cities. Theor. Appl. Climatol. 2014, 122, 69–83. [Google Scholar] [CrossRef]
- Lin, T.-P.; Tsai, K.-T.; Liao, C.-C.; Huang, Y.-C. Effects of thermal comfort and adaptation on park attendance regarding different shading levels and activity types. Build. Environ. 2013, 59, 599–611. [Google Scholar] [CrossRef]
- Krüger, E.; Drach, P.; Bröde, P. Outdoor comfort study in Rio de Janeiro: Site-related context effects on reported thermal sensation. Int. J. Biometeorol. 2016, 61, 463–475. [Google Scholar] [CrossRef]
- Amindeldar, S.; Heidari, S.; Khalili, M. The effect of personal and microclimatic variables on outdoor thermal comfort: A field study in Tehran in cold season. Sustain. Cities Soc. 2017, 32, 153–159. [Google Scholar] [CrossRef]
- Hadianpour, M.; Mahdavinejad, M.; Bemanian, M.; Nasrollahi, F. Seasonal differences of subjective thermal sensation and neutral temperature in an outdoor shaded space in Tehran, Iran. Sustain. Cities Soc. 2018, 39, 751–764. [Google Scholar] [CrossRef]
- Peel, M.; Finlayson, B.; McMahon, T. Updated World Map of the Koppen-Geiger Climate Classification. Hydrol. Earth Syst. Sci. Discuss. 2007, 4, 1633–1644. [Google Scholar] [CrossRef] [Green Version]
- American Society of Heating, Refrigerating and Air-Conditioning Engineers. 2013 ASHRAE Handbook: Fundamentals; ASHRAE: Atlanta, GA, USA, 2013; Available online: https://www.worldcat.org/title/2013-ashrae-handbook-fundamentals/oclc/882088522 (accessed on 25 May 2022).
- ASHRAE. Standard 55 (Thermal Environmental Conditions for Human Occupancy). 2013. Available online: http://ierga.com/hr/wp-content/uploads/sites/2/2017/10/ASHRAE-55-2013.pdf (accessed on 25 May 2022).
- ASHRAE. Thermal Environmental Conditions for Human Occupancy. 2017. Available online: https://hogiaphat.vn/upload/docs/ASHRAE55-version2017.pdf (accessed on 25 May 2022).
- 9920 II; Ergonomics of the Thermal Environment—Estimation of the Thermal Insulation and Evaporative Resistance of a Clothing Ensemble. International Organization for Standardization, 2007. Available online: https://www.iso.org/standard/39257.html (accessed on 25 May 2022).
- 8996 II; Ergonomics of the Thermal Environment—Determination of Metabolic Rate. International Organization for Standardization, 2021. Available online: https://www.iso.org/standard/74443.html (accessed on 25 May 2022).
- Available online: www.utci.org (accessed on 7 July 2020).
- Matzarakis, A.; Rutz, F.; Mayer, H. Modelling radiation fluxes in simple and complex environments—Application of the RayMan model. Int. J. Biometeorol. 2007, 51, 323–334. [Google Scholar] [CrossRef]
- Shaw, E.W. Thermal Comfort: Analysis and applications in environmental engineering, by P. O. Fanger. 244 pp. DANISH TECHNICAL PRESS. Copenhagen, Denmark, 1970. Danish Kr. 76, 50. R. Soc. Health J. 1972, 92, 164. [Google Scholar] [CrossRef]
- Fanger, P.O. The Energy Balance in Humans (Original Title—Die Energiebilanz des Menschen); Universitat Munchen, Meteorologisches Institut: Munich, Germany, 1984. [Google Scholar]
- Havenith, G.; Kuklane, K.; Fan, J.; Hodder, S.; Ouzzahra, Y.; Lundgren Kownacki, K.; Au, Y.; Loveday, D. A database of static clothing thermal insulation and vapor permeability values of non-Western ensembles for use in ASHRAE Standard 55, ISO 7730, and ISO 9920. ASHRAE Trans. 2015, 121, 197–215. [Google Scholar]
- Al-ajmi, F.F.; Loveday, D.L.; Bedwell, K.H.; Havenith, G. Thermal insulation and clothing area factors of typical Arabian Gulf clothing ensembles for males and females: Measurements using thermal manikins. Appl. Ergon. 2008, 39, 407–414. [Google Scholar] [CrossRef] [PubMed] [Green Version]
- Cheng, Y.; Niu, J.; Gao, N. Thermal comfort models: A review and numerical investigation. Build. Environ. 2012, 47, 13–22. [Google Scholar] [CrossRef]
- Lai, D.; Guo, D.; Hou, Y.; Lin, C.; Chen, Q. Studies of Outdoor Thermal Comfort in Northern China. Build. Environ. 2014, 77, 110–118. [Google Scholar] [CrossRef]
- Staiger, H.; Laschewski, G.; Matzarakis, A. Selection of Appropriate Thermal Indices for Applications in Human Biometeorological Studies. Atmosphere 2019, 10, 18. [Google Scholar] [CrossRef] [Green Version]
- Pantavou, K.; Theoharatos, G.; Santamouris, M.; Asimakopoulos, D. Outdoor thermal sensation of pedestrians in a Mediterranean climate and a comparison with UTCI. Build. Environ. 2013, 66, 82–95. [Google Scholar] [CrossRef]
- Zhu, N.; Chong, D. Evaluation and improvement of human heat tolerance in built environments: A review. Sustain. Cities Soc. 2019, 51, 101797. [Google Scholar] [CrossRef]
- Binarti, F.; Koerniawan, M.D.; Triyadi, S.; Utami, S.S.; Matzarakis, A. A review of outdoor thermal comfort indices and neutral ranges for hot-humid regions. Urban Clim. 2020, 31, 100531. [Google Scholar] [CrossRef]
- Huang, J.; Zhou, C.; Zhuo, Y.; Xu, L.; Jiang, Y. Outdoor thermal environments and activities in open space: An experiment study in humid subtropical climates. Build. Environ. 2016, 103, 238–249. [Google Scholar] [CrossRef] [Green Version]
- Cheung, P.K.; Jim, C.Y. Comparing the cooling effects of a tree and a concrete shelter using PET and UTCI. Build. Environ. 2018, 130, 49–61. [Google Scholar] [CrossRef]
- Golasi, I.; Salata, F.; Vollaro, E.; Coppi, M. Complying with the demand of standardization in outdoor thermal comfort: A first approach to the Global Outdoor Comfort Index (GOCI). Build. Environ. 2018, 130, 104–119. [Google Scholar] [CrossRef]
- Jin, H.; Liu, S.; Kang, J. Thermal comfort range and influence factor of urban pedestrian streets in severe cold regions. Energy Build. 2019, 198, 197–206. [Google Scholar] [CrossRef]
- de Arêa Leão Borges, V.C.; Callejas, I.J.A.; Durante, L.C. Thermal sensation in outdoor urban spaces: A study in a Tropical Savannah climate, Brazil. Int. J. Biometeorol. 2020, 64, 533–545. [Google Scholar] [CrossRef]
- Ulpiani, G.; Di Giuseppe, E.; Di Perna, C.; D’Orazio, M.; Zinzi, M. Thermal comfort improvement in urban spaces with water spray systems: Field measurements and survey. Build. Environ. 2019, 156, 46–61. [Google Scholar] [CrossRef]
- Sen, J.; Nag, P.K. Effectiveness of human-thermal indices: Spatio–temporal trend of human warmth in tropical India. Urban Clim. 2019, 27, 351–371. [Google Scholar] [CrossRef]
- Haghshenas, M.; Hadianpour, M.; Matzarakis, A.; Mahdavinejad, M.; Ansari, M. Improving the suitability of selected thermal indices for predicting outdoor thermal sensation in Tehran. Sustain. Cities Soc. 2021, 74, 103205. [Google Scholar] [CrossRef]


| Sensor Type | Variable | Measurement Range | Accuracy |
|---|---|---|---|
| TP3275 (Thin-film Pt100) | Ta | −30 °C–100 °C | Class 1/3 DIN |
| TP3275 (Ø = 15 cm) with a Pt100 sensor | Tg | −30 °C–120 °C | Class 1/3 DIN |
| HP3201 natural wet bulb probe (Pt100) | Tw | 4 °C–80 °C | Class A |
| AP3203 (NTC 10 Kohm) AP3203–F (NTC 10 Kohm) | WS | 0.05–5 ms−1 (0–80 °C) 0.05–5 ms−1 (−30 to 30 °C) | ±0.02 (0.05–1 ms−1) ±0.1 (1–5 ms−1) |
| HP3217R (Capacity sensor) | RH | 5–98% | ±2.5% |
| Ta (°C) | RH (%) | v (m/s) | MRT (°C) | Tg (°C) | P (hpa) | Icl | M (W/m2) | ||
|---|---|---|---|---|---|---|---|---|---|
| Cold Season (N = 270) | Mean | 9.3 | 43.1 | 1.7 | 8 | 9 | 871.3 | 1.2 | 88.2 |
| St. Dev. | 5.2 | 13.8 | 0.6 | 6.9 | 5.6 | 74.8 | 0.1 | 23.4 | |
| Max. | 21.3 | 65.6 | 4.2 | 26.1 | 34.2 | 877.5 | 1.4 | 152.5 | |
| Min. | 4 | 24.3 | 0.3 | 0.4 | 1.7 | 860.2 | 0.7 | 62.5 | |
| Hot Season (N = 114) | Mean | 31.6 | 14.3 | 1.1 | 34 | 32.4 | 868.8 | 0.7 | 70.1 |
| St. Dev. | 5.1 | 4.3 | 0.9 | 7.6 | 3.6 | 114.4 | 0.1 | 13.6 | |
| Max. | 36.3 | 22.2 | 3.5 | 46.6 | 24.7 | 871.1 | 0.8 | 98.8 | |
| Min. | 27.7 | 8.8 | 0.08 | 26.3 | 17.8 | 866.1 | 0.5 | 62.5 | |
| Season | Descriptive Analysis | Gender | Age Range | |||||
|---|---|---|---|---|---|---|---|---|
| Female | Male | <24 | 25–30 | 31–35 | 36–40 | >40 | ||
| Winter | Frequency (N) | 140 | 130 | 73 | 110 | 22 | 24 | 41 |
| Percentage | 51.8% | 48.1% | 27% | 40.7% | 8.1% | 8.9% | 15.2% | |
| Summer | Frequency (N) | 52 | 62 | 26 | 52 | 19 | 11 | 6 |
| Percentage | 45.6% | 54.4% | 22.8% | 45.6% | 16.7% | 9.6% | 5.3% | |
| Chi-square | 21.4 | 279.4 | ||||||
| Sig. level (2-tailed) | 0.002 | 0.6 | ||||||
Publisher’s Note: MDPI stays neutral with regard to jurisdictional claims in published maps and institutional affiliations. |
© 2022 by the authors. Licensee MDPI, Basel, Switzerland. This article is an open access article distributed under the terms and conditions of the Creative Commons Attribution (CC BY) license (https://creativecommons.org/licenses/by/4.0/).
Share and Cite
Zafarmandi, S.; Mahdavinejad, M.; Norford, L.; Matzarakis, A. Analyzing Thermal Comfort Sensations in Semi-Outdoor Space on a University Campus: On-Site Measurements in Tehran’s Hot and Cold Seasons. Atmosphere 2022, 13, 1034. https://0-doi-org.brum.beds.ac.uk/10.3390/atmos13071034
Zafarmandi S, Mahdavinejad M, Norford L, Matzarakis A. Analyzing Thermal Comfort Sensations in Semi-Outdoor Space on a University Campus: On-Site Measurements in Tehran’s Hot and Cold Seasons. Atmosphere. 2022; 13(7):1034. https://0-doi-org.brum.beds.ac.uk/10.3390/atmos13071034
Chicago/Turabian StyleZafarmandi, Sevil, Mohammadjavad Mahdavinejad, Leslie Norford, and Andreas Matzarakis. 2022. "Analyzing Thermal Comfort Sensations in Semi-Outdoor Space on a University Campus: On-Site Measurements in Tehran’s Hot and Cold Seasons" Atmosphere 13, no. 7: 1034. https://0-doi-org.brum.beds.ac.uk/10.3390/atmos13071034