


PM2.5 Pollution in Six Major Chinese Urban Agglomerations: Spatiotemporal Variations, Health Impacts, and the Relationships with Meteorological Conditions

Abstract
:1. Introduction
2. Data and Methods
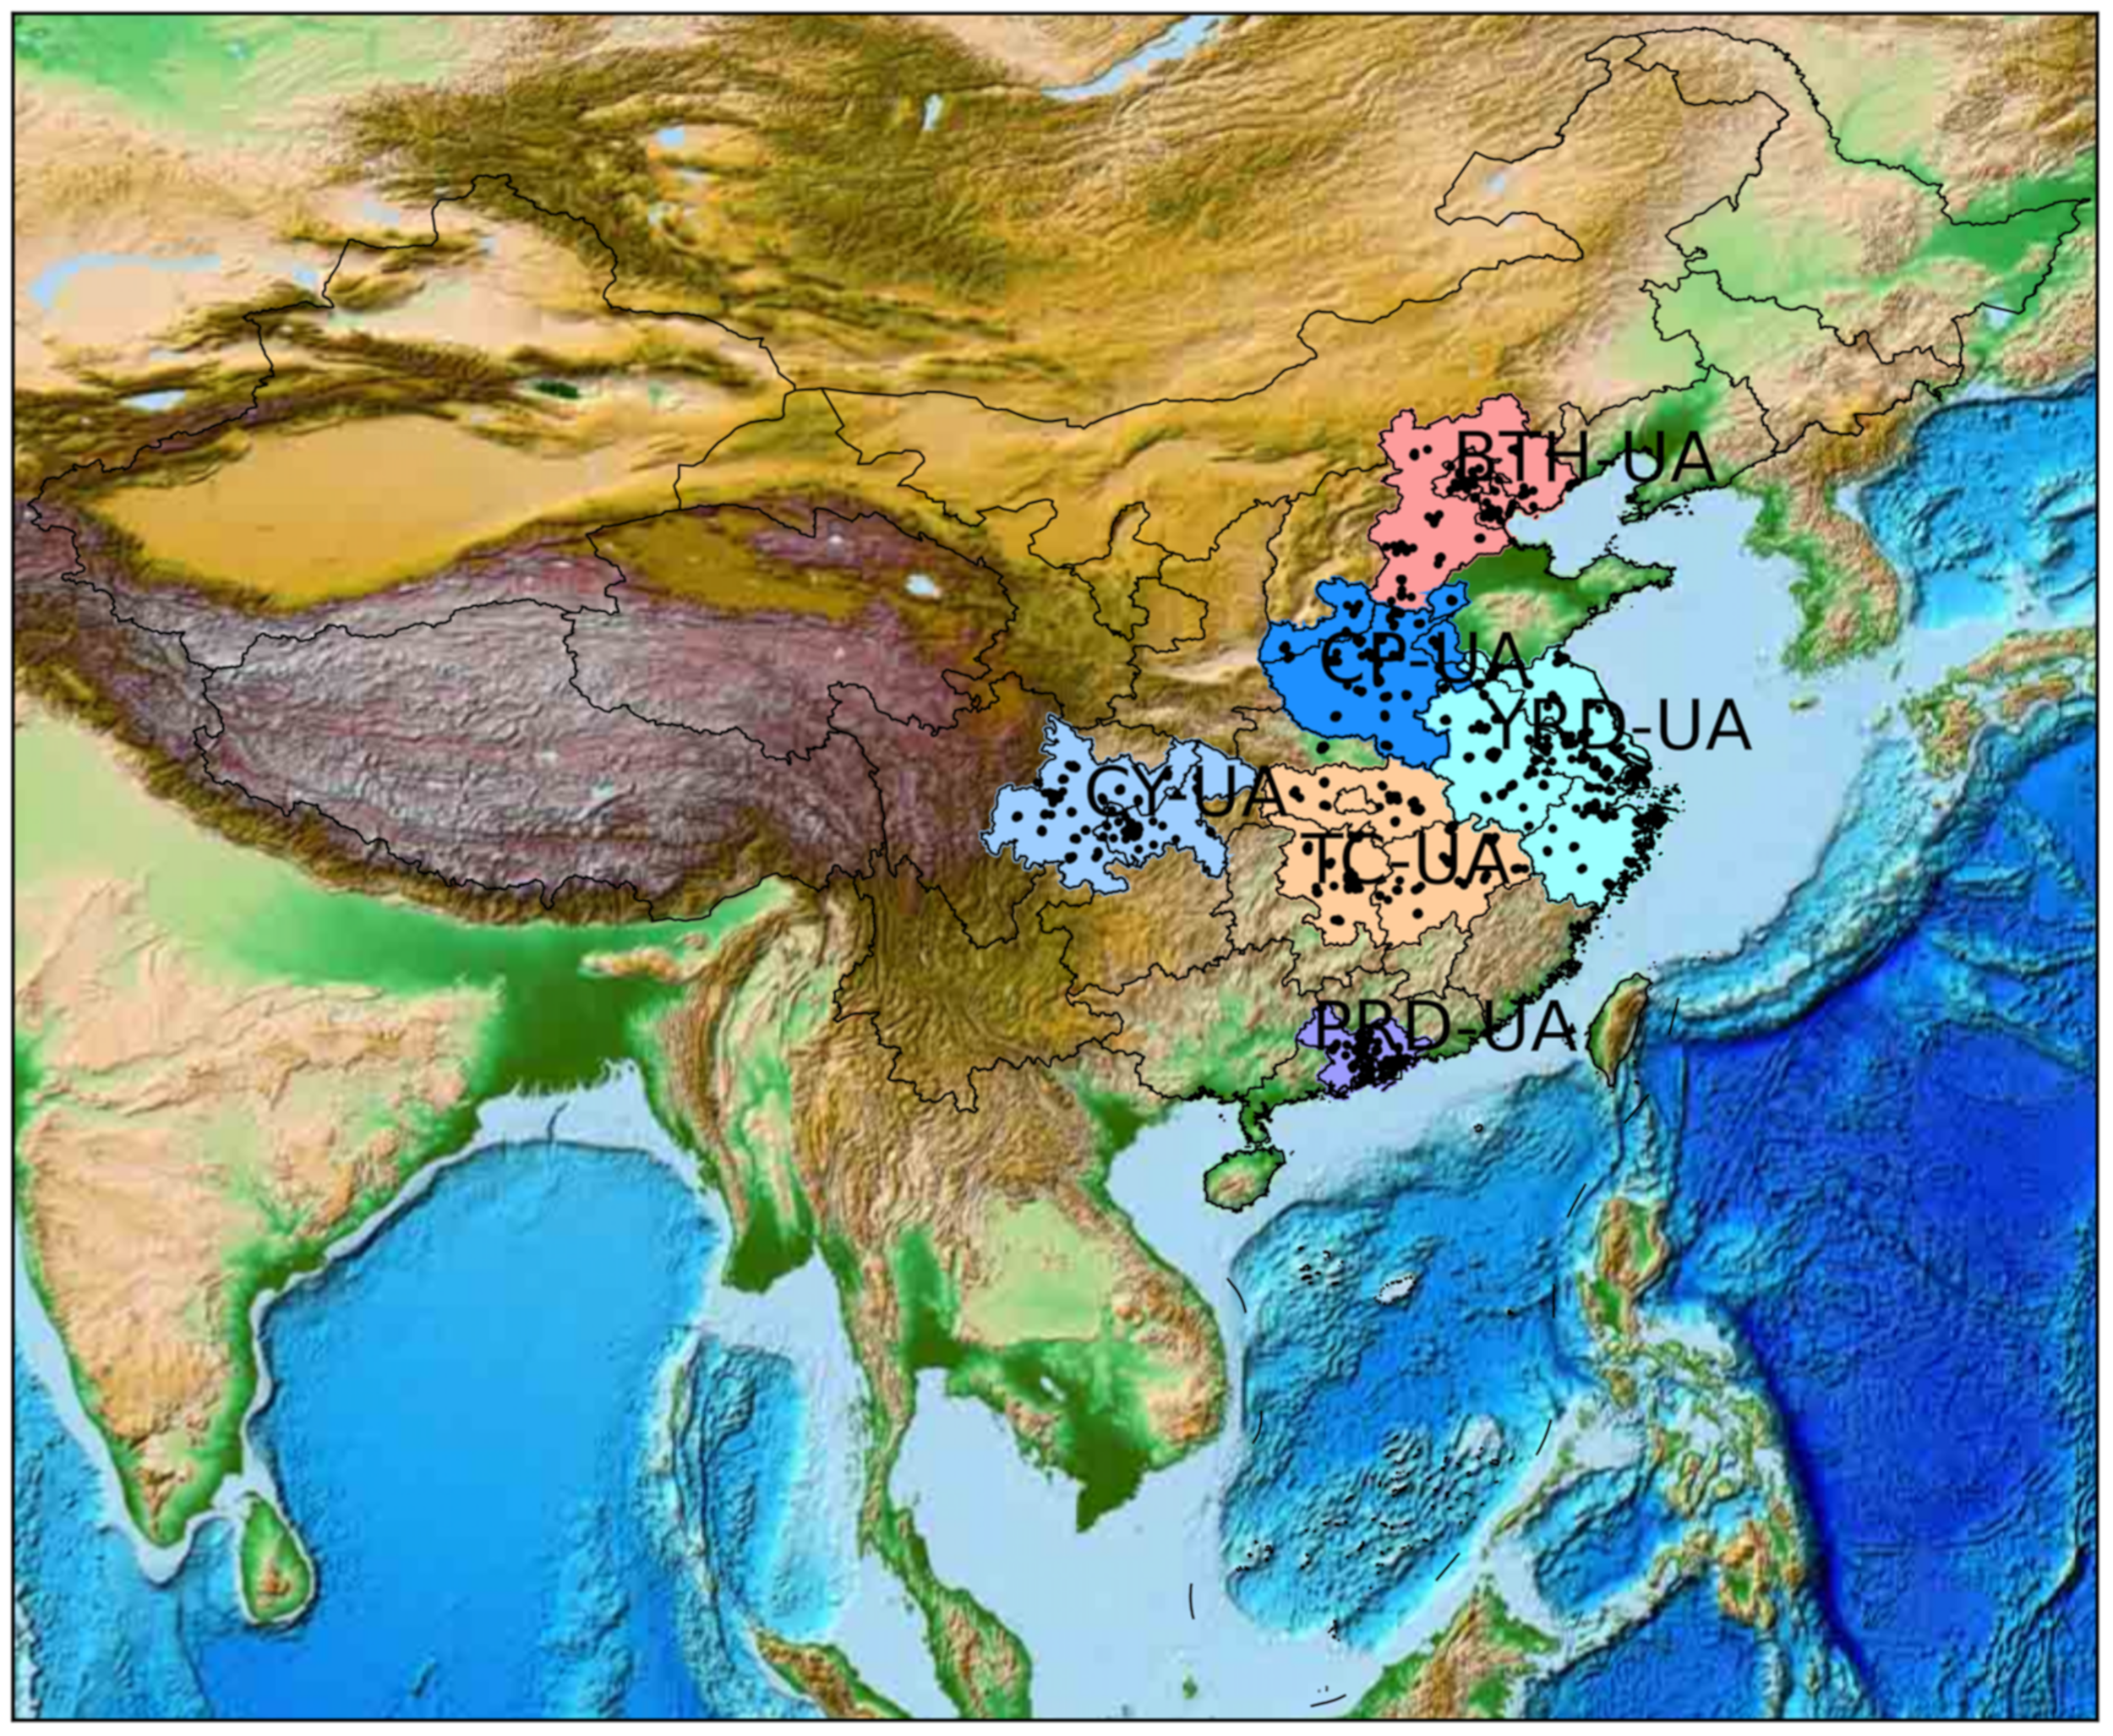
2.1. Study Area
2.2. Data Source and Description
2.3. Spatiotemporal Variation Analysis Methods
2.3.1. Kernel Density Estimation
2.3.2. Empirical Orthogonal Function Analysis
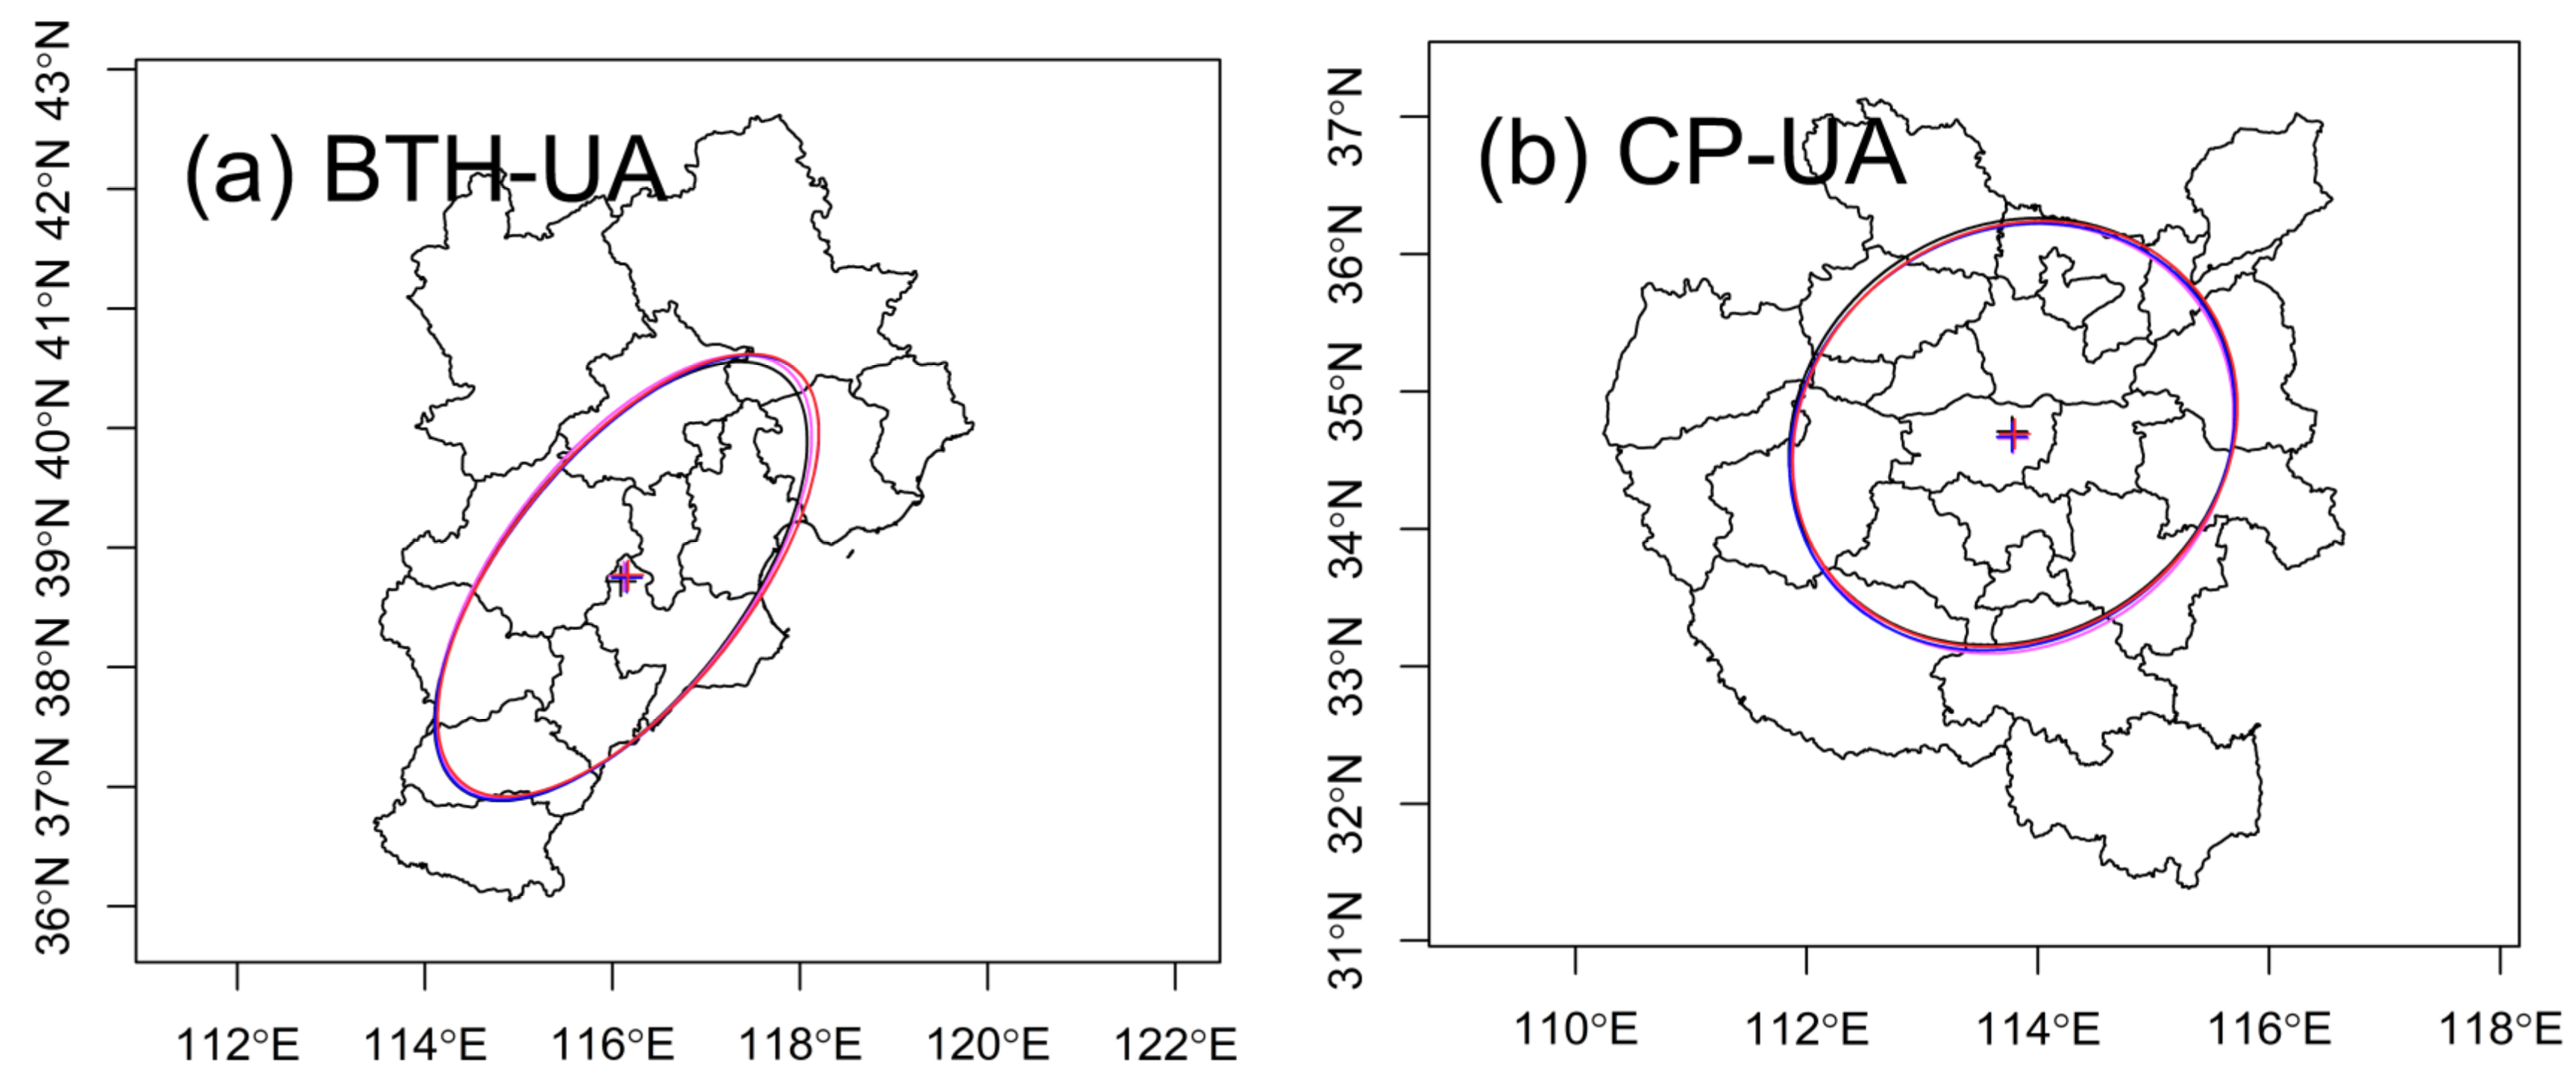
2.3.3. Standard Deviational Ellipse
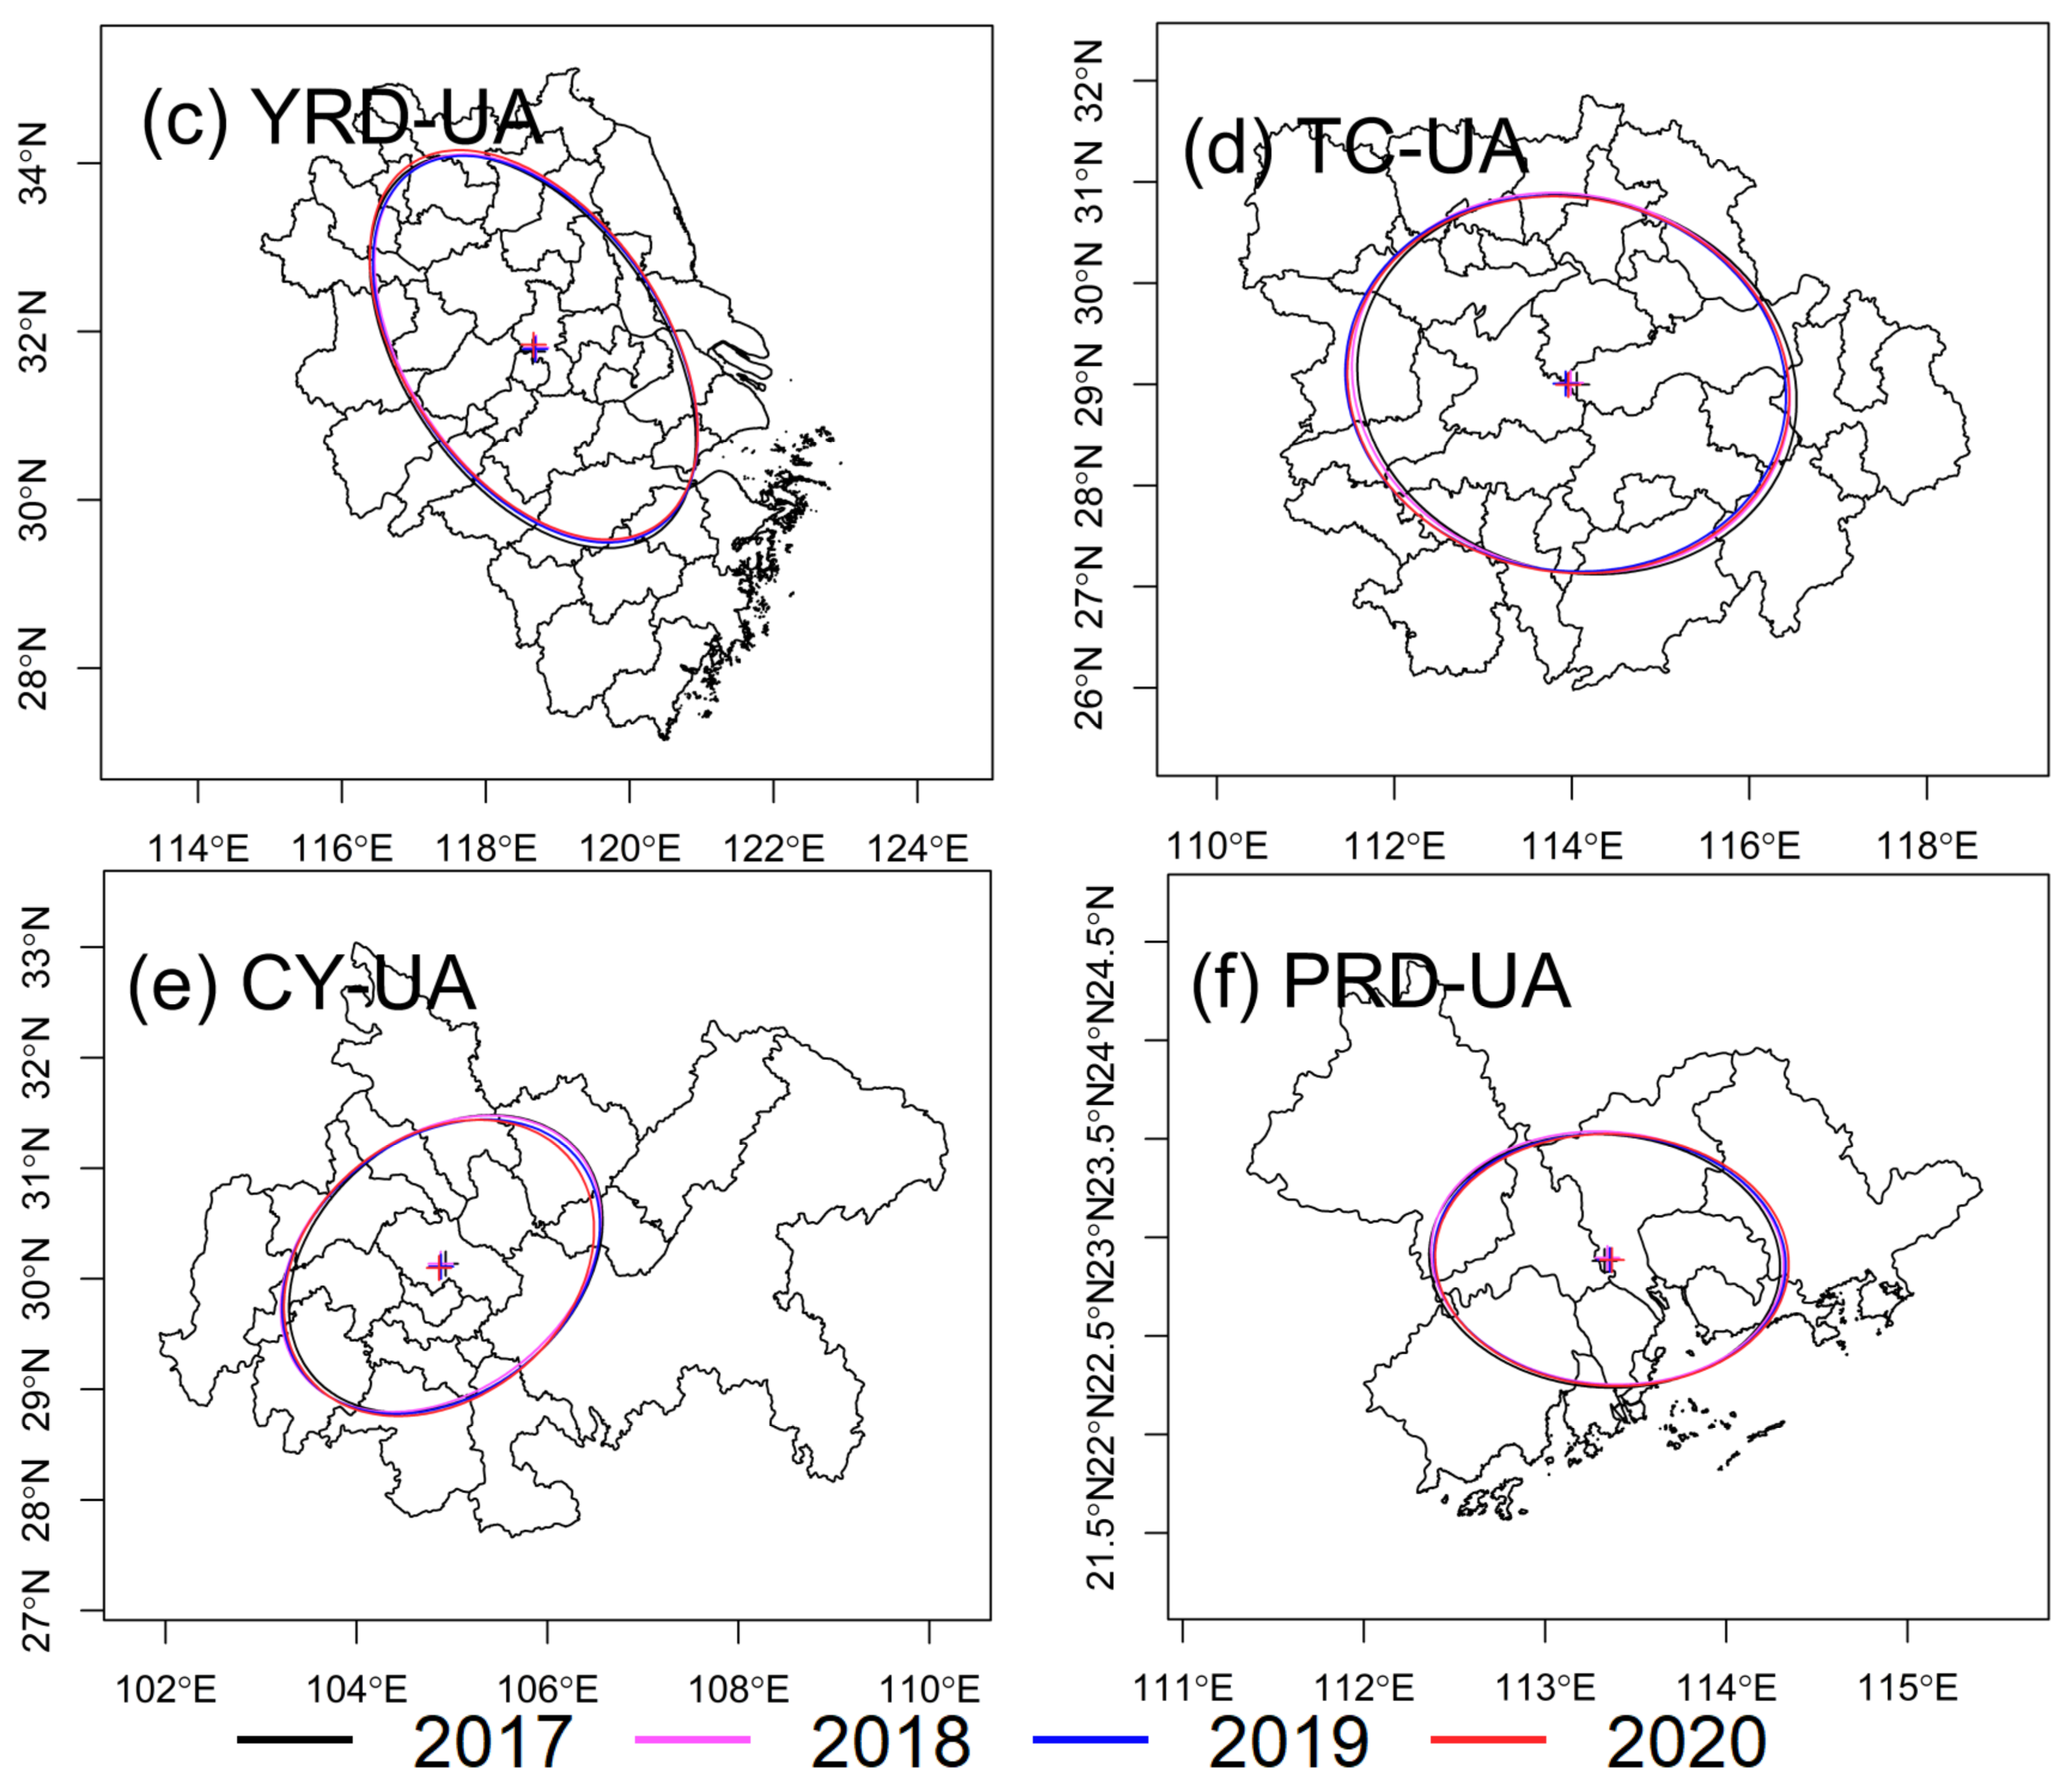
2.3.4. Spatial Autocorrelation Analysis
2.4. Health Effect Assessment
3. Temporal Variations of PM2.5 in Six Urban Agglomerations
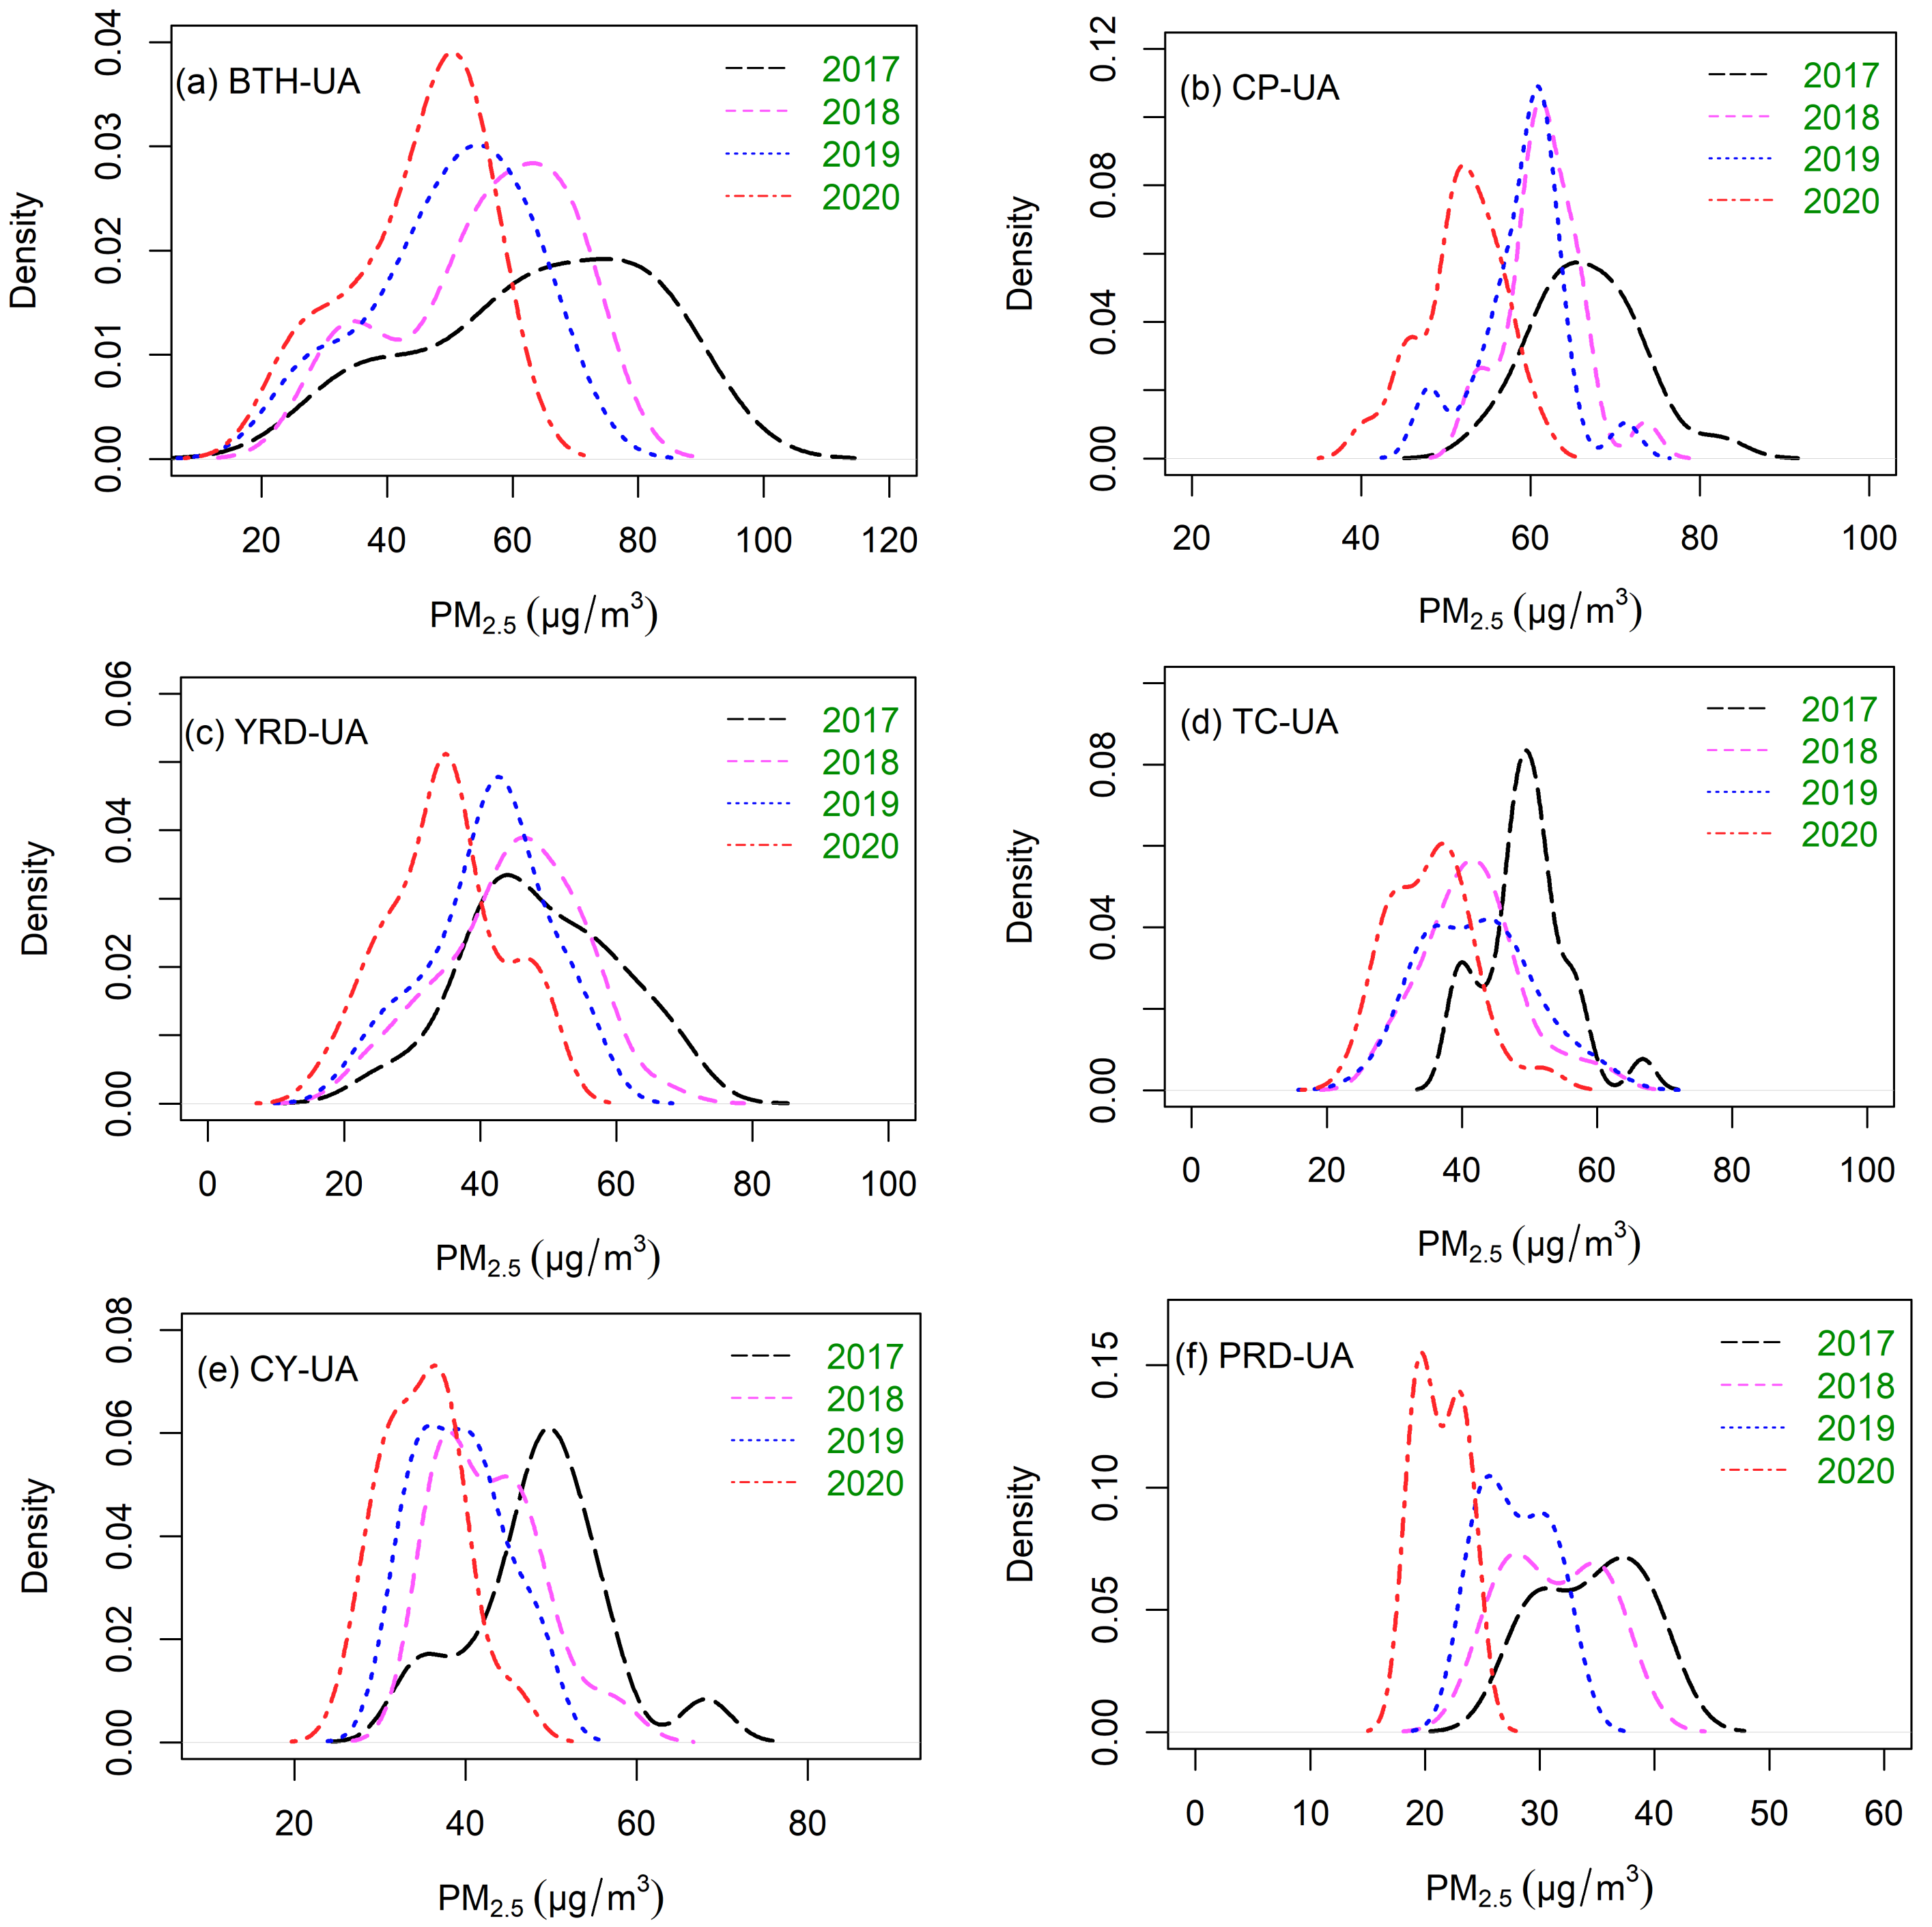
3.1. Annual Variation
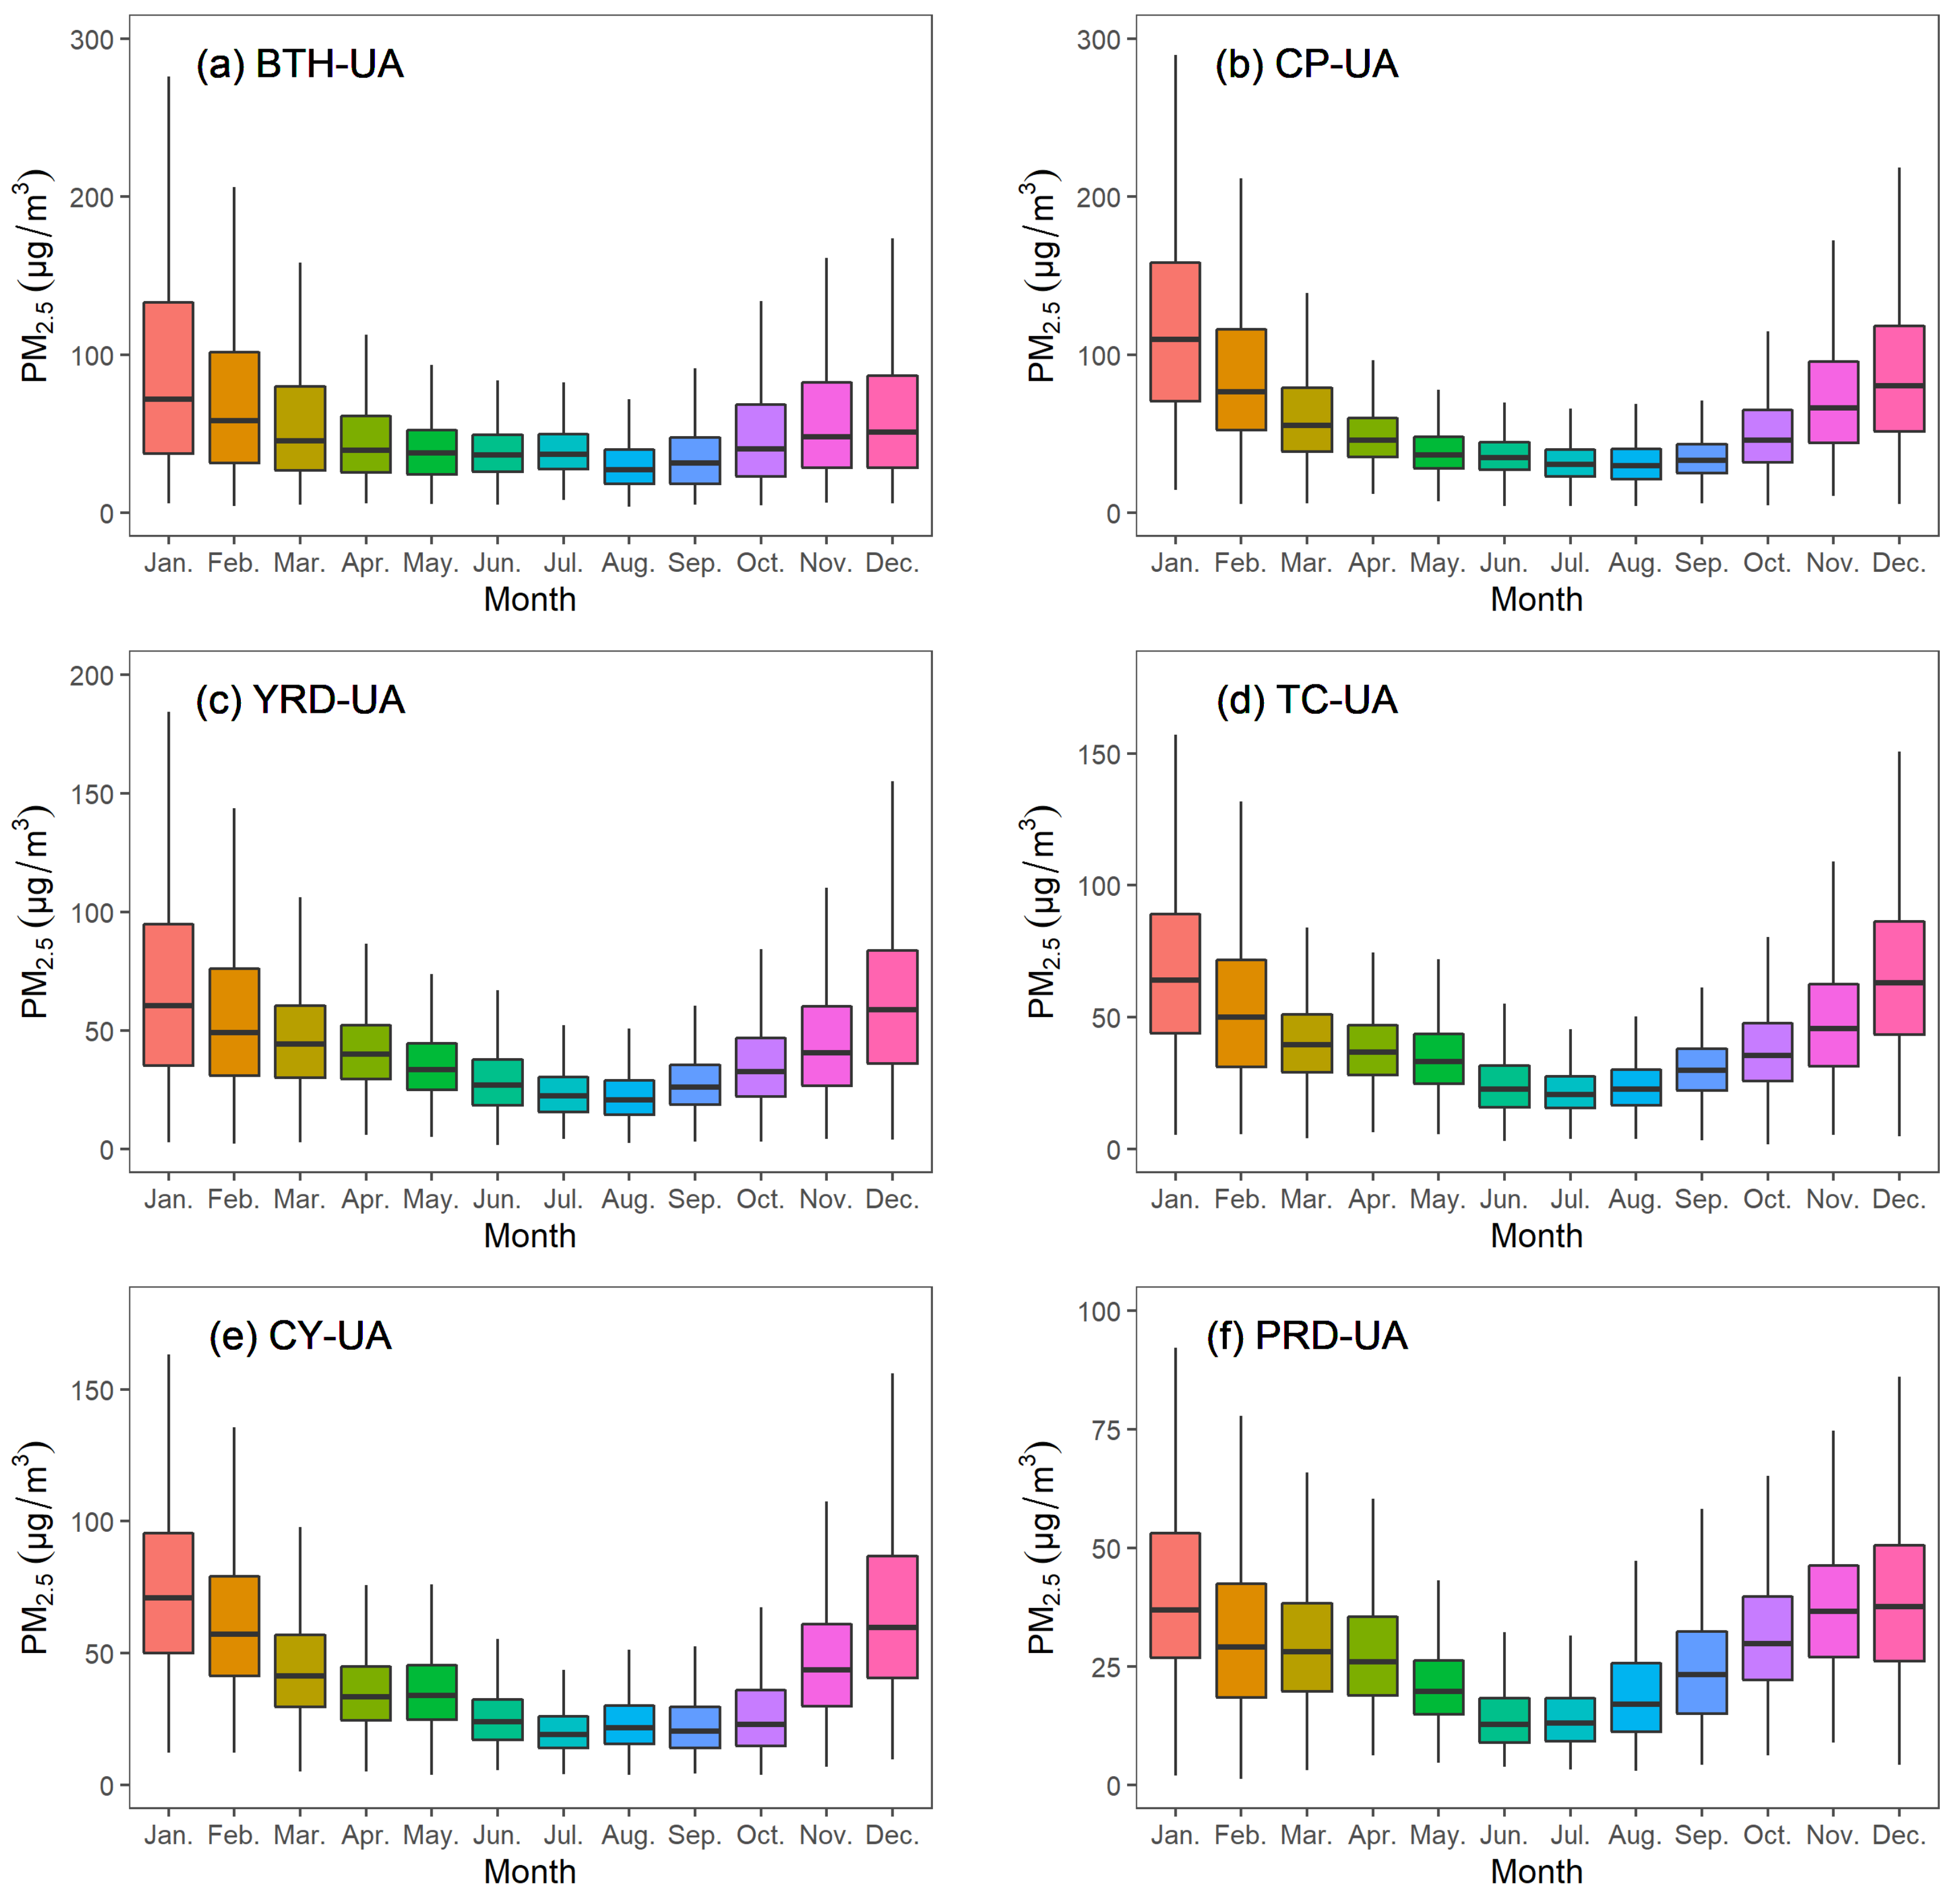
3.2. Monthly Variation
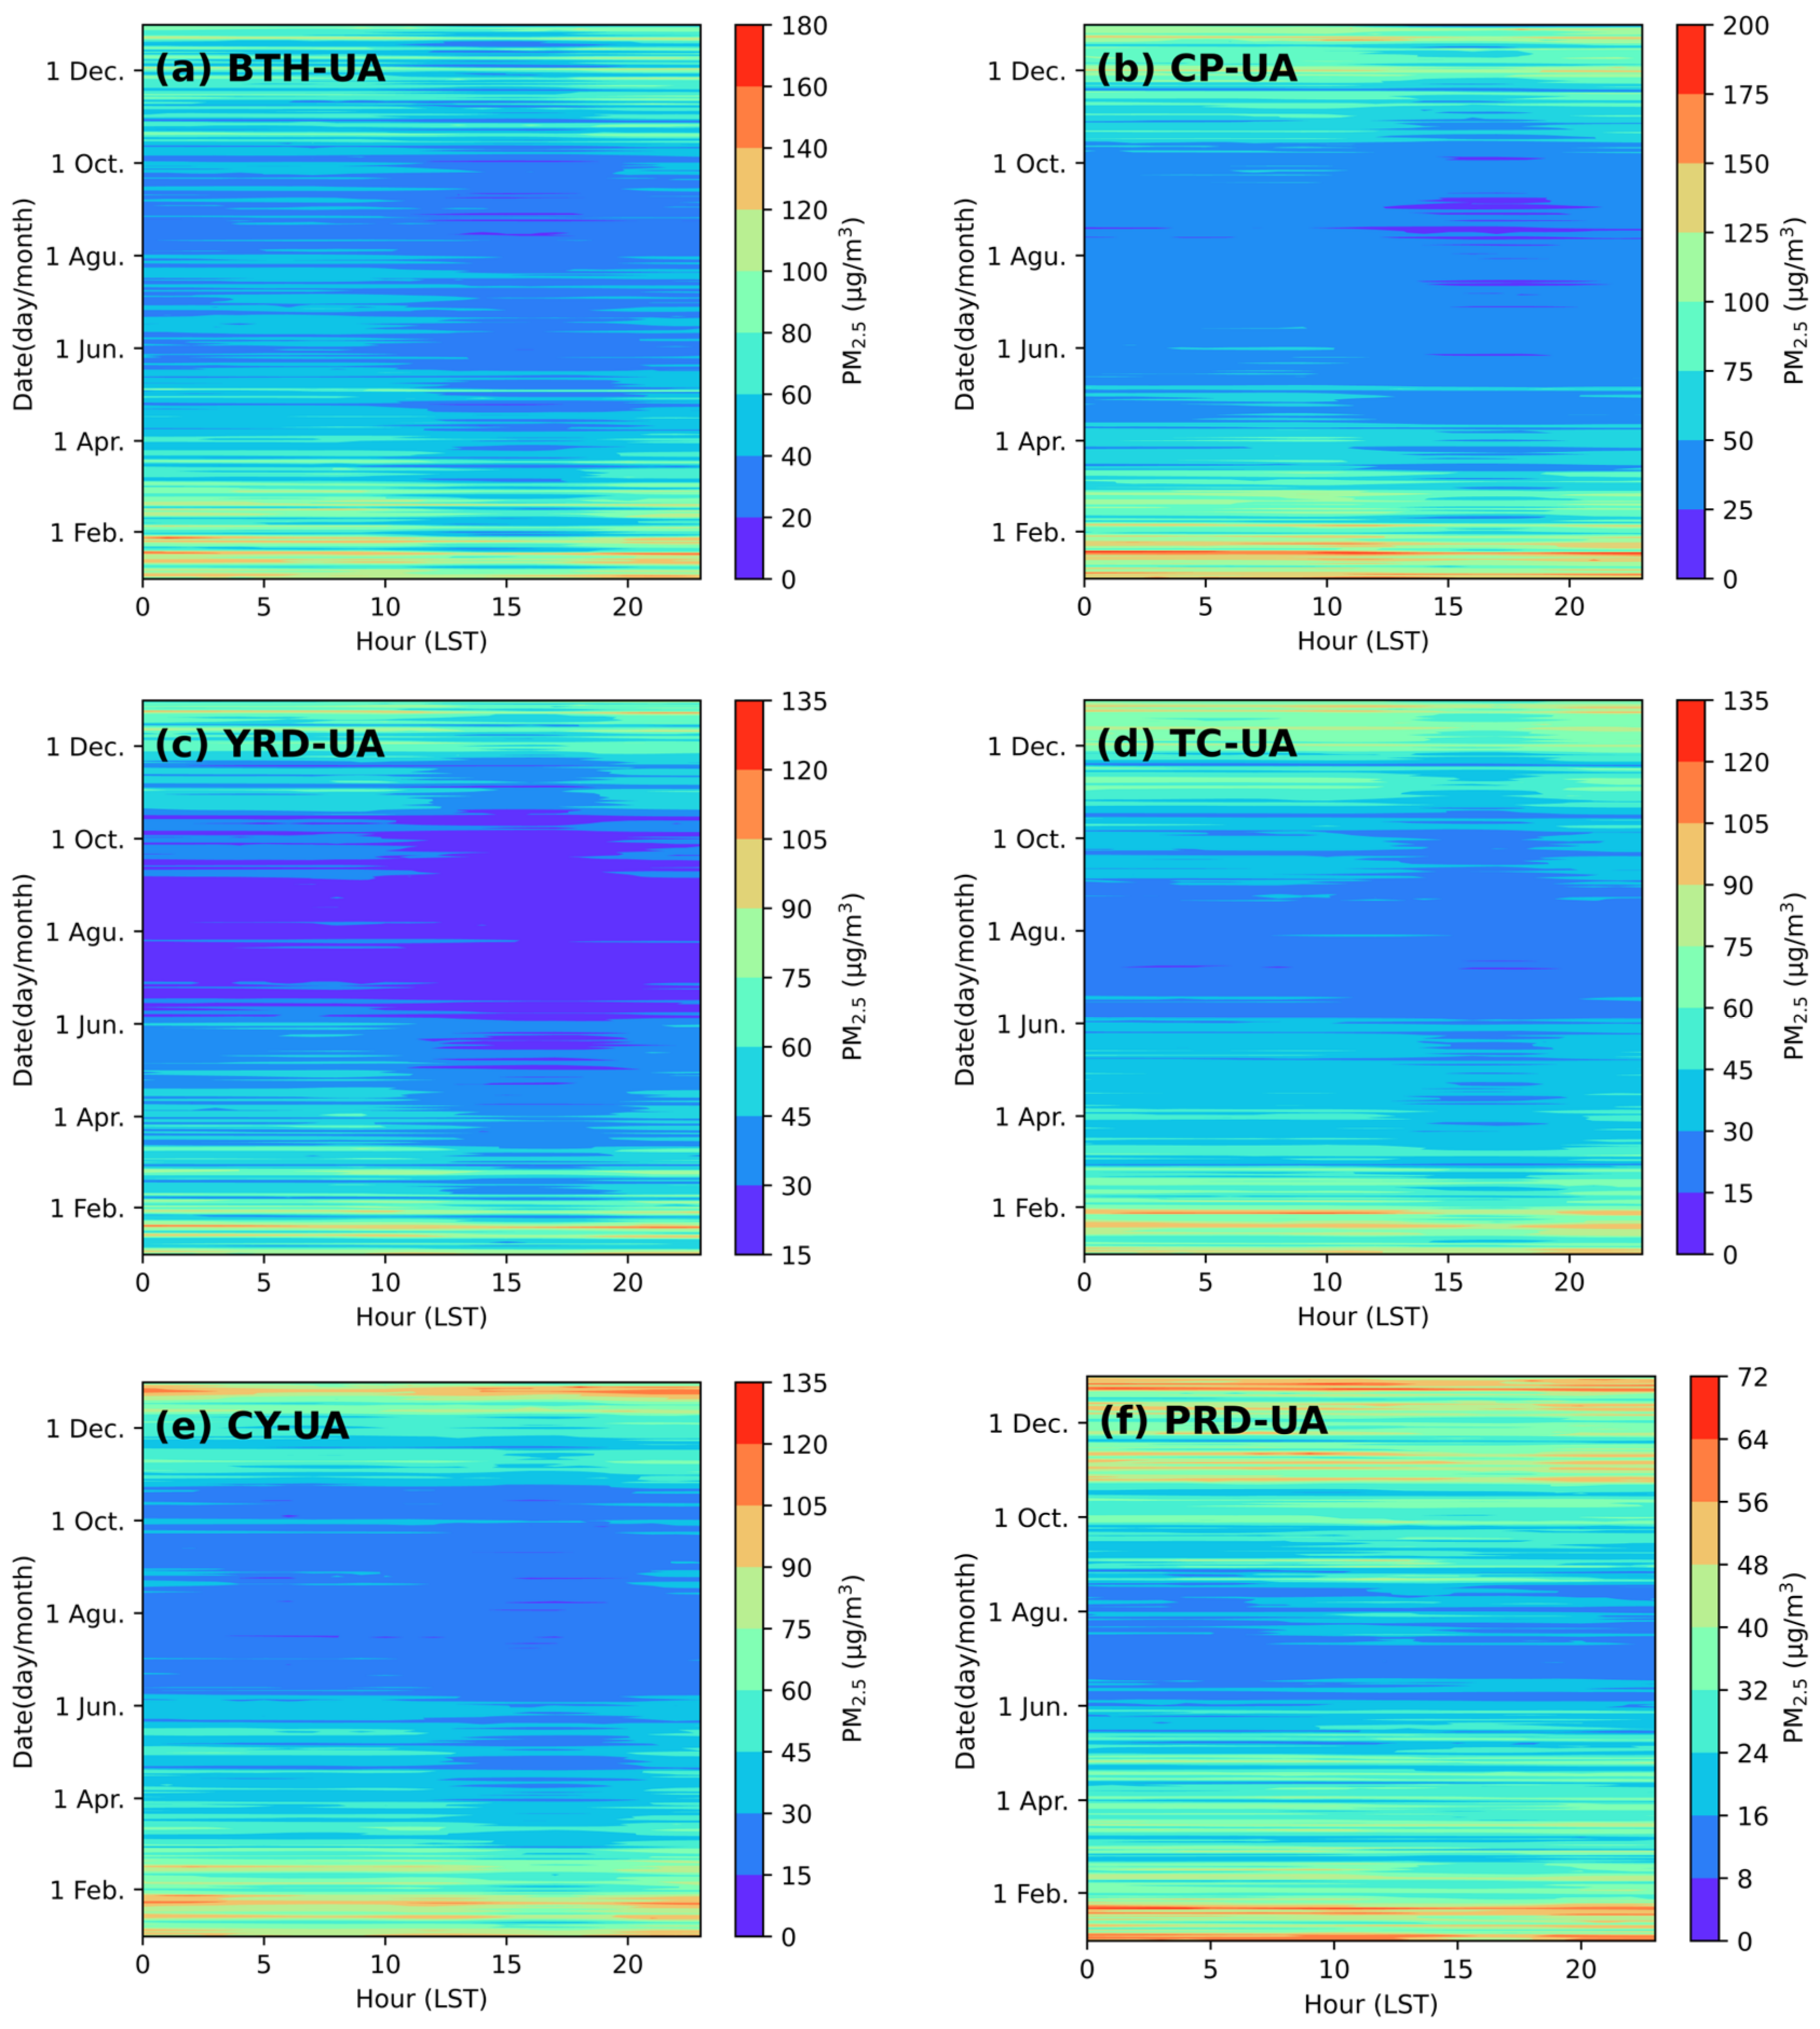
3.3. Diurnal Variation
4. Spatial Variations of PM2.5 in Six Urban Agglomerations
4.1. Standard Deviational Ellipse Analysis
4.2. Spatial Autocorrelation of PM2.5 Concentrations
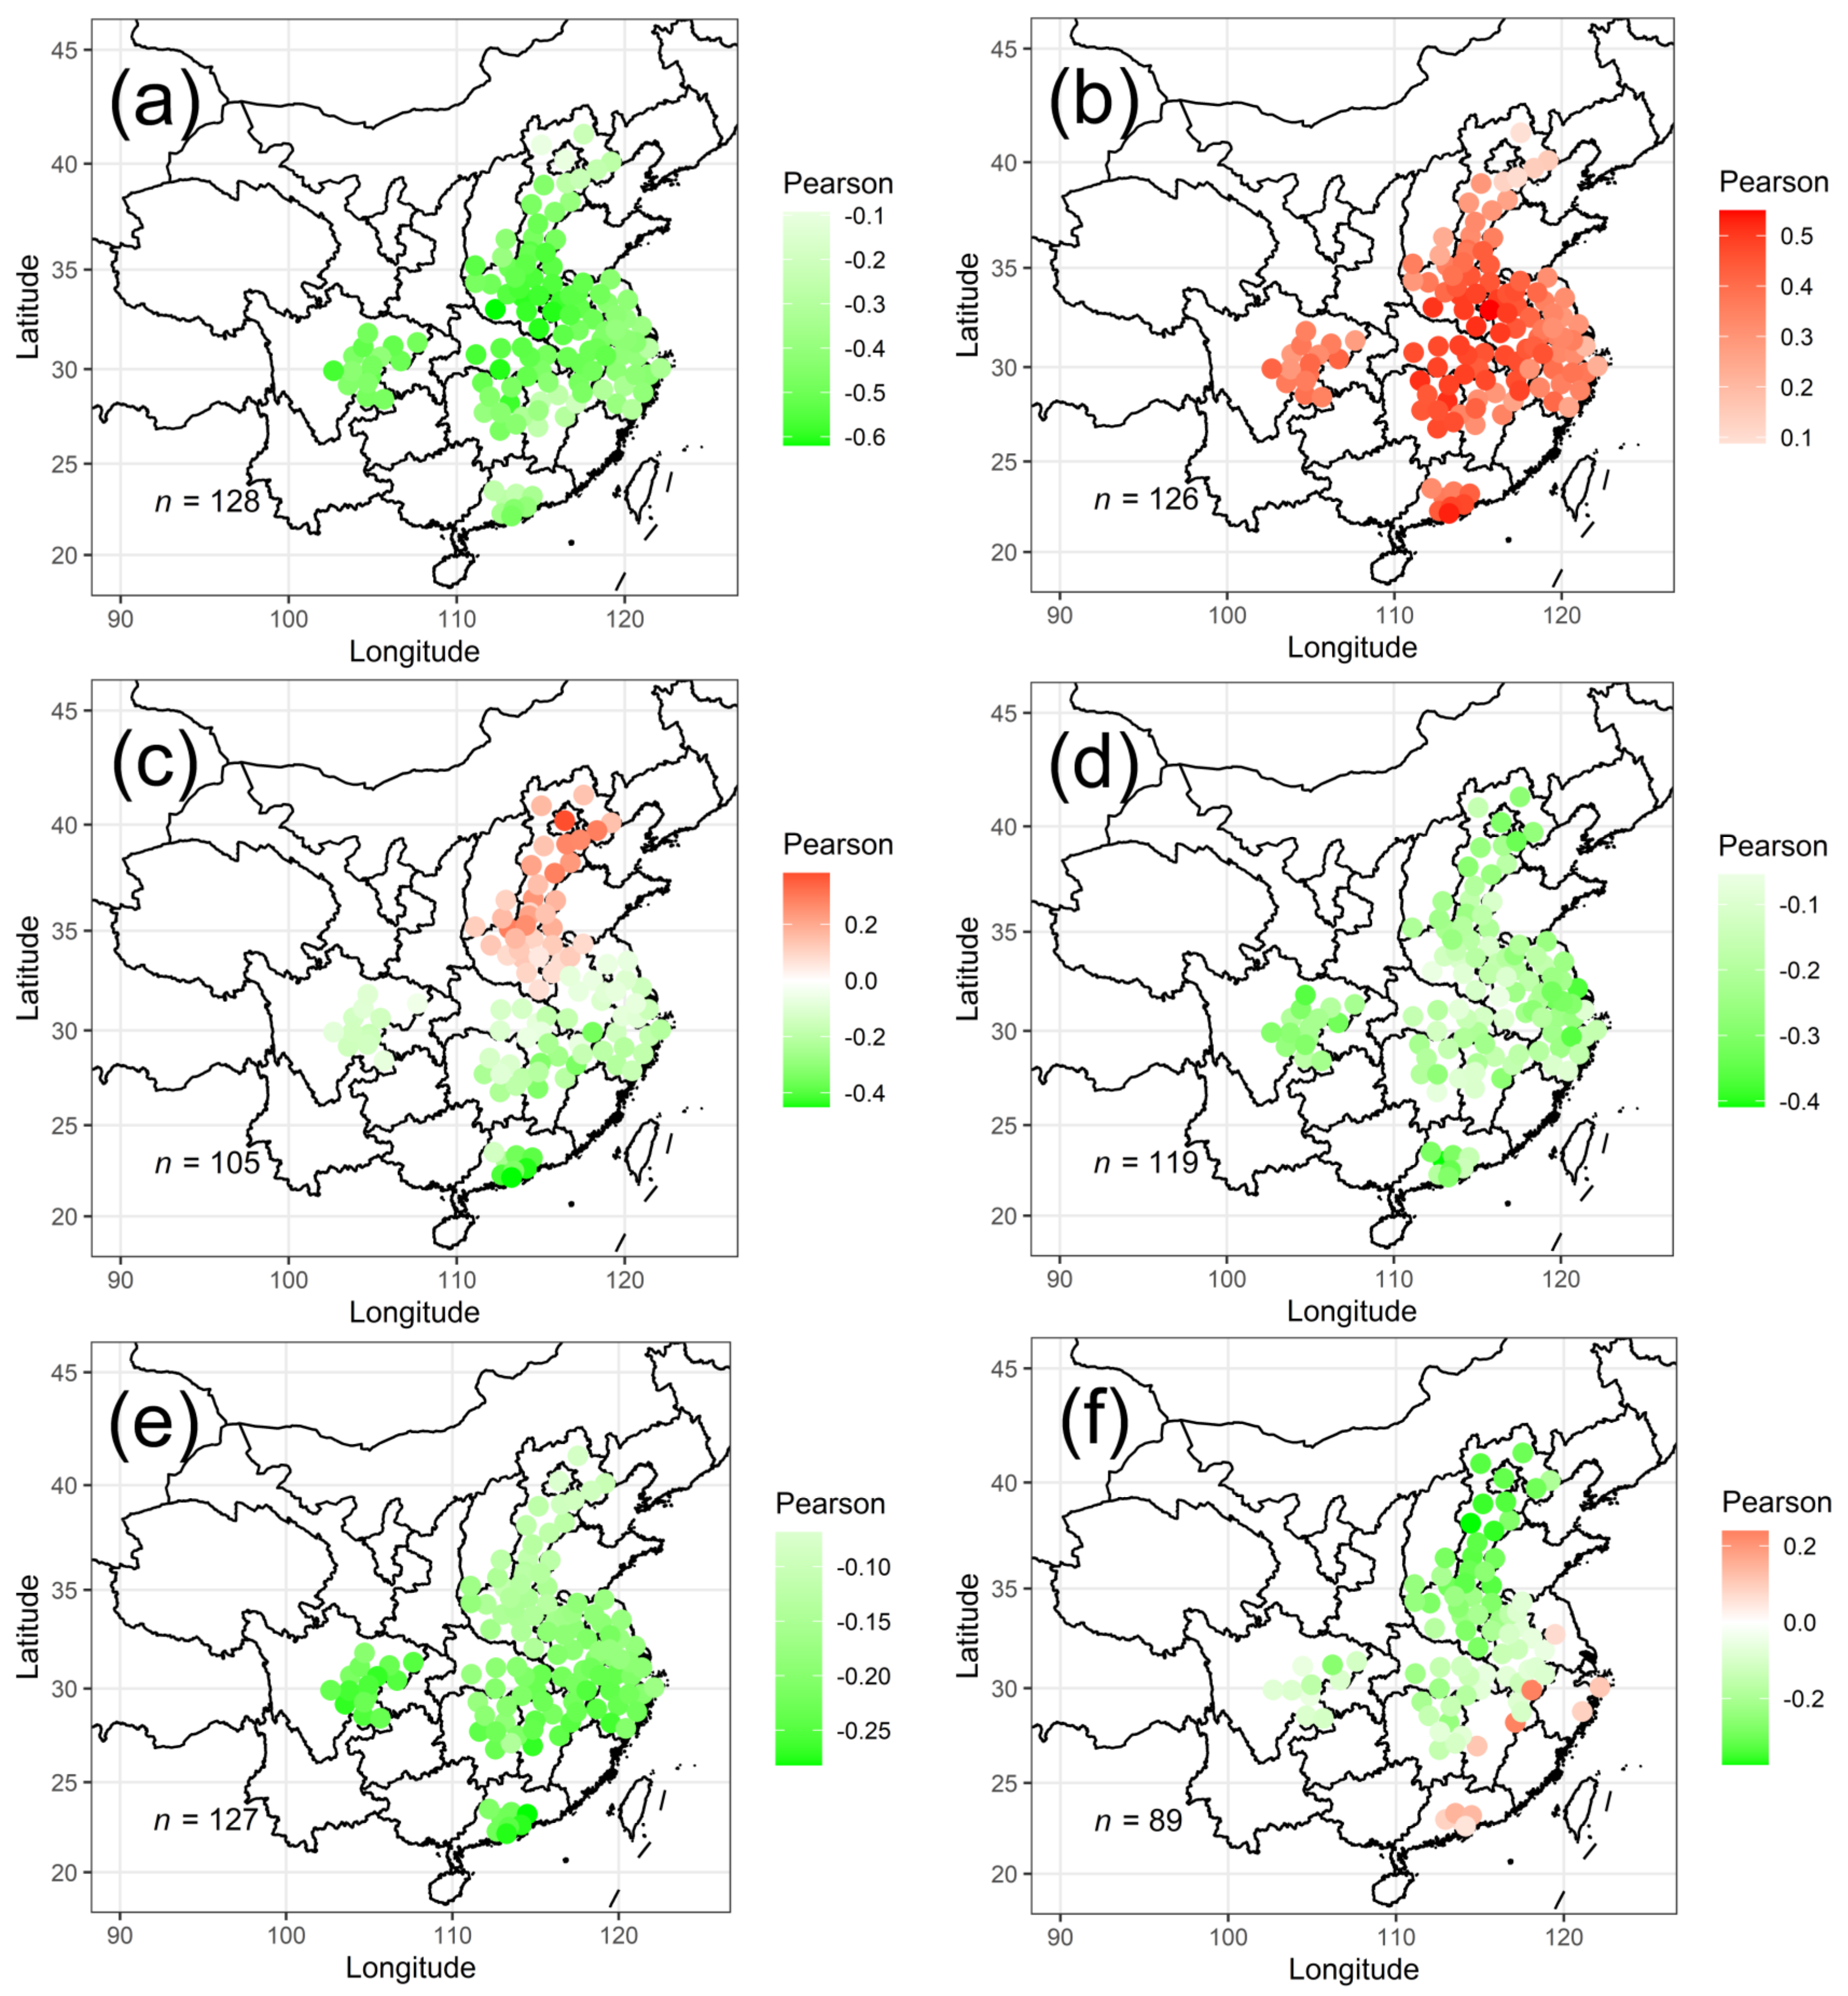
5. Relationships between Meteorological Conditions and PM2.5 Concentrations
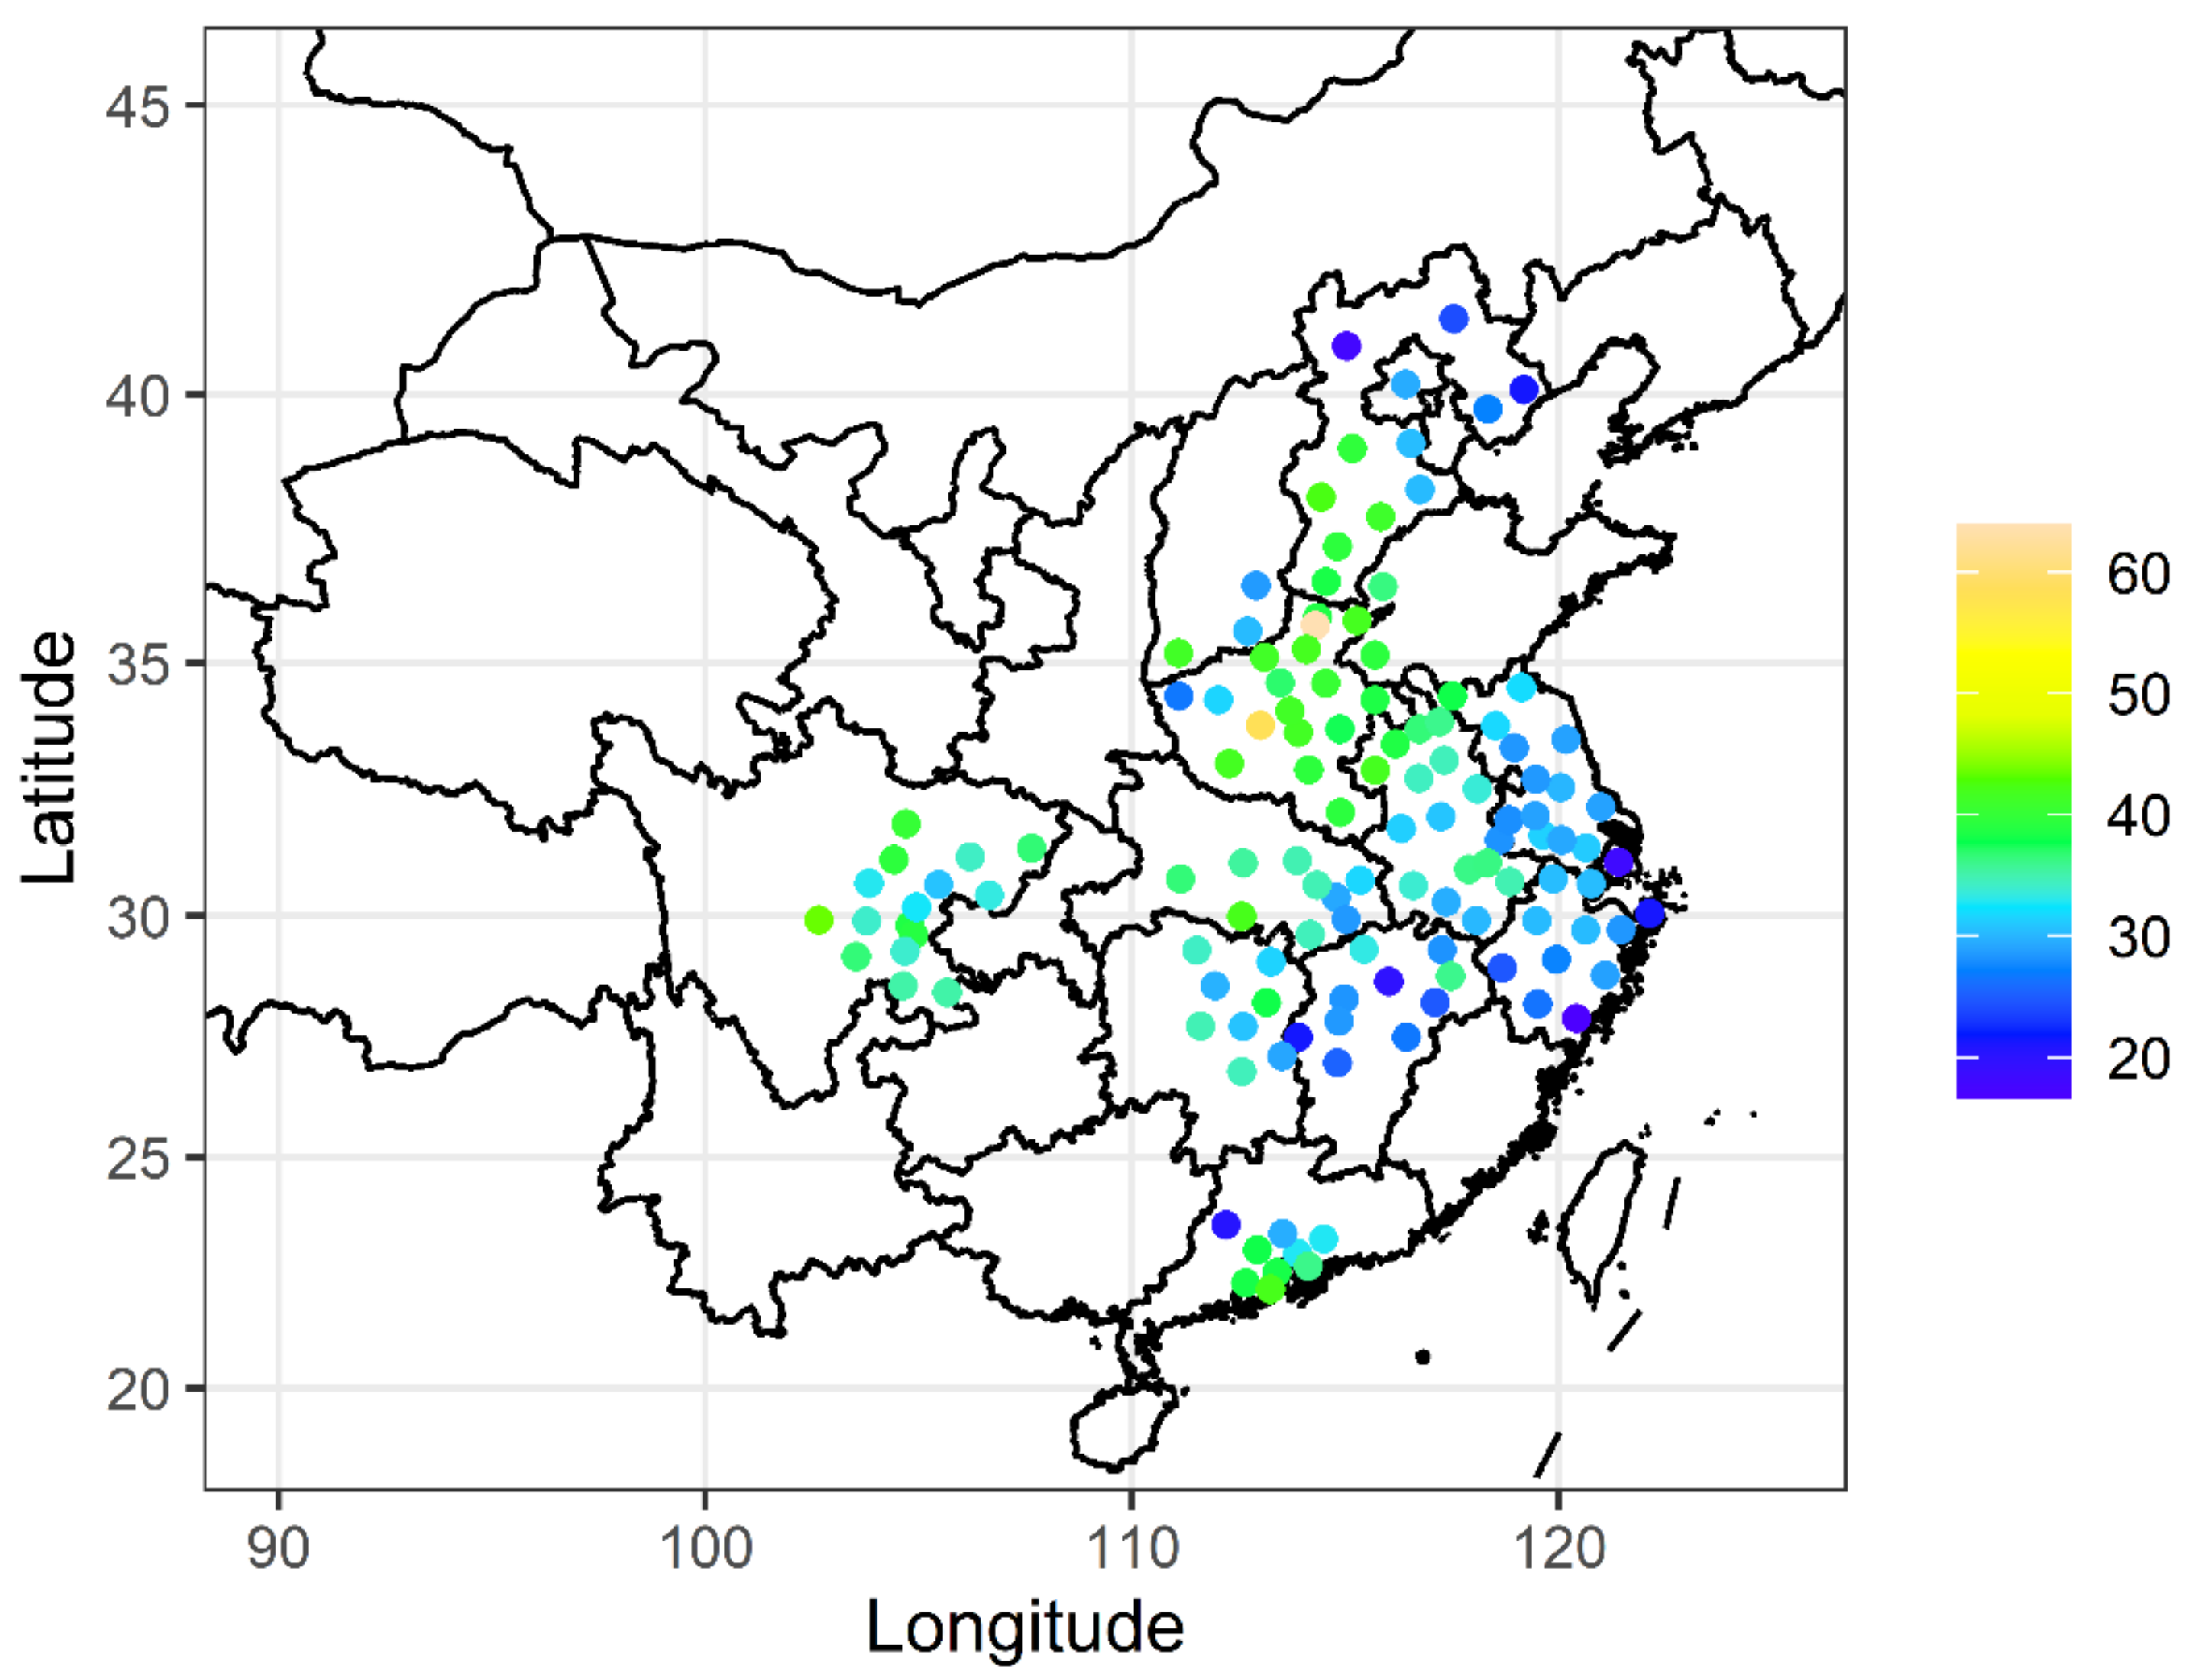
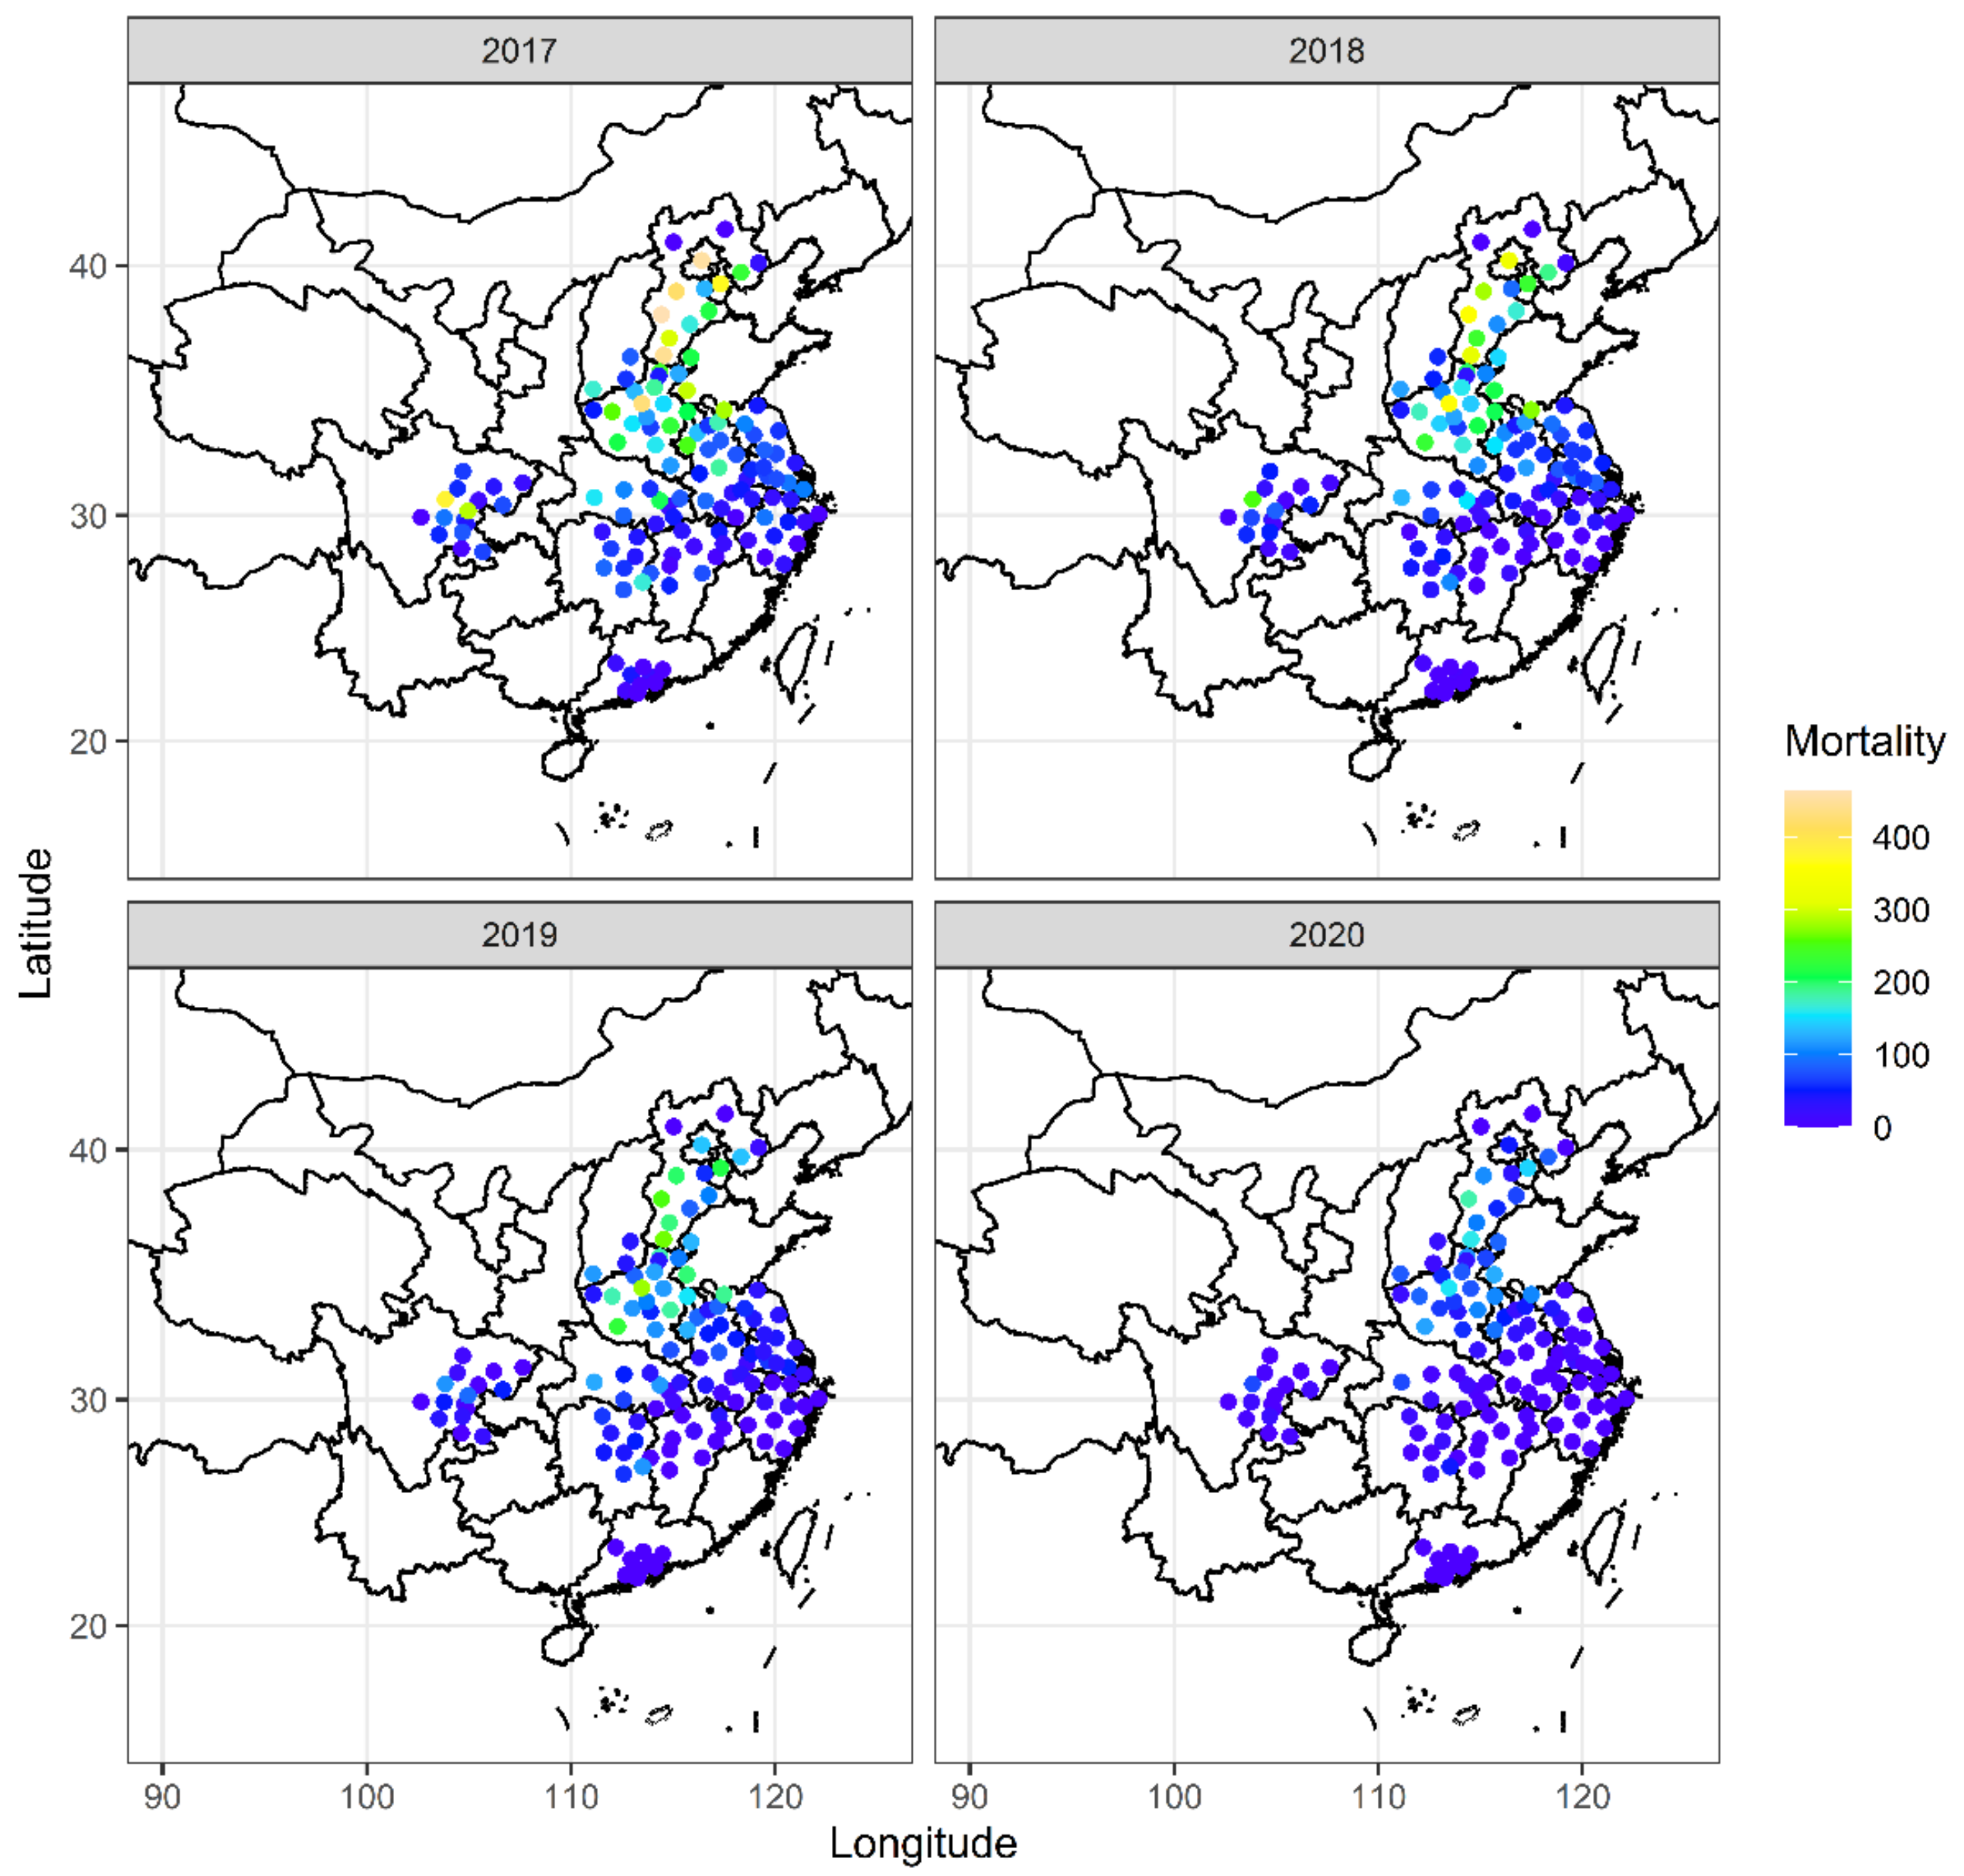
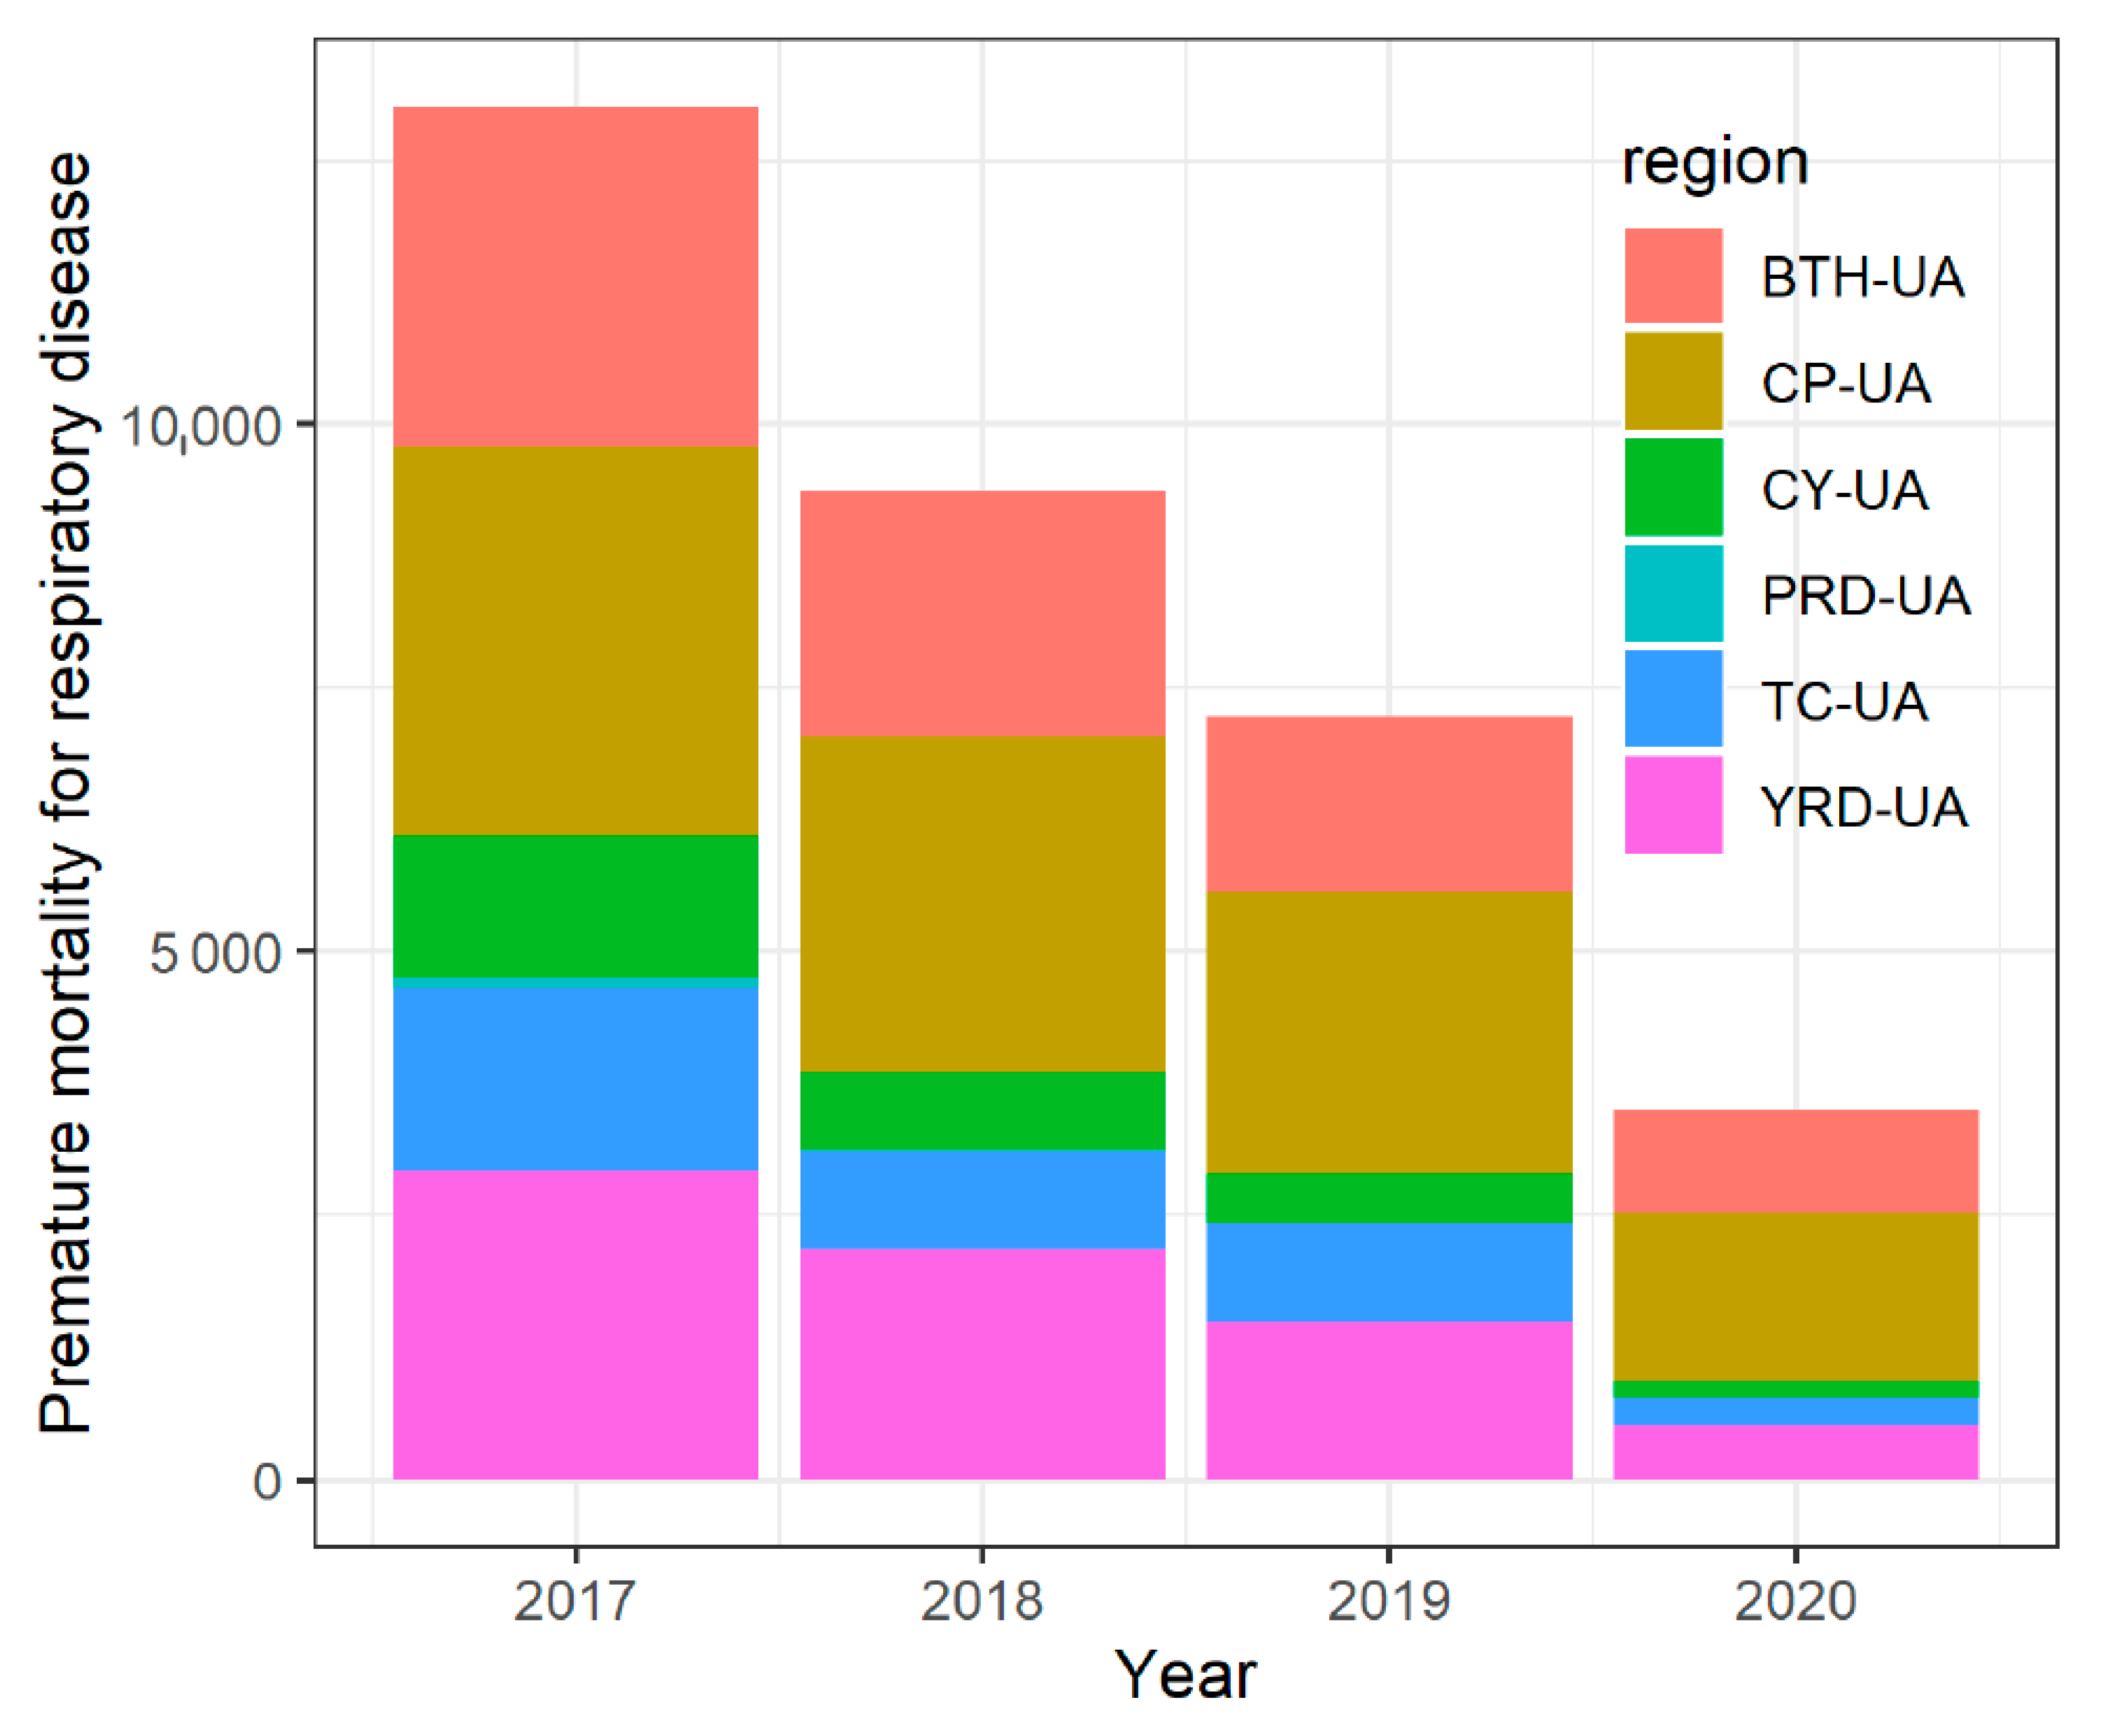
6. Health Impacts Attributable to PM2.5 Pollution
7. Conclusions
Supplementary Materials
Author Contributions
Funding
Institutional Review Board Statement
Informed Consent Statement
Data Availability Statement
Acknowledgments
Conflicts of Interest
References
- Huang, R.J.; Zhang, Y.L.; Bozzetti, C.; Ho, K.F.; Cao, J.J.; Han, Y.M.; Daellenbach, K.R.; Slowik, J.G.; Platt, S.M.; Canonaco, F.; et al. High secondary aerosol contribution to particulate pollution during haze events in China. Nature 2014, 514, 218–222. [Google Scholar] [CrossRef] [PubMed] [Green Version]
- Zheng, B.; Tong, D.; Li, M.; Liu, F.; Hong, C.P.; Geng, G.N.; Li, H.Y.; Li, X.; Peng, L.Q.; Qi, J.; et al. Trends in China’s anthropogenic emissions since 2010 as the consequence of clean air actions. Atmos. Chem. Phys. 2018, 18, 14095–14111. [Google Scholar] [CrossRef] [Green Version]
- Zhang, Q.; Zheng, Y.X.; Tong, D.; Shao, M.; Wang, S.X.; Zhang, Y.H.; Xu, X.D.; Wang, J.N.; He, H.; Liu, W.Q.; et al. Drivers of improved PM2.5 air quality in China from 2013 to 2017. Proc. Natl. Acad. Sci. USA 2019, 116, 24463–24469. [Google Scholar] [CrossRef] [PubMed] [Green Version]
- Li, Q.Y.; Li, X.C.; Li, H.T. Factors Influencing PM2.5 concentrations in the Beijing-Tianjin-Hebei urban agglomeration using a geographical and temporal weighted regression model. Atmosphere 2022, 13, 407. [Google Scholar] [CrossRef]
- Cao, J.Y.; Qiu, X.H.; Peng, L.; Gao, J.; Wang, F.Y.; Yan, X. Impacts of the differences in PM2.5 air quality improvement on regional transport and health risk in Beijing-Tianjin-Hebei region during 2013–2017. Chemosphere 2022, 297, 134179. [Google Scholar] [CrossRef]
- Ming, L.L.; Jin, L.; Li, J.; Fu, P.Q.; Yang, W.Y.; Liu, D.; Zhang, G.; Wang, Z.F.; Li, X.D. PM2.5 in the Yangtze River Delta, China: Chemical compositions, seasonal variations, and regional pollution events. Environ. Pollut. 2017, 223, 200–212. [Google Scholar] [CrossRef]
- Huang, J.J.; Zhang, Z.S.; Tao, J.; Zhang, L.M.; Nie, F.L.; Fei, L.L. Source apportionment of carbonaceous aerosols using hourly data and implications for reducing PM2.5 in the Pearl River Delta region of South China. Environ. Res. 2022, 210, 112960. [Google Scholar] [CrossRef]
- Hu, W.Y.; Zhao, T.L.; Bai, Y.Q.; Kong, S.F.; Shen, L.J.; Xiong, J.; Zhou, Y.; Gu, Y.; Shi, J.N.; Zheng, H.; et al. Regulation of synoptic circulation in regional PM2.5 transport for heavy air pollution: Study of 5-year observation over central China. J. Geophys. Res.-Atmos. 2022, 127, e2021JD035937. [Google Scholar] [CrossRef]
- Chen, L.Y.; Zhang, J.K.; Huang, X.J.; Li, H.; Dong, G.M.; Wei, S.Y. Characteristics and pollution formation mechanism of atmospheric fine particles in the megacity of Chengdu, China. Atmos. Res. 2022, 273, 106172. [Google Scholar] [CrossRef]
- Dong, Z.Y.; Li, L.; Lei, Y.L.; Wu, S.M.; Yan, D.; Chen, H. The economic loss of public health from PM2.5 pollution in the Fenwei Plain. Environ. Sci. Pollut. Res. 2021, 28, 2415–2425. [Google Scholar] [CrossRef]
- Guan, Y.; Xiao, Y.; Wang, F.Y.; Qiu, X.H.; Zhang, N.N. Health impacts attributable to ambient PM2.5 and ozone pollution in major Chinese cities at seasonal-level. J. Clean. Prod. 2021, 311, 127510. [Google Scholar] [CrossRef]
- Wu, X.R.; Xin, J.Y.; Zhang, X.L.; Klaus, S.; Wang, Y.S.; Wang, L.L.; Wen, T.X.; Liu, Z.R.; Si, R.R.; Liu, G.J.; et al. A new approach of the normalization relationship between PM2.5 and visibility and the theoretical threshold, a case in north China. Atmos. Res. 2020, 245, 105054. [Google Scholar] [CrossRef]
- Wolffe, M.C.; Wild, O.; Long, S.P.; Ashworth, K. Temporal variability in the impacts of particulate matter on crop yields on the North China Plain. Sci. Total Environ. 2021, 776, 145135. [Google Scholar] [CrossRef]
- Maji, K.J.; Dikshit, A.K.; Arora, M.; Deshpande, A. Estimating premature mortality attributable to PM2.5 exposure and benefit of air pollution control policies in China for 2020. Sci. Total Environ. 2018, 612, 683–693. [Google Scholar] [CrossRef]
- Li, Y.; Zhao, X.G.; Liao, Q.; Tao, Y.; Bai, Y. Specific differences and responses to reductions for premature mortality attributable to ambient PM2.5 in China. Sci. Total Environ. 2020, 742, 140643. [Google Scholar] [CrossRef]
- Zheng, S.; Wu, X.; Lichtfouse, E.; Wang, J. High-resolution mapping of premature mortality induced by atmospheric particulate matter in China. Environ. Chem. Lett. 2022, 20, 2735–2743. [Google Scholar] [CrossRef]
- Wang, Q.; Wang, J.N.; Zhou, J.H.; Ban, J.; Li, T.T. Estimation of PM2.5-associated disease burden in China in 2020 and 2030 using population and air quality scenarios: A modelling study. Lancet Planet. Health 2019, 3, E71–E80. [Google Scholar] [CrossRef] [Green Version]
- Sun, X.L.; Zhang, R.; Wang, G.Y. Spatial-Temporal Evolution of Health Impact and Economic Loss upon Exposure to PM2.5 in China. Int. J. Environ. Res. Public Health 2022, 19, 1922. [Google Scholar] [CrossRef]
- Zhou, L.; Chen, X.H.; Tian, X. The impact of fine particulate matter (PM2.5) on China’s agricultural production from 2001 to 2010. J. Clean. Prod. 2018, 178, 133–141. [Google Scholar] [CrossRef]
- Wang, S.W.; Su, H.; Chen, C.C.; Tao, W.; Streets, D.G.; Lu, Z.F.; Zheng, B.; Carmichael, G.R.; Lelieveld, J.; Poschl, U.; et al. Natural gas shortages during the “coal-to-gas” transition in China have caused a large redistribution of air pollution in winter 2017. Proc. Natl. Acad. Sci. USA 2020, 117, 31018–31025. [Google Scholar] [CrossRef]
- Zhang, Q.R.; Tong, P.F.; Liu, M.D.; Lin, H.M.; Yun, X.; Zhang, H.R.; Tao, W.; Liu, J.F.; Wang, S.X.; Tao, S.; et al. A WRF-Chem model-based future vehicle emission control policy simulation and assessment for the Beijing-Tianjin-Hebei region, China. J. Environ. Manag. 2020, 253, 109751. [Google Scholar] [CrossRef]
- Li, K.; Jacob, D.J.; Liao, H.; Zhu, J.; Shah, V.; Shen, L.; Bates, K.H.; Zhang, Q.; Zhai, S.X. A two-pollutant strategy for improving ozone and particulate air quality in China. Nat. Geosci. 2019, 12, 906. [Google Scholar] [CrossRef]
- Chu, B.W.; Ma, Q.X.; Liu, J.; Ma, J.Z.; Zhang, P.; Chen, T.Z.; Feng, Q.C.; Wang, C.Y.; Yang, N.; Ma, H.N.; et al. Air pollutant correlations in China: Secondary air pollutant responses to NOx and SO2 control. Environ. Sci. Technol. Lett. 2020, 7, 695–700. [Google Scholar] [CrossRef]
- Qi, G.Z.; Wang, Z.B.; Wei, L.J.; Wang, Z.X. Multidimensional effects of urbanization on PM2.5 concentration in China. Environ. Sci. Pollut. Res. 2022, 1, 1–16. [Google Scholar] [CrossRef]
- Zhao, X.L.; Zhou, W.Q.; Han, L.J.; Locke, D. Spatiotemporal variation in PM2.5 concentrations and their relationship with socioeconomic factors in China’s major cities. Environ. Int. 2019, 133, 105145. [Google Scholar] [CrossRef]
- Shen, Y.; Zhang, L.P.; Fang, X.; Ji, H.Y.; Li, X.; Zhao, Z.W. Spatiotemporal patterns of recent PM2.5 concentrations over typical urban agglomerations in China. Sci. Total Environ. 2019, 655, 13–26. [Google Scholar] [CrossRef]
- Chen, Z.; Chen, D.; Zhao, C.; Kwan, M.P.; Cai, J.; Zhuang, Y.; Zhao, B.; Wang, X.; Chen, B.; Yang, J.; et al. Influence of meteorological conditions on PM2.5 concentrations across China: A review of methodology and mechanism. Environ. Int. 2020, 139, 105558. [Google Scholar] [CrossRef]
- Chen, Z.Y.; Xie, X.M.; Cai, J.; Chen, D.L.; Gao, B.B.; He, B.; Cheng, N.L.; Xu, B. Understanding meteorological influences on PM2.5 concentrations across China: A temporal and spatial perspective. Atmos. Chem. Phys. 2018, 18, 5343–5358. [Google Scholar] [CrossRef] [Green Version]
- Liao, T.T.; Wang, S.; Ai, J.; Gui, K.; Duan, B.L.; Zhao, Q.; Zhang, X.; Jiang, W.T.; Sun, Y. Heavy pollution episodes, transport pathways and potential sources of PM2.5 during the winter of 2013 in Chengdu (China). Sci. Total Environ. 2017, 584, 1056–1065. [Google Scholar] [CrossRef]
- Liu, X.Y.; Wang, M.S.; Pan, X.L.; Wang, X.Y.; Yue, X.L.; Zhang, D.H.; Ma, Z.G.; Tian, Y.; Liu, H.; Lei, S.D.; et al. Chemical formation and source apportionment of PM2.5 at an urban site at the southern foot of the Taihang mountains. J. Environ. Sci. 2021, 103, 20–32. [Google Scholar] [CrossRef]
- Tian, Y.L.; Zhang, L.N.; Wang, Y.; Song, J.X.; Sun, H.T. Temporal and spatial trends in particulate matter and the responses to meteorological conditions and environmental management in Xi’an, China. Atmosphere 2021, 12, 1112. [Google Scholar] [CrossRef]
- Yang, W.L.; Wang, G.C.; Bi, C.J. Analysis of Long-range transport effects on PM2.5 during a short severe haze in Beijing, China. Aerosol Air Qual. Res. 2017, 17, 1610–1622. [Google Scholar] [CrossRef]
- Xu, W.T.; Wang, Y.X.; Sun, S.; Yao, L.; Li, T.; Fu, X.C. Spatiotemporal heterogeneity of PM2.5 and its driving difference comparison associated with urbanization in China’s multiple urban agglomerations. Environ. Sci. Pollut. Res. 2022, 29, 29689–29703. [Google Scholar] [CrossRef] [PubMed]
- Yang, Q.Q.; Yuan, Q.Q.; Li, T.W.; Shen, H.F.; Zhang, L.P. The relationships between PM2.5 and meteorological factors in China: Seasonal and regional variations. Int. J. Environ. Res. Public Health 2017, 14, 1510. [Google Scholar] [CrossRef] [PubMed] [Green Version]
- Deng, C.X.; Qin, C.Y.; Li, Z.W.; Li, K. Spatiotemporal variations of PM2.5 pollution and its dynamic relationships with meteorological conditions in Beijing-Tianjin-Hebei region. Chemosphere 2022, 301, 134640. [Google Scholar] [CrossRef]
- Chen, D.; Liu, Z.Q.; Ban, J.M.; Zhao, P.S.; Chen, M. Retrospective analysis of 2015-2017 wintertime PM2.5 in China: Response to emission regulations and the role of meteorology. Atmos. Chem. Phys. 2019, 19, 7409–7427. [Google Scholar] [CrossRef] [Green Version]
- Liu, X.; Zhao, C.; Shen, X.; Jin, T. Spatiotemporal variations and sources of PM2.5 in the Central Plains Urban Agglomeration, China. Air Qual. Atmos. Health 2022, 15, 1507–1521. [Google Scholar] [CrossRef]
- Fu, X.S.; Li, L.; Lei, Y.L.; Wu, S.M.; Yan, D.; Luo, X.M.; Luo, H. The economic loss of health effect damages from PM2.5 pollution in the Central Plains Urban Agglomeration. Environ. Sci. Pollut. Res. 2020, 27, 25434–25449. [Google Scholar] [CrossRef]
- Sun, X.W.; Cheng, S.Y.; Lang, J.L.; Ren, Z.H.; Sun, C. Development of emissions inventory and identification of sources for priority control in the middle reaches of Yangtze River urban agglomerations. Sci. Total Environ. 2018, 625, 155–167. [Google Scholar] [CrossRef]
- Liao, Z.H.; Xie, J.L.; Fang, X.Q.; Wang, Y.; Zhang, Y.; Xu, X.Q.; Fan, S.J. Modulation of synoptic circulation to dry season PM2.5 pollution over the Pearl River Delta region: An investigation based on self-organizing maps. Atmos. Environ. 2020, 230, 117482. [Google Scholar] [CrossRef]
- Shi, X.Q.; Zhao, C.F.; Jiang, J.H.; Wang, C.Y.; Yang, X.; Yung, Y.L. Spatial representativeness of PM2.5 concentrations obtained using observations from network stations. J. Geophys. Res.-Atmos. 2018, 123, 3145–3158. [Google Scholar] [CrossRef] [Green Version]
- Jiang, L.; He, S.X.; Zhou, H.F. Spatio-temporal characteristics and convergence trends of PM2.5 pollution: A case study of cities of air pollution transmission channel in Beijing-Tianjin-Hebei region, China. J. Clean. Prod. 2020, 256, 120631. [Google Scholar] [CrossRef]
- Peng, J.; Chen, S.; Lü, H.; Liu, Y.; Wu, J. Spatiotemporal patterns of remotely sensed PM2.5 concentration in China from 1999 to 2011. Remote Sens. Environ. 2016, 174, 109–121. [Google Scholar] [CrossRef]
- Cao, Z.; Wu, Z.F.; Li, S.Y.; Ma, W.J.; Deng, Y.J.; Sun, H.; Guan, W.C. Exploring spatiotemporal variation characteristics of exceedance air pollution risk using social media big data. Environ. Res. Lett. 2020, 15, 114049. [Google Scholar] [CrossRef]
- Ding, Y.T.; Zhang, M.; Qian, X.Y.; Li, C.R.; Chen, S.; Wang, W.W. Using the geographical detector technique to explore the impact of socioeconomic factors on PM2.5 concentrations in China. J. Clean. Prod. 2019, 211, 1480–1490. [Google Scholar] [CrossRef]
- Xue, T.; Liu, J.; Zhang, Q.; Geng, G.N.; Zheng, Y.X.; Tong, D.; Liu, Z.; Guan, D.B.; Bo, Y.; Zhu, T.; et al. Rapid improvement of PM2.5 pollution and associated health benefits in China during 2013–2017. Sci. China-Earth Sci. 2019, 62, 1847–1856. [Google Scholar] [CrossRef]
- Xu, X.M.; Zhang, W.; Zhu, C.; Li, J.R.; Wang, J.; Li, P.C.; Zhao, P.Y. Health risk and external costs assessment of PM2.5 in Beijing during the “Five-year Clean Air Action Plan”. Atmos. Pollut. Res. 2021, 12, 101089. [Google Scholar] [CrossRef]
- Chen, Z.Y.; Chen, D.L.; Wen, W.; Zhuang, Y.; Kwan, M.P.; Chen, B.; Zhao, B.; Yang, L.; Gao, B.B.; Li, R.Y.; et al. Evaluating the “2+26” regional strategy for air quality improvement during two air pollution alerts in Beijing: Variations in PM2.5 concentrations, source apportionment, and the relative contribution of local emission and regional transport. Atmos. Chem. Phys. 2019, 19, 6879–6891. [Google Scholar] [CrossRef] [Green Version]
- Qu, L.L.; Liu, S.J.; Ma, L.L.; Zhang, Z.Z.; Du, J.H.; Zhou, Y.H.; Meng, F. Evaluating the meteorological normalized PM2.5 trend (2014–2019) in the “2+26” region of China using an ensemble learning technique. Environ. Pollut. 2020, 266, 115346. [Google Scholar] [CrossRef]
- Chu, B.W.; Zhang, S.P.; Liu, J.; Ma, Q.X.; He, H. Significant concurrent decrease in PM2.5 and NO2 concentrations in China during COVID-19 epidemic. J. Environ. Sci. 2021, 99, 346–353. [Google Scholar] [CrossRef]
- Sen, A.; Abdelmaksoud, A.S.; Ahammed, Y.N.; Alghamdi, M.A.; Banerjee, T.; Bhat, M.A.; Chatterjee, A.; Choudhuri, A.K.; Das, T.; Dhir, A.; et al. Variations in particulate matter over Indo-Gangetic Plains and Indo-Himalayan Range during four field campaigns in winter monsoon and summer monsoon: Role of pollution pathways. Atmos. Environ. 2017, 154, 200–224. [Google Scholar] [CrossRef]
- Liu, L.; Duan, Y.; Li, L.; Xu, L.; Yang, Y.; Cu, X. Spatiotemporal trends of PM2.5 concentrations and typical regional pollutant transport during 2015–2018 in China. Urban Clim. 2020, 34, 100710. [Google Scholar] [CrossRef]
- Zhao, D.T.; Chen, H.; Sun, X.K.; Shi, Z.Z. Spatio-temporal variation of PM2.5 pollution and its relationship with meteorology among five megacities in China. Aerosol Air Qual. Res. 2018, 18, 2318–2331. [Google Scholar] [CrossRef]
- Li, Q.H.; Wu, B.G.; Liu, J.L.; Zhang, H.S.; Cai, X.H.; Song, Y. Characteristics of the atmospheric boundary layer and its relation with PM2.5 during haze episodes in winter in the North China Plain. Atmos. Environ. 2020, 223, 117265. [Google Scholar] [CrossRef]
- Wang, L.L.; Xiong, Q.L.; Wu, G.F.; Gautam, A.; Jiang, J.F.; Liu, S.; Zhao, W.J.; Guan, H.L. Spatio-temporal variation characteristics of PM2.5 in the Beijing-Tianjin-Hebei Region, China, from 2013 to 2018. Int. J. Environ. Res. Public Health 2019, 16, 4276. [Google Scholar] [CrossRef] [Green Version]
- Wen, W.; Shen, S.; Liu, L.; Ma, X.; Wei, Y.; Wang, J.K.; Xing, Y.; Su, W. Comparative analysis of PM2.5 and O3 source in Beijing using a chemical transport model. Remote Sens. 2021, 13, 3457. [Google Scholar] [CrossRef]
- Xu, Y.L.; Xue, W.B.; Lei, Y.; Huang, Q.; Zhao, Y.; Cheng, S.Y.; Ren, Z.H.; Wang, J.N. Spatiotemporal variation in the impact of meteorological conditions on PM2.5 pollution in China from 2000 to 2017. Atmos. Environ. 2020, 223, 117215. [Google Scholar] [CrossRef]
- Yang, Y.; Liao, H.; Lou, S. Increase in winter haze over eastern China in recent decades: Roles of variations in meteorological parameters and anthropogenic emissions. J. Geophys. Res.-Atmos. 2016, 121, 13050–13065. [Google Scholar] [CrossRef] [Green Version]
- Wei, L.F.; Duan, J.C.; Tan, J.H.; Ma, Y.L.; He, K.B.; Wang, S.X.; Huang, X.F.; Zhang, Y.X. Gas-to-particle conversion of atmospheric ammonia and sampling artifacts of ammonium in spring of Beijing. Sci. China-Earth Sci. 2015, 58, 345–355. [Google Scholar] [CrossRef]
- Qi, L.; Zheng, H.T.; Ding, D.; Ye, D.C.; Wang, S.X. Effects of meteorology changes on inter-annual variations of aerosol optical depth and surface PM2.5 in China-implications for PM2.5 remote sensing. Remote Sens. 2022, 14, 2762. [Google Scholar] [CrossRef]
- Hsu, C.H.; Cheng, F.Y. Classification of weather patterns to study the influence of meteorological characteristics on PM2.5 concentrations in Yunlin County, Taiwan. Atmos. Environ. 2016, 144, 397–408. [Google Scholar] [CrossRef]
- Guo, J.P.; Miao, Y.C.; Zhang, Y.; Liu, H.; Li, Z.Q.; Zhang, W.C.; He, J.; Lou, M.Y.; Yan, Y.; Bian, L.G.; et al. The climatology of planetary boundary layer height in China derived from radiosonde and reanalysis data. Atmos. Chem. Phys. 2016, 16, 13309–13319. [Google Scholar] [CrossRef] [Green Version]
- Sun, Y.; Zhao, C.F.; Su, Y.F.; Ma, Z.S.; Li, J.M.; Letu, H.; Yang, Y.K.; Fan, H. Distinct impacts of light and heavy precipitation on PM2.5 mass concentration in Beijing. Earth Space Sci. 2019, 6, 1915–1925. [Google Scholar] [CrossRef] [Green Version]
- Zhang, W.J.; Wang, H.; Zhang, X.Y.; Peng, Y.; Zhong, J.T.; Zhao, Y.F. Evaluating the contributions of changed meteorological conditions and emission to substantial reductions of PM2.5 concentration from winter 2016 to 2017 in Central and Eastern China. Sci. Total Environ. 2020, 716, 136892. [Google Scholar] [CrossRef] [PubMed]
- Chen, Z.Y.; Chen, D.L.; Kwan, M.P.; Chen, B.; Gao, B.B.; Zhuang, Y.; Li, R.Y.; Xu, B. The control of anthropogenic emissions contributed to 80% of the decrease in PM2.5 concentrations in Beijing from 2013 to 2017. Atmos. Chem. Phys. 2019, 19, 13519–13533. [Google Scholar] [CrossRef] [Green Version]
- Li, X.; Zhao, H.Y.; Xue, T.; Geng, G.N.; Zheng, Y.X.; Li, M.; Zheng, B.; Li, H.Y.; Zhang, Q. Consumption-based PM2.5-related premature mortality in the Beijing-Tianjin-Hebei region. Sci. Total Environ. 2021, 800, 149575. [Google Scholar] [CrossRef]


| Region | Year | Season | ||||||
|---|---|---|---|---|---|---|---|---|
| 2017 | 2018 | 2019 | 2020 | Spring | Summer | Autumn | Winter | |
| BTH-UA | 1.95 | 1.88 | 1.99 | 1.80 | 0.68 | 0.80 | 1.74 | 2.45 |
| CP-UA | 0.88 | −0.47 | 0.13 | 0.67 | 0.44 | 1.91 | 0.63 | −0.22 |
| YRD-UA | −0.44 | −0.06 | −0.23 | 0.03 | −0.44 | 2.58 | 1.79 | 2.78 |
| TC-UA | 1.26 | 1.69 | 2.26 | 2.02 | 1.26 | 1.78 | 0.08 | 0.72 |
| CY-UA | 0.11 | 0.20 | −0.06 | 0.17 | 0.17 | −0.19 | 0.15 | 0.21 |
| PRD-UA | 0.92 | 0.40 | 0.14 | 0.24 | 0.60 | 0.83 | 0.03 | 0.43 |
Publisher’s Note: MDPI stays neutral with regard to jurisdictional claims in published maps and institutional affiliations. |
© 2022 by the authors. Licensee MDPI, Basel, Switzerland. This article is an open access article distributed under the terms and conditions of the Creative Commons Attribution (CC BY) license (https://creativecommons.org/licenses/by/4.0/).
Share and Cite
Li, Z.; Zhang, X.; Liu, X.; Yu, B. PM2.5 Pollution in Six Major Chinese Urban Agglomerations: Spatiotemporal Variations, Health Impacts, and the Relationships with Meteorological Conditions. Atmosphere 2022, 13, 1696. https://0-doi-org.brum.beds.ac.uk/10.3390/atmos13101696
Li Z, Zhang X, Liu X, Yu B. PM2.5 Pollution in Six Major Chinese Urban Agglomerations: Spatiotemporal Variations, Health Impacts, and the Relationships with Meteorological Conditions. Atmosphere. 2022; 13(10):1696. https://0-doi-org.brum.beds.ac.uk/10.3390/atmos13101696
Chicago/Turabian StyleLi, Zhuofan, Xiangmin Zhang, Xiaoyong Liu, and Bin Yu. 2022. "PM2.5 Pollution in Six Major Chinese Urban Agglomerations: Spatiotemporal Variations, Health Impacts, and the Relationships with Meteorological Conditions" Atmosphere 13, no. 10: 1696. https://0-doi-org.brum.beds.ac.uk/10.3390/atmos13101696