


Analysis of the Cooling and Humidification Effect of Multi-Layered Vegetation Communities in Urban Parks and Its Impact
1
College of Forestry, Central South University of Forestry and Technology, Changsha 410000, China
2
College of Tourism, Central South University of Forestry and Technology, Changsha 410000, China
*
Author to whom correspondence should be addressed.
Atmosphere 2022, 13(12), 2045; https://0-doi-org.brum.beds.ac.uk/10.3390/atmos13122045
Submission received: 10 November 2022
/
Revised: 1 December 2022
/
Accepted: 3 December 2022
/
Published: 7 December 2022
(This article belongs to the Topic Energy Efficiency, Environment and Health)
Abstract
:As urbanization continues to accelerate, the urban heat island effects have become one of the most important issues affecting the urban environment and people’s living experience. Numerous studies have shown that urban parks and green spaces can effectively alleviate the problem of the urban heat island effect and provide cooling and humidifying effects. Vegetation communities are a fundamental part of urban parklands, and multi-layered vegetation communities are considered to have better cooling and humidifying effects. Previous studies have focused on comparative analyses between different cover types of vegetation communities but have not explored the differences in the cooling and humidifying effects of multi-layered vegetation communities of the same cover type. Therefore, the Olympic Forest Park in Beijing was selected as the subject of this study, and multi-layered vegetation-covered (tree-shrub-grass) with different degrees of densities and uncovered squares were selected for the control and comparison. The cooling and humidifying effects of multi-layered vegetation communities with different canopy densities at different times of the day through field measurements were studied, and the influencing factors for this were analyzed. The results show that the tree cover is the core factor affecting temperature; the degree of the canopy density of multi-layered vegetation communities is significantly and positively correlated with the intensity of cooling and humidification, and the cooling and humidifying effect of multi-layered vegetation communities increases as the degree of canopy density increases. The results of this study can provide some references for the planning and design of urban parks and green spaces.
1. Introduction
Urbanization, which is growing rapidly, is important for improving human development. However, urbanization can also lead to serious environmental problems, such as the urban heat island (UHI) effect [1]. A gradual increase in the UHI effect has been observed in both large and medium-sized cities [2]. The UHI effect can lead to many problems, including thermal discomfort and even health risks for urban dwellers [3]. The ambient air temperature has a significant impact on human physiological activity, with high air temperatures causing increased discomfort and illness, as well as reducing human productivity [4], increasing energy consumption and air pollution [5], and altering species composition and distribution [6]. The UHI effect has become one of the most important factors affecting the livability of urban environments and has a potential impact on the quality of life of urban residents.
A growing body of research has demonstrated that urban green spaces provide multiple benefits for improving urban sustainability and livability [7,8,9,10]. Green spaces include parks and reserves, sports fields, riparian areas (such as streams and riverbanks), greenways and trails, community gardens, street trees, and nature reserves, as well as less traditional spaces such as green walls and green alleys [11]. Urban parks are the largest patches of urban green space, with important ecological functions and significant impacts on the local and micro-scale climate [12,13,14]. Previous empirical studies have shown that parks are not only cold and wet areas in cities but can also have a cooling and humidifying effect on their immediate vicinity [15,16,17,18]. This gives rise to an “oasis effect” known as the “Park Cool Island” (PCI) [19,20]. Large urban parks, through the cooling and humidifying effects exerted by plants, enhance thermal comfort and reduce the UHI effect [21,22].
Plants in urban parks are usually planted in groups [23]. In China, the plant patterns follow the concept of “learning from nature”, with a large number of decorative plant species planted nearby, creating a complex flora in most urban parks [24]. The vegetation community absorbs and reflects large amounts of solar radiation through its branches and leaves, and the dense canopy acts as a shade. At the same time, plant evapotranspiration carries water into the air, converting and consuming ambient heat, thus, regulating the air temperature and relative humidity under the tree canopy and in its surroundings [25,26,27]. Available studies show that the cooling effect of evergreen plants is highest for conifers, followed by deciduous broadleaf bushes; broadleaf evergreens come third, and finally, palm clusters have the lowest cooling effect [12,28,29]. Vegetation communities consisting of trees, shrubs, and grasses produce more significant cooling and humidifying effects than lawns [30,31,32,33]. The vertical structure of the community refers to the variation in the vertical direction of the community in space, which is manifested in the stratification of plants in the community and is one of the most important manifestations of the morphological characteristics of the community. The plant communities are classified according to their structure as Tree-Shrub-Grass (TSG), Tree-Shrub (TS), Tree-Grass (TG), Shrub-Grass (SG), and Ground Cover/Grass (G) communities. The vertical structure of the communities can be divided into three patterns, TSG is a multi-layer plant community (MPC), TS, TG, and SG are double-layer plant communities (DPC), and G is a single-plant community (SPC) [34]. Most scholars believe that different community types have different cooling and humidifying effects, and those multi-layered vegetation communities consisting of Tree-Shrub-Grass have higher green biomass and, therefore, better cooling effects [35,36,37]. Previous studies have shown that trees can influence air temperature and relative humidity through shading, transpiration, and evaporative cooling, so parkland strips of trees, shrubs, and grasses can have a more pronounced impact than lawns [30,38]. Multi-layered communities dominated by trees are significantly better at regulating temperature and humidity than other types of communities [39,40].
Previous studies have shown that tree cover is a key factor influencing air temperature [41]. Compared to exposed areas, a natural shade can produce cooler and more comfortable human sensations [42,43]. In the southern subtropics, canopy density, solar radiation, wind speed, and canopy area all have significant effects on cooling, with canopy area and canopy density having significant effects on humidification and thermal comfort [12]. Researchers in Changchun, China, confirmed that the canopy density, leaf area index, and tree-height were the most significant drivers of the cooling effect [32]. From 9:00 a.m. to 12:00 p.m., the canopy density and leaf area index better reflects the cooling and humidifying effect [44], and canopy density is an important indicator for studying the cooling and humidifying effect of urban parks. In a comparative analysis of hot and cold spots for air temperature in 10 city parks in Singapore, shade was found to be an important factor in lowering temperatures [45]. In a study using Landsat data on tree species richness and diversity to predict the urban heat island effect mitigation in green spaces, it was shown that the average canopy width and tree density in green spaces could explain some of the variations in the cooling extent, and that, in terms of plant community structure, the trees with the widest canopies could produce more shade and potentially more evapotranspiration in summer and autumn. The study used dummy variable regression to measure the community structure of different types of vegetation forming tree-shrubs-herbs and tree-herbs in urban agglomerative green infrastructure and found that canopy density was significantly and positively correlated with cooling and humidifying effects [21]. The specific contribution of the vegetation community structure to the cooling effect needs to be further explored, and the existing research focuses mainly on the comparative analysis of the cooling and humidifying effects between the different vegetation types or between three different patterns of communities in the vertical structure of the community, without exploring the differences in the cooling and humidifying effects of multi-layered vegetation communities of the same vegetation type. Therefore, in this study, the cooling and humidifying effects of multi-layered vegetation communities with different degrees of canopy density in urban parks were investigated and analyzed to understand the cooling effect of green spaces covered by multi-layered vegetation communities in urban parks at the micro-scale and to understand their changing trends and cooling intensities. There are two main scales of research on the cooling effect of the parkland: local or mesoscale studies based on satellite imagery and meteorological data. These studies apply the metrics of parkland cooling intensity to quantify the cooling effect of the parkland. Another type of small-scale study is the application of simulation models constructed through field observations and simulation tools such as ENVI-met or the Ladybug tool (LBT) [8]. Compared to spatial datasets derived from satellite imagery, field observations provide a more direct and accurate characterization of the dynamic relationship between parkland and atmospheric temperatures.
Therefore, in order to compare with previous studies and obtain more direct and accurate data results, this study proposes to achieve the following research objectives through field measurements:
(1) Study the effect of vegetation cover on the cooling and humidifying effect of the microclimate in urban parks during hot and dry summers.
(2) Analysis of the cooling and humidifying effects of multi-layered vegetation communities in urban parks with different degrees of canopy density and their effects.
It is hoped that the research will improve our understanding of the cooling effect of vegetation communities in urban green spaces and that the study of the vegetation structure on a small scale will help landscape gardeners and urban planners to make effective and efficient design and planning decisions, thus maximizing the cooling effect of green spaces in urban parks, improving microclimate conditions and human outdoor comfort, and giving full play to the role of urban parks as “urban cooling islands”.
2. Materials and Methods
2.1. Study Area
The study was conducted in the Chinese capital, Beijing (39°56′ N, 116°20′ E), which is located in the northwestern part of the North China Plain and has a warm temperate continental semi-humid monsoon climate with four distinct seasons, moderate precipitation, an average annual temperature of 11.5 °C, and 2841.4 h of sunshine throughout the year, with the hottest month of the year occurring in July.
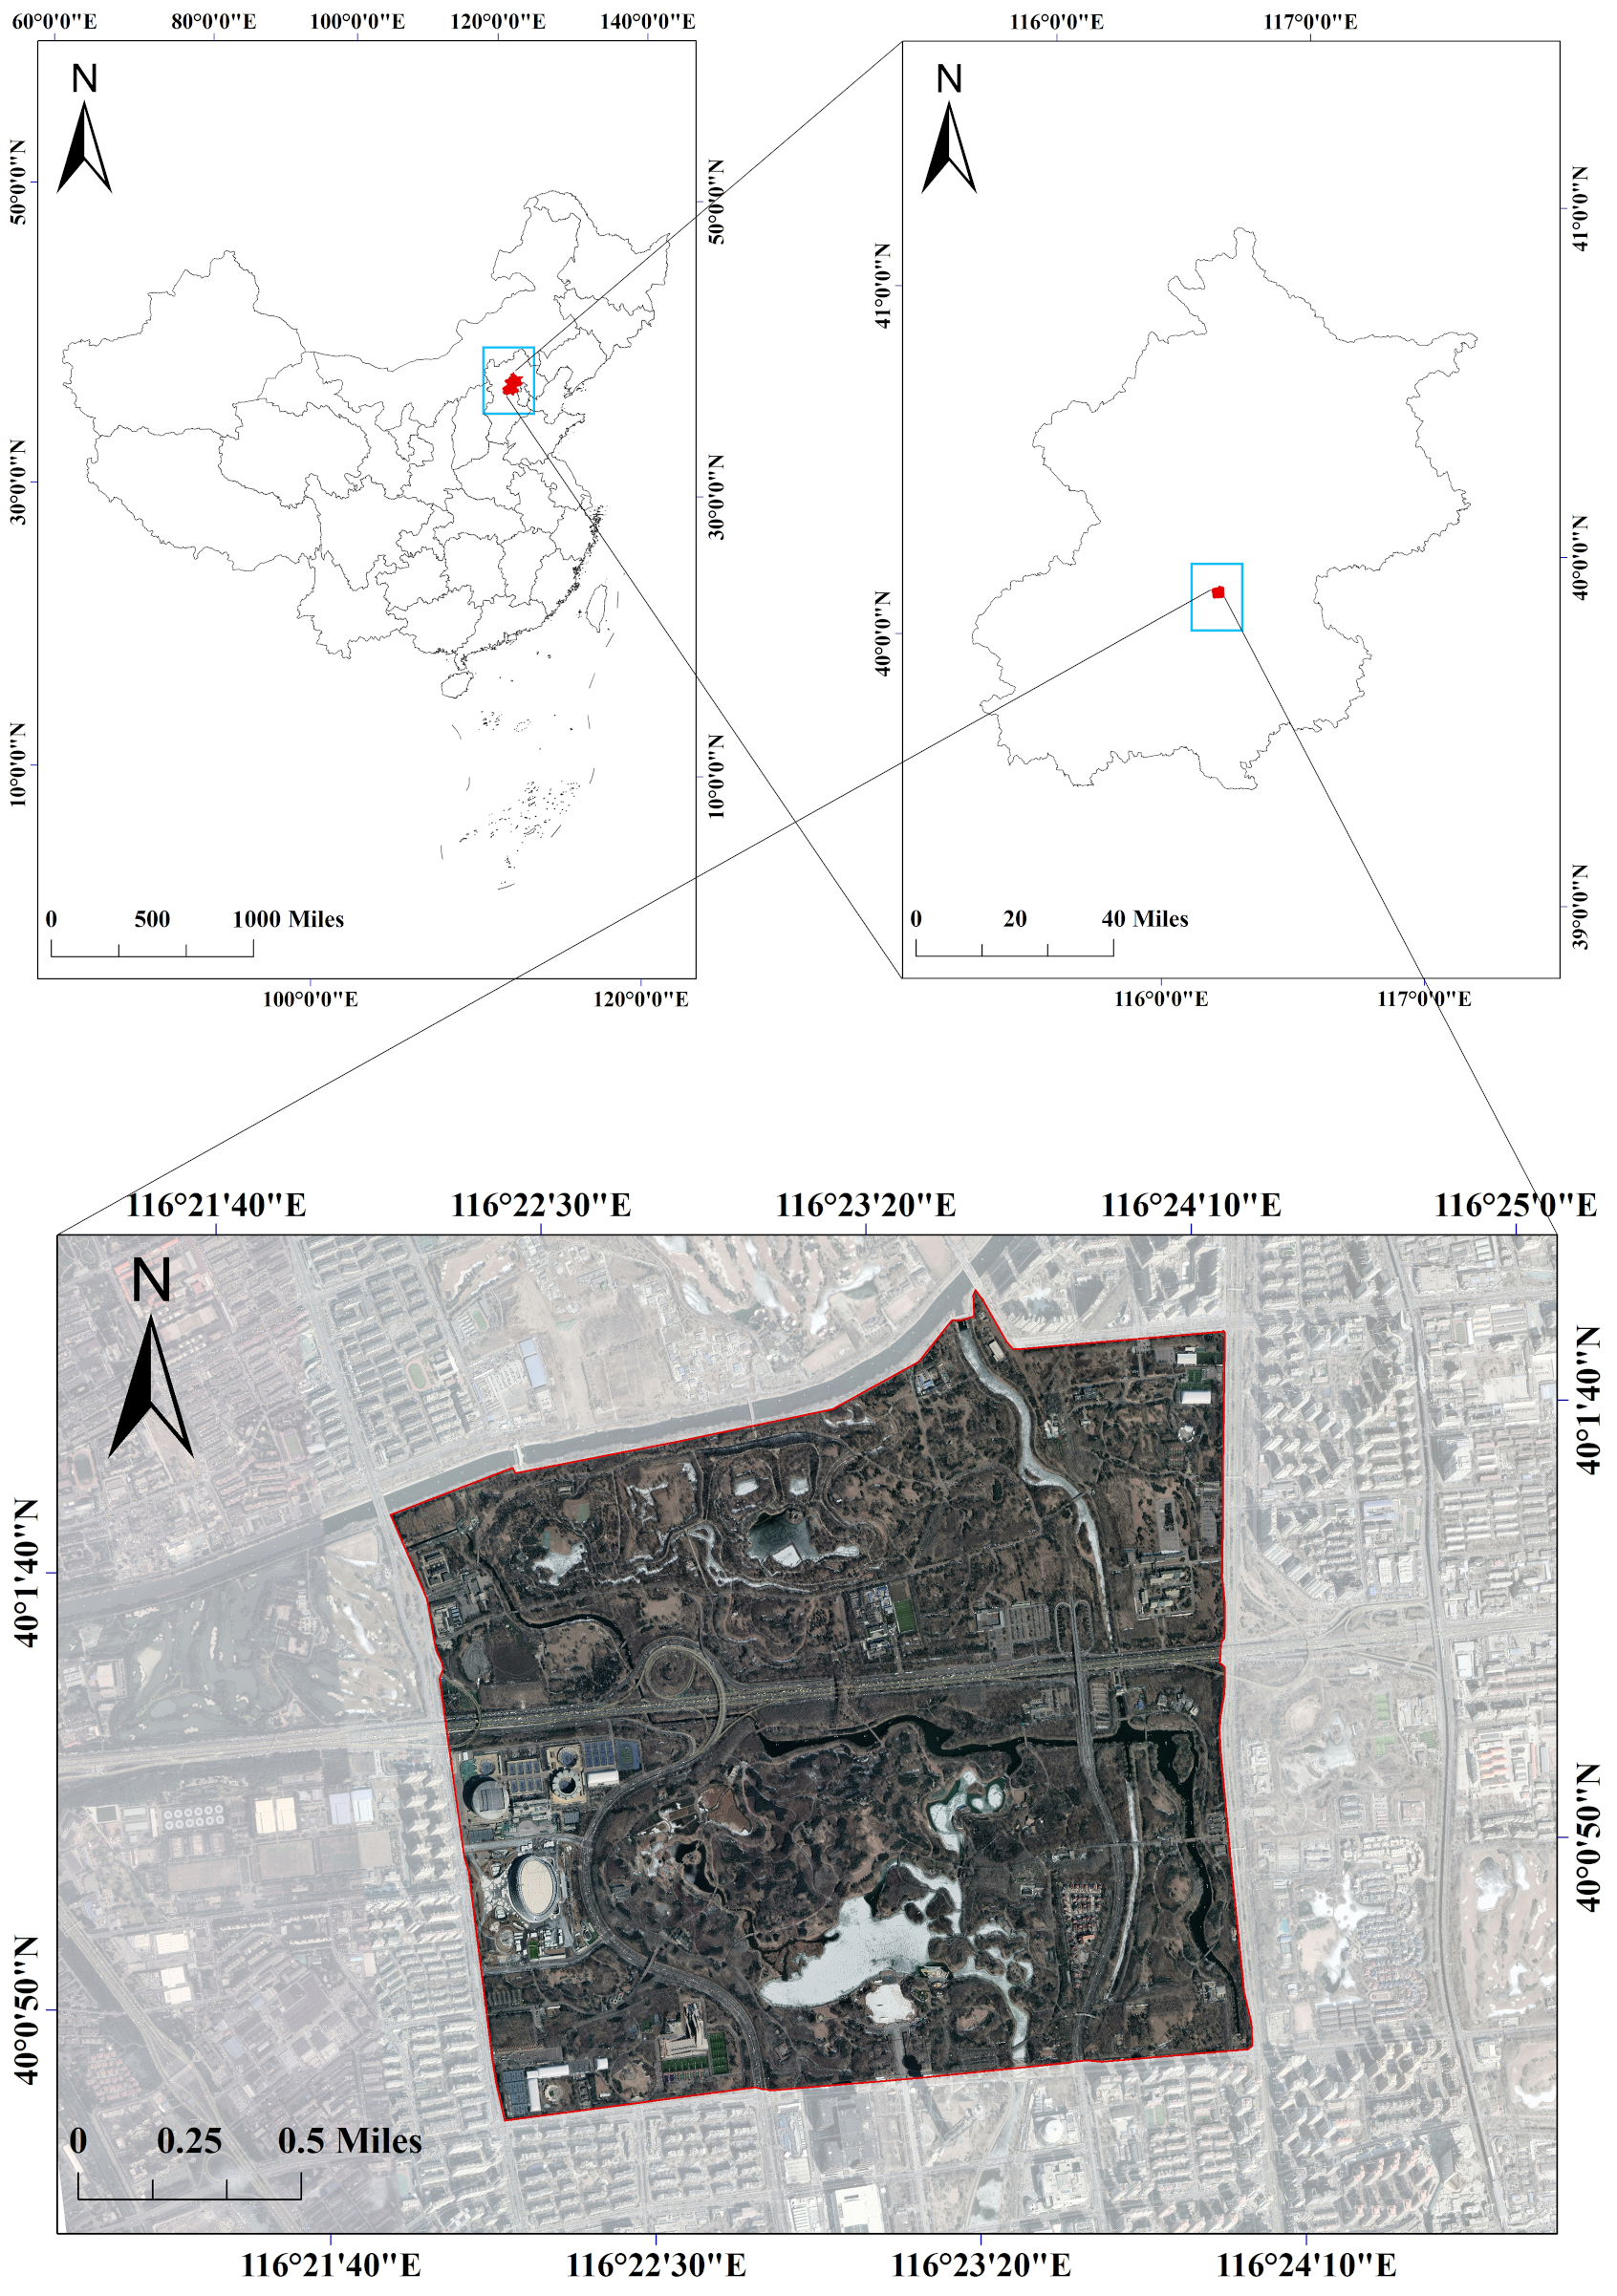
The Olympic Forest Park (40°01′3.00″ N, 116°23′2.98″ E) is located on the northern side of Beijing’s central axis, with a total area of 1135 hm2 (Figure 1). It is currently the largest national sports and leisure park in the northern region of Beijing, with the largest area covered by forest vegetation. The park is rich in forest resources, and the vegetation coverage is mainly trees and shrubs, with a greening rate of 95.61%, making it a national 5 A tourist attraction. In this study, the plot was selected in the central part of the city park because of the richness and diversity of the greenery and vegetation in this part of the park, which makes it easy to study.
2.2. Date Measurement
In this study, four equal-sized plots (50 m × 50 m), numbered 1, 2, 3, and 4 were selected for field measurements in the central part of the Olympic Park; the plots were composed of a multi-layered vegetation group of trees + shrubs + grasses, with densities of 8% (1), 16% (2), 31.2% (3), and 69.9% (3), respectively. The cooling effect of the park green space was studied according to the air temperature variation between different plots and the relative humidity variation. Canopy density refers to the ratio of the total area projected on the ground when the sun shines directly on the canopy of a tree to the area of the forest floor and is expressed as a percentage. In addition, for the control experiment, an open field of equal size, numbered 0, was selected as a control site for this study. All plots and control site is located at a large distance from the surrounding buildings and are free from motor vehicle access, thus ensuring that the data from this measurement are true, reliable, and comparable. Detailed information is shown in Table 1.
2.2.1. Measurement of Air Temperature and Humidity by Using Kestrel 5000
Given the need for simultaneous observations at different plots, the Kestrel 5000 handheld meteorological instrument was chosen for the study to monitor the plot and record at regular intervals at fixed points. The Kestrel 5000 offers high accuracy, high performance, and portability, with the main parameters being air temperature and relative humidity at the plots and control site. All data measurements were taken from July to September 2020 in clear weather. Diagonal measurements were taken at 10 m intervals in different plots, with a fixed points monitoring method, and the height was set at 1.5 m of human breathing height. The air temperature and relative humidity were recorded accurately with an instrument from 8:00 am to 18:00 pm, and a set of data was measured every 2 h, 6 standard time slots in total, to ensure the reliability of the data. Each plot and the control site were measured three times or more to obtain the average value.
2.2.2. Measurement of Canopy Density Parameters
In this study, each of the plots that we selected had a similar proportion of shrubs and grasses, with differences in the canopy of trees. The canopy density of the plots was estimated visually by looking up at the canopy at diagonally spaced observation points and recording the number of plots that could be shaded by the projection of direct sunlight on the canopy, and dividing by the total number of points to calculate the size of the canopy density [46,47].
The data for the cooling effect of the different plots were processed by taking the arithmetic mean of the air temperature and relative humidity data obtained during the same period as the final air temperature and relative humidity of the observed plots. These data were compared with the control 0, and the cooling and humidification intensity of the plots compared with the control 0 was calculated as a measure of the cooling and humidification effect of the plots. The results were plotted as air temperature, a relative humidity trend, a cooling intensity trend, and a relative humidity intensity trend to give a more visual representation of the cooling and humidification effects on different plots [48,49].
The intensity of cooling at the plot: air temperature measured at control 0 minus the air temperature at the plot.
Intensity of humidification in the plot: the relative humidity of the air in the plot minus the relative humidity of the air at control 0.
The values of ΔT and ΔRH represent the difference in temperature and humidity between a plot and the control site, respectively, i.e., the intensity of cooling and humidification that can be derived from the calculation; T and RH indicate the air temperature and relative humidity measured by a plot at a given time, respectively; T0 and RT0 represent the temperature and humidity values at control 0, respectively. If ΔT > 0, it means that the temperature of the plot is lower than that of the control site, which means that the park green area has a certain cooling effect and ΔT as a larger value means that the cooling effect of the plot is more obvious, while the opposite means that the cooling effect is weaker. If ΔRH > 0, it means that the relative humidity of the air in the plot is higher than the relative humidity of the control site, indicating that the park green space has a certain humidifying effect; the larger the value of ΔRH, the more obvious the humidifying effect, and vice versa, the weaker the effect.
3. Results
3.1. Air Temperature Variation at the Plots and Control Site
As can be seen from Figure 2, the pattern of the temperature change in the plots with different degrees of canopy density during the observation period is basically the same as that of the control site, showing an inverted “U” shaped trend of increasing and then decreasing. At 14:00, the maximum temperature was reached at all sample and control site, with the unvegetated control 0 temperature reaching 34.2 °C; The highest temperature in the plots with the multi-layered vegetation cover was the lowest canopy density plot 1. The value of 33.76 °C as the lowest temperature occurred at 8:00. The control 0 was 28.05 °C, and plot 4 was 28.02 °C, with small differences in the temperature, but at all times, the four plots with a multi-layered vegetation community cover had lower temperatures than the uncovered plots. This is a good indication of the significant cooling effect of vegetation cover during the day. This indicates that the higher the degree of canopy density of the same type of multi-layered vegetation community in a park green space, the lower the temperature; in the sample plots with a multi-layered vegetation cover, the temperature was above 30 °C for more than 8 h in Plot 1, 2, 3, and only above 6 h in Sample 4. The higher the canopy density, the shorter the duration of the high temperature in the sample plots. This means that the higher the vegetation cover of the parkland, the higher the canopy density of the multi-layered vegetation, the lower the microclimate temperature, and the shorter the duration of high temperatures, the more effectively the parkland can reduce temperatures.
3.2. Changes in Relative Humidity at the Plots and Control Site
As can be seen from Figure 3, the trend in the relative humidity at each plot and the control site is consistent, showing an inverted “U” pattern of rising and then falling, with the lowest point at all plots and the control site occurring around 14:00, in the opposite direction to the trend in air temperature. The relative humidity ranged from 42.58% to 69.91% in all the sample plots, significantly higher than the 36.26% to 56.89% in the control plots. This shows that the vegetation cover can have a significant humidifying effect. Previous studies have shown that the optimum air humidity for the human body is between 40% and 80%; when the relative humidity is below 40%, the air is relatively dry, and the resistance of the respiratory system is weakened, the incidence of various infectious diseases is significantly increased and respiratory diseases are easily induced and aggravated, which is also detrimental to the human body [50]. The non-vegetated control 0 showed a relative humidity below 40%, while the vegetated plots did not show this during the dry and hot summer months. In plot 4, the most densely vegetated plot, relative humidity above 55% was maintained at all times. This suggests that the higher the vegetation cover, the higher the relative humidity of the plots, and that green spaces were effective in raising the relative humidity of the air.
3.3. Comparison of the Cooling Effect of Plots with Different Degrees of Canopy Density
Figure 4 shows a comparison of the cooling intensity of plots with different degrees of canopy density. As can be seen from the figure, from 8:00 to 18:00, the temperature difference between all the measured plots and the control site is greater than 0. This result proves that urban park green spaces can significantly reduce the ambient temperature. Compared to the square floor tiles without vegetation coverage, the cooling intensity of each plot ranged from 0.05 °C to 2.44 °C during the observation time, with an average cooling intensity of 1.12 °C. From 10:00 to 16:00, the temperature difference between each plot and the control site began to increase, reaching the maximum temperature difference (2.44 °C) at 12:00, indicating that the urban park green space has the strongest ability to regulate temperatures during the highest temperature period of the day.
The temperature difference between each plot and the control site was obvious during the observation period, and the cooling intensity was in the order of plot 4 > plot 3 > plot 2 > plot 1, with the greatest cooling intensity in plot 4, which had the highest canopy density. The maximum value was reached at 12:00. As can be seen from Figure 3, at any given moment, the cooling intensity was greatest in plot 4, which had the highest canopy density, and the cooling effect was best; the least intense cooling was in plot 1, which had the lowest canopy density. This result shows that the amount of vegetation coverage has a significant effect on the cooling effect of parks; the more vegetation coverage and the greater the degree of canopy density, the better the cooling effect of park green space, and the degree of canopy density of multi-layered communities in urban parks has a significant positive correlation with the cooling effect.
3.4. Comparison of the Humidifying Effect of Plots with Different Degrees of Canopy Density
Figure 5 shows a comparison of the intensity of humidification in plots with different degrees of canopy density. As can be seen from Figure 5, the difference in the relative humidity between plots 1 to 4 and control 0 was greater than 0 during the measurement period, and the difference in the relative humidity between each plot and the control site was significant. This result proves that urban parks with vegetation coverage can significantly enhance the relative humidity within the environment. The order of humidification intensity for each plot was 4 > 3 > 2 > 1, with the greatest intensity in plot 4, which had the greatest canopy density. Compared to the control 0, the moisture gain intensity of each plot ranged from 0.5% to 17.33% during the observation period, with an average moisture gain intensity of 6.46%; the moisture gain intensity of the park green space increased and then decreased over time, with the moisture gain intensity of each plot increasing from 10:00 to 16:00 and reaching the maximum moisture difference (18.38%) at 14:00.
The above results show that urban park plant communities have the greatest ability to humidify and regulate the environment during the time of day when the relative humidity is at its highest. During the observation period, the relative humidity magnitude of the urban park plots with different degrees of canopy density was higher than that of the control 0. At any moment, the highest degree of canopy density, plot 4, had the highest intensity of humidification and the best humidification effect. The least intensive moisture gain was in plot 1, which had the lowest canopy density. This result shows that vegetation coverage has a significant effect on the humidifying effect of parks, and the higher the degree of canopy density, the better the humidifying effect of green areas in parks, and the degree of canopy density of multi-layered vegetation communities in urban parks has a significant positive correlation with the humidifying effect.
4. Discussion
4.1. Analysis of the Effect of Vegetation Cover on Microclimate Cooling and Humidification in Urban Parks
The finding that urban parks can significantly improve urban air temperatures has been confirmed in many regional and urban studies [12,16,17,18]. In this study, after monitoring the air temperature variation patterns in Beijing Olympic Forest Park plots with different degrees of canopy density at fixed points, it was found that the temperature of the park green areas with vegetation cover was always lower than that of the control site in the open square floor tiles without vegetation cover during the observation time from early morning to late evening. During the observation period, the pattern of temperature change in each plot was the same as that of the control site, showing an inverted “U” shape trend increasing first and then decreasing; in terms of the cooling intensity, the order of cooling intensity was: plot4 > plot 3 > plot 2 > plot 1 > control 0. Compared with the square tiles without vegetation cover, the cooling intensity of multi-layered vegetation community sample sites during the observation period ranged from 0.05 to 2.44 °C, with an average cooling intensity of 1.12 °C. This result shows that the vegetation cover of urban parks can have a significant cooling effect, but there are some differences in the cooling intensity of the park plots at different times of the day and different degrees of canopy density. This result is consistent with the findings of Chang et al., who measured and compared the cooling effect in 61 parks in Taipei City and found that the cooling effect in parks was greatest at midday in summer, with an intensity of 0.81 °C, which is slightly lower than the results of this study [51]. The reason for this is probably related to the location of the observation plots and the different degrees of park closeness. The higher the degree of closeness, the more the multi-layered vegetation community absorbs and reflects a large amount of solar radiation through its branches and leaves, and the dense tree canopy acts as shade, which can largely shade the park during daylight hours, enhancing the cooling effect of the park [52,53]. The temperature of a substance is mainly determined by the heat capacity of the substance itself, which is higher in the leaves of plants than in the impermeable ground. Therefore, for the same amount of solar radiation and time, the temperature of an area covered with plants rises more slowly, mainly because the plant leaves can photosynthesize [54,55].
During the observation period, the relative humidity in the vegetated parkland was consistently higher than in the non-vegetated open plaza ground control. The trend in the relative humidity was consistent between the plots and the control site, showing a ‘U’ shaped pattern of decreasing and then increasing, with the lowest point occurring at around 14:00 in all plots and the control site, in contrast to the temperature trend. Compared to the control site, the intensity of moisture increased at each plot during the observation period and ranged from 0.5% to 17.33%, with an average intensity of 6.46%; during the measurement time (8:00–18:00), the intensity of the moisture at the park green first increased and then decreased, and the intensity of the moisture increased at each plot from 10:00–16:00, reaching the maximum moisture difference (18.38%) at 14:00. The order of moisture gain intensity at each plot from highest to lowest was sample plot 4 > plot 3 > plot 2 > plot 1 > control 0; the greatest moisture gain intensity was at sample plot 4 with the lowest pressure, and the highest moisture gain intensity was at sample plot 4 with the lowest pressure. Due to the ample vegetation cover, the evaporation process of the plants and the evaporation of the soil radiates and converts solar energy into latent heat, which will not cause the air temperature to rise and is, thus, able to reduce the air temperature, which is one of the reasons why urban parks can have a cooling effect [56,57]. However, the evapotranspiration of plants requires a large amount of water, and the availability of sufficient water has a significant impact on the cooling and humidifying effect of the park. This study compares the changes in relative humidity of plant communities in parks with different degrees of canopy density over the observed time, and the results show that parks with higher degrees of canopy density have higher relative humidity and higher moisture retention; the comparison with the previous trend in temperature suggests that temperature keeps decreasing as the relative humidity increases, so it can be proved that evapotranspiration can influence temperature. As a result, plot 4, which had the highest canopy density, had the highest relative humidity and the lowest air temperature, and control 0, with no vegetation cover, had the lowest relative humidity and the highest air temperature This finding echoes the findings of Chen and Wong, who investigated the cooling effect in two cities and found that city parks had the lowest temperatures and highest relative humidity in the area, and lower temperatures and relative humidity existed in the built-up areas outside the parks [13].
4.2. The Cooling and Humidifying Effect of Multi-Layered Vegetation Communities
Vegetation communities are an important object for studying the links between vegetation and microclimate in urban park cooling affect vegetation, as different vegetation communities can produce a range of microclimates. Previous studies have shown that the increase in relative humidity and reduction in air temperatures due to the evapotranspiration and shading of plants in multi-layered planting combinations is higher than in smaller vegetation communities and is most noticeable in summer [34,35]. In this study, multi-layered vegetation communities with different degrees of canopy density were selected from urban parks. It was found that the degree of the canopy density was significantly correlated with the intensity of cooling and humidification; the higher the degree of the canopy density, the better the effect of cooling and humidification; the higher the degree of canopy density, the slower the rate of warming and the shorter the duration of high temperature. Because the arboreal layer of the vegetation community has a higher green biomass than the other layer, it is the main contributor to cooling efficiency [36]. Multi-layered vegetation communities are more effective in blocking light penetration. With an adequate number of leaves, the forest grass community maintains a strong permeability, which facilitates air circulation under the canopy and shows an outstanding cooling effect, especially in breezy weather. The regulating effect of vegetation communities on environmental factors is not a simple superposition of the regulating capacity of individual plants but rather reflects the total leaf volume and geometry of the vegetation community. Canopy structure has an important influence on energy conversion and sub-canopy airflow, thus affecting the microclimate [38].
In conclusion, the wetting effect of the greater canopy density plots is significantly better than that of the lesser canopy density plots and even better than that of the open squares without vegetation cover. This is mainly due to the fact that the larger the cover of the multi-layered vegetation community in the parkland, the higher the degree of canopy density and the bushier the trees and shrubs, and the more the canopy can shade more solar radiation so that the sunlight and thermal radiation radiated to the environment under the trees will be greatly reduced, and therefore, the temperature in the parkland will be relatively lower [58,59,60,61]. The greater the canopy density of the vegetation community, the more water is stored in the park, the less water is carried away by evapotranspiration, and the more water is retained, resulting in higher air humidity and a higher intensity of humidification, resulting in a better cooling effect. The high canopy density blocks light and has a significant effect on human physiological responses, making it feel cooler [55].
5. Conclusions
In this study, we took the Beijing Olympic Forest Park as an example and selected a sample of multi-layered vegetation communities with different degrees of vegetation cover and a square tile without vegetation cover in the park for control comparison. The conclusions of this paper are as follows:
(1) During the observation period, the pattern of the temperature change in each plot was the same as that in the control site, showing an inverted “U” pattern that increased and then decreased, while the trend of the relative humidity was the same between the plots and the control site, showing a “U” pattern which decreased and then increased, in contrast to the temperature trend. Compared with the square tiles without vegetation cover, the cooling intensity of the multi-layered vegetation community sample plots during the observation period ranged from 0.05 to 2.44 °C, with an average cooling intensity of 1.12 °C; compared with the control sites 0, the intensity of the moisture increased at each measurement plot during the observation period and ranged from 0.5% to 17.33%, with an average intensity of 6.46%. The cooling and moisture increase intensity of the sample plots with vegetation cover were higher than those without vegetation cover. The results indicate that vegetation cover types were cooler and wetter than non-vegetation cover types, suggesting that vegetation cover was the main factor influencing temperature.
(2) The study showed that during the measurement time (08:00–18:00), the temperature in the multi-layered vegetation community sample plots was lower than that in the control plots without vegetation cover, and the temperature in the sample plots decreased with increasing densities, ranking from highest to lowest: control 0 > plot 1 > plot 2 > plot 3 > plot 4; the relative humidity in all the multi-layered vegetation community sample plots was higher than that in the control plots with material cover at the time of observation. The relative humidity in the sample plots was higher than that in the control plots, and the relative humidity in the sample plots was higher than that in the non-vegetated open plaza. Multi-layered vegetation communities significantly affect the microclimate of urban parks. At the same observation time, the cooling and humidifying effect of high canopy density multi-layered vegetation communities was always higher than that of low canopy density ones, and the canopy density of urban park vegetation communities was significantly and positively correlated with the cooling effect and the humidifying effect. The higher the canopy densities, the better the cooling and humidifying effects and the shorter the duration of high temperatures.
This study compares the differences in cooling and humidifying effects between multi-layered vegetation communities with different degrees of canopy density in urban parks and open squares without vegetation cover at horizontal heights. The study selected sample plots with similar scrub, lawn, and tree densities, which could only cover tall trees, but not low shrubs and grasses. The research on the cooling effect of more cover characteristic parameters of multi-layered vegetation communities can be strengthened, and more meteorological parameter indicators, such as wind speed can be introduced for comprehensive analysis. This study can provide a reference basis for the planning and design of urban parks in order to give full play to the heat island effect of urban parks.
Author Contributions
Conceptualization, M.D.; methodology, M.D.; investigation, Y.Z.; software, Y.Z.; resources, Y.Z.; writing—original draft preparation, Y.Z.; writing—review and editing, Y.Z. visualization, Y.Z. and M.D. All authors have read and agreed to the published version of the manuscript.
Funding
This research received no external funding.
Acknowledgments
We would like to thank our team of colleagues in the Central South University of Forestry and Technology. In addition, we would also like to thank the referees and the editors for their valuable comments for improving this manuscript.
Conflicts of Interest
The authors declare no conflict of interest.
References
- Grimm, N.B.; Faeth, S.H.; Golubiewski, N.E.; Redman, C.L.; Wu, J.; Bai, X.; Briggs, J.M. Global Change and the Ecology of Cities. Science 2008, 319, 756–760. [Google Scholar] [CrossRef] [PubMed] [Green Version]
- Oke, T.R. The Energetic Basis of the Urban Heat Island. Q. J. R. Met. Soc. 1982, 108, 1–24. [Google Scholar] [CrossRef]
- Martini, A.; Biondi, D.; Batista, A.C. Urban forest components influencing microclimate and cooling potential. Rev. Árvore 2017, 41, e410603. [Google Scholar] [CrossRef]
- Hami, A.; Abdi, B.; Zarehaghi, D.; Maulan, S.B. Assessing the Thermal Comfort Effects of Green Spaces: A Systematic Review of Methods, Parameters, and Plants’ Attributes. Sustain. Cities Soc. 2019, 49, 101634. [Google Scholar] [CrossRef]
- Wang, X.; Cheng, H.; Xi, J.; Yang, G.; Zhao, Y. Relationship between Park Composition, Vegetation Characteristics and Cool Island Effect. Sustainability 2018, 10, 587. [Google Scholar] [CrossRef] [Green Version]
- White, M.A.; Nemani, R.R.; Thornton, P.E.; Running, S.W. Satellite Evidence of Phenological Differences Between Urbanized and Rural Areas of the Eastern United States Deciduous Broadleaf Forest. Ecosystems 2002, 5, 260–273. [Google Scholar] [CrossRef]
- Shekhar, S.; Aryal, J. Role of Geospatial Technology in Understanding Urban Green Space of Kalaburagi City for Sustainable Planning. Urban For. Urban Green. 2019, 46, 126450. [Google Scholar] [CrossRef]
- Qiu, K.; Jia, B. The Roles of Landscape Both inside the Park and the Surroundings in Park Cooling Effect. Sustain. Cities Soc. 2020, 52, 101864. [Google Scholar] [CrossRef]
- Grilo, F.; Pinho, P.; Aleixo, C.; Catita, C.; Silva, P.; Lopes, N.; Freitas, C.; Santos-Reis, M.; McPhearson, T.; Branquinho, C. Using Green to Cool the Grey: Modelling the Cooling Effect of Green Spaces with a High Spatial Resolution. Sci. Total Environ. 2020, 724, 138182. [Google Scholar] [CrossRef]
- Liu, S.; Zhao, J.; Xu, M.; Ahmadian, E. Effects of Landscape Patterns on the Summer Microclimate and Human Comfort in Urban Squares in China. Sustain. Cities Soc. 2021, 73, 103099. [Google Scholar] [CrossRef]
- Wolch, J.R.; Byrne, J.; Newell, J.P. Urban Green Space, Public Health, and Environmental Justice: The Challenge of Making Cities ‘Just Green Enough’. Landsc. Urban Plan. 2014, 125, 234–244. [Google Scholar] [CrossRef] [Green Version]
- Zheng, J.; Tarin, M.W.K.; Chen, G.; Zhang, Q.; Deng, C. The Characteristics of Plant Clusters Influence on the Cooling Effect: A Case Study in a Subtropical Island Park, China. Glob. Ecol. Conserv. 2022, 34, e02055. [Google Scholar] [CrossRef]
- Yu, C.; Hien, W.N. Thermal Benefits of City Parks. Energy Build. 2006, 38, 105–120. [Google Scholar] [CrossRef]
- Upmanis, H.; Eliasson, I.; Lindqvist, S. The Influence of Green Areas on Nocturnal Temperatures in a High Latitude City (Göteborg, Sweden). Int. J. Climatol. 1998, 18, 681–700. [Google Scholar] [CrossRef]
- Barradas, V.L. Air Temperature and Humidity and Human Comfort Index of Some City Parks of Mexico City. Int. J. Biometeorol. 1991, 35, 24–28. [Google Scholar] [CrossRef]
- Potchter, O.; Cohen, P.; Bitan, A. Climatic Behavior of Various Urban Parks during Hot and Humid Summer in the Mediterranean City of Tel Aviv, Israel. Int. J. Climatol. 2006, 26, 1695–1711. [Google Scholar] [CrossRef]
- Yan, H.; Wu, F.; Dong, L. Influence of a Large Urban Park on the Local Urban Thermal Environment. Sci. Total Environ. 2018, 622–623, 882–891. [Google Scholar] [CrossRef]
- Li, Y.; Fan, S.; Li, K.; Zhang, Y.; Dong, L. Microclimate in an Urban Park and Its Influencing Factors: A Case Study of Tiantan Park in Beijing, China. Urban Ecosyst. 2021, 24, 767–778. [Google Scholar] [CrossRef]
- Jauregui, E. Influence of a Large Urban Park on Temperature and Convective Precipitation in a Tropical City. Energy Build. 1990, 15, 457–463. [Google Scholar] [CrossRef]
- Cao, X.; Onishi, A.; Chen, J.; Imura, H. Quantifying the Cool Island Intensity of Urban Parks Using ASTER and IKONOS Data. Landsc. Urban Plan. 2010, 96, 224–231. [Google Scholar] [CrossRef]
- Wei, J.; Li, H.; Wang, Y.; Xu, X. The Cooling and Humidifying Effects and the Thresholds of Plant Community Structure Parameters in Urban Aggregated Green Infrastructure. Forests 2021, 12, 111. [Google Scholar] [CrossRef]
- Shi, D.; Song, J.; Huang, J.; Zhuang, C.; Guo, R.; Gao, Y. Synergistic Cooling Effects (SCEs) of Urban Green-Blue Spaces on Local Thermal Environment: A Case Study in Chongqing, China. Sustain. Cities Soc. 2020, 55, 102065. [Google Scholar] [CrossRef]
- Zhao, D.; Lei, Q.; Shi, Y.; Wang, M.; Chen, S.; Shah, K.; Ji, W. Role of Species and Planting Configuration on Transpiration and Microclimate for Urban Trees. Forests 2020, 11, 825. [Google Scholar] [CrossRef]
- Zheng, J.; Tarin, M.W.K.; Jiang, D.; Li, M.; Ye, J.; Chen, L.; He, T.; Zheng, Y. Which Ornamental Features of Bamboo Plants Will Attract the People Most? Urban For. Urban Green. 2021, 61, 127101. [Google Scholar] [CrossRef]
- Dimoudi, A.; Nikolopoulou, M. Vegetation in the Urban Environment: Microclimatic Analysis and Benefits. Energy Build. 2003, 35, 69–76. [Google Scholar] [CrossRef] [Green Version]
- Georgi, J.N.; Dimitriou, D. The Contribution of Urban Green Spaces to the Improvement of Environment in Cities: Case Study of Chania, Greece. Build. Environ. 2010, 45, 1401–1414. [Google Scholar] [CrossRef] [Green Version]
- Oliveira, S.; Andrade, H.; Vaz, T. The Cooling Effect of Green Spaces as a Contribution to the Mitigation of Urban Heat: A Case Study in Lisbon. Build. Environ. 2011, 46, 2186–2194. [Google Scholar] [CrossRef]
- Xue, X.; Zhang, J.; Sun, Y.; Zhuang, J.; Wang, Y. Study of Carbon Sequestration & Oxygen Release and Cooling & Humidifying Effect of Main Greening Tree Species in Shanghai. J. Nanjing For. Univ. (Nat. Sci. Ed.) 2016, 40, 81–86. [Google Scholar]
- Wang, J.; Zhou, W.; Jiao, M.; Zheng, Z.; Ren, T.; Zhang, Q. Significant Effects of Ecological Context on Urban Trees’ Cooling Efficiency. ISPRS J. Photogramm. Remote Sens. 2020, 159, 78–89. [Google Scholar] [CrossRef]
- Han, H.J.; Zhou, Y.W. Cooling and Moisturizing Effect of Different Afforested Tree Species in July. J. Hebei Agric. Sci 2007, 5, 28–30. [Google Scholar]
- Petri, A.C.; Wilson, B.; Koeser, A. Planning the Urban Forest: Adding Microclimate Simulation to the Planner’s Toolkit. Land Use Policy 2019, 88, 104117. [Google Scholar] [CrossRef]
- Tang, Z.; Ren, Z.; Zheng, H.; He, X.-Y. Cooling Effects of Urban Forest Community Structure. Chin. J. Appl. Ecol. 2017, 28, 2823–2830. [Google Scholar]
- Zhang, Z.; Lv, Y.; Pan, H. Cooling and Humidifying Effect of Plant Communities in Subtropical Urban Parks. Urban For. Urban Green. 2013, 12, 323–329. [Google Scholar] [CrossRef]
- Pan, J.; Li, J.; Li, S.; Dong, L.; Wang, Y. Study on the Relationship between Plant Community and Spatial Differentiation of Negative Air Ions in Urban Green Space—A Case Study of Beijing Olympic Forest Park. Chin. Landsc. Archit. 2022, 6, 57–62. [Google Scholar]
- Li, H.; Meng, H.; He, R.; Lei, Y.; Guo, Y.; Ernest, A.; Jombach, S.; Tian, G. Analysis of Cooling and Humidification Effects of Different Coverage Types in Small Green Spaces (SGS) in the Context of Urban Homogenization: A Case of HAU Campus Green Spaces in Summer in Zhengzhou, China. Atmosphere 2020, 11, 862. [Google Scholar] [CrossRef]
- Tan, X.; Liao, J.; Bedra, K.B.; Li, J. Evaluating the 3D Cooling Performances of Different Vegetation Combinations in the Urban Area. J. Asian Archit. Build. Eng. 2022, 21, 1124–1136. [Google Scholar] [CrossRef]
- Leuzinger, S.; Körner, C. Tree Species Diversity Affects Canopy Leaf Temperatures in a Mature Temperate Forest. Agric. For. Meteorol. 2007, 146, 29–37. [Google Scholar] [CrossRef]
- Qin, Z.; Li, Z.; Cheng, F.; Chen, J.; Liang, B. Influence of Canopy Structural Characteristics on Cooling and Humidifying Effects of Populus Tomentosa Community on Calm Sunny Summer Days. Landsc. Urban Plan. 2014, 127, 75–82. [Google Scholar] [CrossRef]
- Fowler, D.; Skiba, U.; Nemitz, E.; Choubedar, F.; Branford, D.; Donovan, R.; Rowland, P. Measuring Aerosol and Heavy Metal Deposition on Urban Woodland and Grass Using Inventories of 210PB and Metal Concentrations in Soil. In Biogeochemical Investigations of Terrestrial, Freshwater, and Wetland Ecosystems across the Globe; Wieder, R.K., Novák, M., Vile, M.A., Eds.; Springer: Dordrecht, The Netherlands, 2004; pp. 483–499. ISBN 978-94-010-3751-8. [Google Scholar]
- Skelhorn, C.; Lindley, S.; Levermore, G. The Impact of Vegetation Types on Air and Surface Temperatures in a Temperate City: A Fine Scale Assessment in Manchester, UK. Landsc. Urban Plan. 2014, 121, 129–140. [Google Scholar] [CrossRef]
- Cheung, P.K.; Jim, C.Y.; Siu, C.T. Effects of Urban Park Design Features on Summer Air Temperature and Humidity in Compact-City Milieu. Appl. Geogr. 2021, 129, 102439. [Google Scholar] [CrossRef]
- Lin, T.-P.; Matzarakis, A.; Hwang, R.-L. Shading Effect on Long-Term Outdoor Thermal Comfort. Build. Environ. 2010, 45, 213–221. [Google Scholar] [CrossRef]
- Rahman, M.A.; Dervishi, V.; Moser-Reischl, A.; Ludwig, F.; Pretzsch, H.; Rötzer, T.; Pauleit, S. Comparative Analysis of Shade and Underlying Surfaces on Cooling Effect. Urban For. Urban Green. 2021, 63, 127223. [Google Scholar] [CrossRef]
- Liu, J.M.; Li, S.H.; Yang, Z.F. Temperature and Humidity Effect of Urban Green Spaces in Beijing in Summer. Chin. J. Ecol. 2008, 27, 1972–1978. [Google Scholar]
- Hwang, Y.H.; Lum, Q.J.G.; Chan, Y.K.D. Micro-Scale Thermal Performance of Tropical Urban Parks in Singapore. Build. Environ. 2015, 94, 467–476. [Google Scholar] [CrossRef]
- Xiao, X.D.; Dong, L.; Yan, H.; Yang, N.; Xiong, Y. The Influence of the Spatial Characteristics of Urban Green Space on the Urban Heat Island Effect in Suzhou Industrial Park. Sustain. Cities Soc. 2018, 40, 428–439. [Google Scholar] [CrossRef]
- Wu, Z.; Zou, M.; Ai, L.; Feng, Y. The Heat Island Regulation Effects of Chongqing Parks in Summer. Chin. Agric. Sci. Bull. 2014, 30, 238–245. [Google Scholar]
- Wang, C.; Zhao, C.; Chen, X.; Liu, D. Remote Sensing—Based Green Space Evolution in Tangshan and Its Influence on Heat Is- Land Effect. Remote Sens. Nat. Resour. 2022, 34, 168–175. [Google Scholar]
- Li, X.J.; Song, C.N.; Zhou, G.L.; Chao, W. Simplified Method for Simulating the FSI Effect of PCS Water Tank in a Nuclear Island Building. J. Vib. Shock 2019, 38, 6–12. [Google Scholar]
- Ren, Q.; Xie, H.; Wang, H. Ecological Resource Assessment for Recreation and Leisure Tourism in Chishui City. J. Green Sci. Technol. 2022, 24, 148–151. [Google Scholar]
- Chang, C.-R.; Li, M.-H.; Chang, S.-D. A Preliminary Study on the Local Cool-Island Intensity of Taipei City Parks. Landsc. Urban Plan. 2007, 80, 386–395. [Google Scholar] [CrossRef]
- Wang, Y.; Akbari, H. The Effects of Street Tree Planting on Urban Heat Island Mitigation in Montreal. Sustain. Cities Soc. 2016, 27, 122–128. [Google Scholar] [CrossRef]
- Yang, W.; Lin, Y.; Li, C.-Q. Effects of Landscape Design on Urban Microclimate and Thermal Comfort in Tropical Climate. Adv. Meteorol. 2018, 2018, 2809649. [Google Scholar] [CrossRef]
- Kurban, A.S.; Papparelli, A.H.; Cunsulo, M.E. Aporte de la Forestación al Control del Clima Urbano en Zona Árida. Av. En Energías Renov. Y Medio Ambiente 2002, 10, 43–48. [Google Scholar]
- Yoshida, A.; Hisabayashi, T.; Kashihara, K.; Kinoshita, S.; Hashida, S. Evaluation of Effect of Tree Canopy on Thermal Environment, Thermal Sensation, and Mental State. Urban Clim. 2015, 14, 240–250. [Google Scholar] [CrossRef]
- Rahman, M.A.; Moser, A.; Gold, A.; Rötzer, T.; Pauleit, S. Vertical Air Temperature Gradients under the Shade of Two Contrasting Urban Tree Species during Different Types of Summer Days. Sci. Total Environ. 2018, 633, 100–111. [Google Scholar] [CrossRef]
- Wang, X.; Dallimer, M.; Scott, C.E.; Shi, W.; Gao, J. Tree Species Richness and Diversity Predicts the Magnitude of Urban Heat Island Mitigation Effects of Greenspaces. Sci. Total Environ. 2021, 770, 145211. [Google Scholar] [CrossRef]
- Hua, L.; Sun, F.; Chen, J.; Tang, L. Quantifying the Cool-Island Effects of Urban Parks Using Landsat-8 Imagery in a Coastal City, Xiamen, China. Acta Ecol. Sin. 2020, 40, 8147–8157. [Google Scholar]
- Mo, H.; Xiao, T.; Zhao, Y.; Zhu, Q.; Li, Z. The Impact of Urban Green Space on Cold Island Effect—A Case Study of Core Urban Changsha. J. Nat. Sci. Hunan Norm. Univ. 2019, 42, 18–22. [Google Scholar]
- Lu, Q.; Yang, T.; Wang, Z.; Wang, X.; He, L. Characteristics of Micro Climate Effects of Wetlands. Clim. Environ. Res. 2020, 25, 399–409. [Google Scholar]
- Zhao, R.; Shen, X.; Tian, G.; Guo, Y.; He, R. The Influence of Landscape Characteristics of a Park Green Space on the Park Cool Island Effect in Zhengzhou City. Acta Ecol. Sin. 2020, 40, 2886–2894. [Google Scholar]
Figure 1.
Map showing the experimental plot area—The Olympic Forest Park.

Figure 2.
The air temperature changes at different plots.

Figure 3.
Relative humidity changes at different plots.

Figure 4.
Comparison of different cooling effects between 8 o’clock and 18 o’clock.

Figure 5.
Comparison of different humidification effects between 8 and 18 o’clock.


Table 1.
Information on control site and plots of multi-layered vegetation communities (trees + shrubs + grasses) in forest parks with different canopy densities.
Table 1.
Information on control site and plots of multi-layered vegetation communities (trees + shrubs + grasses) in forest parks with different canopy densities.
| No. | Canopy Density (%) | Area | Types | Vegetation Types |
|---|---|---|---|---|
| 1 | 8 | 50 m × 50 m | Tree-shrub-grass | Tree: Salix babylonica L., Acer spp., Magnolia grandiflora L., Pinus tabuliformis Carr., Shrub: Rosa chinensis Jacq., Ligustrum × vicaryi Hort. Grass: Lolium perenne L., Poa annua L. |
| 2 | 16 | 50 m × 50 m | ||
| 3 | 31.2 | 50 m × 50 m | ||
| 4 | 69.9 | 50 m × 50 m | ||
| 0 | 0 | 50 m × 50 m | Impervious surface | No vegetation |
Publisher’s Note: MDPI stays neutral with regard to jurisdictional claims in published maps and institutional affiliations. |
© 2022 by the authors. Licensee MDPI, Basel, Switzerland. This article is an open access article distributed under the terms and conditions of the Creative Commons Attribution (CC BY) license (https://creativecommons.org/licenses/by/4.0/).
Share and Cite
MDPI and ACS Style
Zhang, Y.; Dai, M. Analysis of the Cooling and Humidification Effect of Multi-Layered Vegetation Communities in Urban Parks and Its Impact. Atmosphere 2022, 13, 2045. https://0-doi-org.brum.beds.ac.uk/10.3390/atmos13122045
AMA Style
Zhang Y, Dai M. Analysis of the Cooling and Humidification Effect of Multi-Layered Vegetation Communities in Urban Parks and Its Impact. Atmosphere. 2022; 13(12):2045. https://0-doi-org.brum.beds.ac.uk/10.3390/atmos13122045
Chicago/Turabian StyleZhang, Yu, and Meiqi Dai. 2022. "Analysis of the Cooling and Humidification Effect of Multi-Layered Vegetation Communities in Urban Parks and Its Impact" Atmosphere 13, no. 12: 2045. https://0-doi-org.brum.beds.ac.uk/10.3390/atmos13122045
Note that from the first issue of 2016, this journal uses article numbers instead of page numbers. See further details here.