
Critical Pre-Formation Decision Flowchart to Apply Tropical Cyclone Lifecycle Predictions in Eastern North Pacific
 ,
, 
Abstract
:1. Introduction
2. Methodology
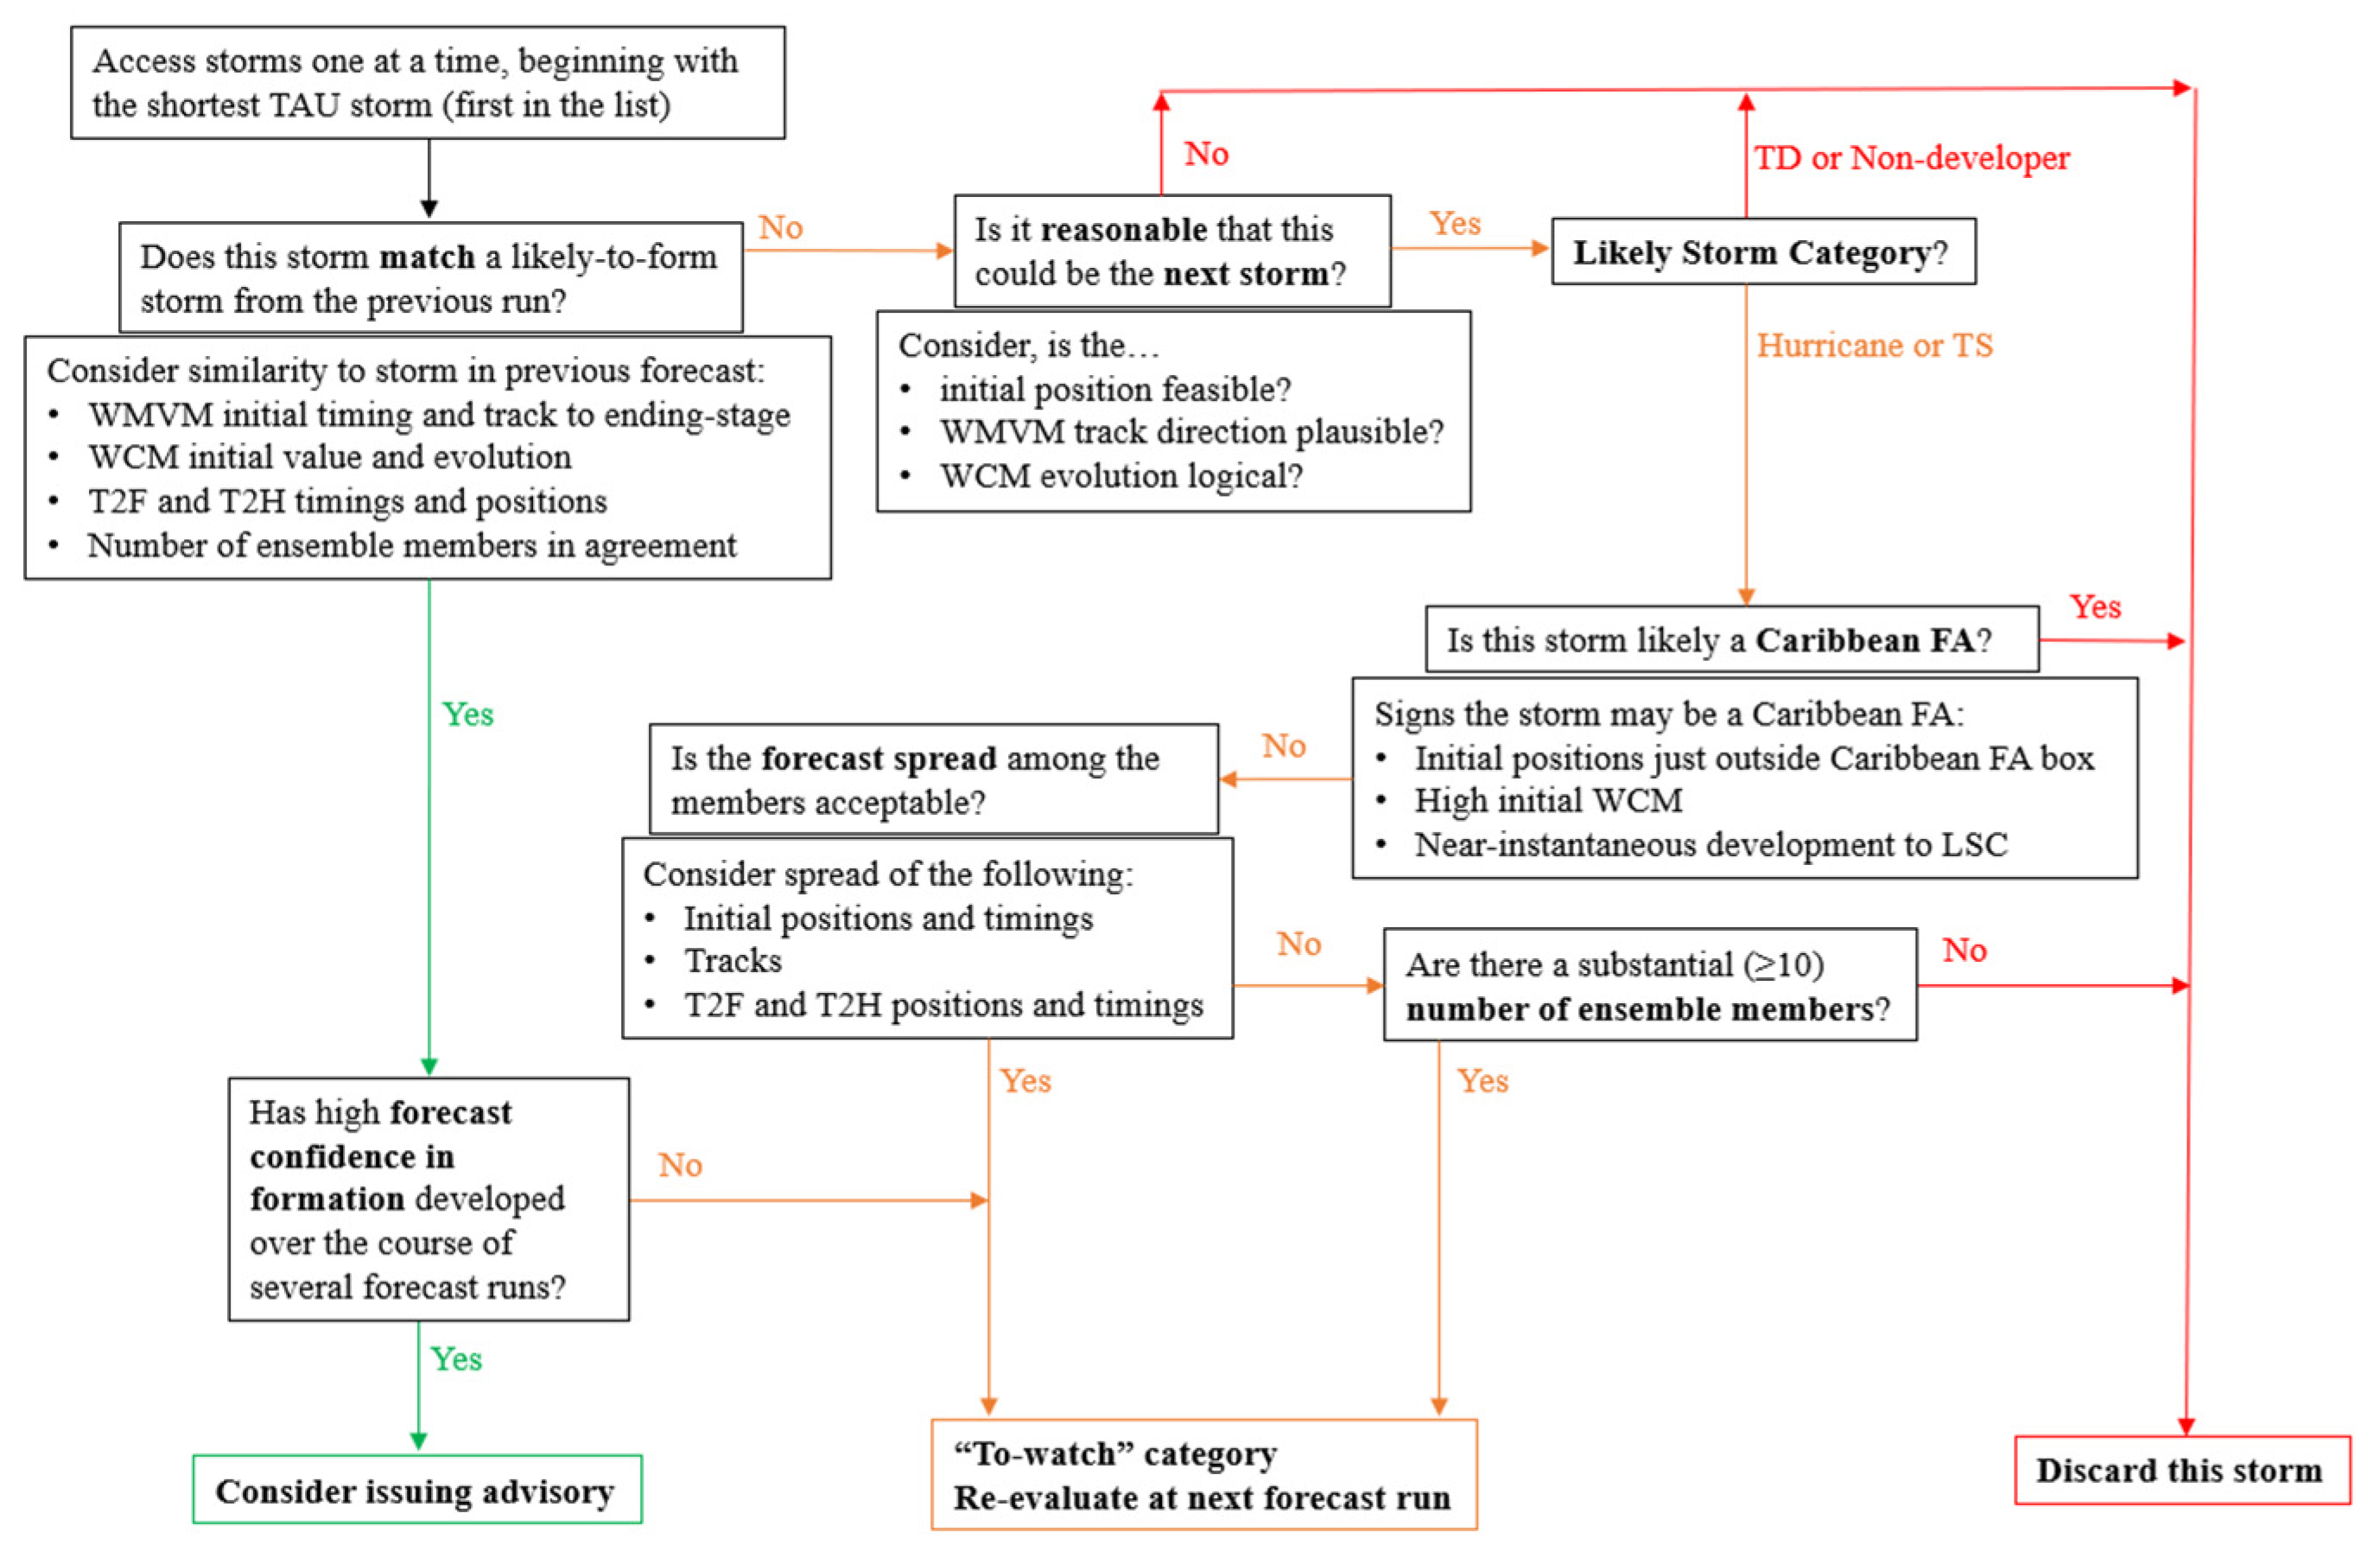
3. Decision Flowchart for Storm Selection
4. Hurricane Category Examples
4.1. Decision Flowchart Application to Pre-Enrique
4.2. Decision Flowchart Application to Pre-Felicia
5. Tropical Storm Examples
5.1. Decision Flowchart Application to Pre-Guillermo
5.2. Decision Flowchart Application to Pre-Jimena
5.3. Summary of Application of Decision Flowchart for ENP Tropical Storms
6. Decision Flowchart Application to Non-Developing Disturbance
7. Summary and Discussion
Author Contributions
Funding
Institutional Review Board Statement
Informed Consent Statement
Data Availability Statement
Conflicts of Interest
Appendix A

| ECEPS Initial Time (Selected Storm) | T2F(35) Timing [Error] | Alternate ECEPS Storm Options Considered [Scenario Representing Reason for Non-Selection] | ||
|---|---|---|---|---|
| 00 UTC 17 Jun (Storm 14) | 062512 [Late 6 h] | Storm 11 [Caribbean FA] | Storm 12 [LSC TD] | Storm 17 [Caribbean FA] |
| 12 UTC 17 Jun (Storm 10) | 062512 [Late 6 h] | Storm 7 [5 members] | Storm 11 [6 members] | Storm 12 [inconsistent WCM (high)] |
| 00 UTC 18 Jun (Storm 8) | 062600 [Late 18 h] | Storm 2 [inconsistent T2F (early)] | Storm 5 [cold-core system] | Storm 11 [inconsistent T2F (late & west)] |
| 12 UTC 18 Jun (Storm 12) | 062600 [Late 18 h] | Storm 8 [4 members] | Storm 11 [inconsistent WCM (low)] | Storm 13 [4 members] |
| 00 UTC 19 Jun (Storm 11) | 062606 [Late 24 h] | Storm 7 [cold-core system] | Storm 8 [inconsistent WCM (low)] | Storm 13 [5 members] |
| 12 UTC 19 Jun (Storm 9) | 062612 [Late 30 h] | Storm 7 [inconsistent T2H (late & west)] | Storm 11 [4 members] | Storm 14 [4 members] |
| 00 UTC 20 Jun (Storm 7) | 062512 [Late 6 h] | Storm 5 [inconsistent T2H (late & west)] | Storm 6 [Caribbean FA] | Storm 7 [inconsistent WCM (high)] |
| 12 UTC 20 Jun (Storm 3) | 062512 [Late 6 h] | Storm 1 [cold-core system] | Storm 5 [inconsistent ending-stage (late)] | Storm 7 [cold-core system] |
| 00 UTC 21 Jun Missing | Missing single forecast [Consider using last available] | |||
| 12 UTC 21 Jun (Storm 3) | 062512 [Late 6 h] | Storm 1 [cold-core system] | Storm 5 [cold-core system] | Storm 6 [cold-core system] |
| 00 UTC 22 Jun (Storm 4) | 062506 [Exact time] | Storm 1 [cold-core system] | Storm 2 [6 members] | Storm 5 [cold-core system] |
| 12 UTC 22 Jun through 00 UTC 26 Jun | Missing forecasts for 3.5 days [Too many for extrapolation] | |||
| 12 UTC 26 Jun (Storm 2) | Already a TS since 06 UTC 25 Jun and Became a Hurricane 6h ago | |||
| ECEPS Initial Time (Selected Storm) | T2TS Timing [Error] | Alternate ECEPS Storm Options Considered [Scenario Representing Reason for Non-Selection] | ||
|---|---|---|---|---|
| 12 UTC 02 Jul (Storm 9) | 071318 [Early 18 h] | Storm 3 [poor member agreement] | Storm 10 [4 members] | Storm 11 [Caribbean FA] |
| 00 UTC 03 Jul (Storm 7) | 071406 [Early 6 h] | Storm 2 [cold-core system] | Storm 8 [5 members] | Storm 9 [inconsistent WCM evolution] |
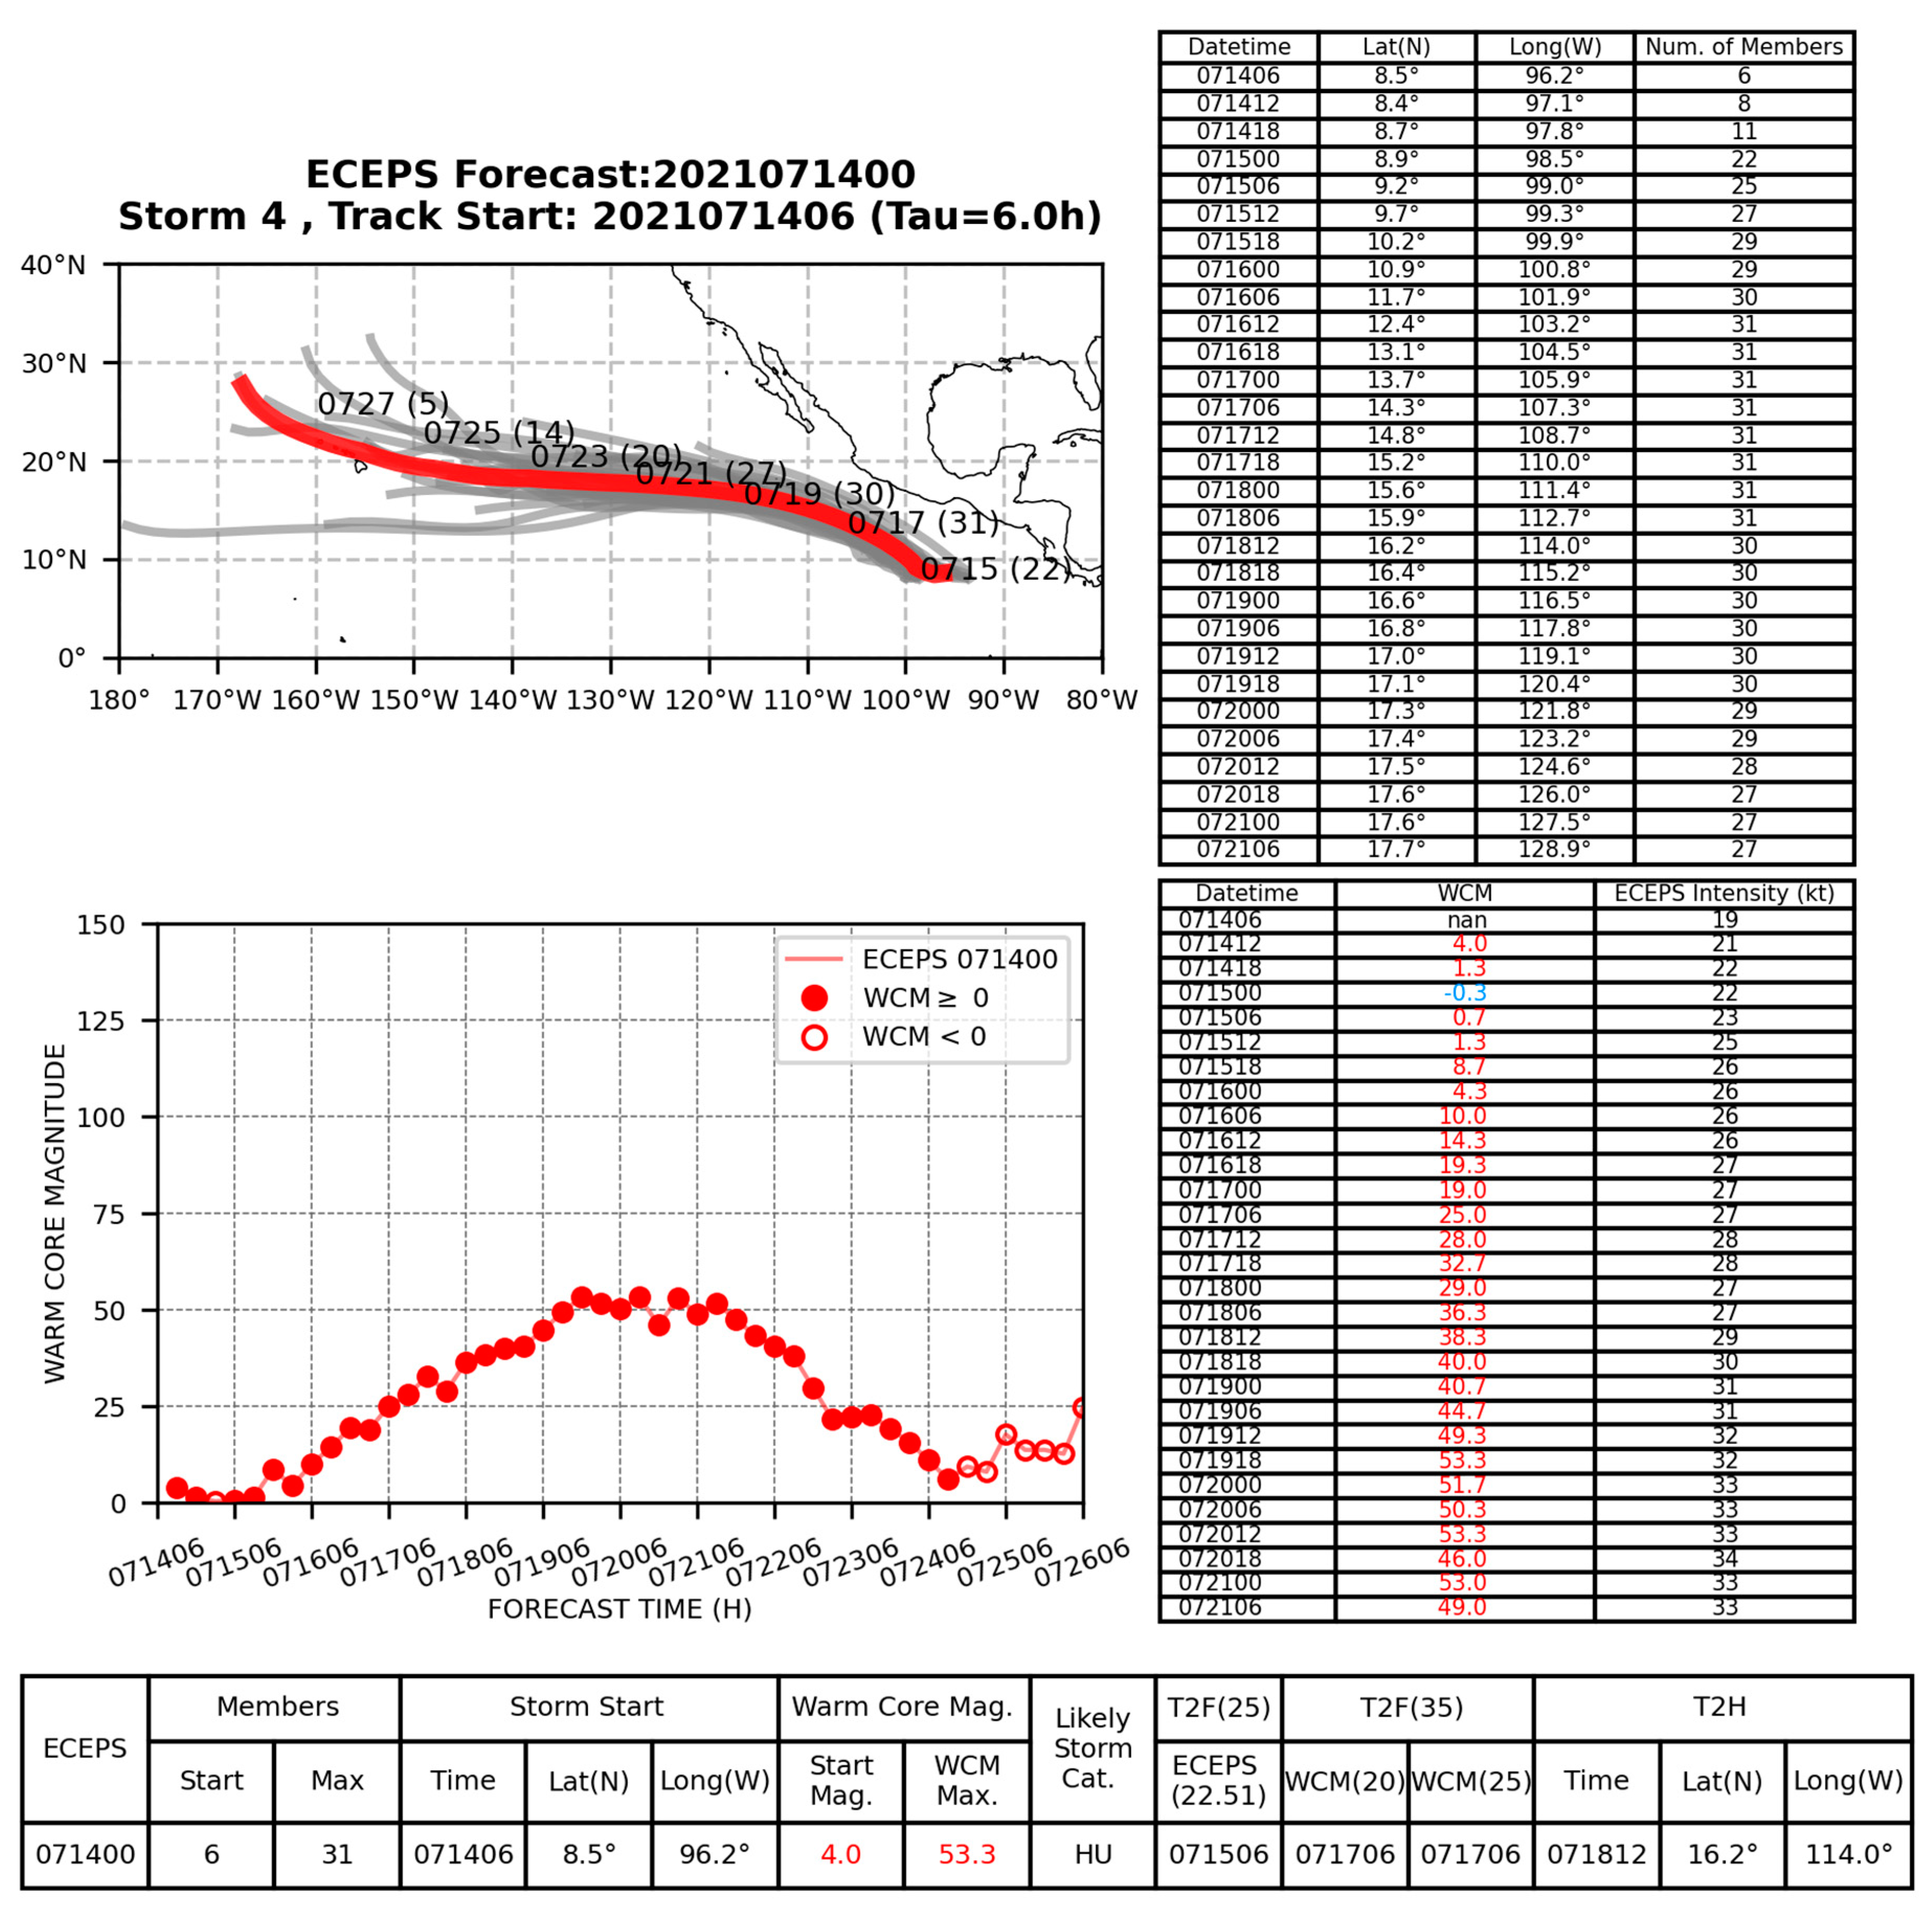
| 12 UTC 03 Jul (Storm 4) | 071406 [Early 6 h] | Storm 5 [inconsistent WCM (high)] | Storm 8 [inconsistent storm start position] | Storm 11 [4 members] |
| 00 UTC 04 Jul (Storm 6) | 071312 [Early 24 h] | Storm 5 [cold-core system] | Storm 7 [5 members] | Storm 8 [7 members] |
| 12 UTC 04 Jul (Storm 8) | 071306 [Early 30 h] | Storm 6 [inconsistent storm start position] | Storm 9 [Caribbean FA] | Storm 10 [inconsistent storm start position] |
| 00 UTC 05 Jul (Storm 8) | 071318 [Early 18 h] | Storm 7 [5 members] | Storm 9 [4 members] | Storm 10 [8 members] |
| 12 UTC 05 Jul Missing | Missing single forecast [Consider using last available] | |||
| 00 UTC 06 Jul (Storm 7) | 071406 [Early 6 h] | Storm 6 [4 members] | Storm 11 [Caribbean FA] | Storm 16 [Caribbean FA] |
| 12 UTC 06 Jul (Storm 9) | 071412 [Exact time] | Storm 8 [inconsistent storm start position] | Storm 10 [inconsistent storm start position] | Storm 11 [4 members] |
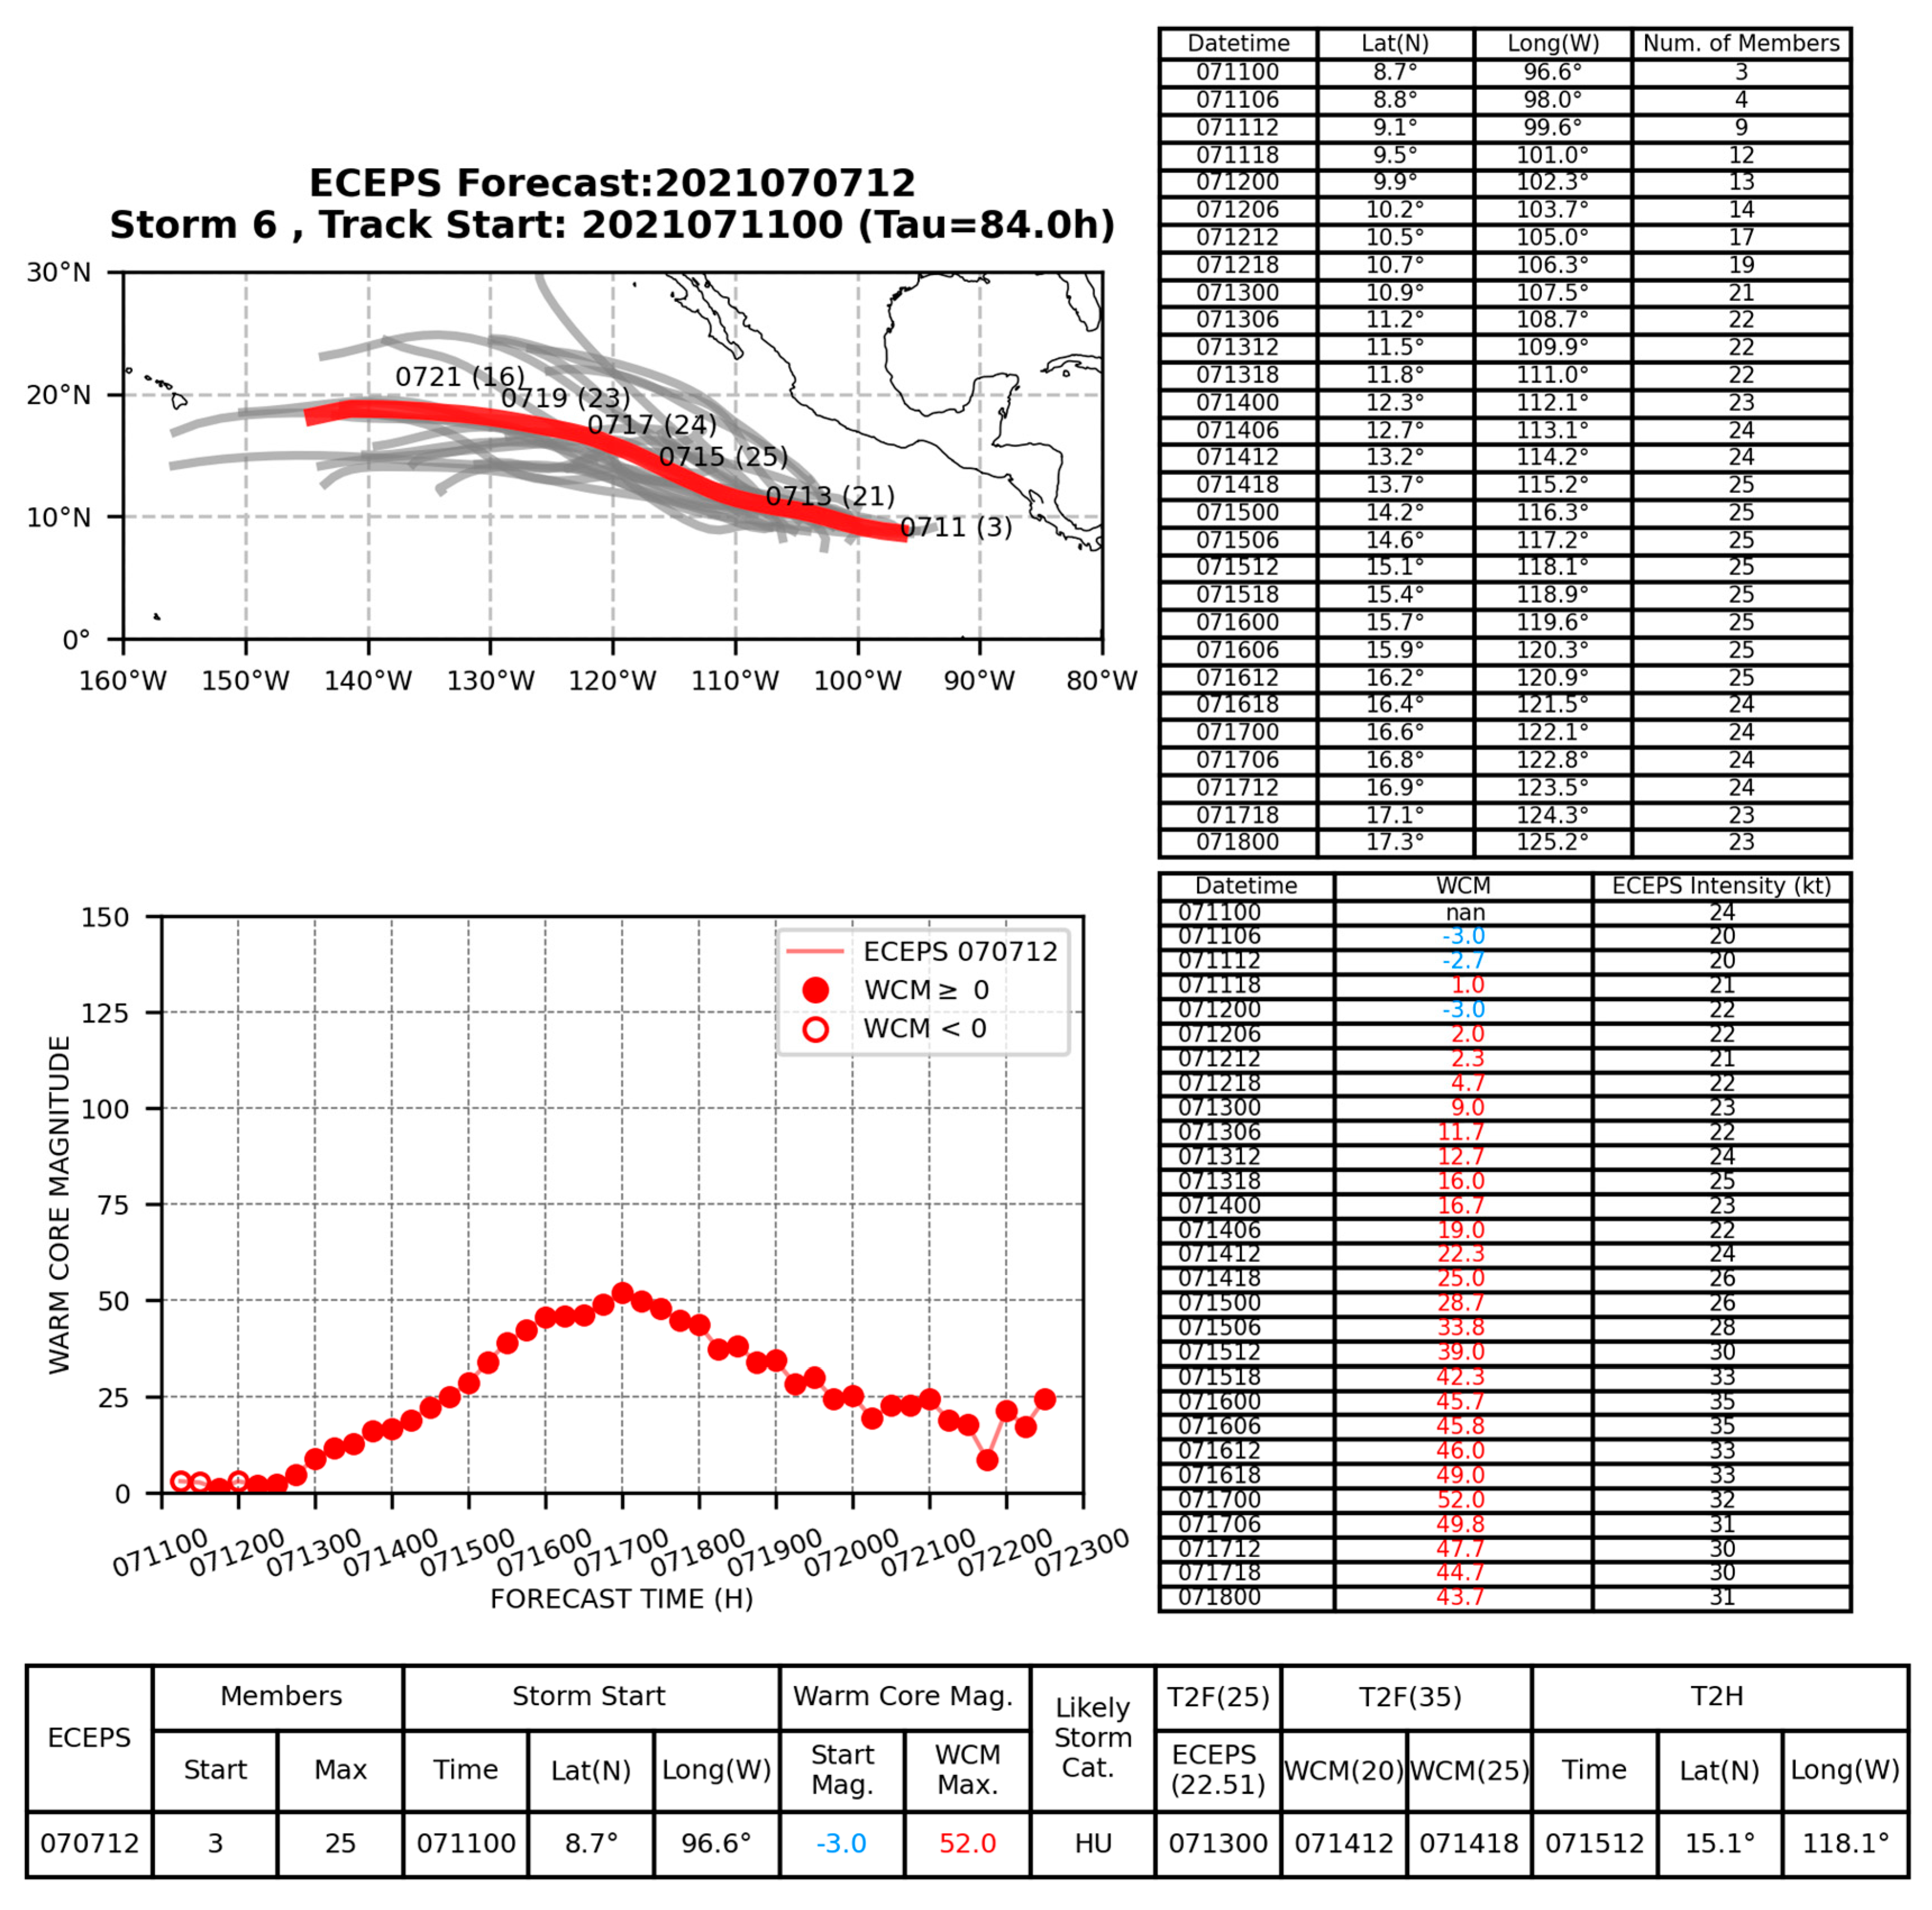
| 00 UTC 07 Jul (Storm 6) | 071406 [Early 6 h] | Storm 3 [cold-core system] | Storm 7 [8 members] | Storm 9 [inconsistent storm start position] |
| 12 UTC 07 Jul (Storm 6) | 071418 [Late 6 h] | Storm 3 [inconsistent storm start] | Storm 8 [inconsistent storm start] | Storm 9 [Caribbean FA] |
| 00 UTC 08 Jul (Storm 7) | 071500 [Late 12 h] | Storm 5 [6 members] | Storm 8 [inconsistent T2H (late)] | Storm 9 [inconsistent WCM (low)] |
| 12 UTC 08 Jul (Storm 8) | 071418 [Late 6 h] | Storm 5 [5 members] | Storm 7 [inconsistent WCM evolution] | Storm 11 [inconsistent WCM evolution] |
| 00 UTC 09 Jul (Storm 5) | 071412 [Exact time] | Storm 3 [4 members] | Storm 7 [inconsistent storm start position] | Storm 8 [7 members] |
| 12 UTC 09 Jul (Storm 5) | 071500 [Late 12 h] | Storm 4 [cold-core system] | Storm 8 [inconsistent storm start position] | Storm 9 [inconsistent storm start time] |
| 00 UTC 10 Jul Missing | Missing single forecast [Consider using last available] | |||
| 12 UTC 10 Jul (Storm 6) | 071512 [Late 24 h] | Storm 3 [inconsistent WCM (low)] | Storm 5 [cold-core system] | Storm 8 [inconsistent T2F (35) (early)] |
| 00 UTC 11 Jul (Storm 7) | 071506 [Late 18 h] | Storm 5 [inconsistent storm start position] | Storm 8 [inconsistent storm start position] | Storm 12 [inconsistent storm start] |
| 12 UTC 11 Jul (Storm 4) | 071506 [Late 18 h] | Storm 3 [cold-core system] | Storm 5 [5 members] | Storm 7 [inconsistent storm start] |
| ECEPS Initial Time | T2TS WCM (20) Timing [Error] | Alternate ECEPS Storm Options Considered [Scenario Representing Reason for Non-Selection] | ||
|---|---|---|---|---|
| 00 UTC 09 Jul (Storm 8) | 071606 [Early 36 h] | Storm 3 [4 members] | Storm 7 [inconsistent WMVM track] | Storm 9 [Caribbean FA] |
| 12 UTC 09 Jul (Storm 9) | 071612 [Early 30 h] | Storm 4 [cold-core system] | Storm 5 [Caribbean FA] | Storm 8 [Caribbean FA] |
| 00 UTC 10 Jul Missing | Missing single forecast [Consider using last available] | |||
| 12 UTC 10 Jul (Storm 9) | 071706 [Early 12 h] | Storm 5 [cold-core system] | Storm 8 [Caribbean FA] | Storm 11 [poor member track agreement] |
| 00 UTC 11 Jul (Storm 8) | 071712 [Early 6 h] | Storm 5 [inconsistent WCM evolution] | Storm 7 [inconsistent storm start position and timing] | Storm 14 [4 members] |
| 12 UTC 11 Jul (Storm 9) | 071712 [Early 6 h] | Storm 5 [5 members] | Storm 7 [inconsistent storm start position and timing] | Storm 10 [cold-core system] |
| 00 UTC 12 Jul (Storm 9) | 071712 [Early 6 h] | Storm 8 [4 members] | Storm 10 [inconsistent storm start position] | Storm 12 [4 members] |
| 12 UTC 12 Jul (Storm 7) | 071706 [Early 12 h] | Storm 5 [4 members] | Storm 9 [inconsistent storm start position] | Storm 13 [poor member track agreement] |
| 00 UTC 13 Jul Missing | Missing single forecast [Consider using last available] | |||
| 12 UTC 13 Jul (Storm 4) | 071712 [Early 6 h] | Storm 1 [inconsistent max WCM (low)] | Storm 6 [8 members] | Storm 7 [9 members] |
| 00 UTC 14 Jul (Storm 4) | 071706 [Early 12 h] | Storm 2 [4 members] | Storm 3 [7 members] | Storm 6 [inconsistent WCM evolution] |
| 12 UTC 14 Jul (Storm 2) | 071706 [Early 12 h] | Storm 4 [5 members] | Storm 6 [cold-core system] | Storm 8 [inconsistent storm start timing and position] |
| 00 UTC 15 Jul (Storm 1) | 071612 [Early 30 h] | Storm 2 [inconsistent WMVM track] | Storm 9 [cold-core system] | Storm 10 [8 members] |
| 12 UTC 15 Jul (Storm 2) | 071618 [Early 24 h] | Storm 1 [inconsistent WMVM track] | Storm 6 [inconsistent WMVM track] | Storm 8 [cold-core system] |
| 00 UTC 16 Jul (Storm 2) | 071618 [Early 24 h] | Storm 1 [inconsistent WMVM track] | Storm 6 [cold-core system] | Storm 8 [6 members] |
| 12 UTC 16 Jul (Storm 2) | 071618 [Early 24 h] | Storm 1 [inconsistent WMVM track] | Storm 3 [inconsistent storm start position] | Storm 4 [cold-core system] |
| 00 UTC 17 Jul (Storm 2) | 071706 [Early 12 h] | Storm 1 [inconsistent WMVM track] | Storm 4 [cold-core system] | Storm 6 [6 members] |
| 12 UTC 17 Jul (Storm 2) | 071718 [Exact time] | Storm 1 [inconsistent WMVM track] | Storm 4 [cold-core system] | Storm 5 [4 members] |
| 00 UTC 18 Jul (Storm 2) | Already a TS | |||
| ECEPS Initial Time [Selected Storm] | T2TS WCM (20) Timing [Error] | Alternate ECEPS Storm Options Considered [Scenario Representing Reason for Non-Selection] | ||
|---|---|---|---|---|
| 00 UTC 31 Jul (Storm 2) | 080306 [Early 72 h] | Storm 5 [5 members] | Storm 6 [8 members] | Storm 7 [4 members] |
| 12 UTC 31 Jul (Storm 2) | 080100 [Early 102 h] | Storm 3 [LSC TD] | Storm 4 [high initial position spread] | Storm 5 [high initial position spread] |
| 00 UTC 01 Aug Missing | Missing single forecast [Consider using last available] | |||
| 12 UTC 01 Aug (Storm 4) | 080312 [Early 42 h] | Storm 2 [inconsistent initial position] | Storm 3 [inconsistent WCM (high)] | Storm 5 [inconsistent initial position] |
| 00 UTC 02 Aug (Storm 2) | 080418 [Early 12 h] | Storm 1 [inconsistent WCM (high)] | Storm 3 [LSC TD] | Storm 4 [inconsistent initial position] |
| 12 UTC 02 Aug (Storm 2) | 080312 [Early 42 h] | Storm 3 [inconsistent initial position] | Storm 4 [inconsistent initial position] | Storm 6 [LSC TD] |
| 00 UTC 03 Aug (Storm 2) | 080506 [Exact time] | Storm 3 [cold-core system] | Storm 5 [inconsistent initial position] | Storm 6 [inconsistent initial position] |
| 12 UTC 03 Aug (Storm 2) | 080506 [Exact time] | Storm 1 [inconsistent WCM (high)] | Storm 3 [cold-core system] | Storm 4 [inconsistent initial position] |
| 00 UTC 04 Aug (Storm 2) | 080418 [Early 12 h] | Storm 1 [inconsistent initial position] | Storm 4 [inconsistent initial position] | Storm 7 [inconsistent initial position and timing] |
| 12 UTC 04 Aug (Storm 3) | 080418 [Early 12 h] | Storm 1 [inconsistent initial position] | Storm 2 [inconsistent WCM evolution] | Storm 4 [inconsistent initial position] |
| 00 UTC 05 Aug (Storm 3) | 080506 [Exact time] | Storm 2 [inconsistent WCM evolution] | Storm 4 [inconsistent initial position] | Storm 5 [inconsistent initial position] |
| 12 UTC 05 Aug (Storm 2) | Already a TS | |||
| ECEPS Initial Time | Initial Position | Maximum Members | ECEPS T2TS Timing | ECEPS T2TS Position | NHC 48 h Disturbance Chance (%) and Lat/Long | NHC 120 h Disturbance Chance (%) and Lat/Long |
|---|---|---|---|---|---|---|
| 00 UTC 25 Sep (Storm 4) | 12.3 N, 124.8 W | 9 | [Criteria not met] | [No disturbance associated] | ||
| 12 UTC 25 Sep (Storm 6) | 12.2 N, 121.0 W | 13 | ||||
| 00 UTC 26 Sep (Storm 3) | 11.2 N, 120.9 W | 15 | ||||
| 12 UTC 26 Sep (Storm 1) | 11.0 N, 121.7 W | 33 | ||||
| 00 UTC 27 Sep (Storm 3) | 11.1 N, 121.7 W | 27 | ||||
| 12 UTC 27 Sep (Storm 1) | 11.2 N, 121.5 W | 30 | ||||
| 00 UTC 28 Sep (Storm 1) | 11.5 N, 120.9 W | 21 | ||||
| 12 UTC 28 Sep (Storm 2) | 11.4 N, 122.5 W | 17 | ||||
| 00 UTC 29 Sep (Storm 1) | 11.1 N, 122.7 W | 23 | ||||
| 12 UTC 29 Sep (Storm 1) | 12.0 N, 125.8 W | 37 | 0 | 20 | ||
| 12 N, 125 W | ||||||
| 00 UTC 30 Sep (Storm 1) | 12.2 N, 127.6 W | 35 | 20 | 40 | ||
| 12.5 N, 128 W | ||||||
| 12 UTC 30 Sep (Storm 4) | 12.5 N, 129.1 W | 34 | 20 | 40 | ||
| 12.5 N, 128 W | ||||||
| 00 UTC 01 Oct (Storm 2) | 13.2 N, 129.9 W | 43 | 20 | 40 | ||
| 12.5 N, 128 W | ||||||
| 12 UTC 01 Oct (Storm 2) | 13.1 N, 131.2 W | 50 | 20 | 40 | ||
| 12.5 N, 129 W | ||||||
| 00 UTC 02 Oct (Storm 1) | 13.7 N, 131.8 W | 50 | 20 | 40 | ||
| 13 N, 132 W | ||||||
| 12 UTC 02 Oct (Storm 4) | 14.0 N, 132.1 W | 28 | 20 | 40 | ||
| 13 N, 132 W | ||||||
| 00 UTC 03 Oct (Storm 2) | 13.4 N, 134.1 W | 37 | 0 | 10 | ||
| 13 N, 133 W | ||||||
References
- Elsberry, R.L.; Tsai, H.-C.; Chin, W.-C.; Marchok, T.P. Opportunity for Tropical Cyclone Lifecycle Predictions from Pre-formation to Ending-stage: Eastern North Pacific 2021 Season. Atmosphere 2022, 13, 1008. [Google Scholar] [CrossRef]
- Elsberry, R.L.; Tsai, H.-C.; Chin, W.-C.; Marchok, T.P. Predicting Rapid Intensification Events Following Tropical Cyclone Formation in the Western North Pacific Based on ECMWF Ensemble Warm Core Evolutions. Atmosphere 2021, 12, 847. [Google Scholar] [CrossRef]
- Tsai, H.-C.; Elsberry, R.L.; Chin, W.-C.; Marchok, T.P. Opportunity for Early Warnings of Typhoon Lekima from Two Global Ensemble Model Forecasts of Formation with 7-Day Intensities along Medium-Range Tracks. Atmosphere 2020, 11, 1162. [Google Scholar] [CrossRef]
- Capalbo, C.A. Application of Tropical Cyclone Lifecycle Predictions from Pre-Formation Stage: Eastern North Pacific 2021 Season. Master’s Thesis, Naval Postgraduate School, Monterey, CA, USA, 2022. [Google Scholar]
- Marchok, T.P. Important factors in the tracking of tropical cyclones in operational models. J. Appl. Meteorol. Climatol. 2021, 60, 1265–1284. [Google Scholar] [CrossRef]
- Elsberry, R.L.; Tsai, H.C.; Jordan, M.S. Extended-range forecasts of Atlantic tropical cyclone events during 2012 using the ECMWF 32-day ensemble predictions. Weather Forecast. 2014, 29, 271–288. [Google Scholar] [CrossRef]
- Courtney, J.B.; Langlade, S.; Sampson, C.R.; Knaff, J.A.; Birchard, T.; Barlow, S.; Kotal, S.D.; Kriat, T.; Lee, W.; Pasch, R.; et al. Operational perspectives on tropical cyclone intensity change. Part 1: Recent advances in intensity guidance. Trop. Cyclone Res. Rev. 2019, 8, 123–133. [Google Scholar] [CrossRef]
- Latto, A. Hurricane Enrique; National Hurricane Center: Miami, FL, USA, 2021. Available online: https:www.nhc.noaa.gov/data/tcr/EP052021_Enrique.pdf (accessed on 31 January 2022).
- Cangialosi, J. Hurricane Felicia; National Hurricane Center: Miami, FL, USA, 2021. Available online: https:www.nhc.noaa.gov/data/tcr/EP062021_Felicia.pdf (accessed on 3 February 2022).
- Berg, R. Tropical Storm Guillermo; National Hurricane Center: Miami, FL, USA, 2021. Available online: https://www.nhc.noaa.gov/data/tcr/EP072021_Guillermo.pdf (accessed on 12 June 2022).
- Pasch, R. Tropical Storm Jinema; National Hurricane Center: Miami, FL, USA, 2021. Available online: https://www.nhc.noaa.gov/data/tcr/EP092021_Jimena.pdf (accessed on 12 June 2022).
- Tsai, H.-C.; Elsberry, R.L. Opportunities and challenges for extended-range predictions of tropical cyclone impacts on hydrological predictions. J. Hydrol. 2013, 506, 42–54. [Google Scholar] [CrossRef]
- Elsberry, R.L.; Jordan, M.S.; Vitart, F. Predictability of tropical cyclone events on intraseasonal timescales with ECMWF monthly forecast model. Asia-Pac. J. Atmos. Sci. 2010, 46, 135–153. [Google Scholar] [CrossRef] [Green Version]
- Elsberry, R.L.; Jordan, M.S.; Vitart, F. Evaluation of the ECMWF 32-day ensemble predictions during 2009 season of western North Pacific tropical cyclone events on intraseasonal timescales. Asia-Pac. J. Atmos. Sci. 2011, 47, 305–318. [Google Scholar] [CrossRef]
- Tsai, H.-C.; Elsberry, R.L. Seven-day intensity and intensity spread predictions for western North Pacific tropical cyclones. Asia-Pac. J. Atmos. Sci. 2015, 51, 331–342. [Google Scholar] [CrossRef]
- Tsai, H.-C.; Elsberry, R.L. Ending storm version of the 7-day weighted analog intensity prediction technique for western North Pacific tropical cyclones. Weather Forecast. 2017, 32, 2229–2235. [Google Scholar] [CrossRef]
- Tsai, H.-C.; Elsberry, R.L. Seven-day intensity and intensity spread predictions in bifurcation situations with guidance-on-guidance for western North Pacific tropical cyclones. Asia-Pac. J. Atmos. Sci. 2018, 54, 421–430. [Google Scholar] [CrossRef]
- Huang, C.-Y.; Chang, C.-H.; Kuo, H.-C. Exploring the Evolution of Typhoon Lekima (2019) Moving Offshore Northeast of Taiwan with a Multi-Resolution Global Model. Atmosphere 2022, 13, 1817. [Google Scholar] [CrossRef]
- Schreck, C.J.; Vitart, F.; Camargo, S.J.; Camp, J.; Darlow, J.; Elsberry, R.; Gottschalck, J.; Gregory, P.; Hansen, K.; Jackson, J.; et al. Recent advances in tropical cyclone prediction on subseasonal time scales. Trop. Cyclone Res. Rev. 2023, submitted.
- BoM. Bureau of Meteorology ACCESS-S Multi-Week Tropical Cyclone Cyclone Guidance. Available online: http://access-s.clide.cloud/files/guidance_documents/About_weekly_ACCESS-S_TC_forecasts_brief.pdf (accessed on 19 March 2022).


| ECEPS Initial Time (Selected Storm) | T2TS Timing [Error] | Alternate ECEPS Storm Options Considered [Scenario Representing Reason for Non-Selection] | ||
|---|---|---|---|---|
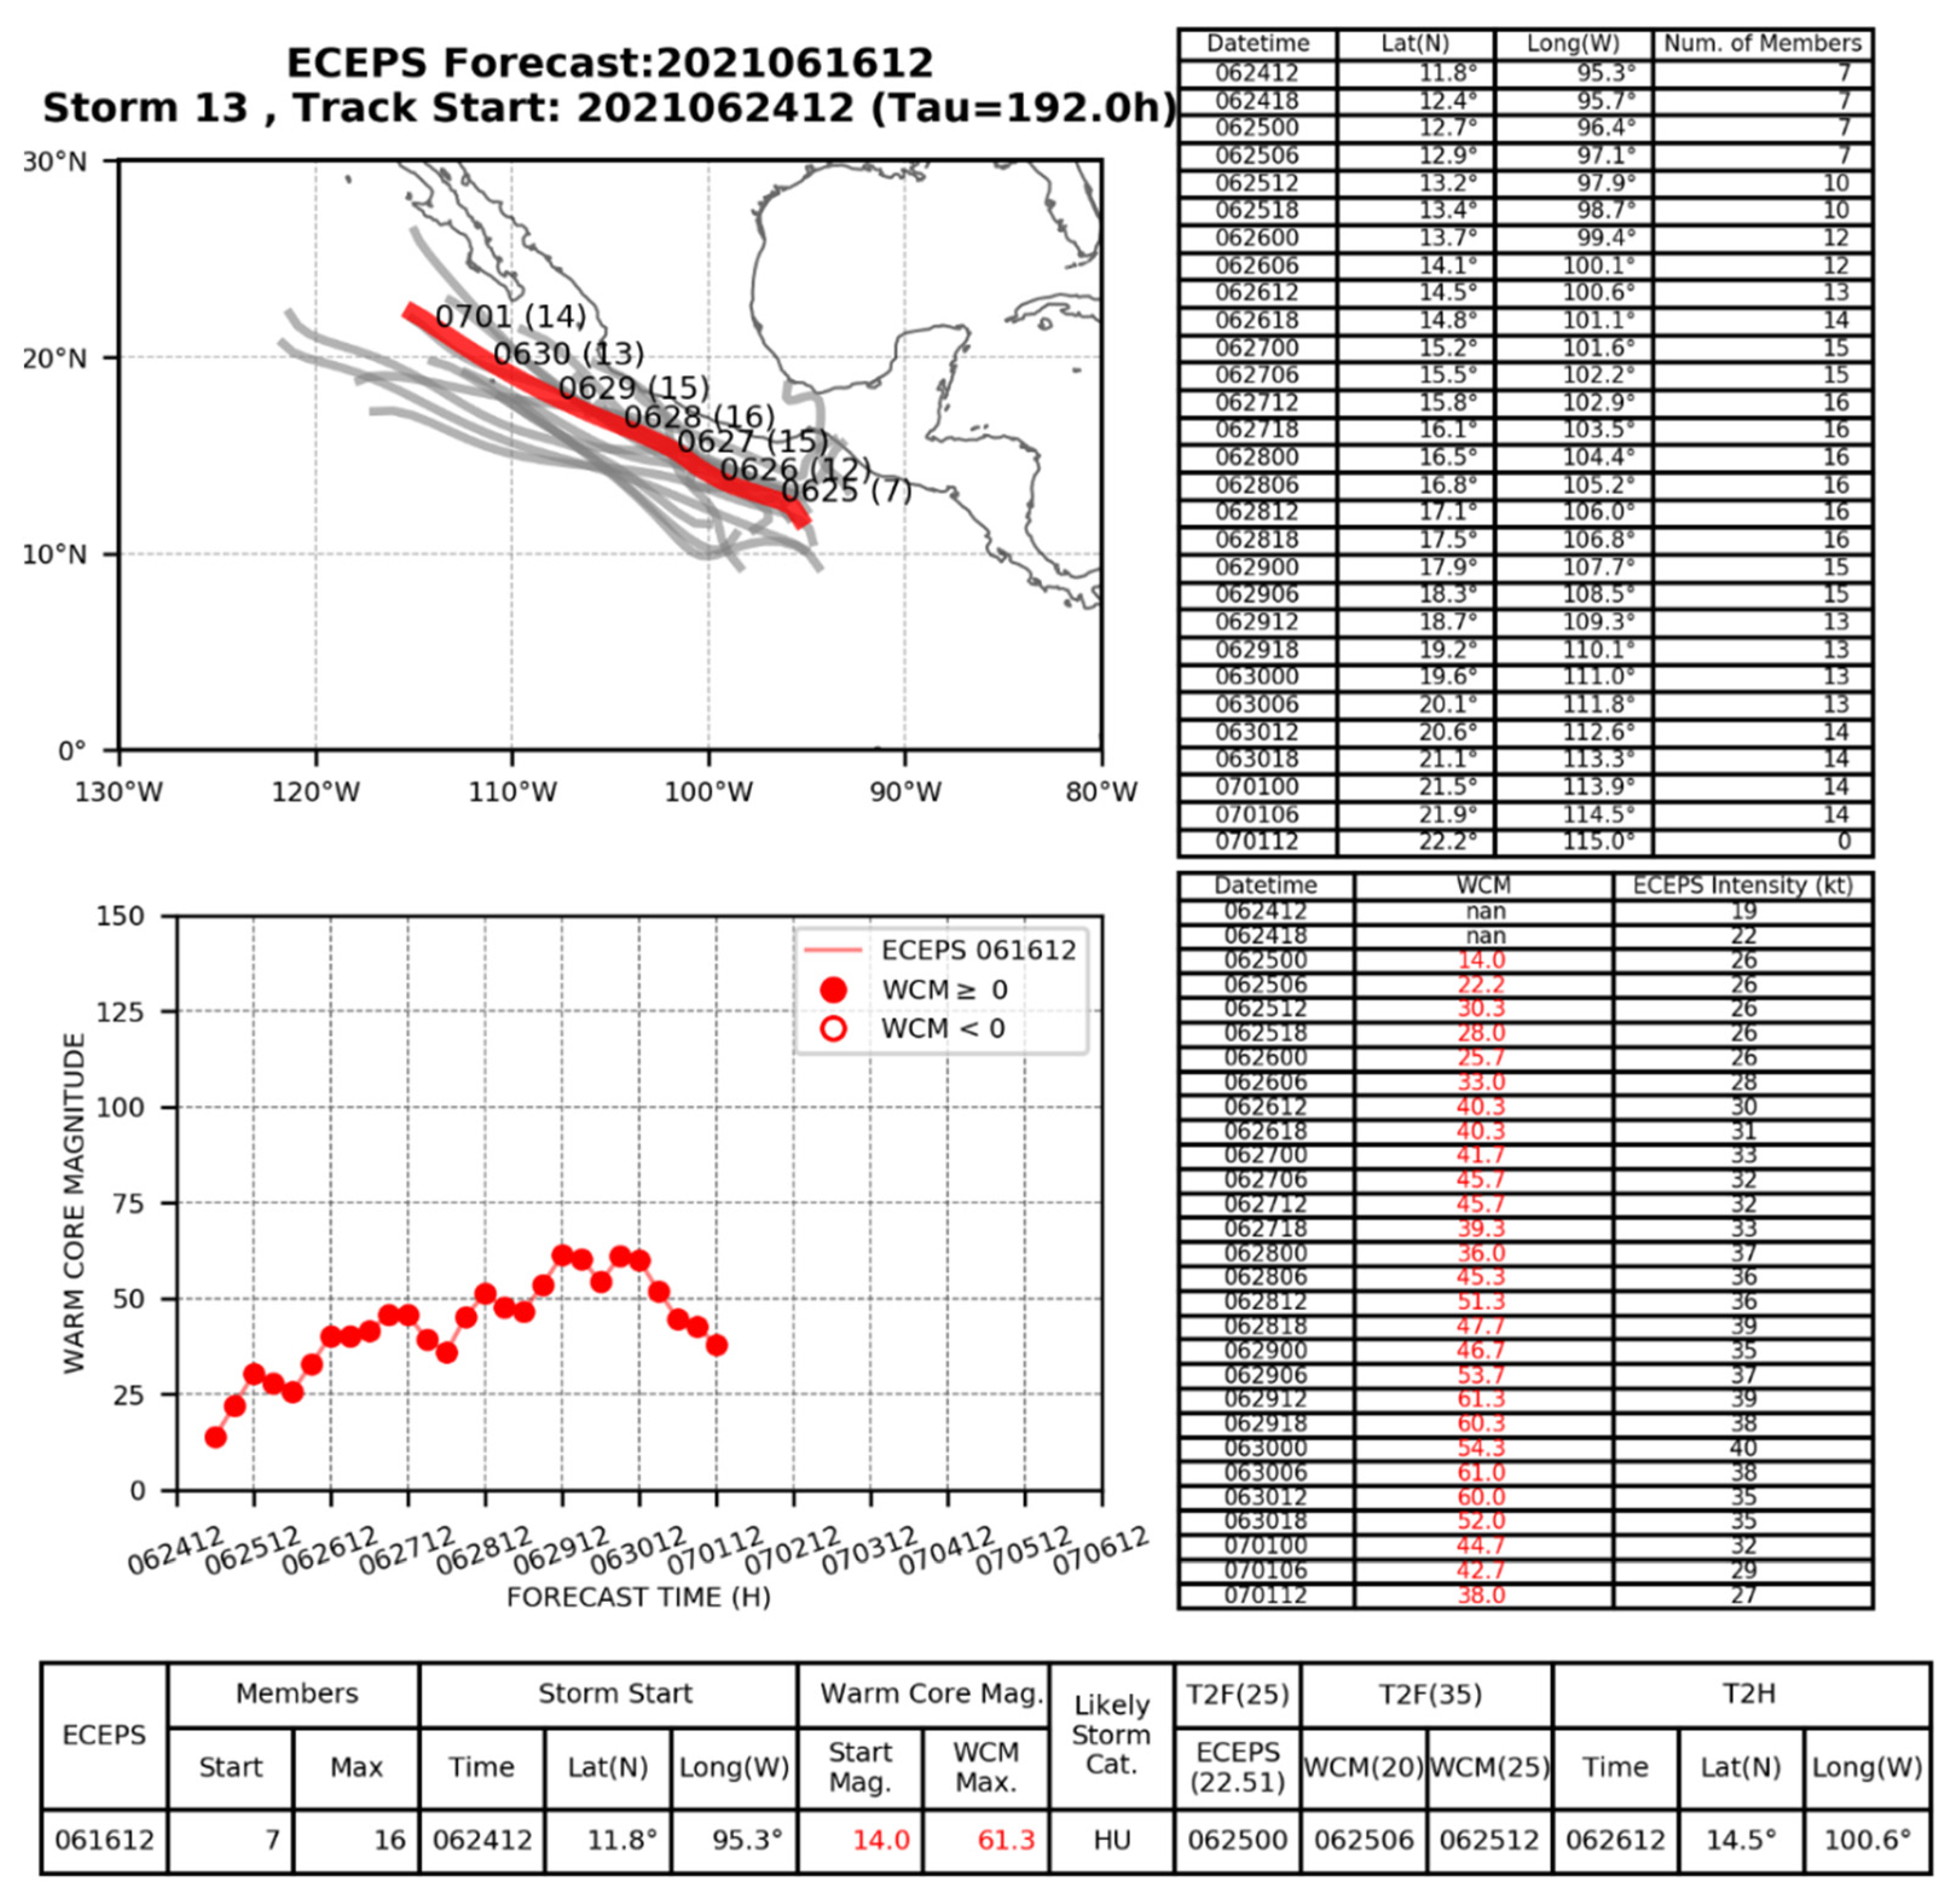
| 12 UTC 16 Jun (Storm 13) | 062512 [Late 6 h] | Storm 9 [cold-core system] | Storm 11 [8 members] | Storm 12 [Caribbean FA] |
| Hurricane | Detection in Forecast in Advance of T2TS | Detection in Forecast in Advance of T2HU | ||
|---|---|---|---|---|
| NHC Advisory | ECEPS | NHC Advisory | ECEPS | |
| Enrique (05E) | 0 h | 8 days, 18 h | 1 day | 9 days, 18 h |
| Felicia (06E) | 0 h | 12 days | 1 day | 12 days, 18 h |
| Hilda (08E) | 0 h | 8 days, 6 h | 1 day, 3 h | 9 days, 9 h |
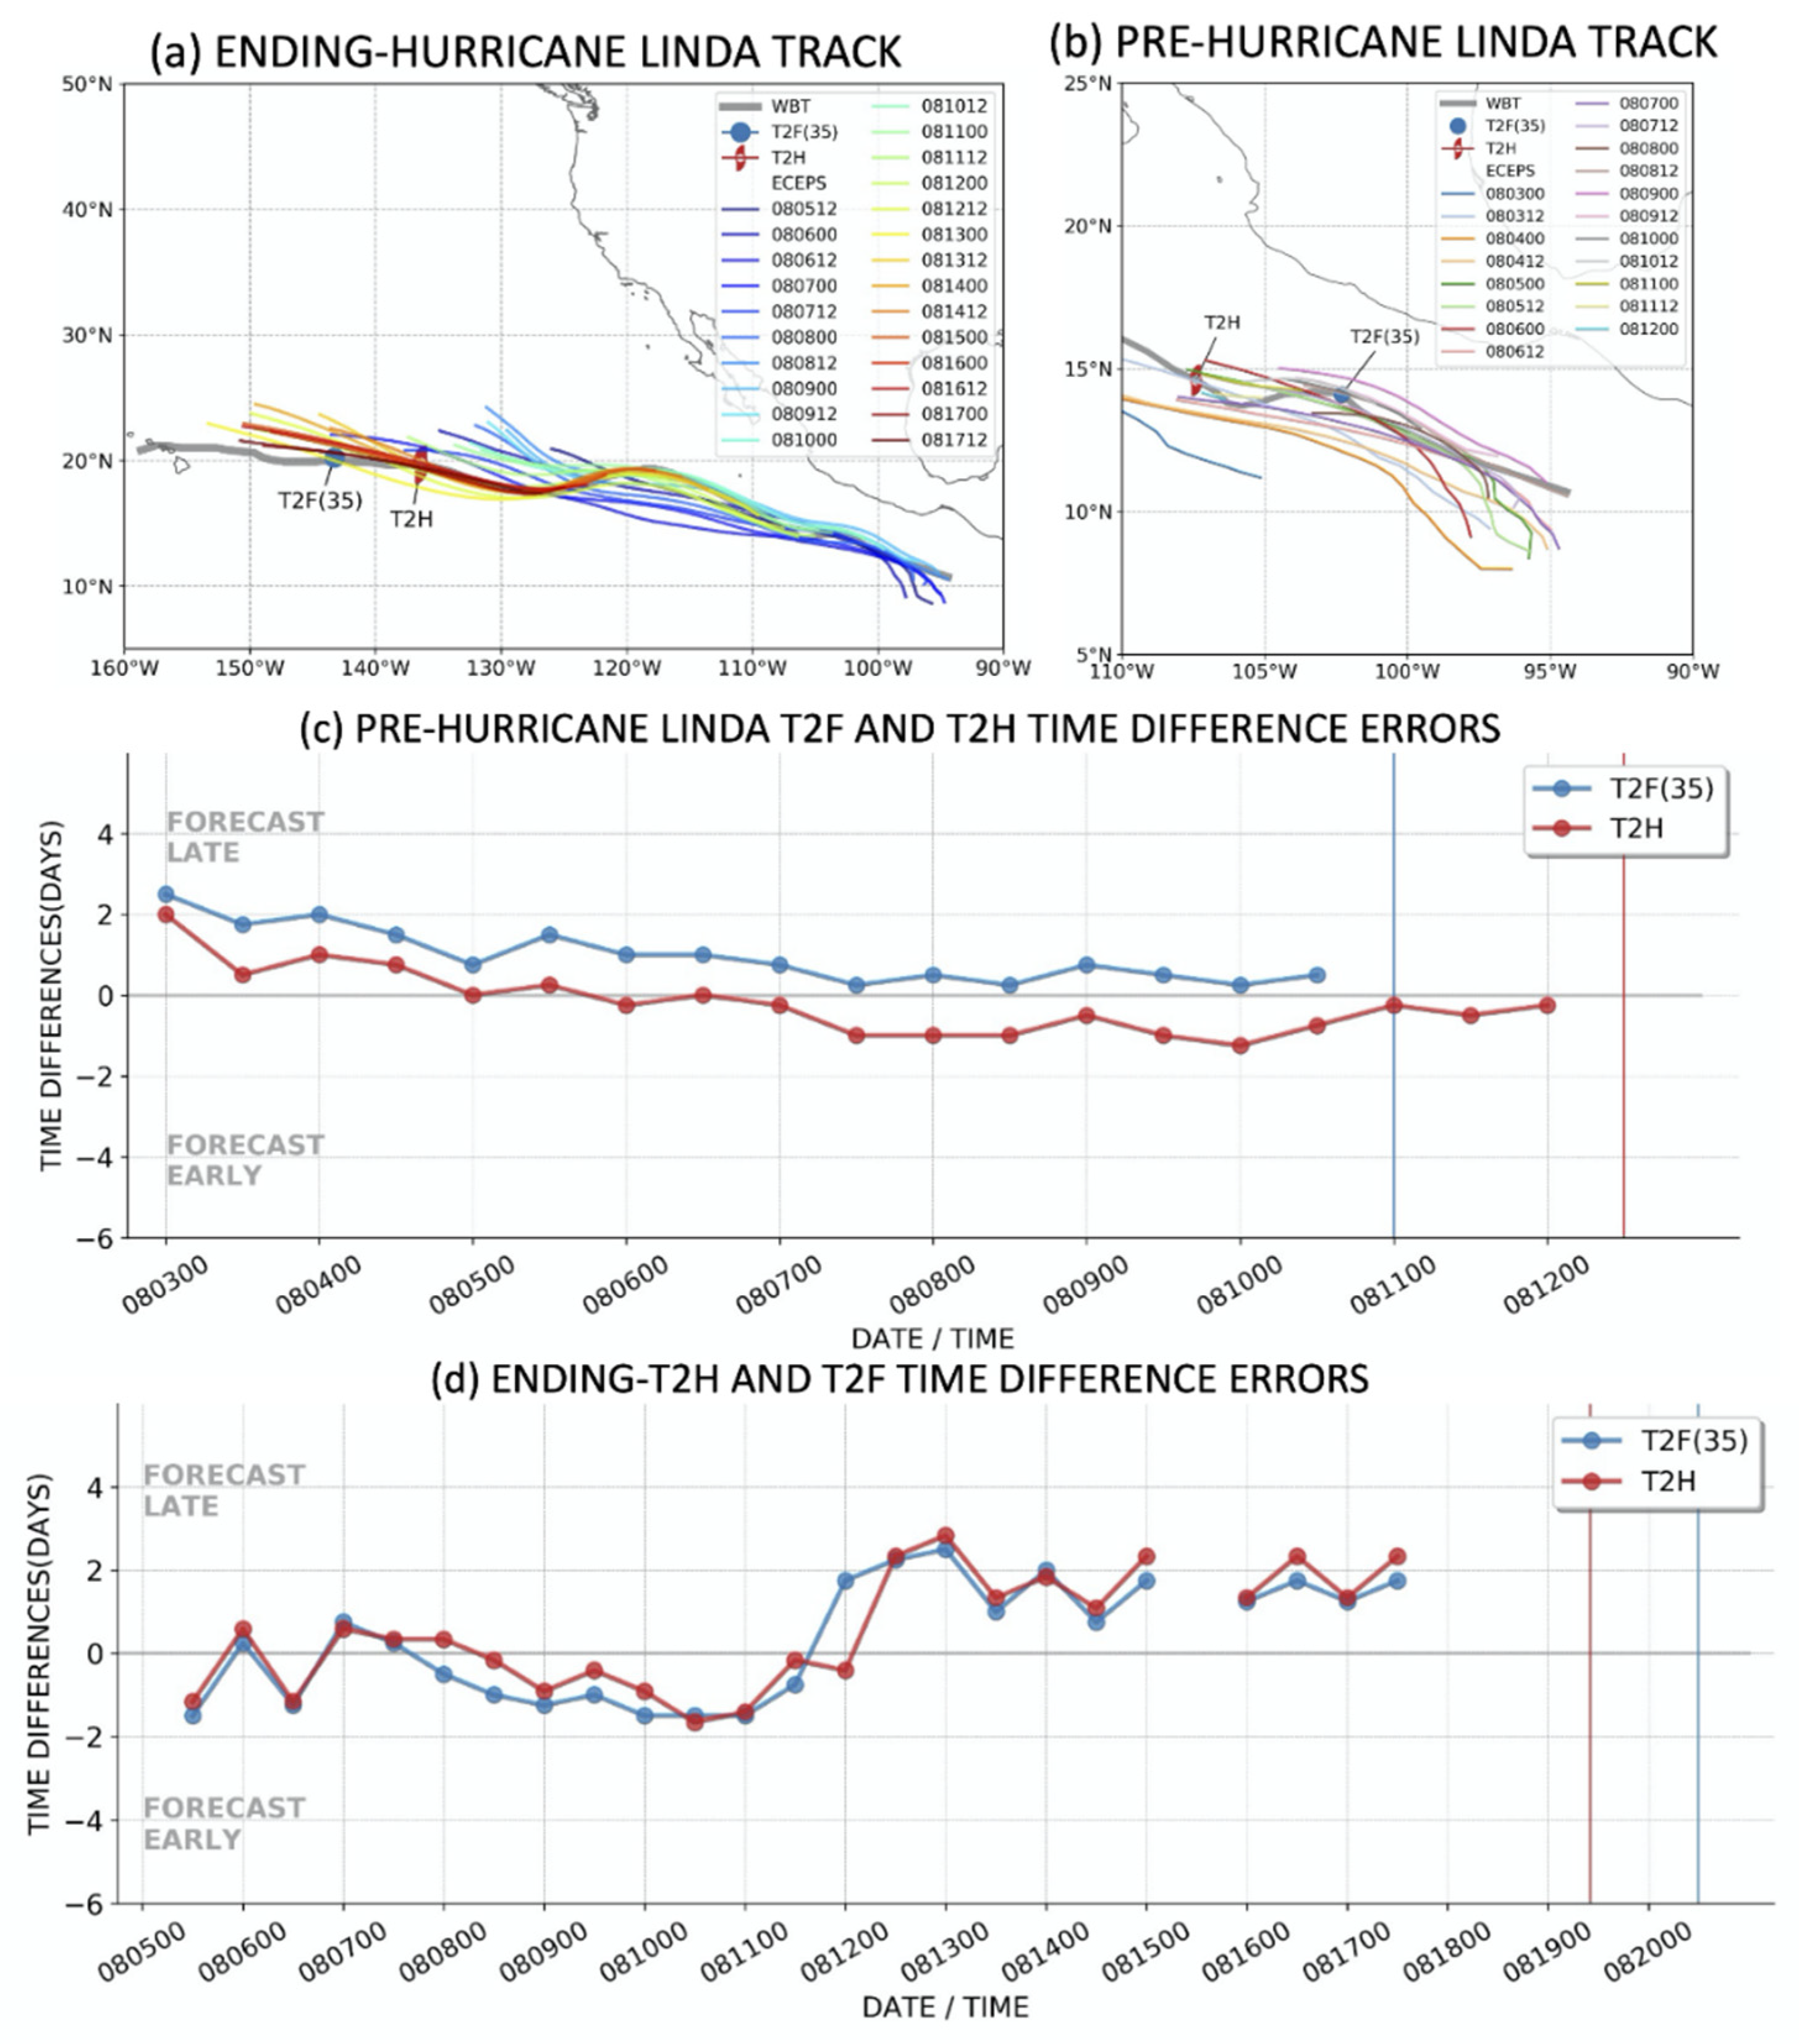
| Linda (12E) | 12 h | 7 days, 18 h | 1 day, 18 h | 9 days, 12 h |
| Nora (14E) | 18 h | 9 days | 1 day, 18 h | 10 days, 18 h |
| Olaf (15E) | 18 h | 12 days, 12 h | 1 day | 13 days, 12 h |
| Pamela (16E) | 6 h | 5 days, 18 h | 1 day, 12 h | 7 days, 6 h |
| Rick (17E) | 6 h | 6 days, 6 h | 18 h | 7 days, 2 h |
| Tropical Storm | Detection in Forecast in Advance of T2F (35) | |
|---|---|---|
| NHC Advisory | ECEPS | |
| Andres (01E) | 6 h | 8 days, 12 h |
| Blanca (02E) | 1 day | 6 days, 6 h |
| Carlos (03E) | 6 h | 3 days, 12 h |
| Dolores (04E) | 6 h | 6 days, 12 h |
| Guillermo (07E) | 6 h | 8 days, 18 h |
| Jimena (09E) | 5 days, 12 h | 5 days, 6 h |
| Ignacio (10E) | 18 h | 8 days, 12 h |
| Kevin (11E) | 6 h | 8 days, 6 h |
| Marty (13E) | Not evaluated—remnants of Hurricane Grace in Atlantic basin | |
| Terry (18E) | 3 days, 6 h | 2 days, 6 h |
| Sandra (19E) | 6 h | 9 days, 18 h |
Disclaimer/Publisher’s Note: The statements, opinions and data contained in all publications are solely those of the individual author(s) and contributor(s) and not of MDPI and/or the editor(s). MDPI and/or the editor(s) disclaim responsibility for any injury to people or property resulting from any ideas, methods, instructions or products referred to in the content. |
© 2023 by the authors. Licensee MDPI, Basel, Switzerland. This article is an open access article distributed under the terms and conditions of the Creative Commons Attribution (CC BY) license (https://creativecommons.org/licenses/by/4.0/).
Share and Cite
Elsberry, R.L.; Tsai, H.-C.; Capalbo, C.; Chin, W.-C.; Marchok, T.P. Critical Pre-Formation Decision Flowchart to Apply Tropical Cyclone Lifecycle Predictions in Eastern North Pacific. Atmosphere 2023, 14, 616. https://0-doi-org.brum.beds.ac.uk/10.3390/atmos14040616
Elsberry RL, Tsai H-C, Capalbo C, Chin W-C, Marchok TP. Critical Pre-Formation Decision Flowchart to Apply Tropical Cyclone Lifecycle Predictions in Eastern North Pacific. Atmosphere. 2023; 14(4):616. https://0-doi-org.brum.beds.ac.uk/10.3390/atmos14040616
Chicago/Turabian StyleElsberry, Russell L., Hsiao-Chung Tsai, Corie Capalbo, Wei-Chia Chin, and Timothy P. Marchok. 2023. "Critical Pre-Formation Decision Flowchart to Apply Tropical Cyclone Lifecycle Predictions in Eastern North Pacific" Atmosphere 14, no. 4: 616. https://0-doi-org.brum.beds.ac.uk/10.3390/atmos14040616