Article

Effect of Nearby Forest Fires on Ground Level Ozone Concentrations in Santiago, Chile

1
Facultad de Quimica y Biologia, Universidad Santiago de Chile, USACH, Av. L. B. O’Higgins 3363, Santiago 9160000, Chile
2
Centro Para el Desarrollo de la Nanociencia y Nanotecnología (CEDENNA-USACH), Santiago 9160000, Chile
3
Facultad de Ciencia, Depto Física, Universidad Santiago de Chile, USACH, Santiago 9160000, Chile
4
Center for Climate and Resilience Research and Department of Geophysics, Universidad de Chile, Santiago 8320000, Chile
*
Author to whom correspondence should be addressed.
Atmosphere 2015, 6(12), 1926-1938; https://0-doi-org.brum.beds.ac.uk/10.3390/atmos6121838
Submission received: 15 October 2015 / Revised: 4 December 2015 / Accepted: 8 December 2015 / Published: 17 December 2015
(This article belongs to the Special Issue Atmospheric Composition Observations)

Abstract

:
On 4 and 8 January 2014, at the height of the austral summer, intense wildfires in forests and dry pastures occurred in the Melipilla sector, located about 70 km to the southwest of Santiago, the Chilean capital, affecting more than 6 million inhabitants. Low level winds transported the forest fire plume towards Santiago causing a striking decrease in visibility and a marked increase in the concentration of both primary (PM10 and CO) and secondary (Ozone) pollutants in the urban atmosphere. In particular, ozone maximum concentrations in the Santiago basin reached hourly averages well above 80 ppb, the national air quality standard. This ozone increase took place at the three sampling sites considered in the present study. These large values can be explained in terms of high NOx concentrations and NO2/NO ratios in biomass burning emissions.

1. Introduction

Air plumes originating in forest fires are rich in primary pollutants such as particles, carbon monoxide (CO), non-methane volatile organic compounds (VOCs), and nitrogen oxides (NOx) [1,2,3] Photochemical transformations of those air masses can produce secondary pollutants, including ozone [4], that are transported over large distances [1,3,5,6,7,8,9]. These plumes can also affect nearby cities leading to ground level concentrations that largely surpass air quality standards [8,10,11]. Nevertheless, there are few evaluations regarding ozone behavior in large cities exposed to polluted masses transported from nearby forest fires [3,8,11,12] Results range from moderate decreases at Arizona and Central Texas, US, and western Mexico, when the cities are located less than 400 km from fire [12], to large increases as in the city of Edmonton, Canada, when the city is located 300 km from the fire [11]. On the other hand, measurements in Mexico City (MCMA) did not demonstrate significant differences in ground level ozone concentrations in periods with active fires [13]. Evaluation of the effect of nearby wild fires on the concentration of pollutants in the air at ground level of large cities is particularly complex due to the mixing of local emissions with the fire derived polluted plumes [14]. Interestingly, it has been reported that in western U.S, the ozone was significantly correlated with forest fires in the surrounding 5° × 5° and 10° × 10° grids, but not with wild fires in the nearest 1° × 1° region (110 × 110 km, approximately), reflecting a subtle balance between ozone production and destruction in NOx rich environments [15].
Santiago, the Chilean capital, is a large city (with just over 6 million inhabitants, accounting for 40% of the national population with a density of 393 inhabitants per km2) located at a subtropical latitude (33°S), about 100 km from the Pacific coast and just to the east of the Andes cordillera (Figure 1). It features a semi-arid climate with annual mean precipitation of 310 mm, almost exclusively concentrated in winter months [16]. During the dry summer months (November to March), the city is exposed to relatively high concentrations of secondary oxidants [17,18], particularly in its east side where 35% of the summer days surpassed the ozone national safety standard of 60 ppbv for an 8 h mobile running average or 80 ppbv for one hour [19,20].
Figure 1. Topographic map of central Chile. Gray shading in m ASL; also indicated the 300, 1200 and 2400 m above sea level (ASL) topographic contours (black lines). Yellow lines outline main cities, red dots indicate the location of the MACAM (Air Quality Monitoring Program in Santiago Metropolitan Area) stations Cerrillos, Parque O’Higgins and Las Condes. The blue thick arrow indicates the predominant low-level winds from the SW during summer afternoon (adapted from [21], see also Figure 3).
Atmosphere 06 01838 g001
During 4 and 8 January 2014, two sizable forest fires took place in the Melipilla sector located about 70 km from downtown Santiago. These fires covered approximately 15 km2 of a Mediterranean landscape characterized by a mixture of pasture, open woodland and shrubland, including some Eucalyptus and Acacia caven trees [22,23]. The dominant vegetation and the changes introduced in recent years have been discussed by Schulz et al [23]. The pre-Columbian vegetation of Central Chile is dominated by pastures and Acacia caven shrubland that have been replaced by vineyard and exotic trees such Pinus radiata and Eucalyptus globulus. These fires produced a noticeable increase in visible particles in the urban atmosphere of Santiago. In this short contribution, we present a critical discussion of ozone and other pollutants’ behavior during those days. Given the possible effect of the large amounts of oxidants in the urban air on Santiago’s inhabitants [24,25,26], we analyze the ozone concentrations and discuss the possible reasons for the extremely high values found in different areas of Santiago’s basin.

2. Observations and Methods

Meteorological data (air temperature, relative humidity, incoming solar radiation and wind direction and speed) in the central part of Santiago (near downtown) was obtained from two automatic weather stations (USACH and DGF-UCh) recording 15 min averages. Station USACH (33.45°S, 70.68°W, 528 m. above sea level (ASL)) is a Novalynx Corp. Station, model 110-WS-16. Station DGF-UCh (33.46°S, 70.66°W, 542 m. ASL) includes a standard Campbell Scientific AWS and a laser ceilometer (model VAISALA CL-31) retrieving backscatter reflectivity profiles from the surface up to 6 km above ground level every 30 s. The laser reflectivity has been related with the aerosol loading in the mixed layer [27]. One-minute average wind speed and wind direction at 10 m above the ground were also available from station El Paico (33.72°S, 71.02°W, 312 m. ASL), operated by the National Weather Service (DMC). Station El Paico is located in the Maipo valley connecting the Melipilla sector (where the fires took place) with Santiago.
Ozone, NO2, NO, PM10, PM2.5 and CO concentrations at ground level were obtained from the Air Quality Monitoring Program in Santiago Metropolitan Area (MACAM-2) operated by the Environmental Ministry (SINCA, 2014) [28]. Specifically, hourly average values were gathered from three sampling stations located in Santiago (Figure 1): Cerrillos (CERR) in the west side of the city, (33.49°S; 70.71°W; 528 m. ASL); Parque O’Higgins (POH) in downtown (33.46°S, 70.66°W, 562 m. ASL) and Las Condes (LC) at the North East side of the city (33.37°S, 70.52°W; 811 m. ASL). The map in Figure 1 also shows the location of Melipilla, the small town around which the forest fires took place in January 2014.
In all the stations, ozone was measured using a Thermo UV-Photometric ozone analyzer, model 49i (measuring range: 0–0.5 ppm). NO-NO2-NOX were measured using a Thermo chemiluminsescent gas analyzer, model 42i (measuring range 0.05–100 ppm with a detection limit of 0.40 ppb). CO was analyzed using a Thermo CO Analyzer, model 40i (measuring range 0–50 mg/m3 with a detection limit of 4.0 ppm). PM10 was measured using a PM10 Monitor TEOM 1405 (measuring range of 0–1,000,000 μg/m3. PM2.5 was measured using a MET-ONE BAM-1020 monitor (measuring range of 0.1–10 μg/m3, with a detection limit ≤1.0 μg/m3.

3. Results and Discussion

3.1. Meteorological Aspects

Ground level concentrations of primary and secondary pollutants in the proximity of wildfires strongly depend on the direction and intensity of the low-level flow. As evident in the satellite imageries given in Figure 2, the forest fires in the Melipilla sector released a considerable amount of pollutants (ash, particulate matter, gasses) that were transported to Santiago by the southwesterly low-level flow that regularly develops during the afternoon in summer months (Figure 3) [21]. On both 4 and 8 January 2014, the near-surface wind speed at El Paico reached about 10 m/s by noon (not shown). Thus, the fire plume that originated during the morning hours took less than 3 h to reach the city of Santiago, located about 70 km upwind of the Melipilla sector. The arrival of the polluted plume produced a striking reduction in visibility, readily evident for the general population (especially for the case of 4 January), as illustrated by the time-height diagram of the backscatter reflectivity from the laser ceilometer at DGF-UCh (Figure 4). The reflectivity, indicative of the aerosol loading in the mixed layer [27], exhibits a sharp increase around 2 PM, 4 January, encompassing the first 500 m above ground level. The marked increase in aerosol loading was accompanied by a simultaneous stalling of the air temperature (that often maximize around 4 PM) and a reduction of the global solar radiation relative to the previous day (when very similar synoptic conditions prevailed), which integrated over the course of the afternoon represents a deficit of about 15% of the insolation for a typical clear sky day in Santiago.
Figure 2. Corrected reflectance (True Color) scenes from MODIS for 4 and 8 January 2014, over central Chile (same region as in Figure 1). The plume of the forest fires in the Melipilla sector (red circle) reaching Santiago (yellow polygon) is evident in all the images. The left column shows images from the AQUA satellite at about 11 a.m., the right column shows images from the TERRA satellite at about 3 p.m.
Atmosphere 06 01838 g002
Figure 3. (a) Wind speed and wind in days with active fires (▪ January 8; ● January 4; and days without fires ∆; (b) Wind rose for 4 January, 14:00–24:00.
Atmosphere 06 01838 g003
Figure 4. Upper panel: Time-height diagram of the backscatter reflectivity from a laser ceilometer (VAISALA CL-31) located at Santiago downtown during 4 January 2014 (active fire). The reflectivity has been related with the aerosol loading in the mixed layer [27] which is qualitatively indicated here from low to high. Middle panel: Air temperature 4 January (solid red line) and the previous day (3 January, blue line). Lower panel: Global solar radiation reaching the surface at Santiago for 3 January (blue line) and 4 January (red line).
Atmosphere 06 01838 g004

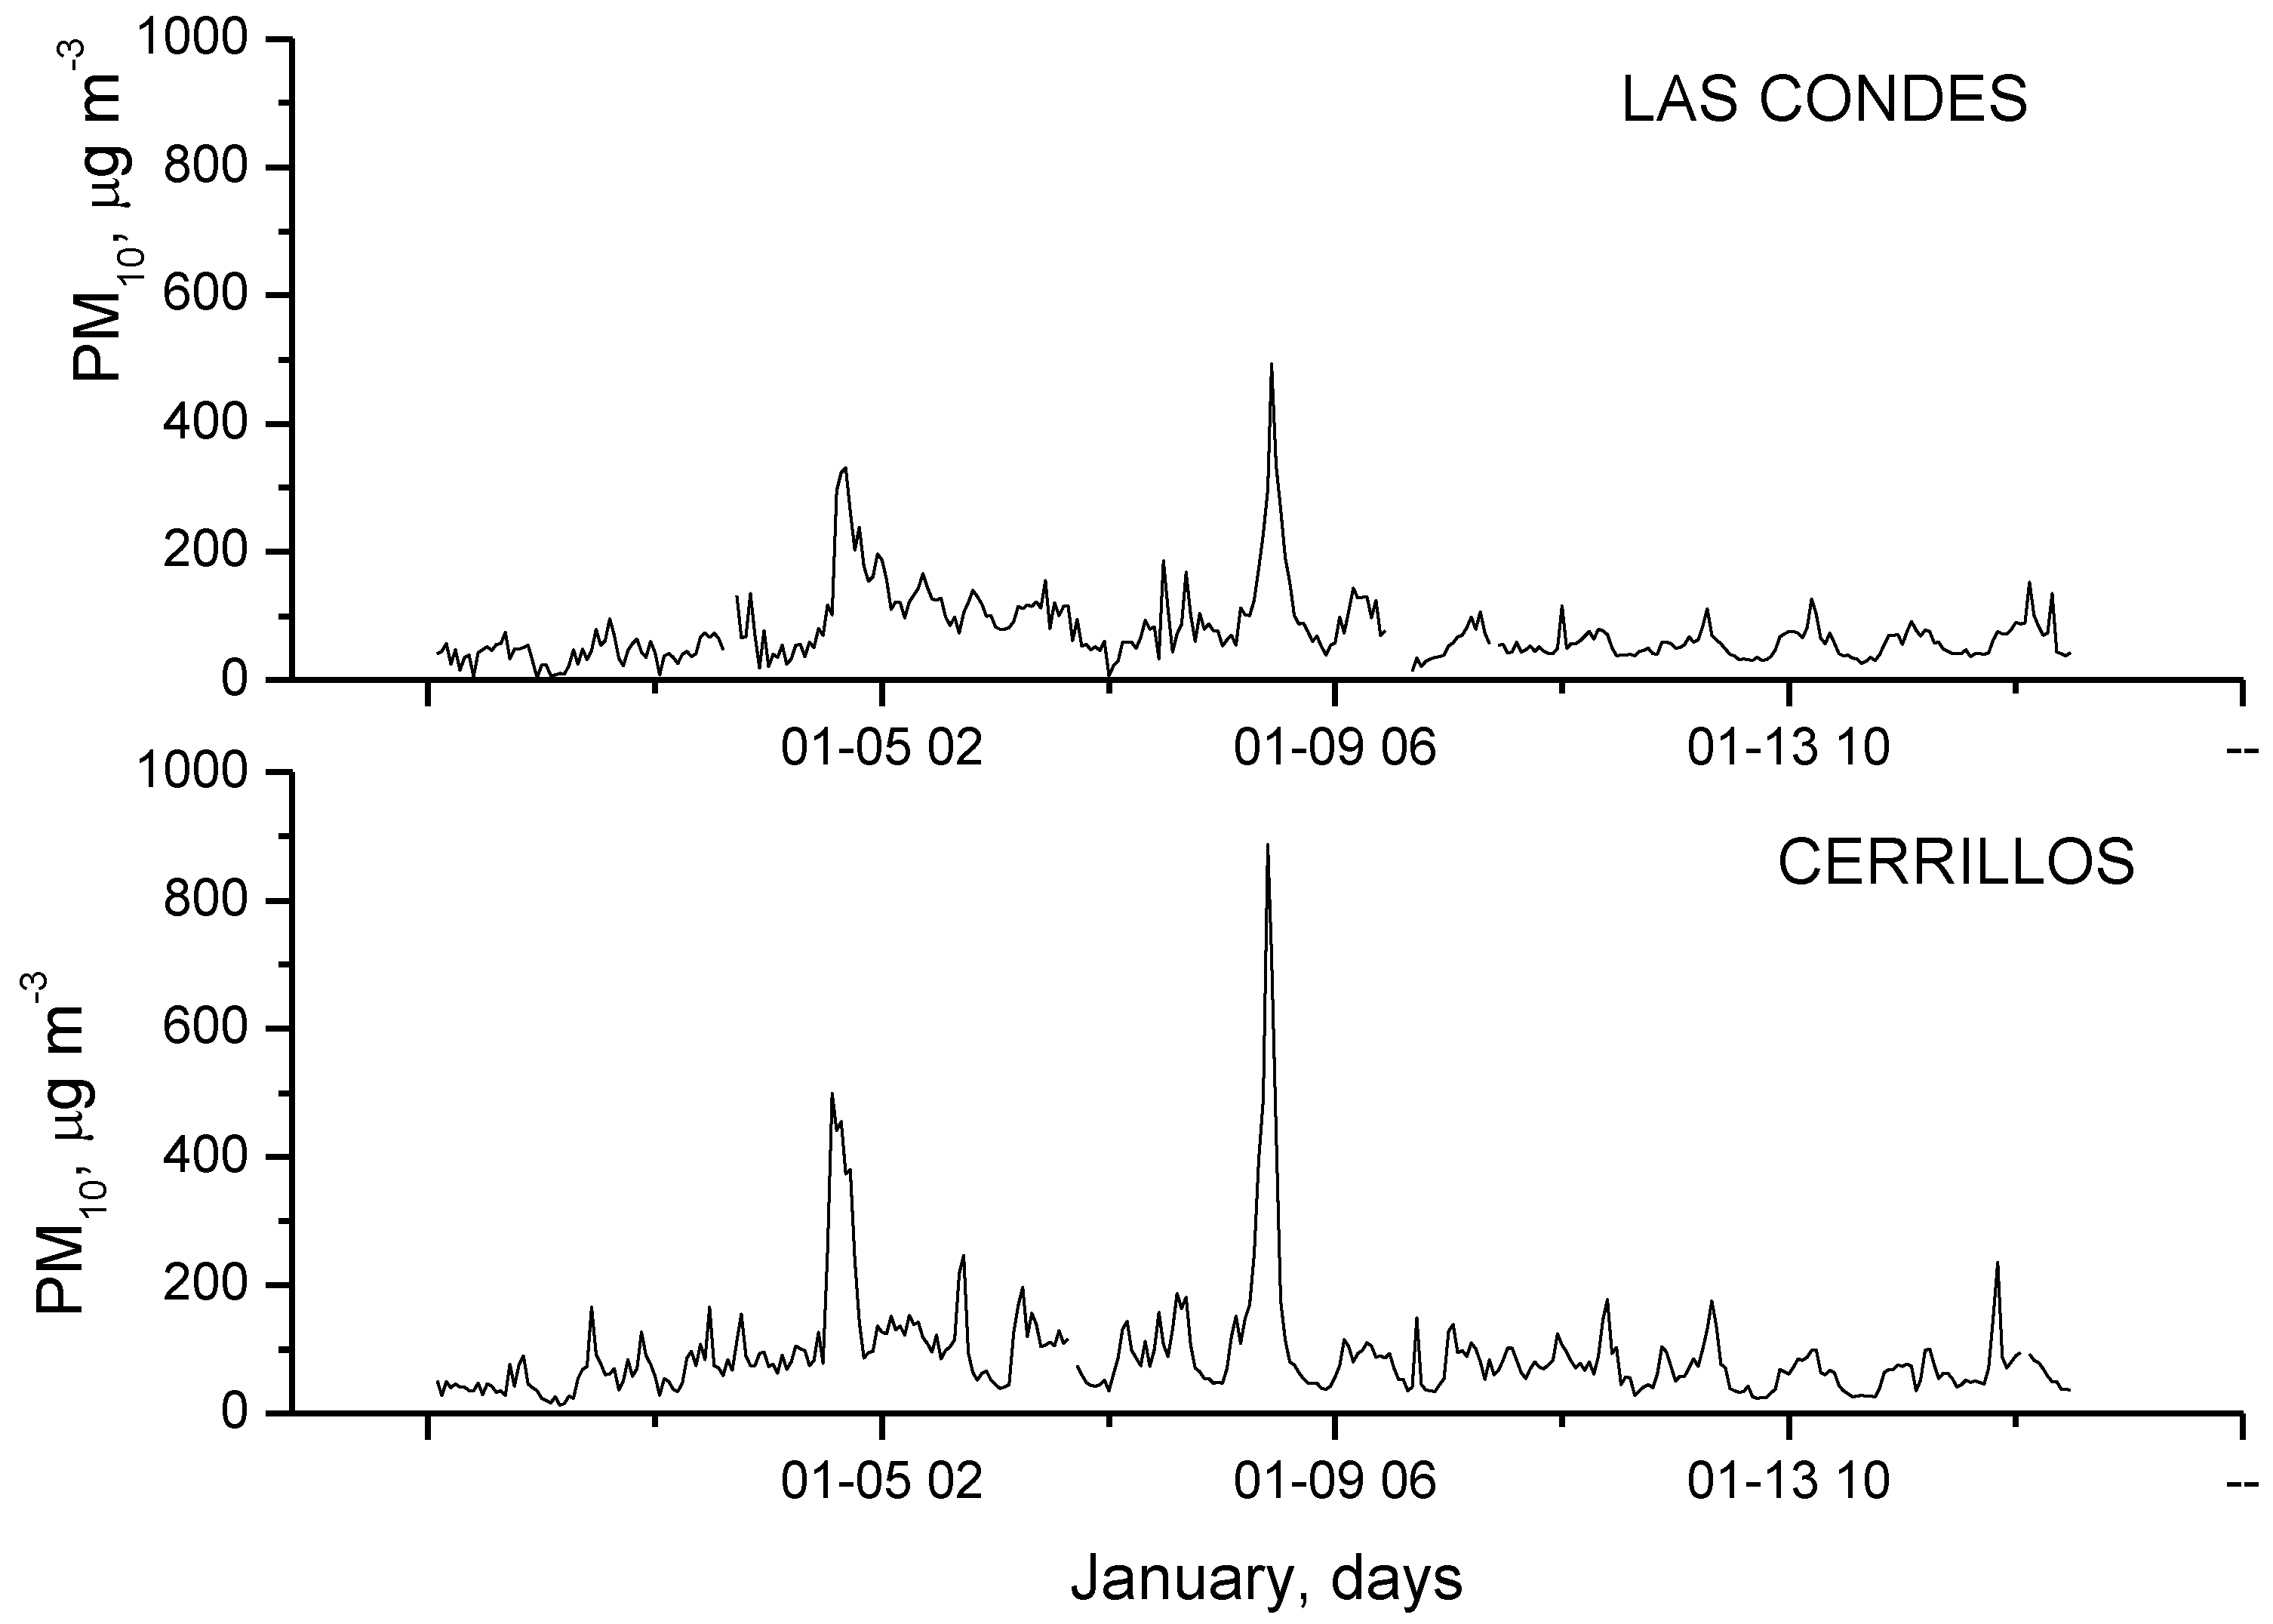
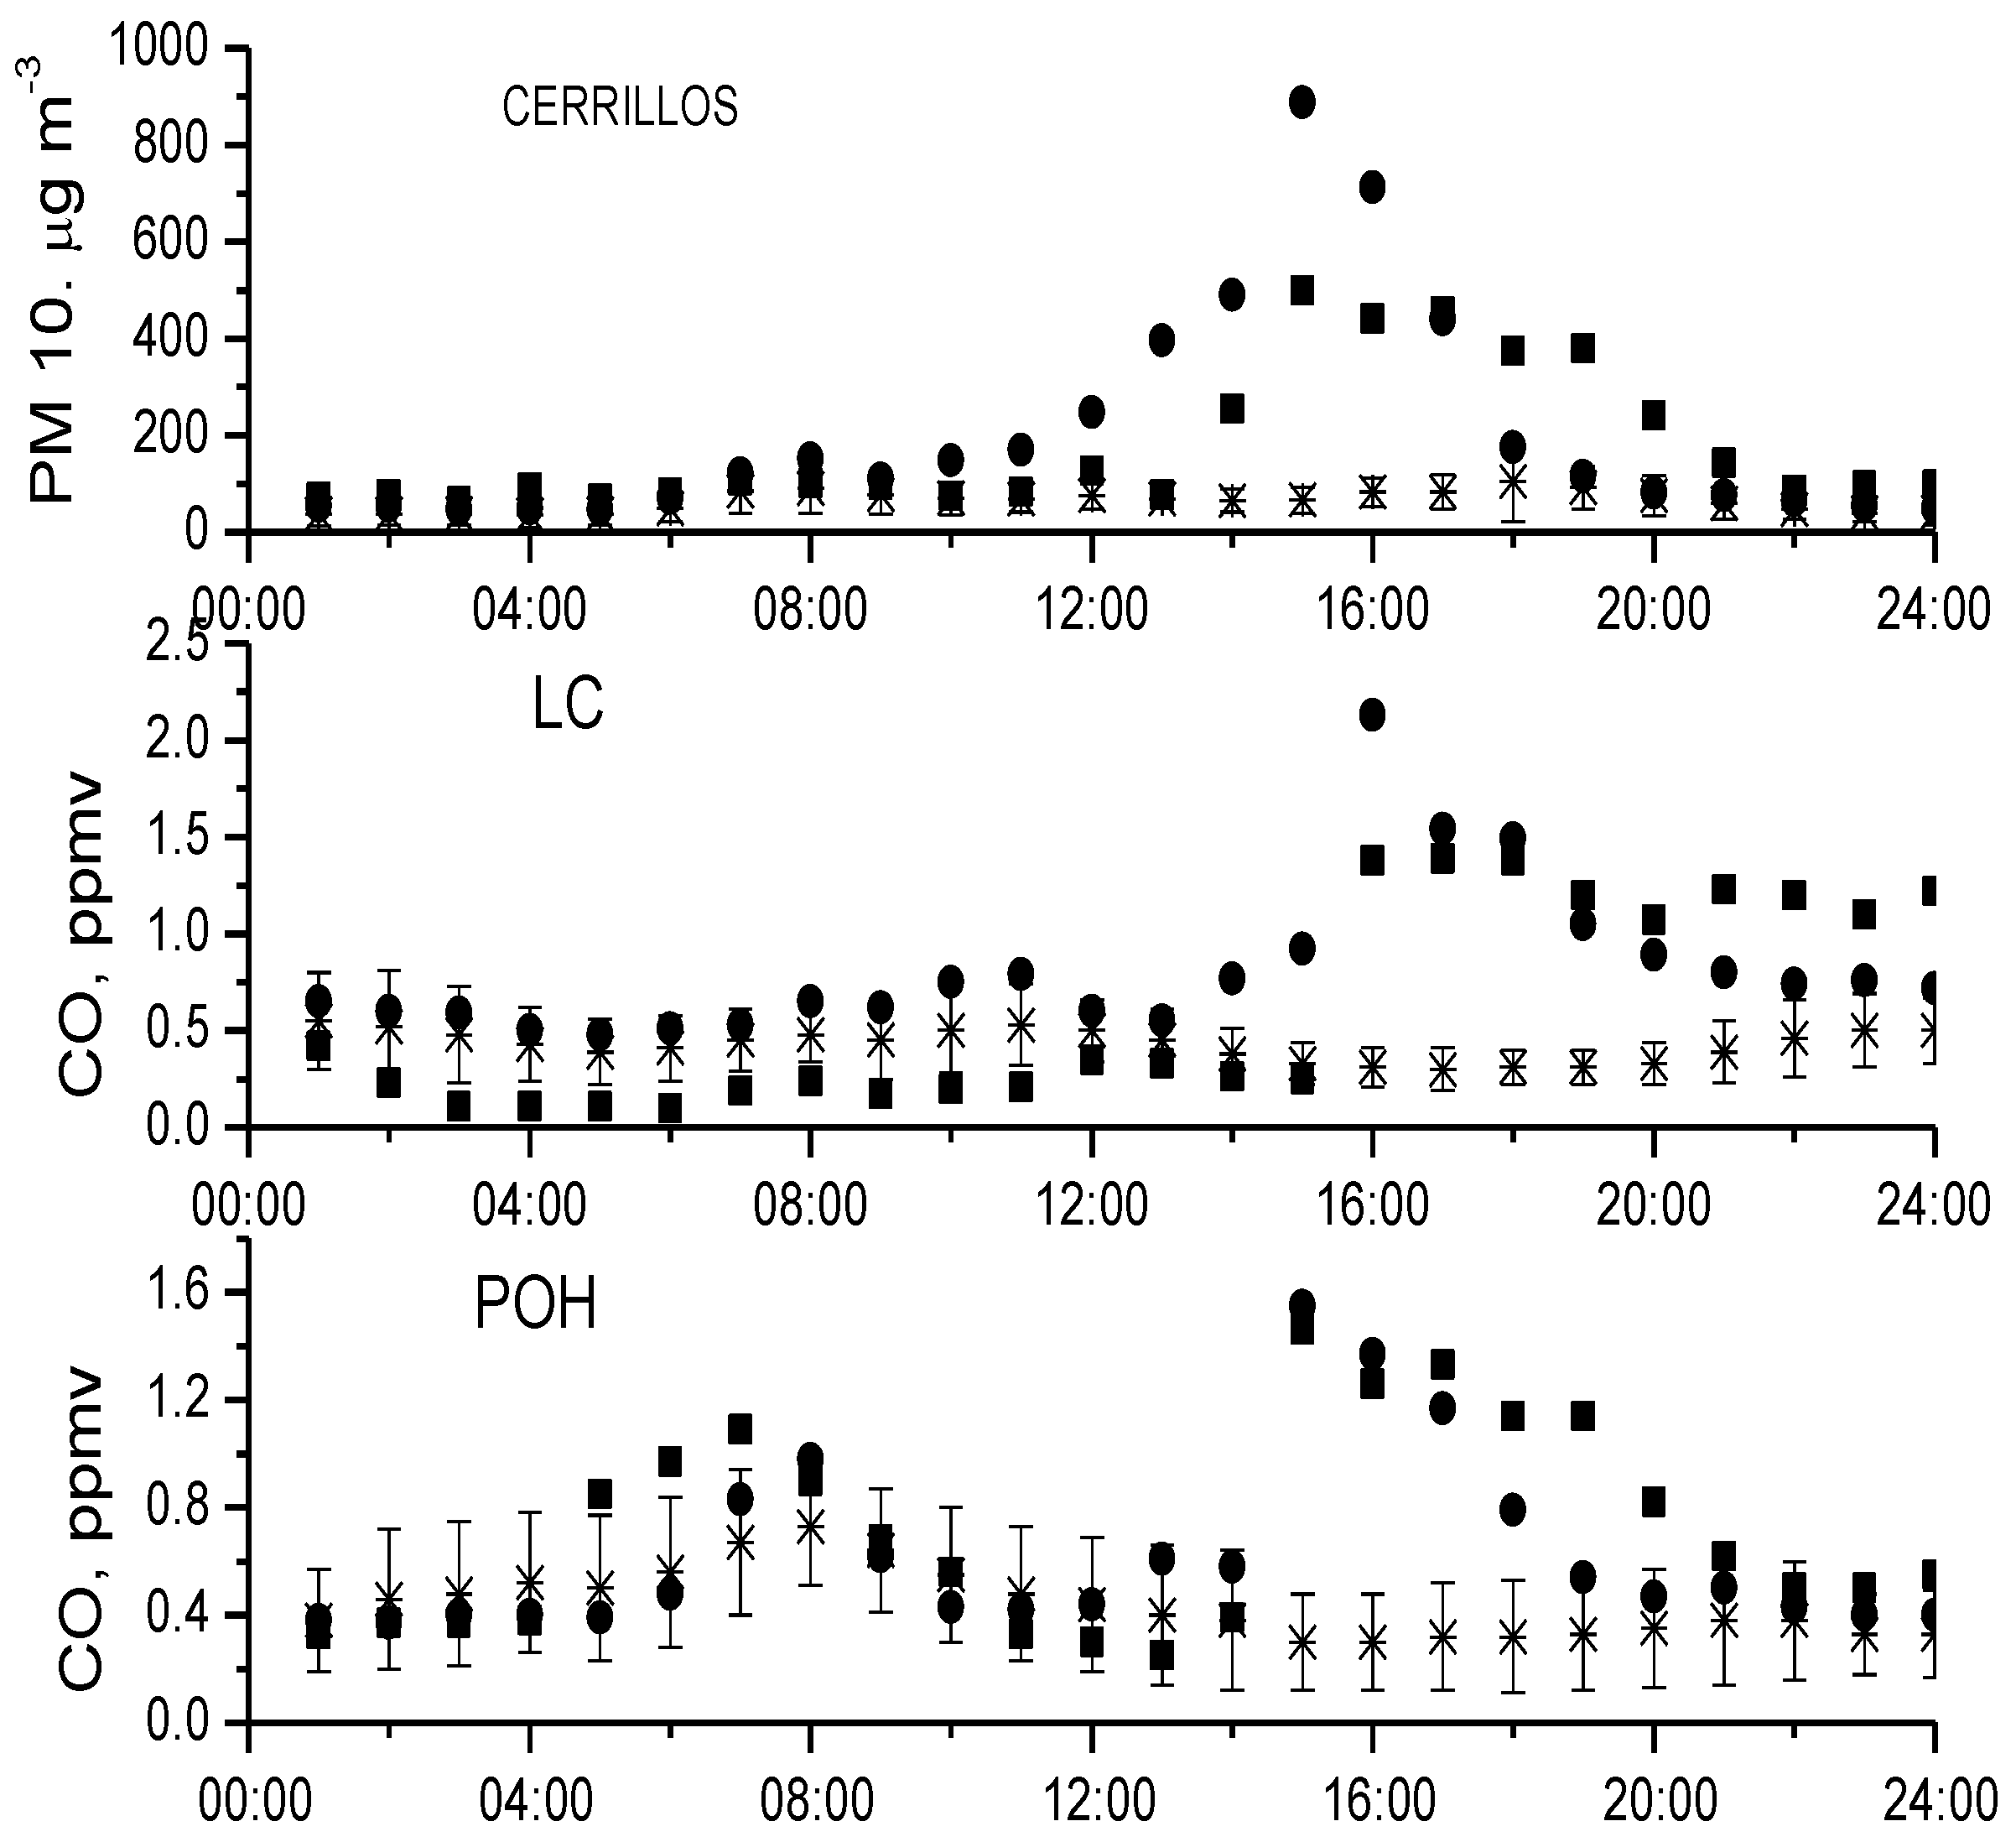
3.2. Impacts on Primary Pollutants

The arrival of the forest fire plumes in Santiago markedly increased the concentration of pollutants measured at ground level relative to non-fire days, as illustrated by the time series of MP10 in CERR and LC (Figure 5). A similar behavior is observed for different pollutants in the three sampling sites summarized in Table 1. This table shows the maximum daily concentrations of CO, PM10 and O3 during days with active fires in the Melipilla sector and the average daily maximum for non-fire days during summer (days from 2011, 2012 and 2013). Note that the presence of active fires in Melipilla increased nearly three times the maximum CO concentration in Santiago relative to the background reference values. Similar differences were obtained in fires near to Cordoba city (Argentina) in a scenario with characteristics similar to those of Santiago [29].
The occurrence of nearby wildfires also changed the diurnal cycle of the pollutants. In absence of fires, the highest CO and PM10 concentrations in POH and CERR occur during the morning rush hours (7:00–8:00 a.m.) consistent with the elevated emissions from mobile sources in that period, while the maximum concentrations at LC occur around 11:00 a.m., as expected for air masses transported from downtown (Figure 6). In contrast, during days with active wildfires, the maximum CO and PM10 levels were attained between 15:00 and 16:00, irrespective of the sampling location, suggesting the dominant role of the transport processes (Figure 6).
Figure 5. PM10 time profile measured in Cerrillos and las Condes from 1 to 14 January 2014.
Atmosphere 06 01838 g005
Figure 6. Comparison of data obtained in days with active fires (4 January 2014 and 8 January 2014) (▪,•) and the average of background data for days without fires during January 2014 (∗).
Atmosphere 06 01838 g006
Table 1. Historical average maximum values (January days from years 2011, 2012 and 2013) and maximum values in days with active fires (4 January 2014 and 8 January 2014).
SiteDayCO (ppmv)PM10 (μg·m−3)O3 (ppbv)
CerrillosHistorical Average0.61 ± 0.09116 ± 1945.1 ± 4.7
4 January 20141.84493127
8 January 20142.2688892
Parque O´higginsHistorical Average0.50 ± 0.2483.8 ± 22.443.4 ± 20.0
4 January 20141.46433133
8 January 20141.5549391
Las CondesHistorical Average0.57 ± 0.18109 ± 3276 ± 17
4 January 20141.39331142
8 January 20142.13493105

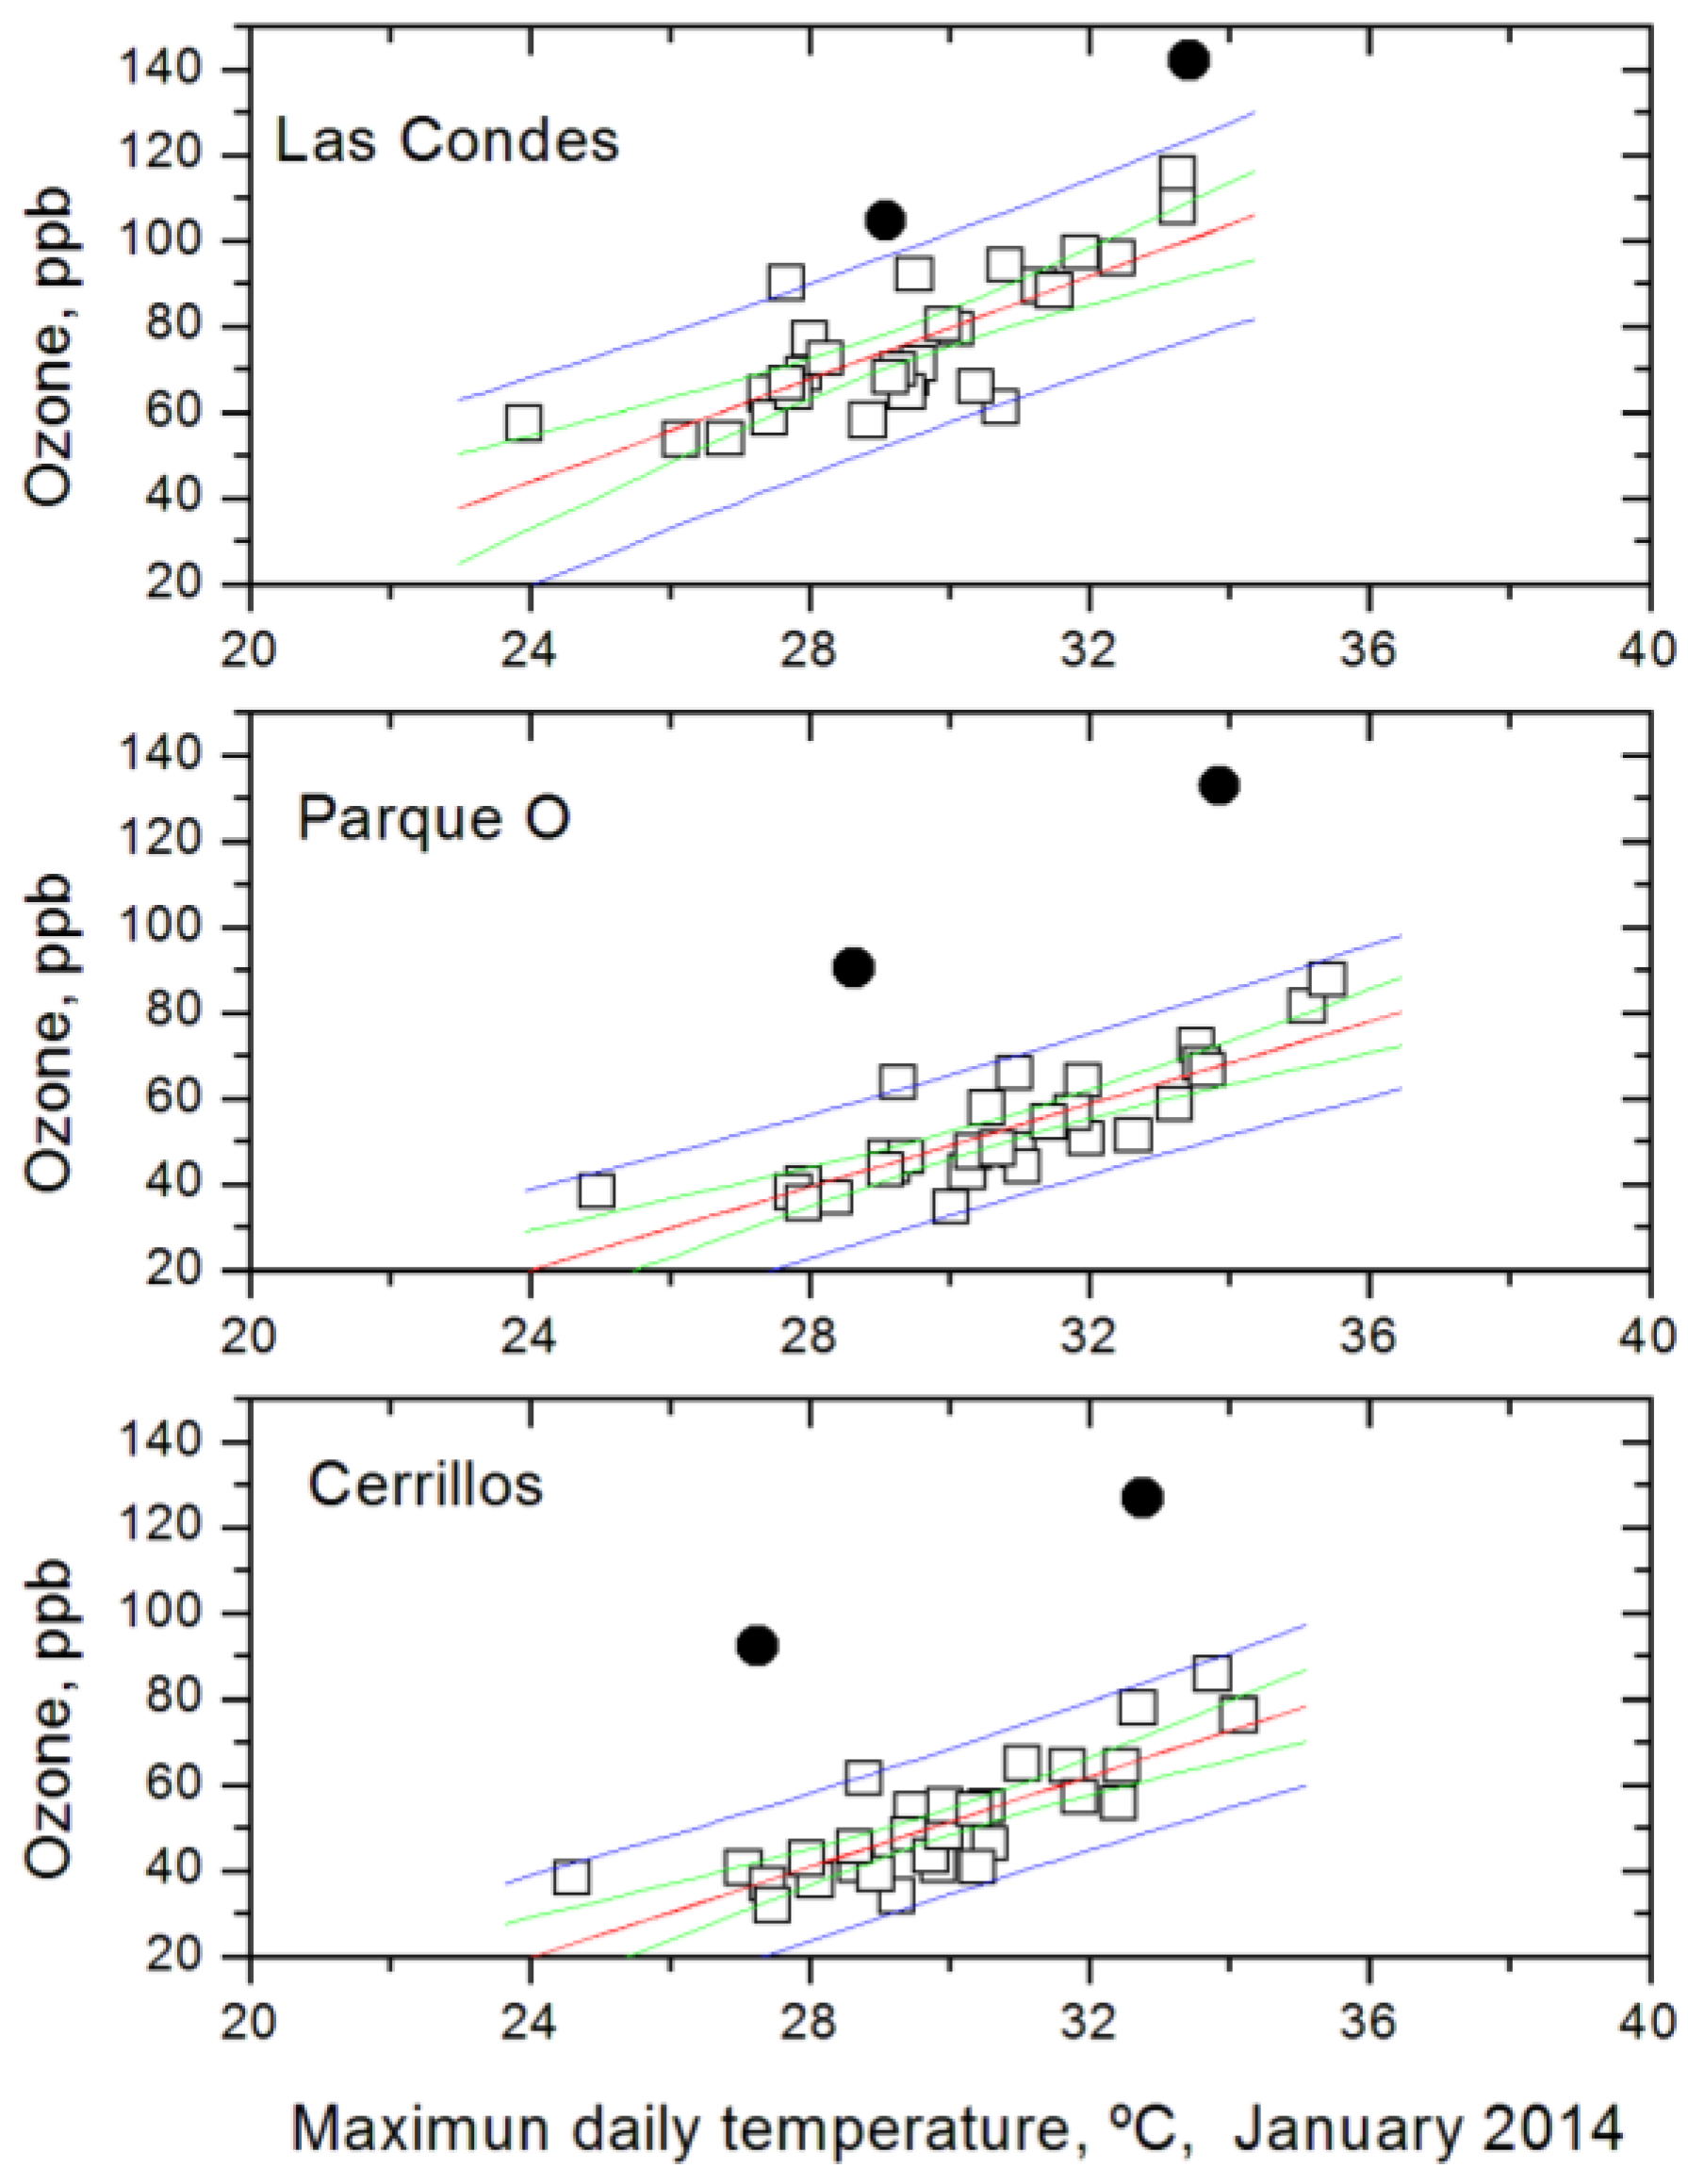
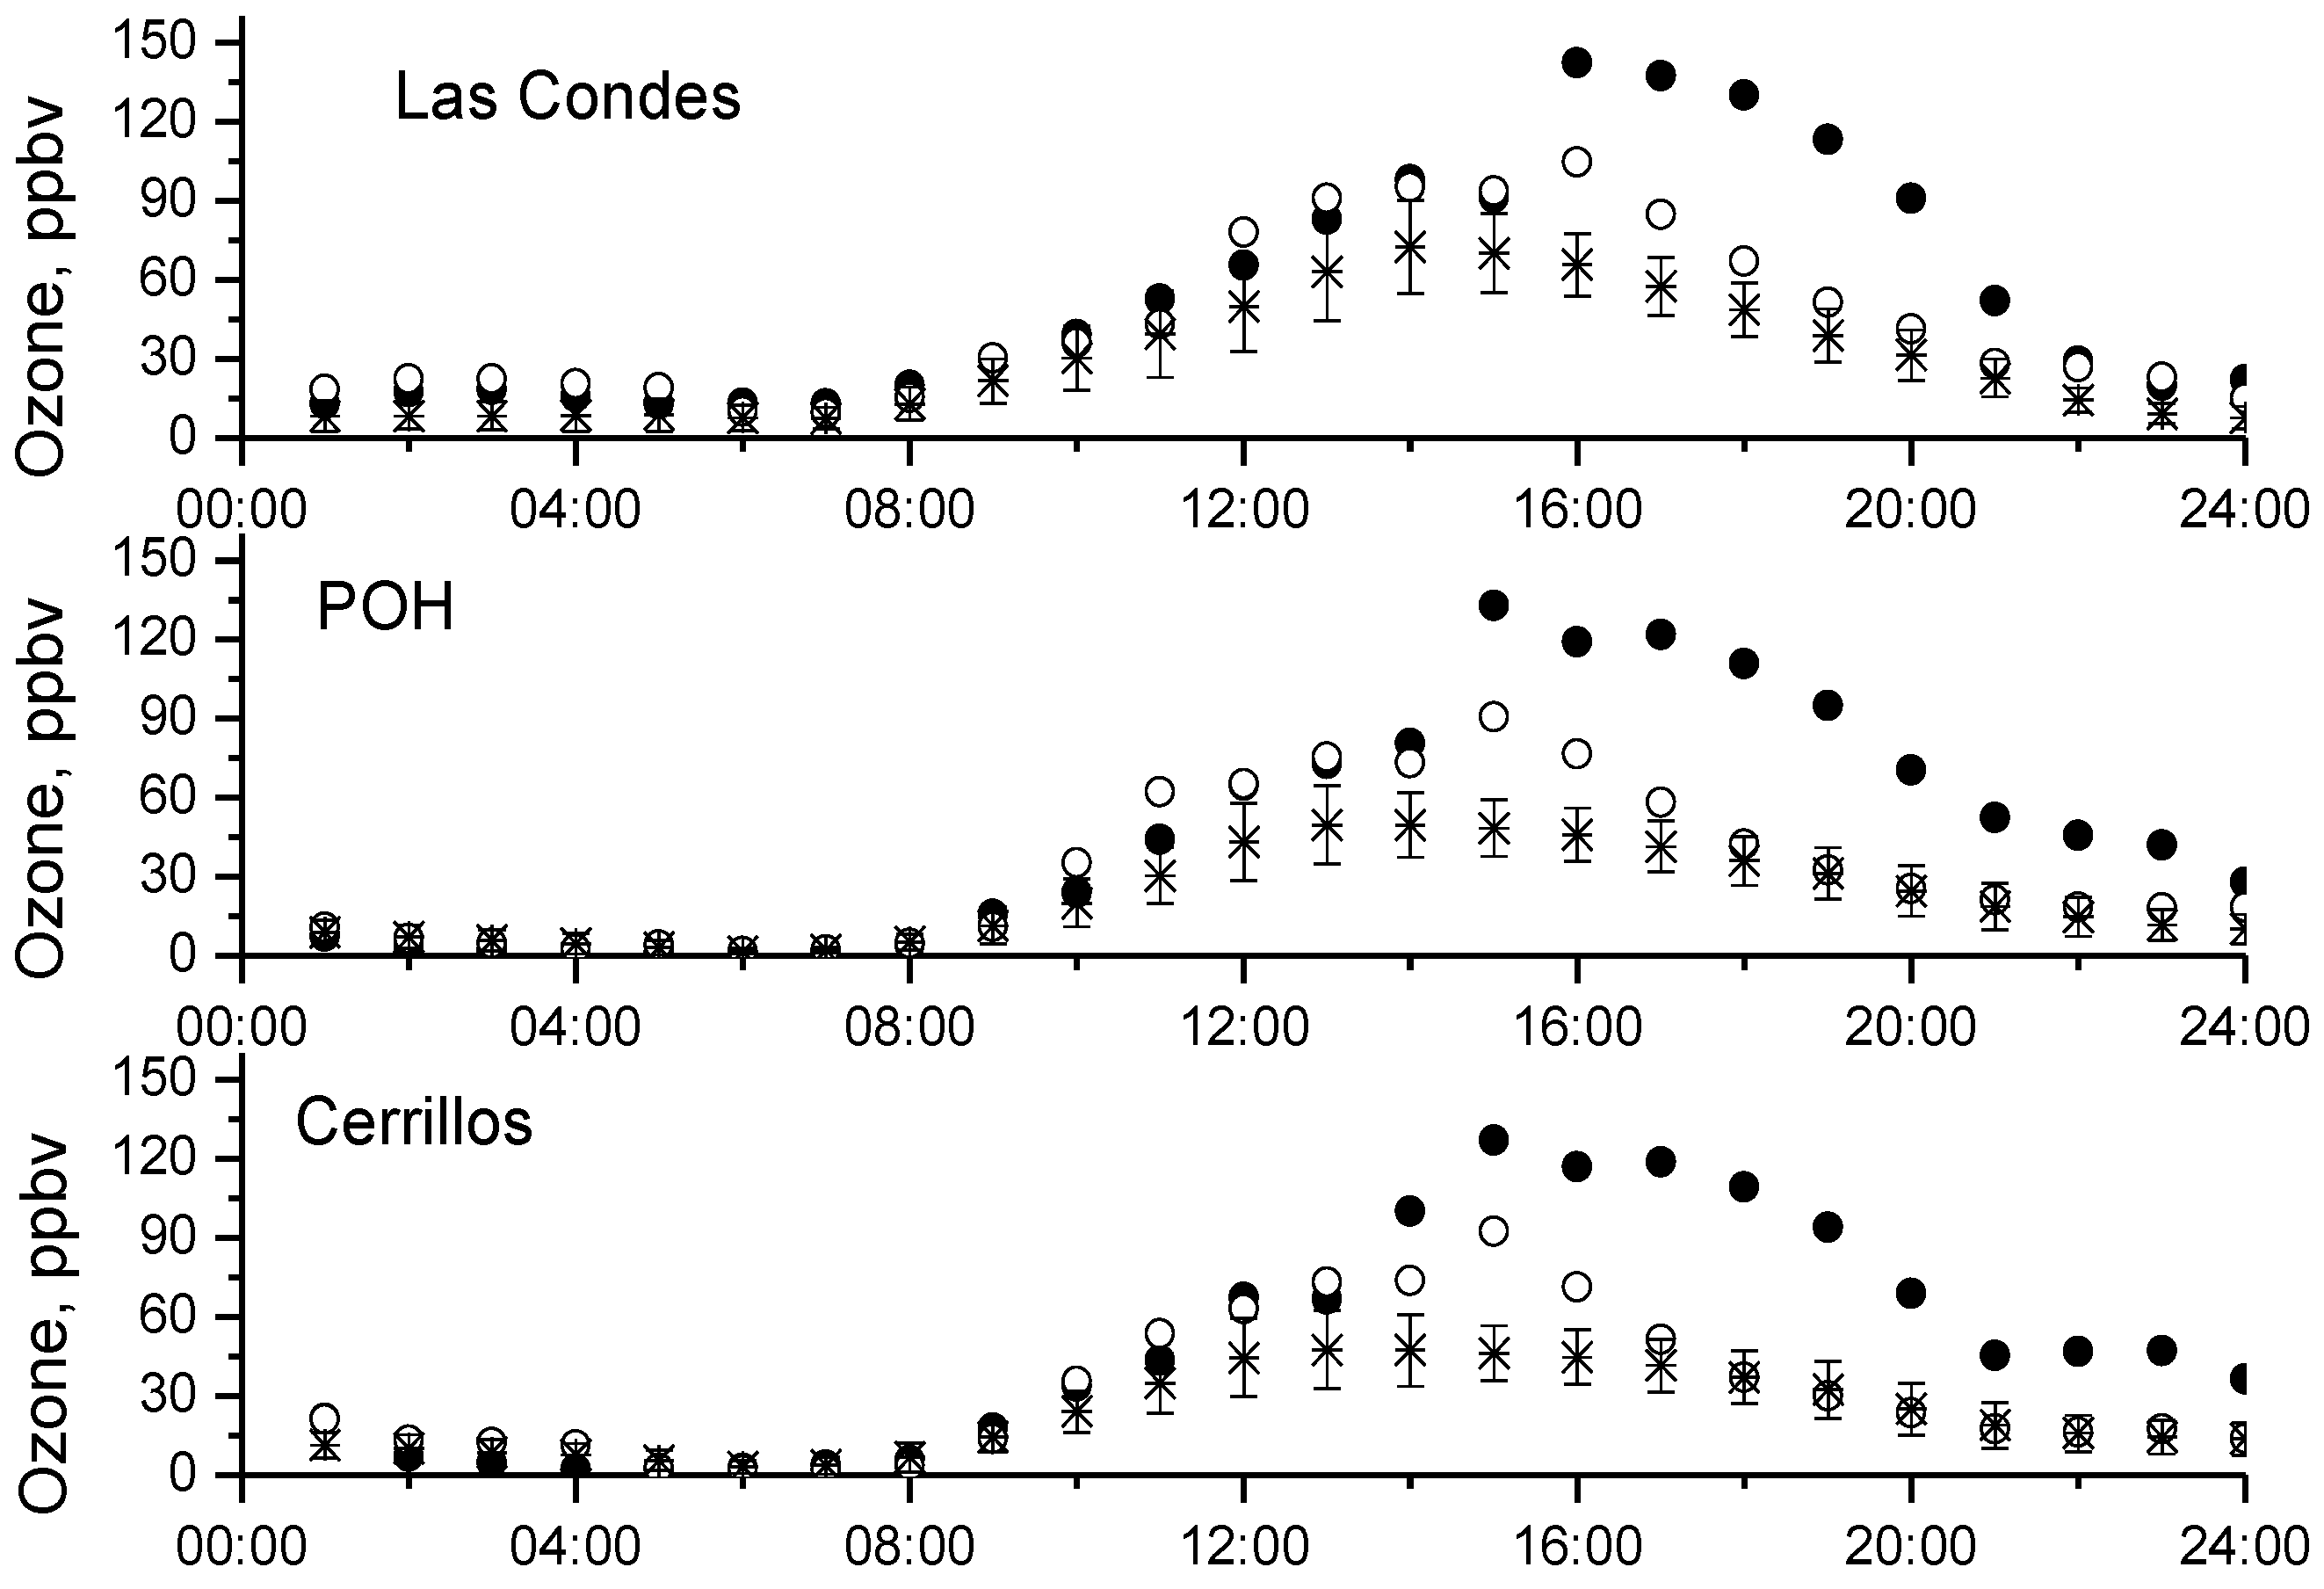
3.3. Ozone in Wildfire Days

Ozone concentrations were also considerably enhanced during the upwind forest fires. Since ozone concentrations depend upon the sampling place and the maximum daily temperature [30,31,32] the data are plotted as a function of the air temperature in Santiago at each location (Figure 7). This figure shows that nearby fires significantly contributed to the high ozone concentration all over the Santiago basin. The values obtained when fires were active are well outside the 95% confidence limit of the data obtained using the historical background reference days. The contribution of nearby fires to ozone urban levels can be estimated from the difference between measured values and those expected from the maximum daily temperature [33] included in Table 2. The extra urban ozone associated to Melipilla’s wildfires went up to 65 ppb, amounting to a 100% increase. This is a value considerably larger than those reported elsewhere [3]. Furthermore, ozone concentration during wildfire days consistently surpassed the 80 ppb limit in the three locations considered, a level considered harmful for humans, animals and vegetation [34,35] even during photochemically inactive seasons [8].
Figure 7. Lineal relationship between Ozone maximum one hour average and daily maximum temperature. (□) with Confidence band and Prediction band (95%). Measurements in days with nearby fires (▪).
Atmosphere 06 01838 g007
Similar to the evolution of other pollutants, ozone maximum concentrations took place during the late afternoon of the days with wildfire in Melipilla, approximately two hours later than in background reference days (Figure 8). Notably, at these times, there is a noticeable increase in NO2 concentrations in the aging plume (Figure 9) that can push up the ground level ozone concentration as discussed below.
Figure 8. Ozone time profiles in background reference days (∗) and days with active fires in Melipilla region (○) (•).
Atmosphere 06 01838 g008
Figure 9. NO2 daily profile, reference background days (□) and days with active wildfires in Melipilla region. (▪), (•).
Atmosphere 06 01838 g009
Table 2. Contribution of Melipilla’s fires to ozone maximum concentration in Santiago’s atmosphere (ground level).
SitesFire DayCalculated (ppbv)Measured (ppbv)Difference (ppbv)
Las Condes4100.19142.1541.96
874.20104.730.5
ParqueO’higgins467.66132.865.14
842.4090.5548.15
Cerrillos466.10126.8360.73
836.9592.3255.37

4. Discussion

Ozone concentration in the traveling plume increases with ageing but decreases with dilution. The interplay of these two factors can increase or decrease the concentrations of the oxidants with the fire to receptor distance [15], and the ozone concentration in the plumes is depleted as often as it is enhanced [36]. Furthermore, it could be expected that, due to back reflection of solar radiation by the increased amounts of particles (Figure 4), formation of ozone in the plume originating from wildfires could be reduced, particularly at ground level. However, the data obtained in this work and in previous studies [8] show a clear increase in ozone concentrations in plumes from wildfires and at ground level in nearby cities [11].This increase can be related to:
(i)
An increase in the rate of the chemical ozone production [3].
(ii)
High emissions of ozone precursors, such as VOCs and NOx [4,37,38,39].
(iii)
A reduced rate of ozone capture due to closure of plants stomata [2].
(iv)
PAN decomposition as a late source of NO2 [4]. PAN is rapidly formed in smoke plumes, with ca. 40% if the initial emitted NOX being converted to PAN in the first few hours after emission, contributing to downwind ozone formation [36].
(v)
Significant emissions of formaldehyde [37] and HONO [40,41,42] relevant sources of hydroxyl radicals in Santiago´s atmosphere [18].
Point (i) and point (iii) should not be enough to explain the large differences observed. Since, Melipilla fires involve dry pastures, acacia caven and some eucalyptus globulus with very low ozone capture rates.
NO2 arising from PAN decomposition can be an important promoter of high ozone levels in aged plumes [4,36] but its contribution to ozone levels in cities nearby the wildfire is unlikely, given the high NOx emission rates. In fact, the “direct” emission of NO2 from wildfires has been estimated to have a NO2/CO ratio of 0.005 ± 0.002 mol/mol [37]. NOx emissions are determined by the amount of nitrogen present in the fuel [43] and is emitted both at the flaming and smoldering stages [43,44].
Regarding the role of precursors (NOx, VOCS, formaldehyde and HONO), it has to be considered that daytime ozone steady state concentrations near to wildfires can be considered to be approximately given by Leighton’s relationship:
[O3]ss = (JNO2/kNO) ([NO2]/[NO])
where JNO2 is the NO2 photolysis constant and kNO is specific rate constant of NO plus O3 reaction. The role of the precursors in the Los Angeles type photochemical smog is to transform NO (the main primary NOx emitted by mobile sources) into NO2 allowing an increase in ozone concentrations. Emission NO2/NOx ratios in biomass burning are, for a variety of fuels, in the 0.1–0.3 range [40,45]. These values are larger than those arising from vehicles, the most important NOx source in large cities [46]. During the year 2006 at the monitoring station in Wuppertal (Germany), an annual average NO2/NOx emission ratio of 0.12 ± 0.01 was reported by Kurtenbach et al., [47]. The same group reported, from a traffic tunnel study in 1997, a much smaller emission ratio (0.04 ± 0.01). Similarly, in mainly ozone free road tunnels in Hong Kong, an NO2/NOx ratio smaller than 0.02 was reported [48].
The relatively high NO2/NOx emitted in biomass burning implies that high ozone concentrations could be achieved independently of precursor emissions since they are no longer necessary to photochemically generate large [NO2]/[NO] ratios and, hence, high ozone concentrations. In agreement with these considerations, at the morning rush hour of days with active fires, the ratio NO2/NO in Cerrillos was 35 and 7.5, values much higher than those measured in background reference days (3.5 and 1.4, respectively). NOx directly measured upon the flames contains approximately 10% of NO2 [43] suggesting that NO emission is the dominant process. However, in the fire and in the plume, local NO concentrations are very high and, at the current high temperatures, oxidation of NO to NO2 can be a fast process that increases the NO2/NOx ratio during the plume travel from the fire locus to the city (about 4–6 h), Figure 9.
The effect of the fire-derived plume upon urban ozone is complex due to incorporation of local emissions to contaminated air masses. This incorporation is not straightforward and sometimes is difficult to establish [29] and modeling has been minimally successful [14,49,50,51]. However, this incorporation of contaminants in the travelling plume does not seem to be relevant in the present scenario. The reported data show that ozone values measured in Cerrillos are very similar to those found at POH. If the location of Cerrillos at the entrance of the plume to Santiago’s basin is considered, it can be concluded that the urban ozone is mostly explained in terms of the chemistry taking place during the transfer from the fire to the city and is minimally influenced by local emissions. In this regard, it is interesting to note that on normal days the maximum ozone in the city occurs about six hours after the rush hours. This delay time is of the same order of magnitude as that necessary to bring to the city the air masses charged with wildfire emissions. Interestingly, the presence of the plume decreases the difference between LC and the other stations (Table 2) that generally present smaller ozone concentrations.

5. Conclusions

Major forest fires in the Melipilla sector in central Chile increased ozone concentrations in the urban atmosphere of Santiago, reaching values higher than 80 ppb (the national one hour average limit). This increase took place at the three sampling sites considered and is explained in terms of a large NO2/NO ratio in biomass burning emissions, the age of the plume reaching Santiago, and the high initial concentrations of ozone precursors, such as NOx, VOCs and OH• radical sources, such as formaldehyde and HONO, present in the urban atmosphere.

Acknowledgments

This work has been supported by DICYT—USACH 021541RC and CEDENNA-USACH. RG is partially supported by FONDAP Grant 15110009.

Author Contributions

Rubio, Lissi and Gramsch performed the air-chemistry analysis. Garreaud provided the meteorological context.

Conflicts of Interest

The authors declare no conflict of interest.

References

  1. Real, E.; Law, K.S.; Weinzierl, B.; Fiebig, M.; Petzold, A.; Wild, O.; Methven, J.; Arnold, S.; Stohl, A.; Huntrieser, H.; et al. Processes influencing ozone levels in Alaskan forest fire plumes during long-range transport over the North Atlantic. J. Geophys. Res. 2007, 112, 1–19. [Google Scholar] [CrossRef]
  2. Hodnebrog, O.; Solberg, S.; Stordal, F.; Svendby, T.M.; Simpson, D.; Gauss, M.; Hilboll, A.; Pfister, G.G.; Turquety, S.; Richter, A.; et al. Impact of forest fires, biogenic emissions and high temperatures on the elevated Eastern Mediterranean ozone levels during the hot summer of 2007. Atmos. Chem. Phys. 2012, 12, 8727–8750. [Google Scholar] [CrossRef] [Green Version]
  3. Martins, V.; Miranda, A.I.; Carvalho, A.; Schaap, M.; Borrego, C.; Sá, E. Impact of forest fires on particulate matter and ozone levels during the 2003, 2004 and 2005 fire seasons in Portugal. Sci. Total Environ. 2012, 414, 53–62. [Google Scholar] [CrossRef] [PubMed]
  4. Jaffe, D.A.; Wigder, N.L. Ozone production from wildfires: A critical review. Atmos. Environ. 2012, 51, 1–10. [Google Scholar] [CrossRef]
  5. Val Martin, M.; Honrath, R.E.; Owen, R.C.; Pfister, G.; Fialho, P.; Barata, F. Significant enhancements of nitrogen oxides, black carbon, and ozone in the North Atlantic lower free troposphere resulting from North American boreal wildfire. J. Geophys. Res. 2006, 111, D23S60. [Google Scholar] [CrossRef]
  6. Suarez, L.; Castillo, L.; Marín, M.; Carrillo, G.; Rímac, L.; Pomalaya, J.; Penacho, R. Study of the seasonal variation of tropospheric ozone and aerosols related to the biomass burning in Amazonian. Mosaico. Cient. 2006, 3, 1–5. [Google Scholar]
  7. Morris, G.A.; Hersey, S.; Thompson, A.M.; Pawson, S.; Nielsen, J.E.; Colarco, P.R.; Wallace, M.S.; McMillan, W.W.; Stohl, A.; Turquety, S.; et al. Alaskan and Canadian forest fires exacerbate ozone pollution over Houston, Texas, on 19 and 20 July 2004. J. Geophys. Res. 2006, 111. [Google Scholar] [CrossRef]
  8. Pfister, G.G.; Wiedinmyer, C.; Emmons, L.K. Impacts of the fall 2007 California wildfires on surface ozone: Integrating local observations with global model simulations. Geophys. Res. Lett. 2008, 35. [Google Scholar] [CrossRef]
  9. Mebust, A.K.; Cohen, R.C. Space-based observations of fire NOx emission coefficients: A global biome-scale comparison. Atmos. Chem. Phys. 2014, 14, 2509–2524. [Google Scholar] [CrossRef]
  10. Evans, L.F.; King, N.K.; Packham, D.R.; Stephens, E.T. Ozone measurements in smoke from forest fire. Environ. Sci. Technol. 1974, 8, 75–76. [Google Scholar] [CrossRef]
  11. Cheng, L.; McDonald, K.M.; Angle, R.P.; Sandhu, H.S. Forest fire enhanced photochemical air pollution. A case study. Atmos. Environ. 1998, 32, 673–681. [Google Scholar] [CrossRef]
  12. Chalbot, M.C.; Kavouras, I.C.; Dubois, D.W. Assessment of the contribution of wildfires in ozone concentrations in the Central U: Mexico Border Region. Aerosol Air Qual. Res. 2013, 13, 838–848. [Google Scholar] [CrossRef]
  13. Lei, W.; Molina, L.T. Modelling the impact of biomass burning on air quality in and around Mexico City. Atmos. Chem. Phys. 2013, 13, 2299–2319. [Google Scholar] [CrossRef] [Green Version]
  14. Crounse, J.D.; DeCarlo, P.F.; Blake, D.R.; Emmons, L.K.; Campos, E.C.; Apel, E.C.; Clarke, A.D.; Weinheimer, A.J.; McCabe, D.C.; Yokelson, R.J.; et al. Biomass burning and urban air pollution over the Central Mexican Plateau. Atmos. Chem. Phys. 2009, 9, 4929–4944. [Google Scholar] [CrossRef]
  15. Jaffe, D.A.; Chand, D.; Hafner, W.; Westerling, A.; Spracklen, D. Influence of fires on O3 concentrations in the Western U.S. Environ. Sci. Technol. 2008, 42, 5885–5891. [Google Scholar] [CrossRef] [PubMed]
  16. Garreaud, R. The Andes climate and weather. Adv. Geosci. 2009, 7, 1–9. [Google Scholar] [CrossRef]
  17. Rappengluek, B.; Schmitz, R.; Bauerfeind, M.; Cereceda-Balic, F.; von Baer, D.; Jorquera, H.; Silva, Y.; Oyola, P. An urban photochemistry study in Santiago de Chile. Atmos. Environ. 2005, 39, 2913–2931. [Google Scholar] [CrossRef]
  18. Elshorbany, Y.F.; Kleffmann, J.; Kurtenbach, R.; Lissi, E.; Rubio, M.A.; Villena, G.; Gramsch, E.; Rickard, A.R.; Pilling, M.J.; Wiesen, P. Summertime photochemical ozone formation in Santiago, Chile. Atmos. Environ. 2009, 43, 6398–6407. [Google Scholar] [CrossRef]
  19. Romero, H.; Ihl, M.; Rivera, A.; Zalazar, P.; Azocar, P. Rapid urban growth, land-use changes and air pollution in Santiago, Chile. Atmos. Environ. 1999, 33, 4039–4047. [Google Scholar] [CrossRef]
  20. Rubio, M.A.; Lissi, E.; Villena, G.; Caroca, V.; Gramsch, E.; Ruiz, A. Estimation of hydroxyl and hydroperoxyl radicals concentrations in the urban atmosphere of Santiago. J. Chil. Chem. Soc. 2005, 50, 375–379. [Google Scholar] [CrossRef]
  21. Rutllant, J.; Garreaud, R. Episodes of strong flow down the western slope of the subtropical Andes. Mon. Weather Rev. 2004, 132, 611–622. [Google Scholar] [CrossRef]
  22. Armesto, J.; Arroyo, M.T.K.; Hinojosa, L.F. The Mediterranean enviroment of central Chile. In The Physical Geography of South America; Veblen, T., Young, K., Orme, A., Eds.; Oxford University Press: Oxford, UK, 2007. [Google Scholar]
  23. Schulz, J.J.; Cayuela, L.; Echeverria, C.; Salas, J. Monitoring land cover change of the dryland landscape of Central Chile (1975–2008). Appl. Geogr. 2010, 30, 436–447. [Google Scholar] [CrossRef] [Green Version]
  24. Krishna, M.T.; Chauhan, A.J.; Freww, A.J.; Holgate, S.T. Toxicological mechanisms underling oxidant pollutants-induced airway injury. Rev. Environ. Health 1998, 13, 59–61. [Google Scholar] [PubMed]
  25. Yang, W.; Omaye, S.T. Air Pollutants oxidative stress and human health. Mutat. Res. Genet. Toxicol. Environ. Mutagen. 2009, 674, 45–54. [Google Scholar] [CrossRef] [PubMed]
  26. Shindell, D.; Kuylenstierna, J.C.I.; Vignati, E.; van Dingenen, R.; Amann, M.; Klimont, Z.; Anenberg, S.C.; Muller, N.; Janssens-Maenhout, G.; Raes, F.; et al. Simultaneous mitigating near-term climate change and improving human health and food security. Science 2012, 335, 183–189. [Google Scholar] [CrossRef] [PubMed]
  27. Muñoz, R.C.; Alcafuz, R. Variability of urban aerosols over Santiago, Chile: Comparison of surface PM10 concentrations and remote sensing with ceilometer and lidar. Aerosol Air Qual. Res. 2012, 12, 8–19. [Google Scholar] [CrossRef]
  28. SINCA 2014. National Service of Air Quality Information. Available online: http:// SINCA.mma.gob.cl (accessed on 1 November 2015).
  29. Olcese, L.E.; Toselli, B.M. Unexpected high levels of ozone measured in Cordoba, Argentina. J. Atmos. Chem. 1998, 31, 269–279. [Google Scholar] [CrossRef]
  30. Rubio, M.A.; Oyola, P.; Gramsch, E.; Lissi, E.; Pizarro, J.; Villena, G. Ozone and peroxyacetylnitrate in downtown Santiago, Chile. Atmos. Environ. 2004, 38, 4931–4939. [Google Scholar] [CrossRef]
  31. Khoder, M.I. Diurnal seasonal and weekdays-weekend variations of ground level ozone concentrations in an urban area in greater Cairo. Environ. Monit. Assess. 2009, 149, 349–362. [Google Scholar] [CrossRef] [PubMed]
  32. Im, U.; Markakis, K.; Poupkou, A.; Melas, D.; Unal, A.; Gerasopoulos, E.; Daskalakis, N.; Kindap, T.; Kanakidou, M. The impact of temperature changes on summer time ozone and its precursors in the Eastern Mediterranean. Atmos. Chem. Phys. 2011, 11, 3847–3864. [Google Scholar] [CrossRef]
  33. Rubio, M.A.; Lissi, E.A. Temperature as thumb rule predictor of ozone levels in Santiago de Chile ground air. J. Chil. Chem. Soc. 2014, 59, 2427–2431. [Google Scholar] [CrossRef]
  34. Krupa, S.V.; Kickert, R.V. The greenhouse effect: Impact of ultraviolet B radiation, carbon dioxide and ozone on vegetation. Environ. Pollut. 1989, 61, 263–393. [Google Scholar] [CrossRef]
  35. Bell, M.L.; McDermontt, A.; Zeger, S.L.; Samet, J.M.; Dominici, F. Ozone and short term mortality in 95 U.S. urban communities. JAMA 2004, 292, 2372–2378. [Google Scholar] [CrossRef] [PubMed]
  36. Alvarado, M.J.; Logan, J.A.; Mao, J.; Apel, E.; Riemer, D.; Blake, D.; Cohen, R.C.; Min, K.E.; Perrin, A.E.; Browne, E.C.; et al. Nitrogen oxides and PAN in plumes from boreal fires during ARCTAS-B and their impact on ozone: An integrated analysis of aircraft and satellite observations. Atmos. Chem. Phys. 2010, 10, 9739–9760. [Google Scholar] [CrossRef]
  37. Young, E.; Paton-Walsh, C. Emission ratios of the tropospheric Ozone precursors nitrogen dioxide and formaldehyde from Australia’s black Saturday fires. Atmosphere 2011, 2, 617–632. [Google Scholar] [CrossRef]
  38. Konovalov, I.B.; Beeckmann, M.; Kuznetsova, I.N.; Yurova, A.; Zvyagintsev, A.M. Atmospheric impacts of the 2010 Russian wildfires: Integrating modeling and measurements of an extreme air pollution episode in the Moscow region. Atmos. Chem. Phys. 2011, 11, 10031–10056. [Google Scholar] [CrossRef]
  39. Schreier, S.F.; Richter, A.; Kaiser, J.W.; Burrows, J.P. The empirical relationship between satellite-derived tropospheric NO2 and fire radiative power and possible implications for fire emissions rates of NOx. Atmos. Chem. Phys. 2014, 14, 2447–2466. [Google Scholar] [CrossRef]
  40. Burling, I.R.; Yokelson, R.J.; Griffith, D.W.T.; Johnson, T.J.; Veres, P.; Roberts, J.M.; Warneke, C.; Urbanski, S.P.; Reardon, J.; Weise, D.R.; et al. Laboratory measurements of trace gas emissions from biomass burning of fuel types from the south eastern and south western United States. Atmos. Chem. Phys. 2010, 10, 11115–11130. [Google Scholar] [CrossRef]
  41. Roberts, J.M.; Veres, P.; Warneke, C.; Neuman, J.A.; Washenfelder, R.A.; Brown, S.S.; Baasandorj, M.; Burkholder, J.B.; Burling, I.R.; Johnson, T.J.; et al. Measurement of HONO, HNCO, and other inorganic acids by negative ion proton-transfer chemical-ionization mass spectrometry (NI-PT-CIMS): Application to biomass burning emissions. Atmos. Meas. Tech. 2010, 3, 981–990. [Google Scholar] [CrossRef]
  42. Nie, W.; Ding, A.J.; Xie, Y.N.; Xu, Z.; Mao, H.; Kerminen, V.; Zheng, L.F.; Qi, X.M.; Yang, X.Q.; Sun, J.N.; et al. Influence of biomass burning plumes on HONO chemistry in eastern China. Atmos. Chem. Phys. Discuss. 2014, 14, 7859–7887. [Google Scholar] [CrossRef]
  43. Andreae, M.O.; Merlet, P. Emissions of trace gases and aerosols from biomass burning. Glob. Biogeochem. Cycles. 2001, 15, 955–966. [Google Scholar] [CrossRef]
  44. Contreras-Moctezuma, J.; Rodriguez-Trejo, D.A.; Retama-Hernandez, A.; Sanchez-Rodriguez, J.J.M. Smoke gases of wildfires in pinus hartwegii Forest. Agrociencia 2003, 37, 309–316. [Google Scholar]
  45. Yokelson, R.J.; Griffith, D.W.T.; Ward, D.E. Open-path Fourier transforms infrared studies of large scale laboratory biomass fires. J. Geophys. Res. 1996, 101, 21067–21080. [Google Scholar] [CrossRef]
  46. Wu, Y.; Zhang, S.J.; Li, L.M.; Ge, Y.S.; Shu, J.W.; Zhou, Y.; Xu, Y.Y.; Hu, J.N.; Liu, H.; Fu, L.X.; et al. The challenge to NOx emission control for heavy-duty diesel vehicles in China. Atmos. Chem. Phys. 2012, 12, 9365–9379. [Google Scholar] [CrossRef]
  47. Kurtenbach, R.; Kleffmann, J.; Niedojadlo, A.; Wiesen, P. Primary NO2 emissions and their impact on air quality in traffic environments in Germany. Environ. Sci. Eur. 2012, 24, 2–8. [Google Scholar] [CrossRef]
  48. Yao, X.; Lau, N.T.; Chan, C.K.; Fang, M. The use of tunnel concentration profile data to determine ratio of NO2/ NOx directly emitted from vehicles. Atmos. Chem. Phys. Discuss. 2005, 5, 12723–12740. [Google Scholar] [CrossRef]
  49. Bein, K.J.; Zhao, Y.; Johnston, M.V.; Wexler, A.S. Interactions between boreal wildfire and urban emissions. J. Geophys. Res. 2008, 113, DO 7304. [Google Scholar] [CrossRef]
  50. Singh, H.B.; Cai, C.; Kaduwela, A.; Weinheimer, A.; Wisthaler, A. Interaction of fire emissions and urban pollution over California: Ozone formation and air quality simulations. Atmos. Environ. 2012, 56, 45–51. [Google Scholar] [CrossRef]
  51. Wigder, N.L.; Jaffe, D.A.; Saketa, F.A. Ozone and particulate matter enhancements from regional wildfires observed at Mount Bachelor during 2004–2011. Atmos. Environ. 2013, 75, 24–31. [Google Scholar] [CrossRef]

