The 5d-6p VUV Photoabsorption Spectrum of Bi+
by
 , , , and
Hu Lu
1,* ,
,
Lazaros Varvarezos
1,
Patrick Hayden
2,
Eugene T Kennedy
1,
Jean-Paul Mosnier
1 and
and
John T Costello
1 1
School of Physical Sciences and NCPST, Dublin City University, 9 D09 V209 Dublin, Ireland
2
School of Physics, University College Dublin, Belfield, 4 D04 V1W8 Dublin, Ireland
*
Author to whom correspondence should be addressed.
Atoms 2020, 8(3), 55; https://0-doi-org.brum.beds.ac.uk/10.3390/atoms8030055
Submission received: 8 August 2020
/
Revised: 1 September 2020
/
Accepted: 2 September 2020
/
Published: 4 September 2020
(This article belongs to the Special Issue Interaction of Ionizing Photons with Atomic and Molecular Ions)
Abstract
:The photoabsorption spectrum of Bi+ was measured in the wavelength range between 37 and 60 nm, using the dual laser plasma technique in which one plasma is used as the source of vacuum ultraviolet continuum radiation and the other plasma is used as the sample of atoms and/or ions to be probed. A number of features in the Bi+ spectrum was identified with the aid of the Cowan suite of atomic codes. The 5d → 6p transitions from the ground configuration (5d106s26p2) gave rise to the most prominent features in the measured spectrum. Transitions from low-lying excited states associated with the four excited configurations, 5d106s26p6d, 5d106s26p7s, 5d106s26p7p and 5d106s6p3, were found to make small contributions to the observed spectrum in the 47–50 nm spectral region. To the best of our knowledge, for Bi+, this spectral region is rather unexplored and spectroscopic data are absent from the literature.
1. Introduction
Although the interaction of atomic ions with radiation is sometimes regarded as purely of fundamental atomic physics interest, it is often encountered in other research fields such as plasma physics and astrophysics [1]. For example, lowly charged ions such as Pb+ and Bi2+ play an important role in investigations regarding e.g., stellar evolution [2] and the chemical composition of peculiar stars [3,4]. High Z atoms such as Bi are important in fusion research and extreme-UV (EUV) light source development. For example, Bi is among the candidates for developing a broadband emission water window source (region 2.3–4.4 nm) for high-contrast biological microscopy [5]. Due to the needs for spectral databases of high Z elements, soft X-ray emission measurements and EUV emission measurements on heavy ions including Bi were performed in the TEXT tokamak [6] and Large Helical Device (LHD) [7], respectively.
Photoabsorption studies of atomic ions have been reported using the merged synchrotron-ion beams technique [8,9,10]. In this case, accelerated beams of ions are merged with synchrotron radiation. The advent of third generation radiation sources exhibiting high brilliance, such as SOLEIL [11] and PETRA III [12] has yielded measurements of total, inner-shell photoionization cross sections [13]. Despite the apparently straightforward nature of this method, and the fact that it can provide absolute photoionization cross sections, the difficulty inherent in obtaining high currents of mono charge state ion beams and the need for access to large scale synchrotron facilities limits the wider applicability of this technique.
Analogous measurements yielding relative photoabsorption cross sections can be performed by means of table-top or laboratory scale techniques. One possibility is to perform photoabsorption measurements in atoms and the corresponding photoionized plasmas using radiation emitted from a laser produced plasma (LPP)-based source where a gas target serves as the active medium [14,15,16]. Another well-established method is the so-called dual laser plasma (DLP) technique [17,18]. When a high-power laser pulse is focused onto a solid target, a short-lived plasma (some tens of nanoseconds) is formed that can be used as a back-lighting vacuum-UV (VUV) to soft X-ray (SXR) light source. A second laser is used to generate an absorbing plasma that includes the atomic or ionic species of interest. This technique can be used to perform photoabsorption measurements to study the inner-shell and multiple electron excitations in a wide range of atoms and ions e.g., [19,20,21,22]. The DLP technique has previously been used to carry out photoabsorption measurements on several lowly charged ions such as: Si+ [23], Si2+ [24], Si3+ [25] and Cr+ [26]. Furthermore, the DLP technique was applied by Banahan and coworkers [27] to measure the photoabsorption spectrum of Pb2+ and Bi3+ in the 19–41 nm spectral region, where excitation of the 5d subshell plays an important role. More recently, photoabsorption spectra of the Ti-like ions, Pb+ and Bi2+ in the 37–70 nm spectral region were reported. In this case, contributions of the 5d → 6p excitations to the photoabsorption spectra were found to be the most significant [28].
In this work, we report photoabsorption measurements in Bi+ in the 37–60 nm spectral region. To the best of our knowledge, this part of the spectrum for Bi+ is rather unexplored, and spectroscopic data are absent from the literature. Such spectroscopic data could prove to be useful additions to the existing atomic and molecular databases e.g., the VAMDC project which integrates more than 30 such databases [29,30].
In Section 2, we describe the experimental setup and how we obtained the spectral data. In Section 3, we present our experimental results and compare them with calculations using the Cowan suite of atomic structure codes. We show the contributions of 5d → 6p transitions from both ground state and low-lying excited states to the Bi+ spectrum. Finally, in Section 4, our conclusions are presented.
2. Experiment
The results presented in this work were recorded using the well-established DLP experimental facility at Dublin City University [31]. The output of a Q switched Nd:YAG laser (0.4 J, 15 ns) was focused onto a tungsten rod to produce the back-lighting continuum plasma. A second time-synchronized Nd:YAG laser pulse (0.45 J, 6ns) was focused by means of a cylindrical lens onto a bismuth target to produce an absorbing line plasma in the experiment. By appropriate choices of laser irradiation conditions and the position of the absorbing plasma with respect to the optical axis and inter-plasma time delay, the photoabsorption spectrum of Bi+ was obtained. Initially, the background continuum intensity (I0) was recorded by firing the back-lighting Nd:YAG laser alone onto the tungsten rod, while the transmitted intensity (I) was obtained by firing both lasers onto the tungsten rod and bismuth plate with an adjustable time delay, respectively. The measured spectrum is displayed here as Log(I0/I) versus the wavelength, corresponding to the quantity αL, where α is the absorption coefficient and L is the absorbing plasma column length. αL can also be written as σNL, where “σ” is the photoabsorption cross section and “NL” is the column density and is sometimes referred to as the relative absorption cross section or the optical depth τ = A−1, where A is the absorbance.
VUV spectra were recorded for a range of time delays and positions of the Bi target surface with respect to the optical axis of an Acton Research Corporation VM510 normal incidence spectrometer. The spectrometer was equipped with a concave grating of 1200 grooves/mm and operated with an entrance slit width of 50 μm for the current experiment. The adjustable fore-slit, located between the target chamber and entrance slit of the spectrometer, was used in the experiment to reduce the intensity of line emission coming from outside of the dense core region of the tungsten plasma used as a continuum source. In other experiments, e.g., on VUV LIBS, it has been used to occlude the continuum emission and favour the line emission coming from the cooler outer region of the plasma plume [32]. It was set to a width of 250 μm for the current experiment. Spectral image readout was provided by a back illuminated CCD (charge-coupled device) camera (Andor Technology Model No. DV420-BN). Spectra with good signal to noise ratio values were obtained by summing 10 single laser shot “I” and “I0” spectra. All spectra were calibrated by comparison with the wavelengths of known emission lines from a laser produced aluminium plasma from the same setup.
3. Results and Discussion
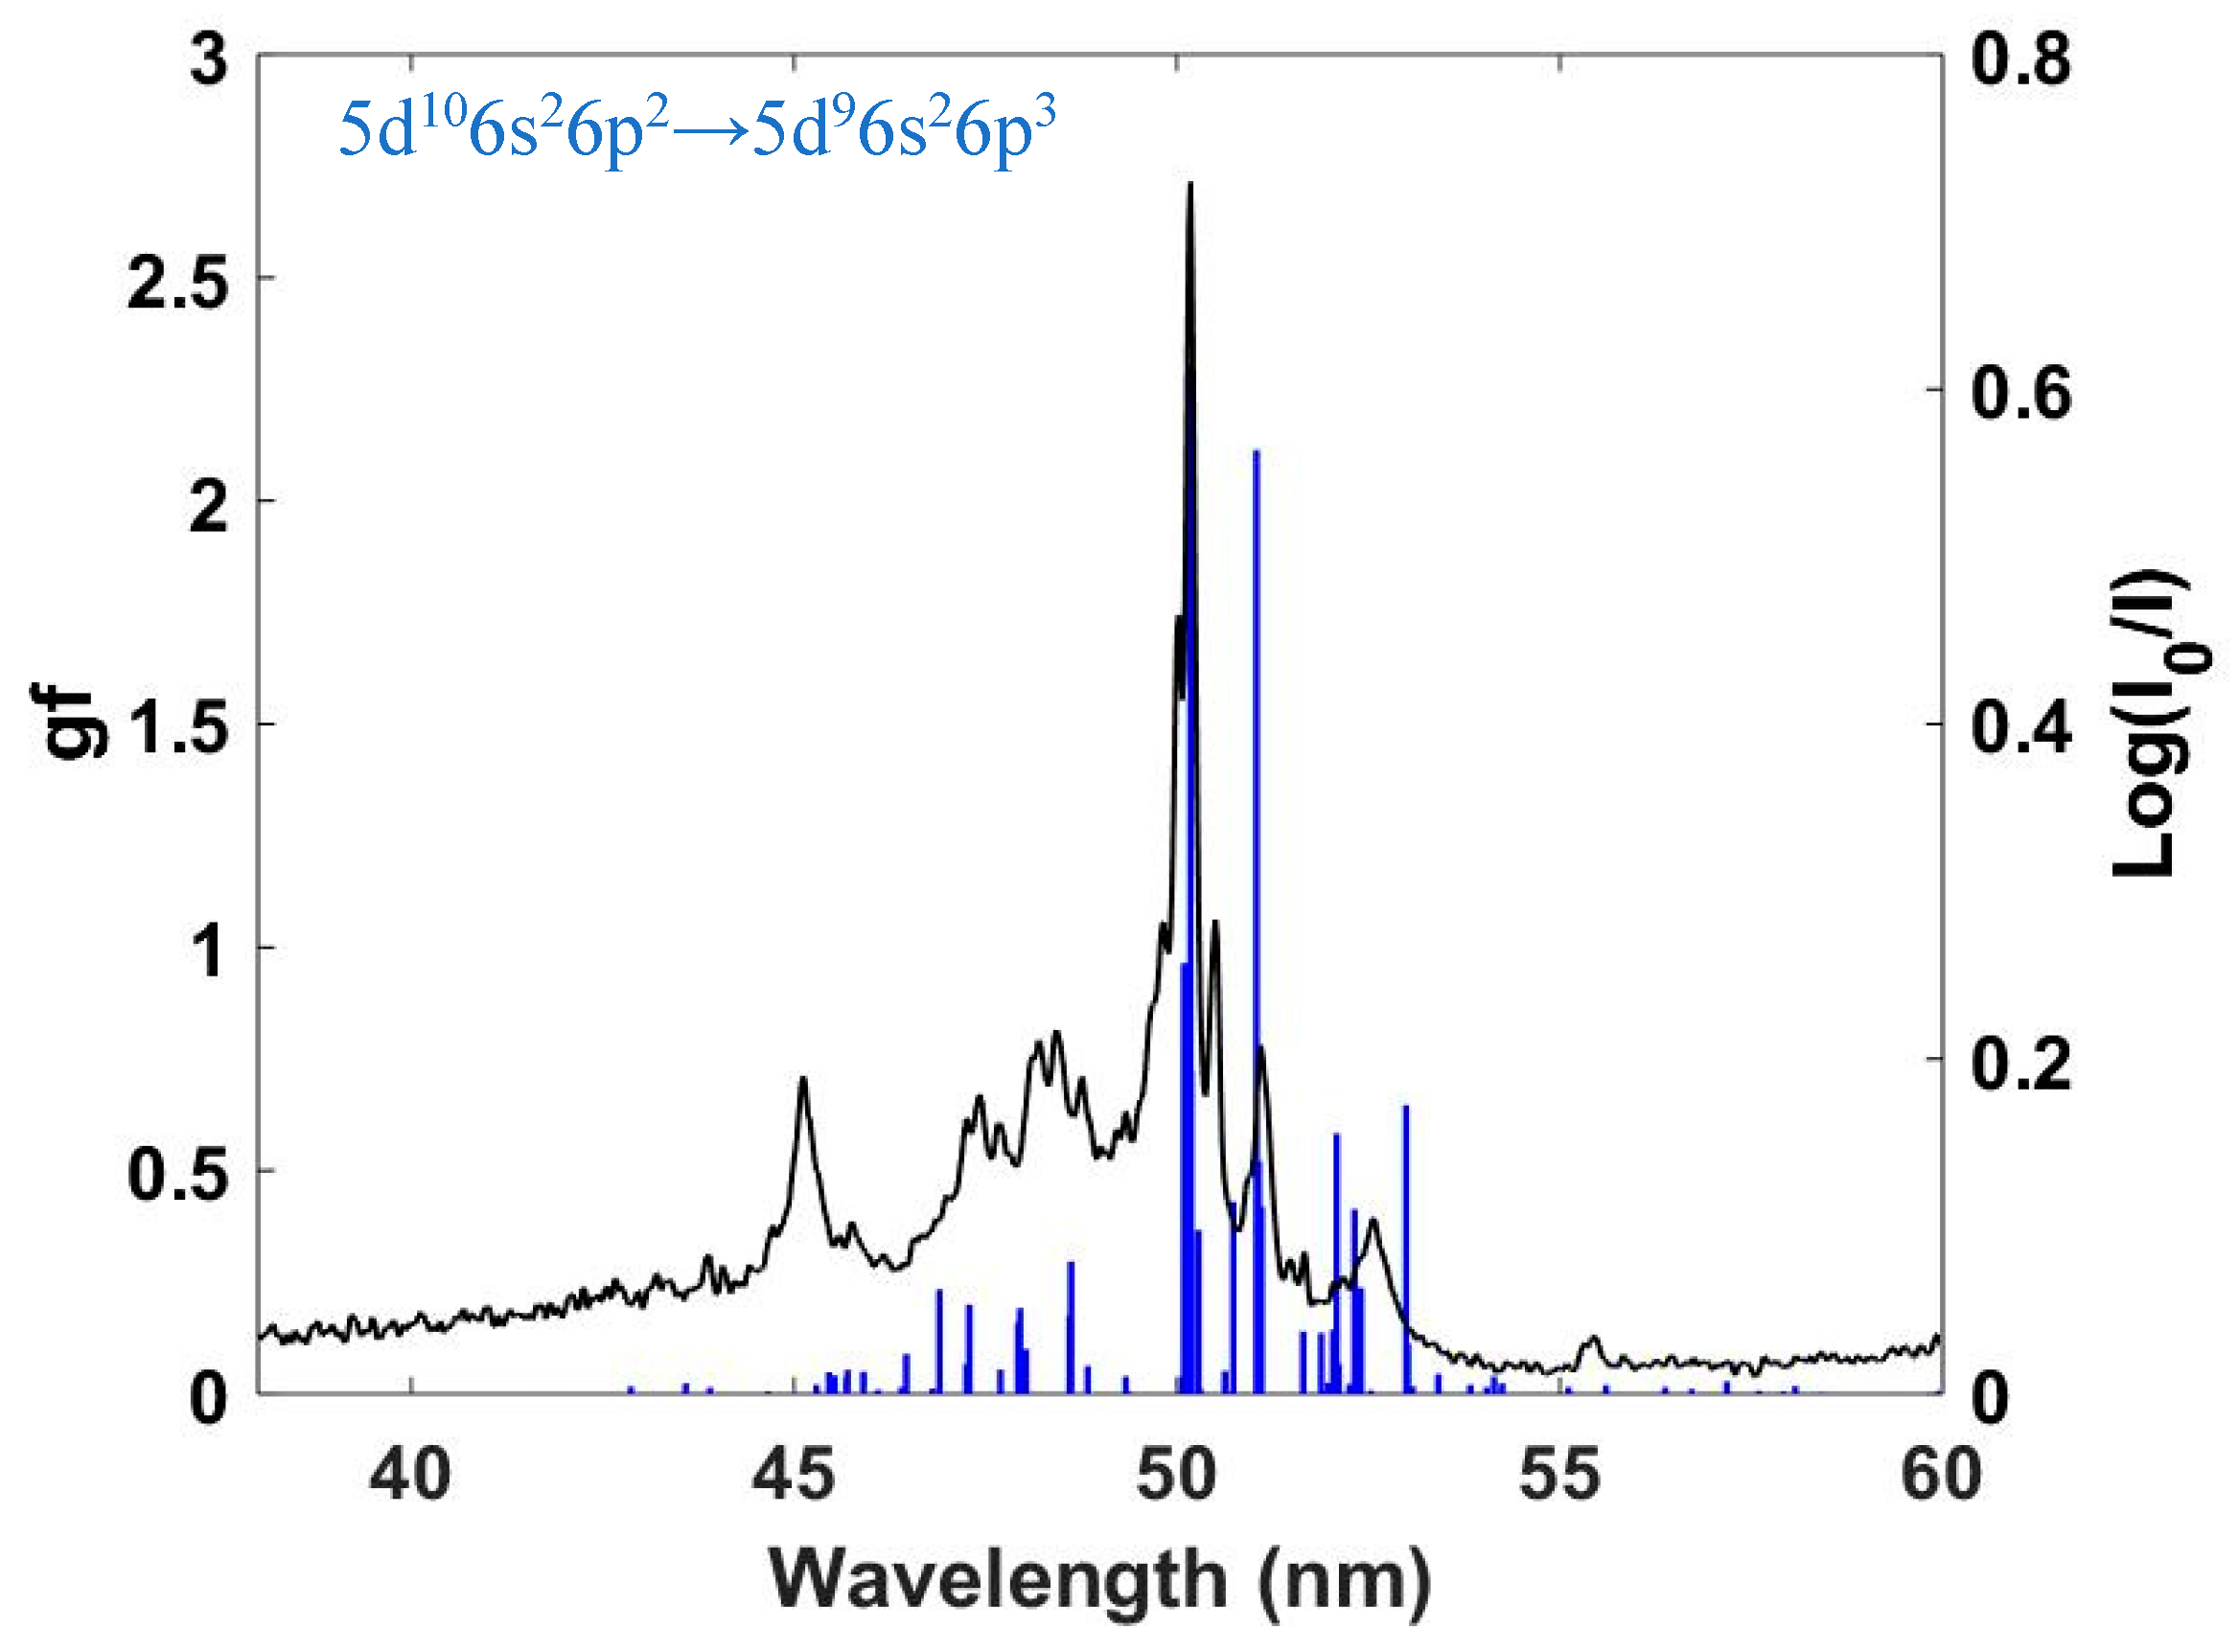
The absorption spectrum of Bi+ in the spectral region ranging from 37 to 60 nm is shown in Figure 1. It was acquired at an inter-laser delay of 1000 ns and with the absorbing plasma formed a distance of 8.7 mm away from the optical axis of the system. By looking at valence excited lines of Bi+ at longer wavelengths, it was found that the bismuth plasma was dominated by singly charged ions for these experimental conditions. The laser was tightly focused onto the Bi target via the cylindrical lens. In order to identify the observed absorption features, we carried out a series of calculations using the Cowan suite of atomic structure codes [33]. The suite comprises a number of core codes, three of which, labelled RCN, RCN2 and RCG, were used in this work. RCN uses the Hartree–Fock method or a number of variations of this method such as the Hartree–Slater (HS) or Hartree plus statistical Exchange (HX) methods to calculate one-electron radial wavefunctions along with direct, exchange and spin-orbit interaction integrals. RCN2 uses the output wavefunctions from RCN to calculate the configuration-interaction Coulomb integrals. Finally, RCG sets up energy matrices for each possible value of the total angular momentum J, diagonalizes each matrix to obtain the eigenvalues (level energies) and eigenvectors (from which the state mixing coefficients can be obtained) and then computes spectra, with wavelengths, oscillator strengths, radiative transition probabilities, and radiative lifetimes.
After testing a number of possible pairs of upper and lower state configurations, the final electron configurations for each of the low-lying states were finally chosen and are given in Table 1. In order to optimize the calculations, the values of Slater integrals were reduced. Specifically, the direct (Fk) and exchange (Gk) integrals were reduced by 15%, as were the configuration interaction (Rk) integrals. In addition, the spin-orbit integrals were reduced by 5%.
In Figure 1, we show the gf values for the 5d → 6p transitions from the ground electron configuration of Bi+. The photoabsorption cross section is related to the oscillator strength, which is in turn given by the weighted oscillator strength normalized to the multiplicity of the lower state, so the gf values were used to compare with the experiment in this work. As can be seen, 5d subshell photoabsorption from the ground configuration 5d106s26p2 dominated the spectrum and resulted in the strong observed photoabsorption peaks at 50.02, 50.18 and 51.08 nm. According to calculations with the Cowan suite of atomic structure codes, these three peaks are mainly due to the transitions 5d106s26p2 (1S) 1D2 → 5d96s26p3 (2D) 1D2, 5d106s26p2 (1S) 1D2 → 5d96s26p3 (2D) 1F3, 5d106s26p2 (1S) 3P2 → 5d96s26p3 (4S) 3D3, respectively.
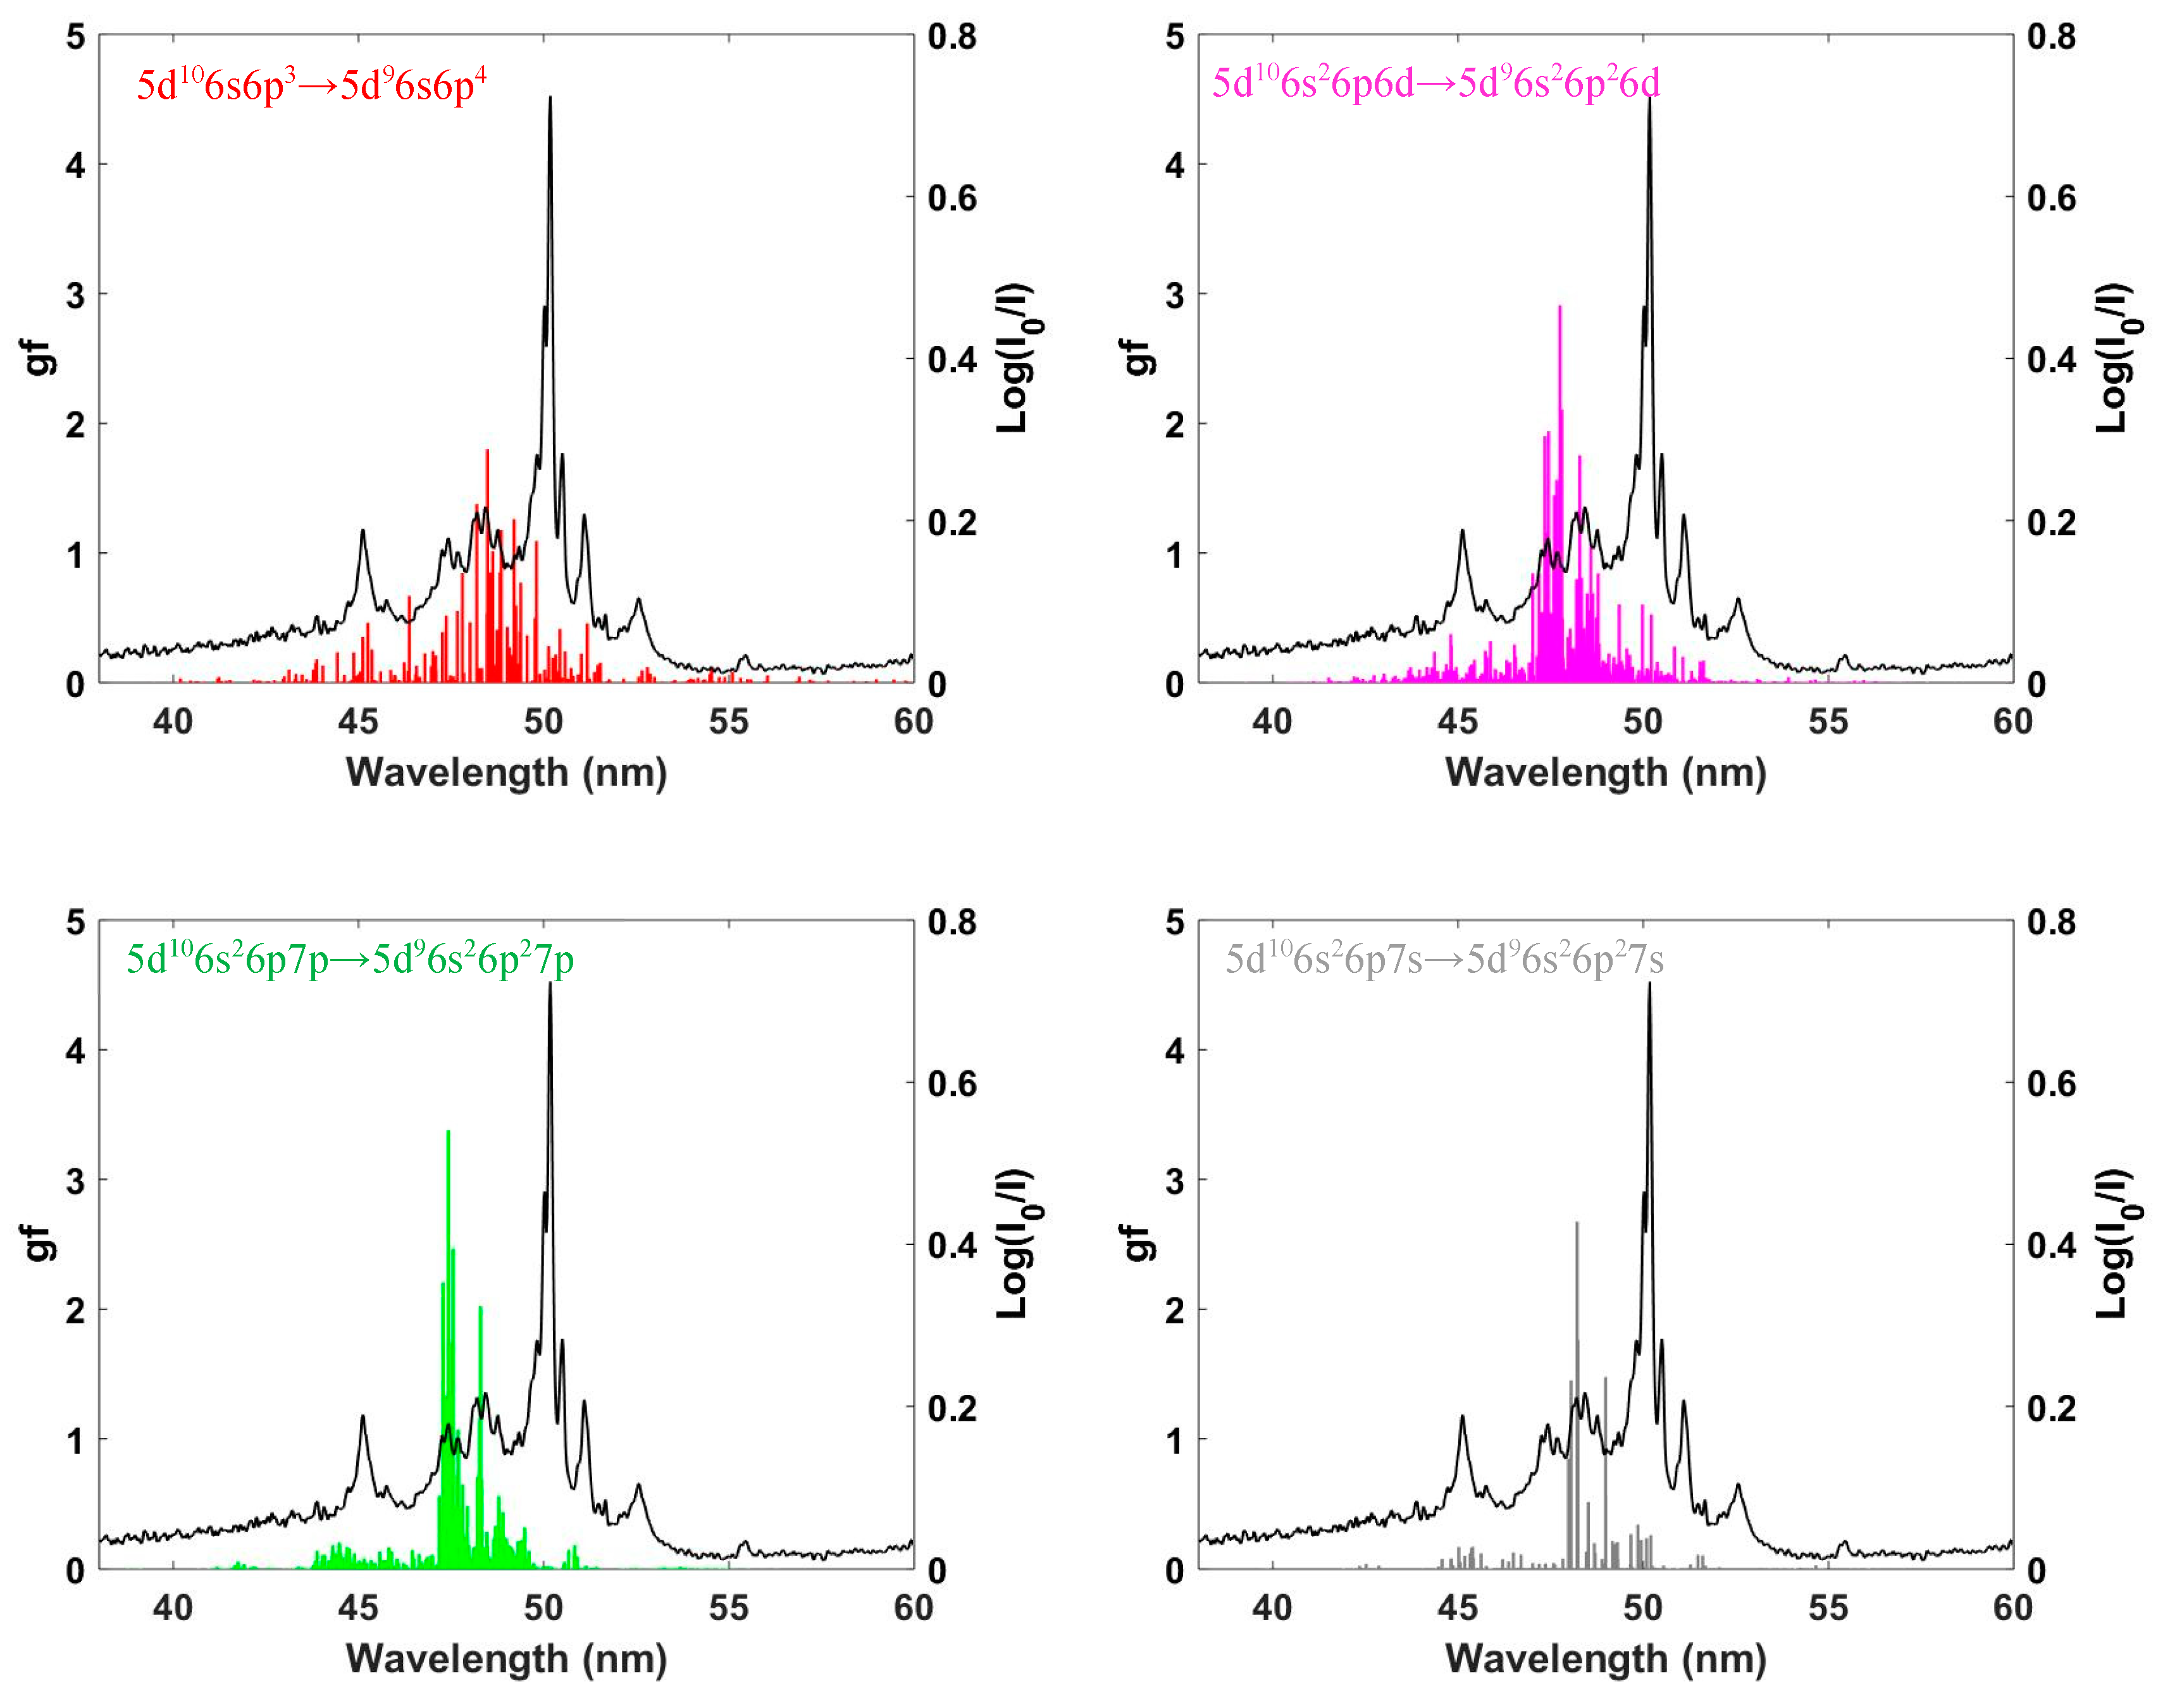
In Figure 2, we show the contribution of 5d → 6p transitions from low-lying excited configurations of Bi+ to the overall absorption spectrum. The plasma temperature was expected to be less than 2 eV for the prevailing experimental conditions [34], and so the population of low-lying excited states would be expected to be a low % of the ground state population. Their contribution to the measured spectrum was thus expected to be finite, but small.
Table 2 includes some of the strongest predicted transitions arising from low-lying (excited) electron configurations of Bi+. The contributions from the excited states were particularly complex as many transitions were possible. For 5d106s26p2 → 5d96s26p3, there were 97 transitions in the calculation, 61 of them with a gf value bigger than 0.01. For 5d106s6p3 → 5d96s6p4, there were 353 transitions in the calculation, 180 of them with a gf value bigger than 0.01. For 5d106s26p6d → 5d96s26p26d, there were 1506 transitions in the calculation, 591 of them with a gf value bigger than 0.01. For 5d106s26p7p → 5d96s26p27p, there were 860 transitions in the calculation, 297 of them with a gf value bigger than 0.01. For 5d106s26p7s → 5d96s26p27s, there were 123 transitions in the calculation, 69 of them with a gf value bigger than 0.01.
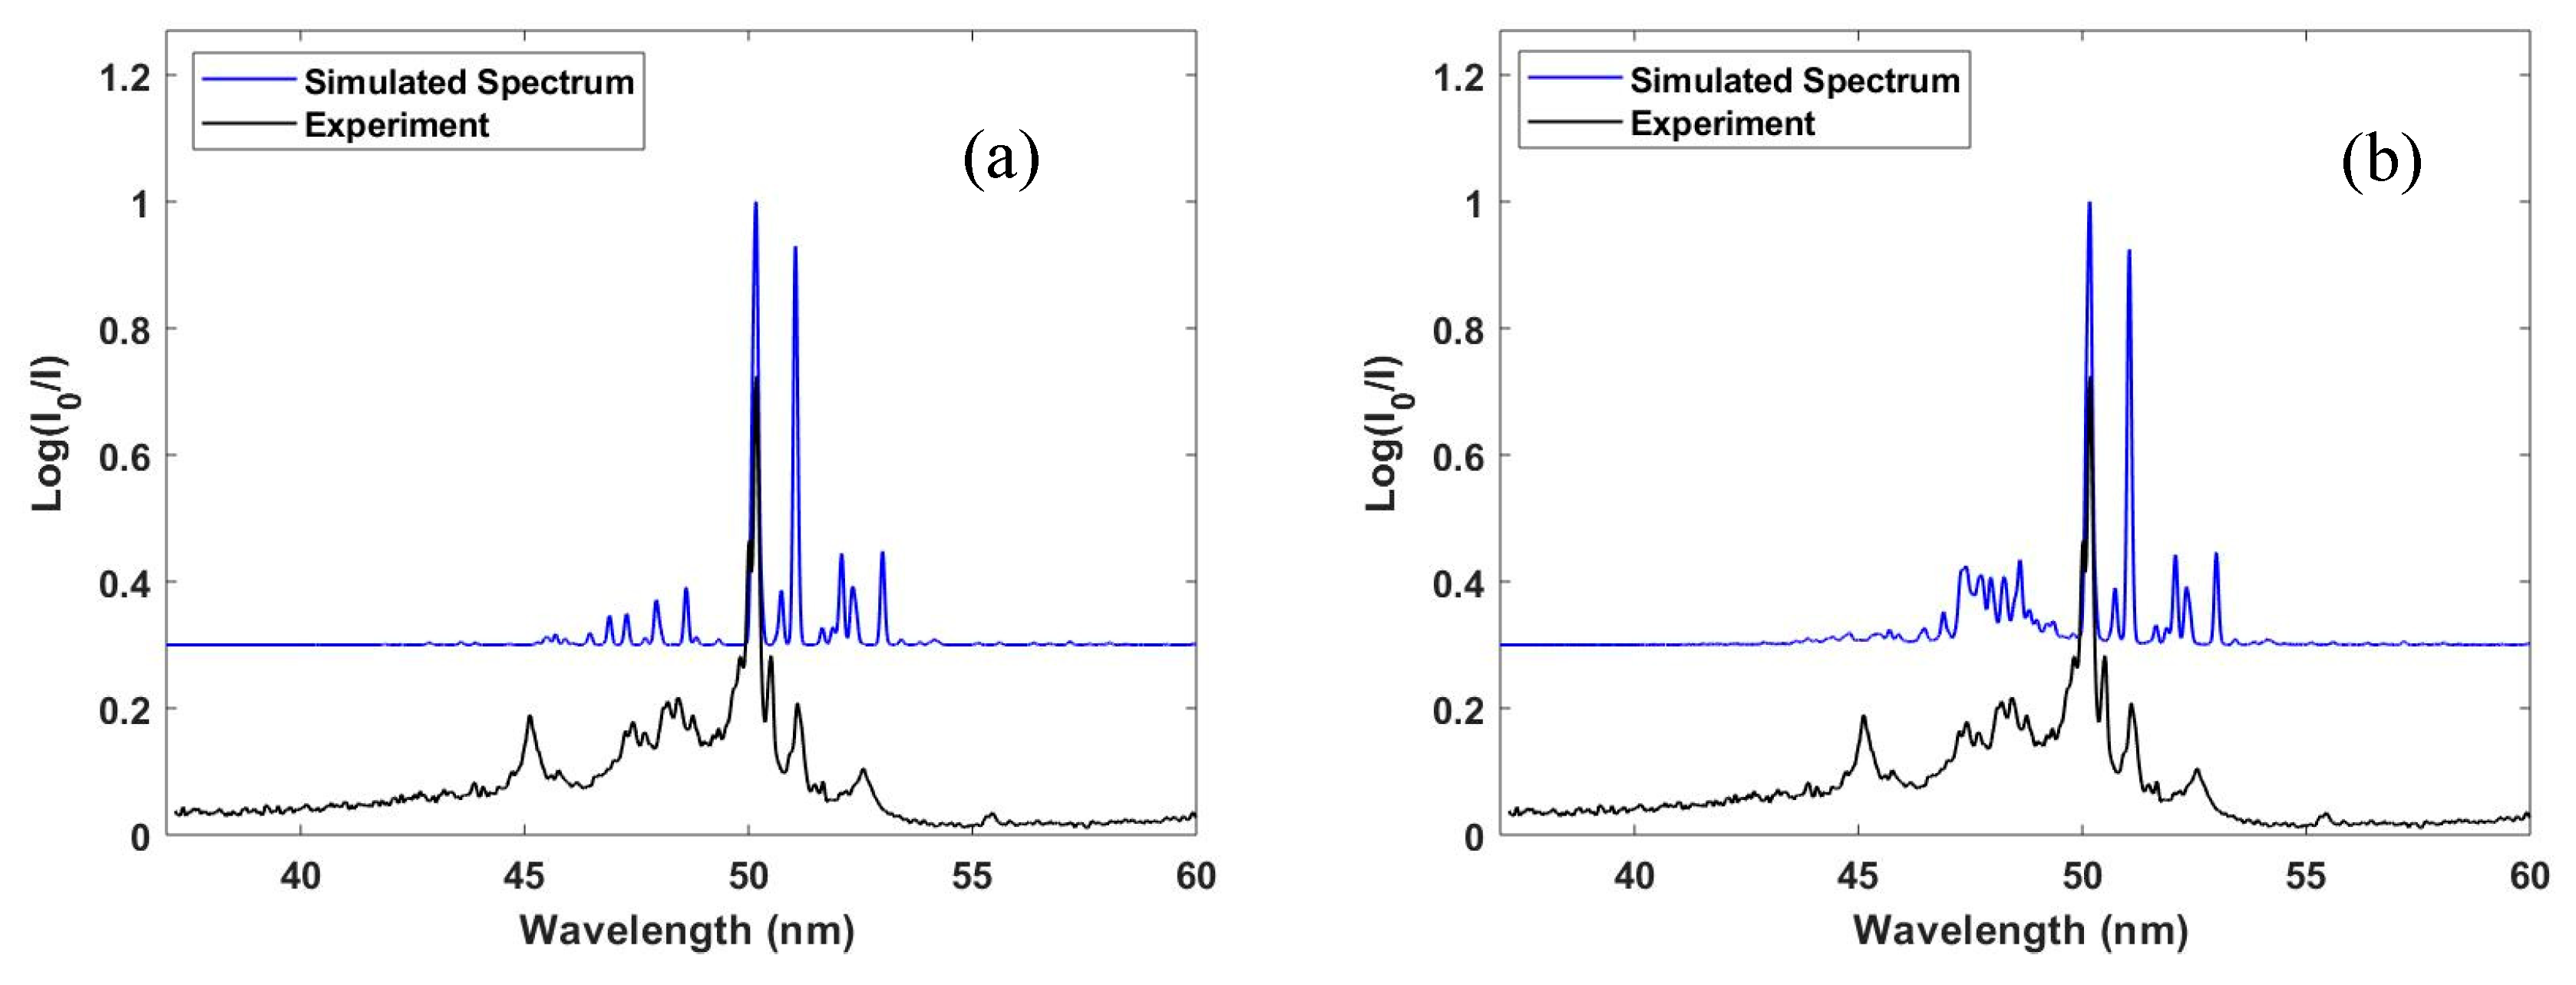
In Figure 3, we show the measured photoabsorption spectrum of Bi+ compared with synthetic spectra built from the convolution of the gf values with a Gaussian function (0.045 nm FWHM), chosen to represent the spectrometer instrument function. In Figure 3a, the simulation included photoabsorption from the ground electron configuration only. The resulting synthetic spectrum exhibited reasonable agreement with the experimental data. The relative heights and positions of the overall spectrum and some discrete features were reproduced by the calculation, specifically, the discrete photoabsorption features at 50.02 nm (5d106s26p2 (1S) 1D2 → 5d96s26p3 (2D) 1D2), 50.18 nm (5d106s26p2 (1S) 1D2 → 5d96s26p3 (2D) 1F3) and 51.08 nm (5d106s26p2 (1S) 3P2 → 5d96s26p3 (4S) 3D3). As shown in Figure 2, there were features in the 47–50 nm region due to the 5d → 6p transitions from excited states of Bi+. Specifically, there were quite strong features in the 48.01–48.85 nm and 47.15–47.82 nm spectral regions. Some of the most intense of these transitions are listed in Table 2. In Figure 3b, we added contributions due to photoabsorption from these low-lying excited states to Figure 3a. The gf values for the associated transitions were multiplied by a small factor (5%) before including them in this synthetic spectrum. This in line with the low plasma temperature alluded to the above. It is clear that the transitions did indeed make a small but finite contribution to the overall spectral distribution.
4. Conclusions
To conclude, the rather unexplored spectral region (37–60 nm) of the Bi+ spectrum was investigated. The 5d → 6p transitions, arising from levels associated with the ground state electron configuration, were identified as the dominant contributors to the observed spectrum. The experimental findings were complemented by theoretical calculations performed with the aid of the Cowan suite of atomic structure codes. Using the computed data, the synthetic spectrum of Bi+ was constructed in the spectral region of interest and reproduced the overall shapes and some of the discrete features of the experimental spectrum quite well. Importantly, 5d → 6p transitions from low-lying excited states are believed to make a small but finite contribution to the Bi+ spectrum for our experimental conditions, mostly in the 47–50 nm spectral range.
Author Contributions
Data curation, H.L. and P.H.; formal analysis, H.L. and L.V.; writing—original draft preparation, H.L. and L.V.; writing—review and editing, P.H., E.T.K., J.-P.M. and J.T.C.; analytical calculations and visualization, H.L.; supervision, J.T.C. All authors have read and agreed to the published version of the manuscript.
Funding
The work is supported by the Education, Audio-visual and Culture Executive Agency (EACEA) Erasmus Mundus Joint Doctorate Programme EXTATIC, Project No. 2012-0033, Sustainable Energy Authority of Ireland (SEAI) Grant No. 19/RDD/556 and Science Foundation Ireland (SFI) Grant Nos. 19/FFP/6956 and 13/SIRG/2100. The work is associated with EU H2020 COST Action No. CA17126 (TUMIEE).
Acknowledgments
The authors gratefully acknowledge the support from the listed funding.
Conflicts of Interest
The authors declare no conflict of interest.
References
- Larsson, M.; Geppert, W.D.; Nyman, G. Ion chemistry in space. Rep. Prog. Phys. 2012, 75, 066901. [Google Scholar] [CrossRef]
- Cardelli, J.A.; Federman, S.R.; Lambert, D.L.; Theodosiou, C.E. Ultraviolet Transitions of Low Condensation Temperature Heavy Elements and New Data for Interstellar Arsenic, Selenium, Tellurium, and Lead. Astrophys. J. 1993, 416, L41. [Google Scholar] [CrossRef]
- Leckrone, D.S.; Johansson, S.G.; Wahlgren, G.M.; Brage, T.; Proffitt, C.R. Atomic Data Requirements for the Analysis of Chemically Peculiar Spectra. In Highlights of Astronomy; Andersen, J., Ed.; International Astronomical Union/Union Astronomique Internationale: Paris, France, 1998; Volume 11B, pp. 650–652. [Google Scholar]
- Wahlgren, G.M.; Brage, T.; Brandt, J.C.; Fleming, J.; Johansson, S.; Leckrone, D.S.; Proffitt, C.R.; Reader, J.; Sansonetti, C.J. The bismuth abundance in the hgmn stars χ lupi and hr 7775 and improved atomic data for selected transitions of Bi I, Bi II, and Bi III. Astrophys. J. 2001, 551, 520. [Google Scholar] [CrossRef]
- Higashiguchi, T.; Otsuka, T.; Yugami, O.; Jiang, W.; Endo, A.; Li, B.; Dunne, P.; O’Sullivan, G. Feasibility study of broadband efficient “water window” source. Appl. Phys. Lett. 2012, 100, 014103. [Google Scholar] [CrossRef]
- Finkenthal, M.; Lippmann, S.; Huang, L.K.; Zwicker, A.; Moos, H.W. O-shell emission of heavy atoms in an optically thin tokamak plasma. Phys. Rev. A 1992, 45, 5846. [Google Scholar] [CrossRef] [PubMed]
- Suzuki, C.; Koike, F.; Murakami, I.; Tamura, N.; Sudo, S.; Sakaue, H.A.; Nakamura, N.; Morita, S.; Goto, M.; Kato, D.; et al. EUV spectroscopy of highly charged high Z ions in the Large Helical Device plasmas. Phys. Scr. 2014, 89, 114009. [Google Scholar] [CrossRef]
- Schippers, S.; Kilcoyne, A.L.D.; Phaneuf, R.A.; Müller, A. Photoionization of ions with synchrotron radiation: From ions in space to atoms in cages. Contemp. Phys. 2016, 57, 215–229. [Google Scholar] [CrossRef] [Green Version]
- Phaneuf, R.A.; Kilcoyne, A.L.D.; Müller, A.; Schippers, S.; Aryal, N.; Baral, K.; Hellhund, J.; Aguilar, A.; Esteves-Macaluso, D.A.; Lomsadze, R. Cross-section measurements with interacting beams. AIP Conf. Proc. 2013, 1545, 72–78. [Google Scholar]
- West, J.B. Photoionization of atomic ions. J. Phys. B At. Mol. Opt. Phys. 2001, 34, R45–R91. [Google Scholar] [CrossRef]
- Gharaibeh, M.F.; Bizau, J.M.; Cubaynes, D.; Guilbaud, S.; El Hassan, N.; Al Shorman, M.M.; Miron, C.; Nicolas, C.; Robert, E.; Blancard, C.; et al. K-shell photoionization of singly ionized atomic nitrogen: Experiment and theory. J. Phys. B At. Mol. Opt. Phys. 2011, 44, 175208. [Google Scholar] [CrossRef]
- Schippers, S.; Ricz, S.; Buhr, T.; Hellhund, J.; Müller, A.; Klumpp, S.; Martins, M.; Flesch, R.; Rühl, E.; Lower, J.; et al. Photon-ion spectrometer PIPE at the variable polarization XUV beamline of PETRA III. J. Phys. Conf. Ser. 2012, 388, 142016. [Google Scholar] [CrossRef]
- Kjeldsen, H. Photoionization cross sections of atomic ions from merged-beam experiments. J. Phys. B At. Mol. Opt. Phys. 2006, 39, R325. [Google Scholar] [CrossRef]
- Varvarezos, L.; Lu, H.; Costello, J.T.; Bartnik, A.; Wachulak, P.; Fok, T.; Wȩgrzyński, Ł.; Fiedorowicz, H. Soft X-ray photoabsorption spectra of photoionized CH4 and CO2 plasmas. J. Phys. B At. Mol. Phys. 2019, 53, 045701. [Google Scholar] [CrossRef]
- Varvarezos, L.; Lu, H.; Costello, J.T.; Bartnik, A.; Wachulak, P.; Fok, T.; Wȩgrzyński, Ł.; Fiedorowicz, H. Oxygen K-shell photoabsorption spectra of photoionized CO2 plasmas. J. Phys. B At. Mol. Opt. Phys. 2020, 53, 105701. [Google Scholar] [CrossRef]
- Fiedorowicz, H.; Bartnik, A.; Jarocki, R.; Rakowski, R.; Szczurek, M. Enhanced X-ray emission in the 1-keV range from a laser-irradiated gas puff target produced using the double-nozzle setup. Appl. Phys. B 2000, 70, 305–308. [Google Scholar] [CrossRef]
- Costello, J.T.; Mosnier, J.P.; Kennedy, E.T.; Carroll, P.K.; O’Sullivan, G. X-UV Absorption Spectroscopy with Laser-Produced Plasmas: A Review. Phys. Scr. 1991, 34, 77–92. [Google Scholar] [CrossRef]
- D’Arcy, R.; Costello, J.T.; McGuinness, C.; O’Sullivan, G. Discrete structure in the 4d photoabsorption spectrum of antimony and its ions. J. Phys. B At. Mol. Phys. 1999, 32, 4859. [Google Scholar] [CrossRef]
- Chakraborty, H.S.; Gray, A.; Costello, J.T.; Deshmukh, P.C.; Haque, G.N.; Kennedy, E.T.; Manson, S.T.; Mosnier, J.-P. Anomalous behavior of the near-threshold photoionization cross section of the neon isoelectronic sequence: A combined experimental and theoretical study. Phys. Rev. Lett. 1999, 83, 2151. [Google Scholar] [CrossRef] [Green Version]
- Van Kampen, P.; O’Sullivan, G.; Ivanov, V.K.; Ipatov, A.N.; Costello, J.T.; Kennedy, E.T. Dramatic changes in the 3s autoionization process at the beginning of the Ar I sequence. Phys. Rev. Lett. 1997, 78, 3082. [Google Scholar] [CrossRef] [Green Version]
- Jannitti, E.; Nicolosi, P.; Tondello, G. Photoionization and double excitation spectrum of Be2+. Opt. Commun. 1984, 50, 225–230. [Google Scholar] [CrossRef]
- Nicolosi, P.; Villoresi, P. Experimental measurement of the C II L-shell photoabsorption spectrum. Phys. Rev. A 1998, 58, 4985. [Google Scholar] [CrossRef]
- Costello, J.T.; Kennedy, E.T.; Mosnier, J.P.; Sayyad, M.H.; McGuinness, C. Extreme-UV photoabsorption spectrum of a laser-produced silicon plasma: Evidence for metastable Si+ ions. J. Phys. B At. Mol. Opt. Phys. 1998, 31, L547. [Google Scholar] [CrossRef]
- Mosnier, J.P.; Costello, J.T.; Kennedy, E.T.; Kiernan, L.; Sayyad, M.H. Even-parity autoionizing states in the extreme-ultraviolet photoabsorption spectra of Mg, Al+, and Si2+. Phys. Rev. A 1994, 49, 755. [Google Scholar] [CrossRef] [PubMed] [Green Version]
- Brilly, J.; Kennedy, E.T.; Mosnier, J.P. 2p photoabsorption spectra of valence excited configurations in Al2+ and Si3+ observed in a dual laser produced plasma experiment. Phys. Scr. 1990, 41, 30. [Google Scholar] [CrossRef]
- McGuinness, C.; Martins, M.; Wernet, P.; Sonntag, B.F.; Van Kampen, P.; Mosnier, J.P.; Kennedy, E.T.; Costello, J.T. Metastable state contributions to the measured 3p photoabsorption spectrum of Cr+ ions in a laser-produced plasma. J. Phys. B At. Mol. Opt. Phys. 1999, 32, L583. [Google Scholar] [CrossRef]
- Banahan, C.; McGuinness, C.; Costello, J.T.; Kilbane, D.; Mosnier, J.P.; Kennedy, E.T.; O’Sullivan, G.; Van Kampen, P. The 5d photoabsorption spectra of Pb III and Bi IV. J. Phys. B: At. Mol. Opt. Phys. 2008, 41, 205001. [Google Scholar] [CrossRef]
- Lu, H.; Varvarezos, L.; Alli, M.B.; Nicolosi, P.; Costello, J.T.; Hayden, P. The 5d → 6p EUV photoabsorption spectra of Pb II and Bi III: Evidence of excited states. J. Phys. B At. Mol. Opt. Phys. 2020, 53, 115001. [Google Scholar] [CrossRef]
- Dubernet, M.L.; Boudon, V.; Culhane, J.L.; Dimitrijevic, M.S.; Fazliev, A.Z.; Joblin, C.; Kupka, F.; Leto, G.; Le Sidaner, P.; Loboda, P.A.; et al. Virtual atomic and molecular data centre. J. Quant. Spectrosc. Radiat. Transf. 2010, 111, 2151–2159. [Google Scholar] [CrossRef] [Green Version]
- Dubernet, M.L.; Antony, B.K.; Ba, Y.A.; Babikov, Y.L.; Bartschat, K.; Boudon, V.; Braams, B.J.; Chung, H.K.; Daniel, F.; Delahaye, F.; et al. The virtual atomic and molecular data centre (VAMDC) consortium. J. Phys. B At. Mol. Phys. 2016, 49, 074003. [Google Scholar] [CrossRef]
- Kennedy, E.T.; Costello, J.T.; Mosnier, J.-P.; Cafolla, A.A.; Collins, M.; Kiernan, L.; Köble, U.; Sayyad, M.H.; Shaw, M.; Sonntag, B.F.; et al. Extreme-ultraviolet studies with laser-produced plasmas. Opt. Eng. 1994, 33, 3984–3993. [Google Scholar] [CrossRef]
- Meighan, O.E. XUV and VUV Photoabsorption and Emission Studies in Thorium and other High-Z Laser Plasmas. Ph.D. Thesis, Dublin City University, Dublin, Ireland, 2000. [Google Scholar]
- Cowan, R.D. The Theory of Atomic Structure and Spectra; University of California Press: Berkeley, CA, USA, 1981. [Google Scholar]
- Banahan, C. One and Two Photon Absorption of Atoms and Ions. Ph.D. Thesis, Dublin City University, Dublin, Ireland, 2009. [Google Scholar]
Figure 1.
The experimentally recorded spectrum (black) of Bi+ together with the gf values (blue) for the 5d→6p transition array, i.e., 5d106s26p2→ 5d96s26p3 transitions.
Figure 1.
The experimentally recorded spectrum (black) of Bi+ together with the gf values (blue) for the 5d→6p transition array, i.e., 5d106s26p2→ 5d96s26p3 transitions.

Figure 2.
Calculated gf values for 5d–6p transitions from low-lying, excited configurations of Bi+ compared to the observed spectrum. From top to bottom and from left to right: 5d106s6p3→5d96s6p4, 5d106s26p6d→5d96s26p26d, 5d106s26p7p→5d96s26p27p and 5d106s26p7s→5d96s26p27s.
Figure 2.
Calculated gf values for 5d–6p transitions from low-lying, excited configurations of Bi+ compared to the observed spectrum. From top to bottom and from left to right: 5d106s6p3→5d96s6p4, 5d106s26p6d→5d96s26p26d, 5d106s26p7p→5d96s26p27p and 5d106s26p7s→5d96s26p27s.

Figure 3.
A comparison between the synthetic spectra and experimental data. (a) Simulated spectrum including photoabsorption from the ground electron configuration of Bi+ only. (b) Simulated spectrum including photoabsorption both from the ground and from low-lying excited states of Bi+.
Figure 3.
A comparison between the synthetic spectra and experimental data. (a) Simulated spectrum including photoabsorption from the ground electron configuration of Bi+ only. (b) Simulated spectrum including photoabsorption both from the ground and from low-lying excited states of Bi+.


Table 1.
Ground and lowly lying electron configurations of Bi+ included in the Cowan code photoabsorption calculations.
Table 1.
Ground and lowly lying electron configurations of Bi+ included in the Cowan code photoabsorption calculations.
| Ground Configuration | Low-Lying (Excited) Configurations |
|---|---|
| 5d106s26p2 | 5d106s6p3 |
| 5d106s26p6d | |
| 5d106s26p7s | |
| 5d106s26p7p |
Table 2.
Transitions arising from lowly lying (excited) electron configurations of Bi+.
| Wavelength Region (nm) | Transitions | λ (nm) | gf Values |
|---|---|---|---|
| 48.01–48.85 | 5d106s6p3 (2D) 3D2 →5d96s6p4 (1D) 3F3 | 48.48 | 1.7998 |
| 5d106s6p3 (2D) 3D3 → 5d96s6p4 (1D) 3F4 | 48.19 | 1.3768 | |
| 5d106s26p6d (2P) 3F3 → 5d96s26p26d (3P) 3G4 | 48.29 | 1.7533 | |
| 5d106s26p6d (2P) 3F2 → 5d96s26p26d (3P) 3G3 | 48.58 | 1.0639 | |
| 5d106s26p7p (2P) 3D2 → 5d96s26p27p (3P) 3F3 | 48.29 | 2.0222 | |
| 5d106s26p7p (2P) 3D1 → 5d96s26p27p (3P) 3F2 | 48.27 | 1.1598 | |
| 5d106s26p7s (2P) 3P2 → 5d96s26p27s (3P) 3D3 | 48.21 | 2.6750 | |
| 5d106s26p7s (2P) 1P1 → 5d96s26p27s (3P) 1D2 | 48.24 | 1.7633 | |
| 5d106s26p7s (2P) 3P2 → 5d96s26p27s (3P) 3P2 | 48.05 | 1.1502 | |
| 47.15–47.82 | 5d106s26p6d (2P) 3F4 → 5d96s26p26d (3P) 3G5 | 47.75 | 2.9095 |
| 5d106s26p6d (2P) 1F3 → 5d96s26p26d (3P) 1G4 | 47.80 | 2.1086 | |
| 5d106s26p6d (2P) 3F4 → 5d96s26p26d (3P) 3F4 | 47.45 | 1.9398 | |
| 5d106s26p6d (2P) 3P2 → 5d96s26p26d (1D) 3D3 | 47.34 | 1.9009 | |
| 5d106s26p7p (2P) 3D3 → 5d96s26p27p (3P) 3F4 | 47.43 | 3.3784 | |
| 5d106s26p7p (2P) 3D3 → 5d96s26p27p (3P) 3D3 | 47.28 | 2.2064 | |
| 5d106s26p7p (2P) 1D2 → 5d96s26p27p (3P) 1F3 | 47.55 | 2.4676 |
© 2020 by the authors. Licensee MDPI, Basel, Switzerland. This article is an open access article distributed under the terms and conditions of the Creative Commons Attribution (CC BY) license (http://creativecommons.org/licenses/by/4.0/).
Share and Cite
MDPI and ACS Style
Lu, H.; Varvarezos, L.; Hayden, P.; Kennedy, E.T.; Mosnier, J.-P.; Costello, J.T. The 5d-6p VUV Photoabsorption Spectrum of Bi+. Atoms 2020, 8, 55. https://0-doi-org.brum.beds.ac.uk/10.3390/atoms8030055
AMA Style
Lu H, Varvarezos L, Hayden P, Kennedy ET, Mosnier J-P, Costello JT. The 5d-6p VUV Photoabsorption Spectrum of Bi+. Atoms. 2020; 8(3):55. https://0-doi-org.brum.beds.ac.uk/10.3390/atoms8030055
Chicago/Turabian StyleLu, Hu, Lazaros Varvarezos, Patrick Hayden, Eugene T Kennedy, Jean-Paul Mosnier, and John T Costello. 2020. "The 5d-6p VUV Photoabsorption Spectrum of Bi+" Atoms 8, no. 3: 55. https://0-doi-org.brum.beds.ac.uk/10.3390/atoms8030055
Note that from the first issue of 2016, this journal uses article numbers instead of page numbers. See further details here.