Article

Effective Decision Making: Data Envelopment Analysis for Efficiency Evaluation in the Cloud Computing Marketplaces

1
Department of Industrial Engineering and Management, National Kaohsiung University of Science and Technology, Kaohsiung 80778, Taiwan
2
The International School, Duy Tan University, Danang 50000, Vietnam
3
Department of Supply Chain Management, National Kaohsiung University of Science and Technology, Kaohsiung 80778, Taiwan
*
Authors to whom correspondence should be addressed.
Submission received: 18 August 2021 / Revised: 10 November 2021 / Accepted: 16 November 2021 / Published: 18 November 2021
(This article belongs to the Special Issue Strategic Decision Models and Applications)

Abstract

:
Assessing business performance is a critical issue for practicing managers, and business performance has always been of interest to managers and researchers. In recent years, the world has experienced a rapid growth in the cloud computing service sector thanks to its benefits to business organizations and economic development. Therefore, the performance efficiency of this sector has been concerned as one of the keys in today’s economic environment. This study aimed to assess the performance efficiency of cloud computing service providers in the United States of America, one of the biggest global markets in terms of cloud computing, by applying the data envelopment analysis models. The efficiency of cloud computing providers was evaluated based on the assumption of the non-cooperative game among cloud computing providers in which providers selfishly choose the best strategy to maximize their payoff with three stages. In the first stage, the performance of these providers over the past period was measured by a super slack-based measure. In the second stage, the performance in the future period was predicted by the new data envelopment analysis model: the past–present–future model based on resampling. In the last stage, the efficiency improvement was investigated by adopting the Malmquist productivity index. The findings of this study indicated that the percentage of inefficient providers would increase from 10% in the period from 2017 to 2020 to 20% for 2021 and 2024. Moreover, 30% of providers showed a regress in performance efficiency over the research period of 2017 to 2024. The results of this study provide an insight picture to the decision-makers, and this research will fill the gap in the literature as the first study that measures and predicts the performance efficiency of cloud computing service providers, which will provide a helpful reference for future studies.

1. Introduction

Although cloud computing has appeared since the early 2000s, many organizations were reluctant to implement it due to the technology’s lack of knowledge and trust [1]. However, the cloud computing market has experienced rapid growth in recent years thanks to the impressive development of technology and the apparent ease of use, scalability, and security from the users. Due to the advantages of cloud computing, more and more public and private sector organizations choose to test cloud workloads and even migrate everything to the cloud [2].
The COVID-19 pandemic was one of the reasons that boosted the increasing demand for cloud computing services. The coronavirus pandemic led to the sudden shutdown of almost every sector in many countries all over the world. Offices, business enterprises, and schools have been forced to shut down the offline channels and implement the online channel. People work from home; students participate in online classes; enterprises do business via the internet. That has resulted in greater demand for cloud solutions. In 2020, the market size of cloud computing was US$219.0 billion, with a growth of 13.7% compared to the average year-on-year growth during 2017–2019, and it is projected to reach $250 billion in 2021 and $791 billion in 2028 [3].
The advent of cutting-edge technologies such as artificial intelligence (AI) and machine learning (ML), as well as the increased investment by countries such as China, the United Kingdom, India, and the United States, are driving the growth of the cloud computing market. North America is the biggest market of cloud computing, with the market size reaching US $78.28 billion in 2020, which is an increase of US $8.69 billion, equal to 12.49% [3]. This market is forecasted to account for about 40% of the global cloud computing market [3].
As mentioned above, more and more organizations and firms have used cloud computing thanks to its benefits, such as decreasing operating costs and improving the flexibility of strategic decision making, thereby increasing the company’s lifespan and resilience [4]. In addition to benefiting firms, the cloud computing sector also has an outstanding contribution to national economic development. In 2012, cloud computing contributed around US $165 billion (1.04%) of added value to the US gross domestic product (GDP). It also supported nearly 1.7 million American jobs. This sector is expected to increase US GDP. In the next ten years, it will grow by approximately US $2 trillion [5]. This sector was found to contribute a total of €763 billion in added to value five European countries—Spain, France, Italy, Germany, and the United Kingdom—from 2010 to 2015 and created almost 2.4 million jobs during this period by promoting the expansion of an existing business, doing new business, reducing costs and indirect impact [5]. These benefits mainly come from developing existing businesses, launching new businesses, cost savings, and side effects. The study of Deloitte [6] in 2018 revealed that Google cloud services had a meaningful impact on the economic productivity of 14 selected countries, between $300 million and $1.2 billion in large countries and $100 million to $600 million in medium-sized countries. Moreover, cloud computing is also evidenced to reduce energy consumption [7].
In the new era of communications, the benefits of cloud technology for business and economic development are increasingly obvious. Hence, the growth of this sector is very important. Therefore, the efficiency performance of cloud computing providers captured great attention. Thus, this study will focus on the performance efficiency of the top 10 cloud computing providers in the United States market—one of the biggest markets in terms of cloud computing—by applying the two-stage data envelopment analysis (DEA) model, which included the super slack-based measure model (Super-SBM) to evaluate the performance during the past period from 2017 to 2020 and the resampling past–present–future model to predict the efficiency in the future period from 2021 to 2024.
The rest of the research is structured as follows: Section 2 contains a detailed review of the literature; Section 3 introduces the research methodology; Section 4 introduces the results analysis, and the last section contains the conclusions and discussion.

2. Literature Review

There are different methods for analyzing the performance, such as the ratio analysis, the performance pyramid, the analytic hierarchy process (AHP), the stochastic frontier analysis (SFA), variable factor productivity (VFP), and the data envelopment analysis (DEA). In the past, the ratio analysis was used as the favored instrument for measuring the business performance through standard ratios groups such as activities ratios, profitable ratios, liquid ratios, etc. The ratio method is attractive because of its simple methodological perspective, and the results of ratio analysis are easy to interpret. However, this method has several notable limitations. The first notable disadvantage of ratio analysis is that it requires or assumes that all the decision-making units (DMUs) operate under conditions of similar return of scale [8]. Another limitation is that each ratio group focuses on the different activities of the business organization, not the whole operation performance [9].
Another popular method is the performance pyramid, which can avoid the limitation of the ratio method. A performance pyramid is an integrated performance method that can capture multiple perspectives [10]. Each side of the pyramid represents a hierarchical perspective of success factors, controls, and process drivers. This model pays attention to the importance of influencing internal and external factors of the implementation and allows the construction of a performance monitoring system in the pyramid floors, starting with vision organization, using both financial and non-financial indicators [11]. However, it takes a long time, and the results may not be good for the organization in any way. The model also restricts the leadership from seeing what it highlights and leaves no room for other decisions [12].
The limitation of the ratio analysis method and the performance pyramid led to the application of more sophisticated methodologies [8]. There are two basic approaches, the parametric and nonparametric ones, to measure efficiency parametric frontier models and nonparametric methods of efficiency analysis, which have become dominant in the field of efficiency analysis [13]. Parametric and nonparametric approaches have been widely applied in measuring efficiency and achieved highly correlated results in most cases [14]. In comparison, the nonparametric method is more straightforward than the parametric approach. Thus, its application has increased in recent decades, which is applied in measuring the efficiency of diversified management fields thanks to its various models that suit many different requirements of the researcher [15].
One of the most common nonparametric methods is data envelopment analysis (DEA). DEA is a mathematical technique that uses linear programming strategies to convert inputs into outputs to estimate the overall performance of an organization or similar product [13]. Since Charnes, Cooper, and Rhodes [16] first introduced the DEA-CCR model in 1978, many different DEA models have been established to deal with the requirements of researchers, such as the Window model that can deal with the small set of DMUs developed by Charnes et al. [17] in 1984 and the slack-based model (SBM) that can deal with undesirable output introduced by Tone [18] in 2003. DEA was quickly regarded as a cutting-edge performance measurement instrument. Since then, a vast and substantial number of articles have appeared, including key theoretical discoveries and an enormous number of works on DEA applications, both in the public and private sectors, to evaluate the efficiency and productivity of their activities [19]. For example, Zhang et al. [20] used the slacks-based measure DEA model to examine the environmental efficiency of the 16 listed cement enterprises in China from 2008 to 2013. Xia et al. [21] evaluated the environmental efficiency of China’s mining sector from 2007 to 2016 by the meta-frontier slacks-based measure method. The environmental performance of the top 20 industrial countries was estimated by using the data envelopment analysis model by Iqbal et al. [22]. In another research, Behera et al. [23] calculated the productivity change of the coal-based power plants in India by the Malmquist productivity index. Park et al. [24] applied the DEA window and SBM DEA model to estimate the operational efficiency of the coastal ferry sector in South Korea. The application of DEA appeared to be popular in the high-tech sector. For example, Zhang et al. [25] evaluated the efficiency of the hi-tech industry in China by applying a multi-activity network DEA. Wang et al. [26] applied two-stage DEA in the efficiency evaluation of China’s high-tech industry. Bai et al. [27] used the dynamic network SBM model in DEA to assess the efficiency of the high-tech zone in China in the post-financial crisis era. Li et al. [28] measured the innovation efficiency of the semiconductor industry in China with the application of the new DEA model. Healthcare represents the main application area for DEA. The study of Kohl et al. [29] reported that there were about 262 papers of DEA application in healthcare focusing on hospitals from 2005 to 2016. The literature proves that the DEA is a powerful method in measuring the efficiency of DMU performance in every sector.
In terms of forecasting methodology, the Grey system theory is considered to be one of the most widely used methods due to its computational efficiency [30]. The Grey model has been applied widely to forecast the outputs or productions of different fields. Numerous previous studies that applied the Grey model can be found in the literature [31,32,33,34]. Thanks to the advantages of the DEA and the Grey model, these two methods are usually combined to measure and forecast performance efficiency. The study of Wang et al. [35] presented an integrated approach by combining the super slack-based model and the Grey model GM(1,1) to evaluate and predict the energy consumption efficiency of 25 different countries in the world. Chen and Chen [36] applied the Malmquist productivity index (MPI) and the Grey model GM(1,1) to investigate and forecast the operation performance of the Taiwanese wafer fabrication firms. Carboni and Russu [37] used a combination of the DEA with the Grey model to measure and predict the local economy and environmental efficiency in Italy. Wang et al. [38] assessed the performance of major Asian airline companies by combining the Grey model GM(1,1) and the DEA Window model. However, this integrated method required sophisticated steps and a large database, which is necessary to make a base for forecasting by the Grey method.
In 2016, Tone [39] proposed the model in DEA based on resampling that enables the researchers to evaluate and forecast the efficiency at the same time. In previous research, Wang et al. [40] applied this DEA resampling model to estimate the macroeconomic performance of 17 economies (12 Asian developing countries and five developed countries) from 2013 to 2020. The research shows that DEA resampling is an effective model for predicting and measuring the performance of multiple decision-makers. Chiu et al. [41] introduced the combination of the merger potential gains model and the resample past–present–future model to evaluate the performance of the financial industry in Taiwan. Wang et al. [42] applied the newly developed DEA resampling model to evaluate the profitability of Vietnamese commercial banks. The results of these studies supported the feasible application of the new DEA method proposed by Tone [39] not only in measuring but also in forecasting the efficiency of decision making without the need of combining two separate methodologies, such as DEA and the Grey model.
In recent years, measuring the efficiency of cloud computing service providers has newly captured researchers’ attention due to the significant development of technology and the consequence of the COVID-19 pandemic. For example, Azaidi et al. [43] in 2019 proposed the network DEA method as a tool to evaluate the efficiency of the 18 cloud service providers. The results of this research indicated that DEA could effectively measure the efficiency of this industry. Another study by Azadi et al. [44] in 2021 also assessed the sustainability of 30 cloud computing service providers with the application of DEA. One considerable research on this topic is the work conducted by Subirats and Guitart [45]. They evaluated and forecasted the energy efficiency of cloud computing platforms. However, most of the related studies found in the literature focused on analyzing the benefits and the challenges of adopting cloud computing in organizations, the efficiency of cloud computing [46,47,48,49], and many other studies concentrating on the advantages, difficulties, and opportunities related to cloud computing can be found in the literature. On the contrary, there are very few studies on the utility of DEA in cloud computing.
An increasing quantity of businesses and organizations around the world use cloud computing offerings to enhance their performance inside the aggressive marketplace. Measuring the performance helps to understand these providers’ behavior and provides a guideline to improve performance. However, it is challenging to evaluate service industry performance such as cloud computing because of the unbalancing service quality and resource usage, which is closely related to game theory. Game theory is known as the practice of simulating strategic interaction between two or more players [50]. Game theory is used in many different fields to analyze players’ strategic decisions in two cases: cooperation and competition [50]. In the technology field, Teng and Magoulès [51] in 2010 tackled the resource allocation issue in cloud computing by game theory. Riahi and Riahi [52] in 2018, Ghosh [53] in 2020 evaluated the energy efficiency in wireless systems by applying game theory. Azadi et al. [43], in 2019, measured the efficiency of cloud service providers using DEA with a game theory base.

3. Research Methodology

3.1. Research Flow

The DEA past–present–future based on the resampling model is applied to measure and predict the performance efficiency of cloud computing service providers in the United States. The historical data in the period of 2017 to 2020 are used to measure the actual performance of these biggest ten providers. Then, the authors apply the resampling of the past–present–future model to analyze future results from 2021 to 2024. The process of carrying out this research consists of four main stages:
Stage 1The background of the research: This section firstly proposes research questions. The authors learn about the reality of the cloud computing sector in the United States and identify limitations and motivations to promote development. Some theories and business data related to the selected topic are investigated in this part.
Stage 2Data description: In order to achieve the goals of the research, it is necessary to collect data. This stage includes data collection and selection of input and output. In the first step, the authors collect the sample cloud computing service providers in the US market. The target providers have a meaningful influence on this research cloud computing sector, and their financial statements were published at least from 2017 to 2020. After that, input/output factors are selected before applying and implementing DEA models in the next stage. The choice of analytical factors is extremely important because it affects the evaluation results. Therefore, the appropriate inputs and outputs are carefully considered in the second step based on the literature review.
Stage 3Research analysis: The authors apply an integrated DEA model to measure and assess the forecasting efficiency of US cloud computing providers. Selecting the suitable performance evaluation model provides accurate, in-depth analysis results, which help answer the question of this study. Among the set of DEA models, the super slack-based measure (Super-SBM) model and the Malmquist productivity index (MPI) are chosen based on their advantages over other DEA methods [54,55]. First, the Super-SBM model is applied to analyze the performance of 10 cloud computing corporations in the United States from 2017 to 2020. Afterward, the performance efficiency over the future period of 2021 to 2024 is predicted by applying the resampling method. In the last step, the MPI is employed to estimate the productivity changes from 2017 to 2024.
Stage 4Conclusions and discussion: The results of the Super-SBM model, resampling, and Malmquist model provide valuable insights for the US cloud computing sector. The authors will also make some suggestions in this section.

3.2. Super-SBM Model

Tone [55] developed the Super-SBM model from DEA in 2002, which was modified from the slacks-based measure model. The research assumes that there are n DMUs and each DMU j ( j = 1 , , n ) has m input factors and g output factors. The input and output matrices can be defined as X = ( x i j )     R m × n and Y = ( y i j )     R g × n , respectively. While λ is a non-negative vector in R n , the vectors s   R m and s + R g represent the excessive input and insufficient output of the expression, which is referred to as slacks. In fractional form, the SBM-DEA model to evaluate the efficiency of DMU k is as follows:
min ρ = 1 1 m i = 1 m s i / x i k 1 + 1 g i = 1 g s i + / y i k
subject to:
x k = X   λ + s y k = Y   λ s + λ   0 ,   s 0   a n d   s + 0 .
In this study, the authors consider the super-efficiency problem under the assumption of ρ *   = 1 , S * = 0 and S + *   = 0; the inputs are assured, and the output is constant in the optimal solution; the DMU ( x k , y k ) is defined as the SBM efficient model. The efficiency with which the SBM is estimated ranges from 0 to 1.
The Super-SBM model is introduced by Tone [55] in 2002 for separating and ranking these efficient DMUs. If   ρ * = 1 , then the DMU ( x k , y k ) is efficient, and the Super-SBM model can be described as follows:
min δ = 1 m i = 1 m x ¯ i / x i k 1 g i = 1 g y ¯ i / y i k
subject to:
x ¯ j = 1 ,   j k n λ j x j y ¯ j = 1 ,   j k n λ j y j x ¯ x k ,   0 y ¯ y k ,   λ 0 .
Suppose y r k ≤ 0. y r + ¯ , and y r + ¯ will be defined by:
y ¯ r + = max j = 1 , , n { y r j | y r j > 0 } ,  
y ¯ r + = min j = 1 , , n { y r j | y r j > 0 } .  
If the output r has no positive factors, then it is denoted as y ¯ r + = y ¯ r + = 1. The elements in the objective function are replaced by s r + / y r k   as follows, whereas the value y r k never changes.
If   y ¯ r + > y ¯ r + ,   subjected   to :   s r + / y r + ( y ¯ r + y r + ) y ¯ r + y r k
If   y ¯ r + = y ¯ r + ,   subjected   to :   s r + / ( y ¯ r + ) 2 B ( y ¯ r + y r k )
DEA-solver has a B-Score of 100. In any situation, the suggestions are constructive and exceedingly tight   y r + . It is also related to the size of the unsupported output and is inversely proportional to the distance   y ¯ r + y r k . The resulting score is constant concerning the unit of measurement; it does not depend on the unit of measure used.

3.3. Resampling Model

When analyzing the performance of any DMU, Chang et al. [56] stated that it is critical to consider the history, present record, and future potential. However, if the history, current record, and future production are all taken into consideration, it is necessary to integrate diverse methodologies, such as integrating the data envelopment analysis and Grey model. In order to cope with this issue, Tone [39] submitted a model in DEA called resampling past–present and resampling past–present–future based on the resampling method. Based on the super slack-based measure model, the past–present model measures the confidence interval of the DEA score during the past and present time structure, and the past–present–future model is expanded to this past–present model.

3.3.1. Past–Present Model

Let us suppose ( X t ,   Y t ) (t = 1, …, T) is a historical input and output matrix where t = 1 is the first recognized period, and t = T is the last recognized period with the input vector X t = ( x 1 t ,   , x n t ) ( x j t     R m ) and the output vector   Y t = ( y 1 t ,   ,   y n t ) ( y j t     R g ), and the number of DMU is n.
To achieve efficiency in the first stage, the authors employ the Super-SBM model. This model was used in this study because it is not constrained by unity ( 1) and so makes studying efficient DMUs more challenging [39].
In the next step, the weight is determined based on the decision-maker’s perspective and knowledge of how the past should affect the present. The weight chosen by Tone [39] was applied for this paper: the W t for a time period t, under the assumption that more recent periods provide information that is more important to estimating current efficiency scores. Thus, the following Lucas number series ( l 1 ,   , l t ) , is a candidate where   l t + 2 = l t + l t + 1 ( t = 1 , , T , T 2 ; l 1 = 1 ,   l 2 = 2 ) . Let L stand for the total of the series: L =   t = 1 T l t . Then, the weight W t is as follows:
W t = l t L ( t = 1 , , T ) .
Finally, the confidence interval is calculated using a bootstrapped replica of historical data. Since replicas are typical of the dataset, a preliminary examination of the data should be performed to determine dataset characteristics [39]. The replicas should be rejected and resampled if they are not representative of the dataset. The hypothesis test or confidence interval based on Fisher’s z transformation can be used to compare patterns in the past and present data for non-correlated and homoscedastic datasets. For the current time period data, the correlation between all pairs of inputs, outputs, and the input–output of all DMUs can be determined. Then, using Fisher’s z transformation, compute their 95% confidence intervals [57]. Based on the corresponding correlation, the resampled data will be deleted or allowed. If the relevant correlation is within this interval’s range, the resampled data is accepted; if the corresponding correlation is outside the interval’s range, the resampled data is discarded. As a result, the last period’s incorrect samples are removed from the sampling. This 95% confidence interval is optional; nevertheless, the narrower the interval, the closer the sample is to the data from the previous period [57].

3.3.2. Past–Present–Future Model

The forecast for the future, namely   ( X t + 1 ,   Y t + 1 ) , is obtained by taking the past–present data   ( X t ,   Y t ) with (t = 1, …, T) and measuring the DMU efficiency value in the future period alongside their confidence intervals [58]. The past–present time-based frame is expanded to the past–present–future time-based frame in this resampling. To do so, take the following observed data from the past–present with an exact input i (i = 1, …, m) and output r (r = 1, …, g ) of a DMU:
h t ( t = 1 , , T ) .
The h T + 1 will be predicted from h t ( t = 1 , , T ) . The trend analysis, Lucas weight analysis, and the hybrid model are three available prediction tools that are introduced to produce forecasts [39]. The estimation of the super-efficiency index for the future period is implemented after getting the forecast.

3.4. Malmquist Model in DEA

The Malmquist productivity index was launched by Caves et al. [59] in 1982 to determine the change in the efficiency of each DMU in two periods. In the research, the authors assessed the dynamic productivity trend of cloud computing providers by using the original and expanded MPI by Färe et al. [60].
The change in total factor productivity from period t to period t + 1 is calculated as the following equation [59]:
MPI t t + 1 = ρ 0   t ( x t + 1 , y t + 1 ) ρ 0   t ( x t , y t ) × ρ 0   t + 1 ( x t + 1 , y t + 1 ) ρ 0   t + 1 ( x t , y t ) .
MPI t t + 1 > 1 indicates positive DMU performance growth in the period between t and t + 1, whereas MPI t t + 1 = 1 and MPI t t + 1 < 1 indicate that the performance has no change and negative growth.
The Malmquist productivity index is broken down into two different components as the efficiency change (EC) and the technical changes (TC) by Färe et al. [60]. The efficiency change is also named the catch-up effect, reflecting the change in DMU’s efficiency, while the technical change is also named the frontier shift effect, demonstrating the fluctuation in the efficient frontier. The MPI index can be rewritten as follows:
MPI ( x t + 1 , y t + 1 , x t , y t ) = ρ 0   t + 1 ( x t + 1 , y t + 1 ) ρ 0   t ( x t , y t )   ρ 0   t ( x t + 1 , y t + 1 ) ρ 0   t + 1 ( x t , y t ) × ρ 0   t ( x t , y t ) ρ 0   t + 1 ( x t , y t ) = Efficiency   change   ( EC )   ×   Technical   change   ( TC ) .
If MPI > 1, this indicates productivity increases from period t to period t + 1. On the other hand, MPI = 1 means there is no change in productivity indexes, and MPI < 1 illustrates a productivity reduction. Since the total productivity changes are a multiplicative composite of efficiency change and technical change, the primary cause of productivity improvement is impacted by the change in efficiency and technology.

3.5. Data Collection

This research uses a database of listed companies in the cloud computing industry in the United States. After the authors searched and reviewed the completeness of data for companies in this industry, the ten largest cloud computing companies in terms of revenue were chosen to consider and investigate the performance. The list of all companies is shown in Table 1.
The selection of inputs and outputs plays a significant role in applying the DEA model. By referring to relevant literature reviews on DEA in Table 2 and examining the suitable correlation between the inputs and outputs [61], the researchers decided to choose two inputs (cost of revenue, operating expense) and two outputs (gross profit, total revenue). Figure 1 shows the operational process of cloud computing companies. These variables are defined as follows.
Inputs
(1)
Cost of revenue (I1): Cost of revenue is the total cost of manufacturing and providing products or services to consumers.
(2)
Operating expense (I2): Operating expense is expenses acquired by the company in its daily business activities. Operating costs include rent, equipment, inventory costs, marketing, wages, insurance, processing costs, and research and development funds.
Outputs
(1)
Gross profit (O1): Gross profit appears as revenue minus the cost of goods sold. Note that gross profit is not deducted from other fixed and variable expenses, i.e., rent, utilities, payroll.
(2)
Total revenue (O2): Total revenue is the total sales of products and services determined by multiplying the overall sales of goods and services by the prices of goods and services.
The data on inputs and outputs over the period of 2017 to 2020 were acquired from the National Association of Securities Dealers Automatic Quotation System (Nasdaq) [70], which published the financial statements of US public joint-stock corporations. The unit of measurement is million US dollars. The authors show the statistical data from 2017 to 2020 in Table 3.

4. Results Analysis

4.1. Efficiency Evaluation during the Past Period from 2017 to 2020

In this section, the Super-SBM model is applied to compute the efficiency scores and rank the efficiency of 10 DMUs. 
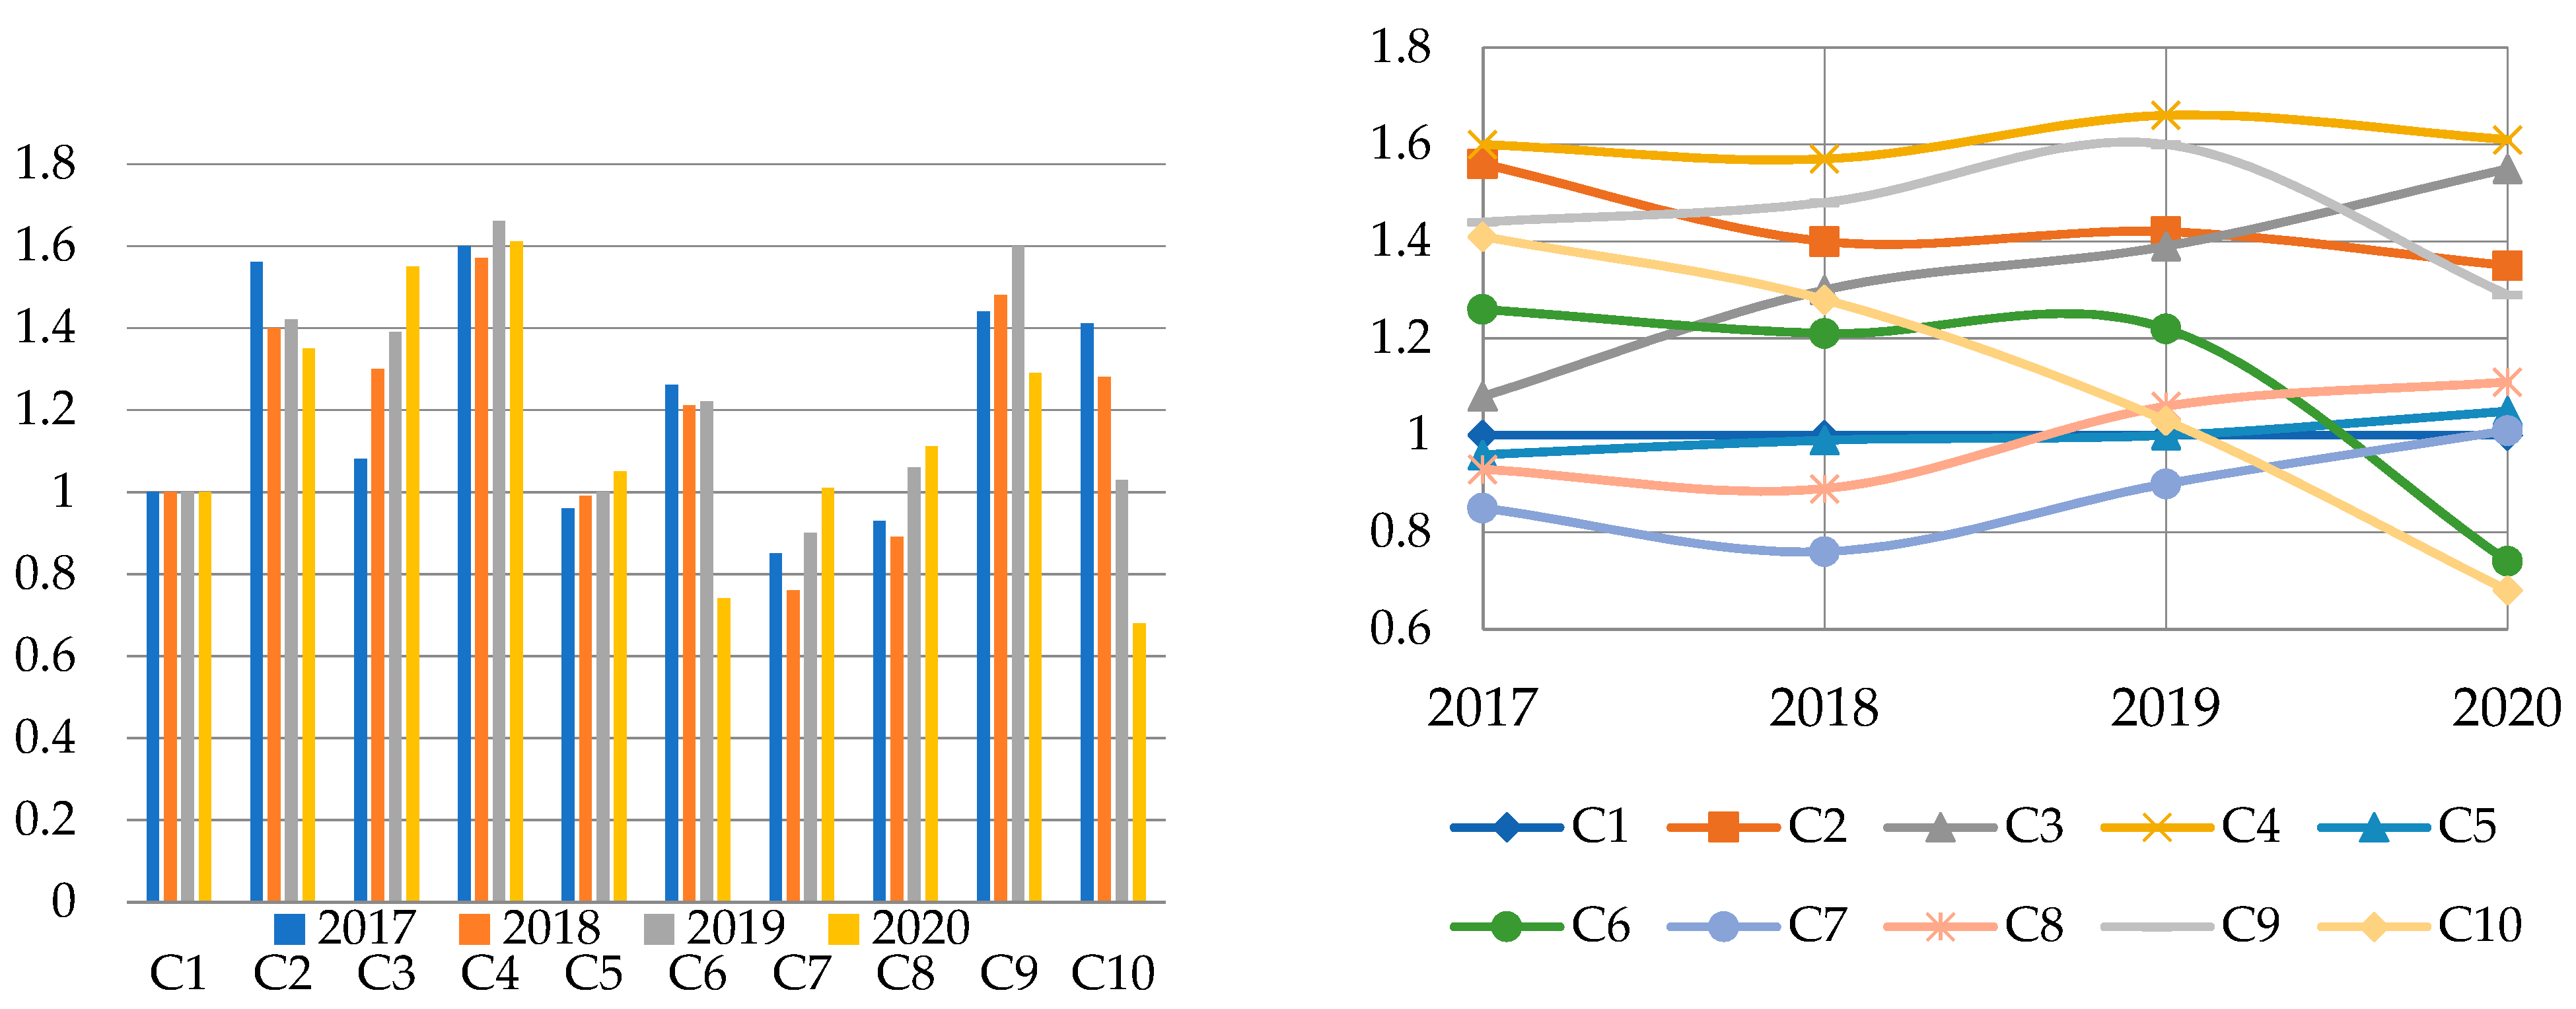
Table 4 presents the obtained scores and ranking of these DMUs over the period of 2017 to 2020, along with the illustration in Figure 2.
As observed, the efficiency scores of each DMU experienced different trends. Some DMUs remained unchanged and remained stable, such as C1-Amazon and C4-Salesforce, while the rest of the DMUs showed a notable fluctuation in efficiency scores over the period of 2017 to 2020. The results divided these ten DMUs into three groups: the stable group, the increasing group, and the decreasing group.
The efficiency score of C1-Amazon remained unchanged over four years with a score of 1. The efficiency score of C4-Salesforce slightly changed over the period. However, the change was insignificant, approximately 1% over a 4-year period and a lower than 6% year-to-year change. It was also noted that C4-Salesforce had the highest score among the ten DMUs and ranked at the first position for all four years from 2017 to 2020. From the results, it can be seen that these two DMUs controlled well the inputs and outputs over the observed period.
While the scores of C1-Amazon and C4-Salesforce were stable, the efficiency scores of the remaining eight DMUs significantly fluctuated. C2-Alphabet had a fluctuation in score with a decreasing trend from 1.56 in 2017 to 1.35 in 2020, approximately a 13.5% decrease over the period, which led to a drop in ranking from the second position among ten to the third position. The efficiency scores of C3-Microsoft, on the other hand, significantly increased with the drastic change of 43.5% from 1.08 in 2017 and ranked at the 6th position to the score of 1.55 and become the second most efficient DMU in 2020. The scores of C5-ServiceNow experienced an increasing trend of 9.4% over the period of 2017 to 2020, with the score changing from 0.96 in 2017 to 1.05 in 2020. It should be noted that C5-ServiceNow was inefficient in 2017 and 2018; then, it turned to be efficient in 2019 with a score of 1.0 and increased to 1.05 in 2020, which thanked both the increase in gross profit and the decrease in the cost of goods sold and operating expenses. C7-Dropbox and C8-Shopify experienced the same trend with C3-Microsoft and C5-ServiceNow, with the scores increasing over a 4-year period. Scores of C7-Dropbox increased from 0.85 in 2017 to 1.01 in 2020, approximately 18.8%, and the score of C8-Shopify improved from 0.93 to 1.11, about 19.4%. These two DMUs also turned from inefficient to efficient.
On the other hand, C6-Splunk, C9-Atlassian, and C10-Twilio went through the decreasing trend of 41.3%, 10.4%, and 51.8%, respectively, due to the higher cost of revenue and operating cost and also the lower gross profit and total revenue. Among these three, C6-Splunk and C10-Twilio turned from efficient to inefficient.

4.2. The Choice of Replicas Illustration

This stage demonstrates the efficiency score of ten DMUs in 2020 and then compares the actual scores of DMUs in 2020 obtained by 5000 replicas with those obtained by 500 replicas. The variation of scores by using different replicas within a 95% confidence interval was obtained by applying the past–present model, and the results are presented in Table 5. In the research, most of the results of 5000 replicas and 500 replicas were statistically negligibly small except for the scores of C10-Twilio with the difference of 0.31. Thus, 5000 replicas can be applied in the next stage.
Before conducting further analysis, the correlation analysis is assessed to ensure the appropriate inputs and outputs. The value of the correlation coefficient is always between (−1) and (+1), and if the value is near (±1), it means that there is a stronger linear relationship between factors. The results of correlation analysis reported in Table 6 confirm that the selected inputs and outputs in this study are suitable, which is proved by the high correlation between inputs and outputs.

4.3. Illustration of Selecting the Prediction Model

This section illustrates the forecasted efficiency of ten DMUs through three different prediction models in the past–present–future framework in DEA. The most appropriate prediction model is selected based on the comparison of forecasted results obtained by each prediction model with the actual efficiency scores (for the year 2020 only).
The Trend, Lucas weight, and the hybrid are three considered prediction models in this stage. The results of efficiency scores obtained by these models and the actual efficiency score of all DMUs in 2020 are compared. The comparison indicates that the results of these models were consistent with all actual efficiency of all ten DMUs were within the 95% confident interval of all three prediction models. However, the average difference between forecasted and actual scores is 24.7% with the trend prediction, 10.7% with the Lucas weight prediction, and 12.4% with the hybrid model. Therefore, the Lucas weight model is the most appropriate prediction model in this study, and it would be used to get the efficiency scores of ten DMUs in the future period from 2021 to 2024. Table 7 exposes the difference between the actual and predicted results in 2020 (predicted by the Lucas weight model).

4.4. Future Forecast Efficiency Evaluation over the Future Period of 2021 to 2024

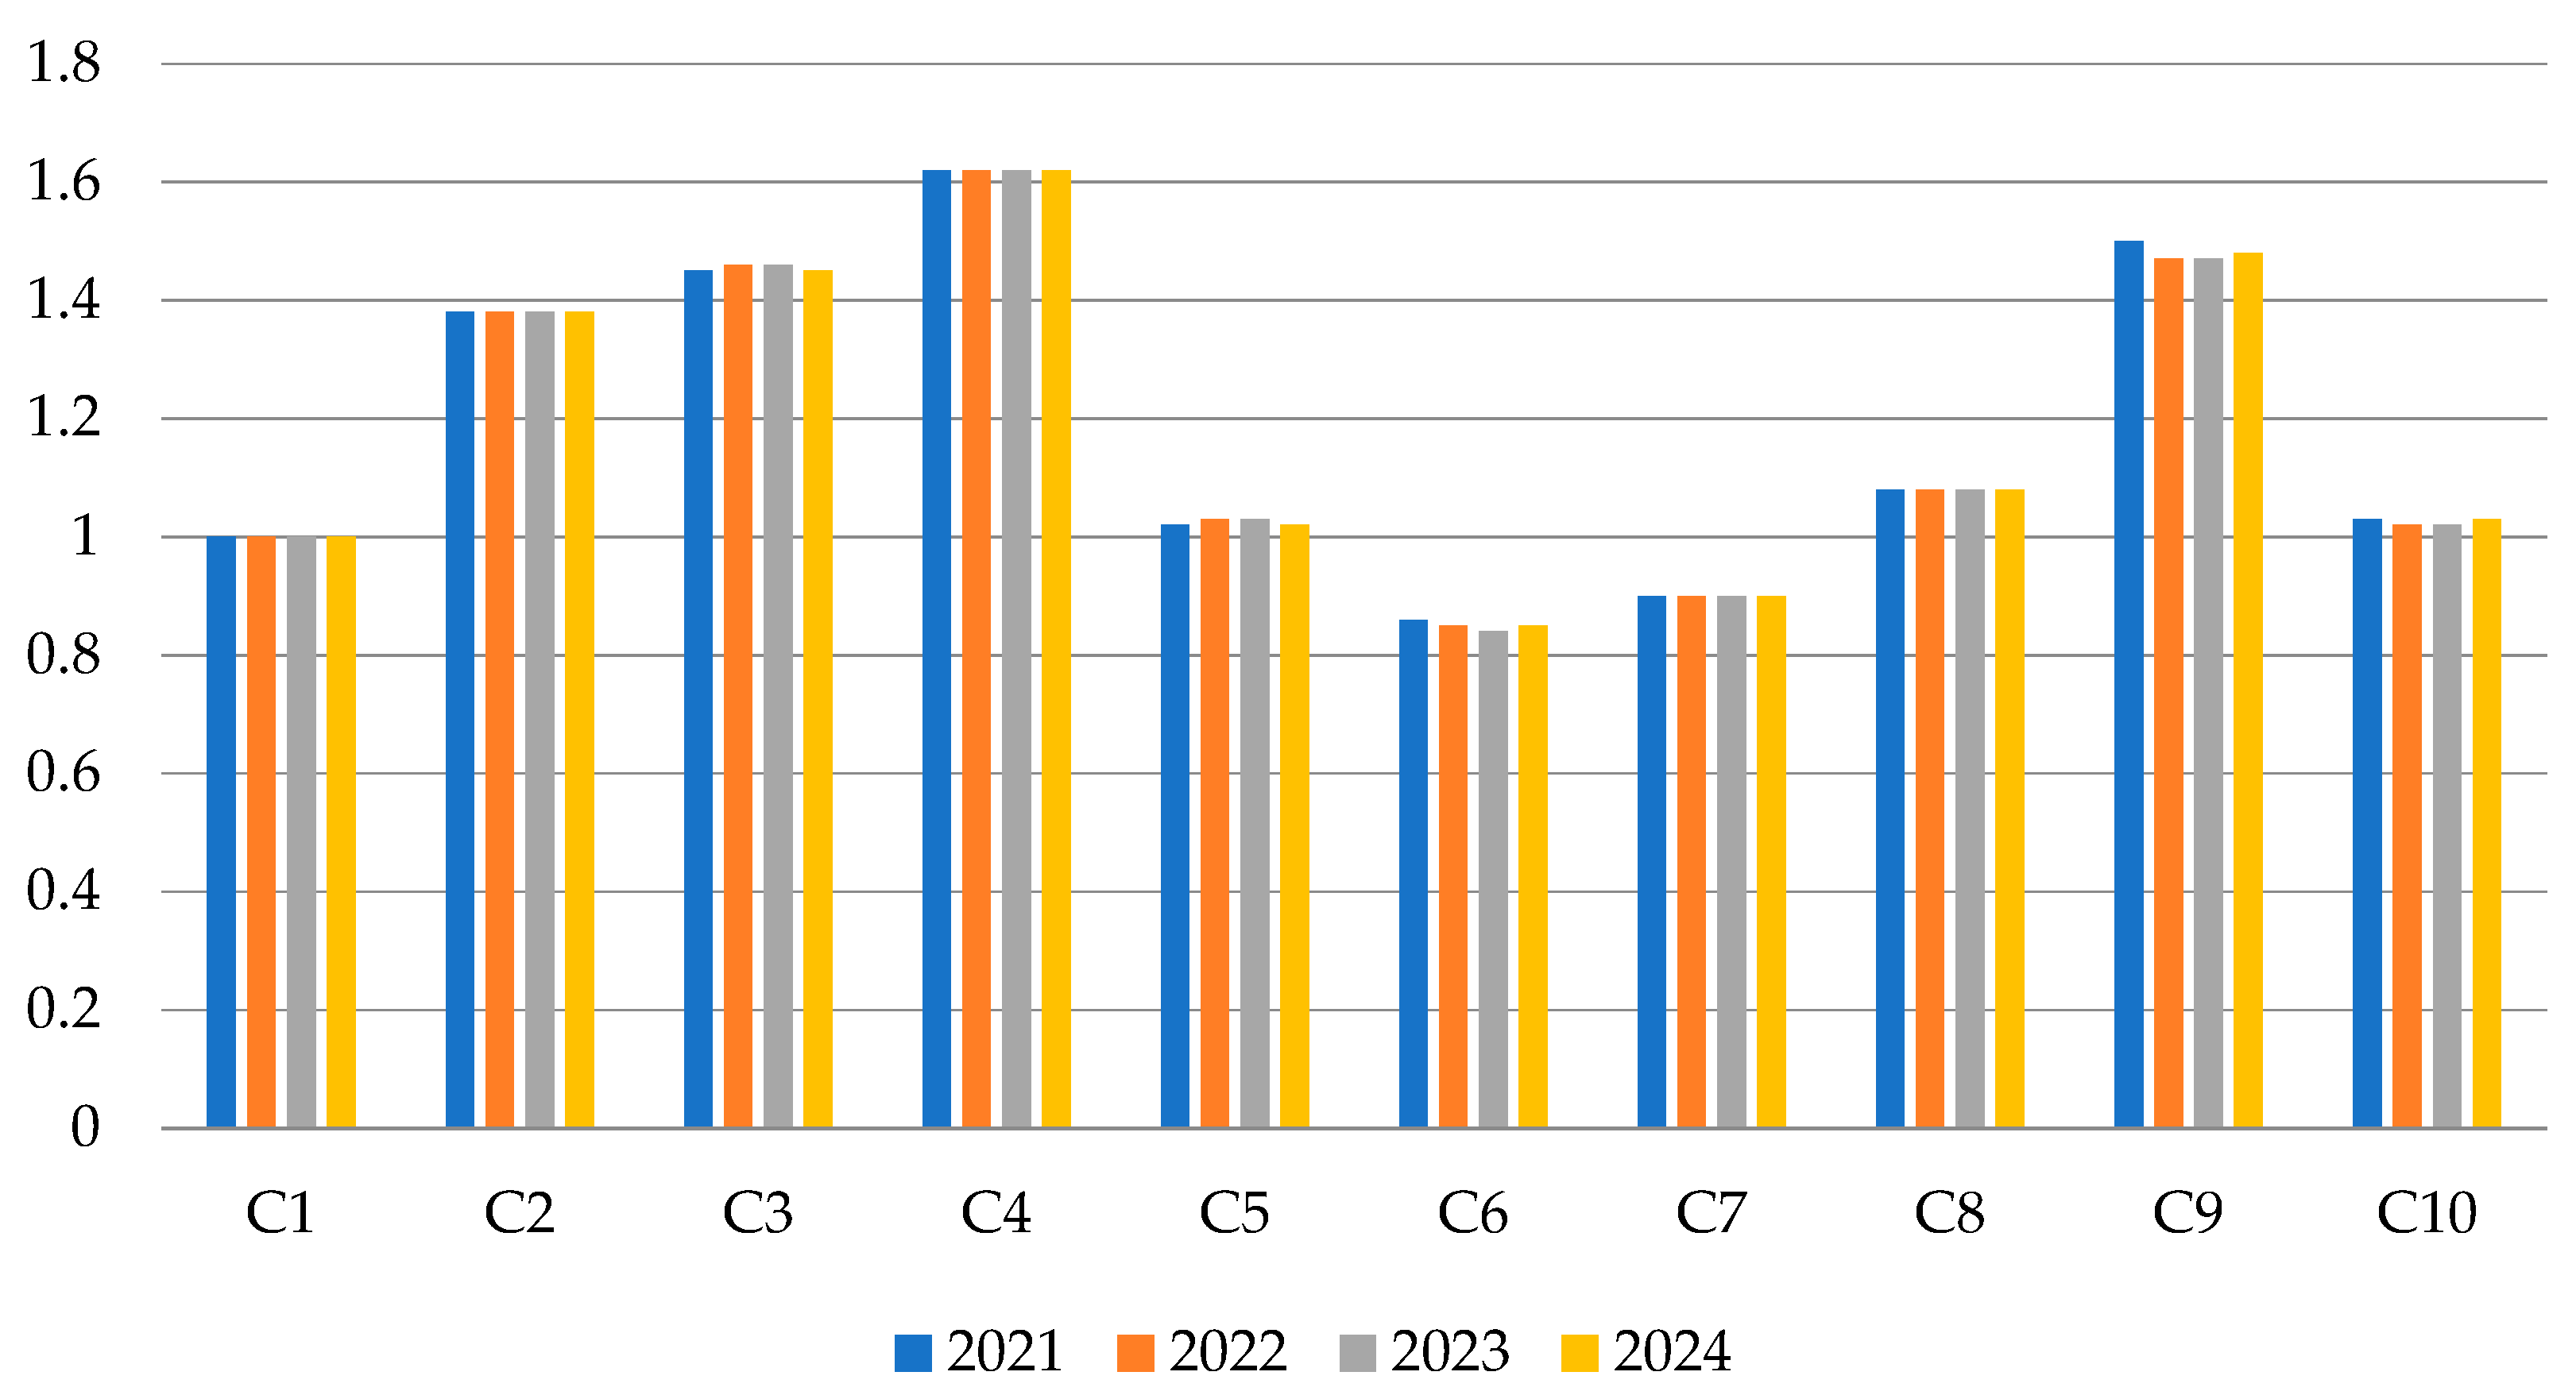
The efficiency scores of ten DMUs in the future period of 2021 to 2024 are predicted by using the past–present–future model with the Lucas weight prediction. The obtained scores are displayed in Table 8, along with the bar chart illustration in Figure 3.
The obtained scores in 4 years tend to be a stable trend corresponding with the insignificant changes in efficiency scores of all DMUs from 2021 to 2024. From 2021 to 2024, ten DMUs can be categorized into two different groups: inefficient and efficient groups. The inefficient group includes C6-Splunk and C7-Dropbox, with the corresponding efficiency score smaller than 1. On the other hand, eight DMUs are included in the efficient group as the obtained efficiency scores of those are equal and higher than 1.
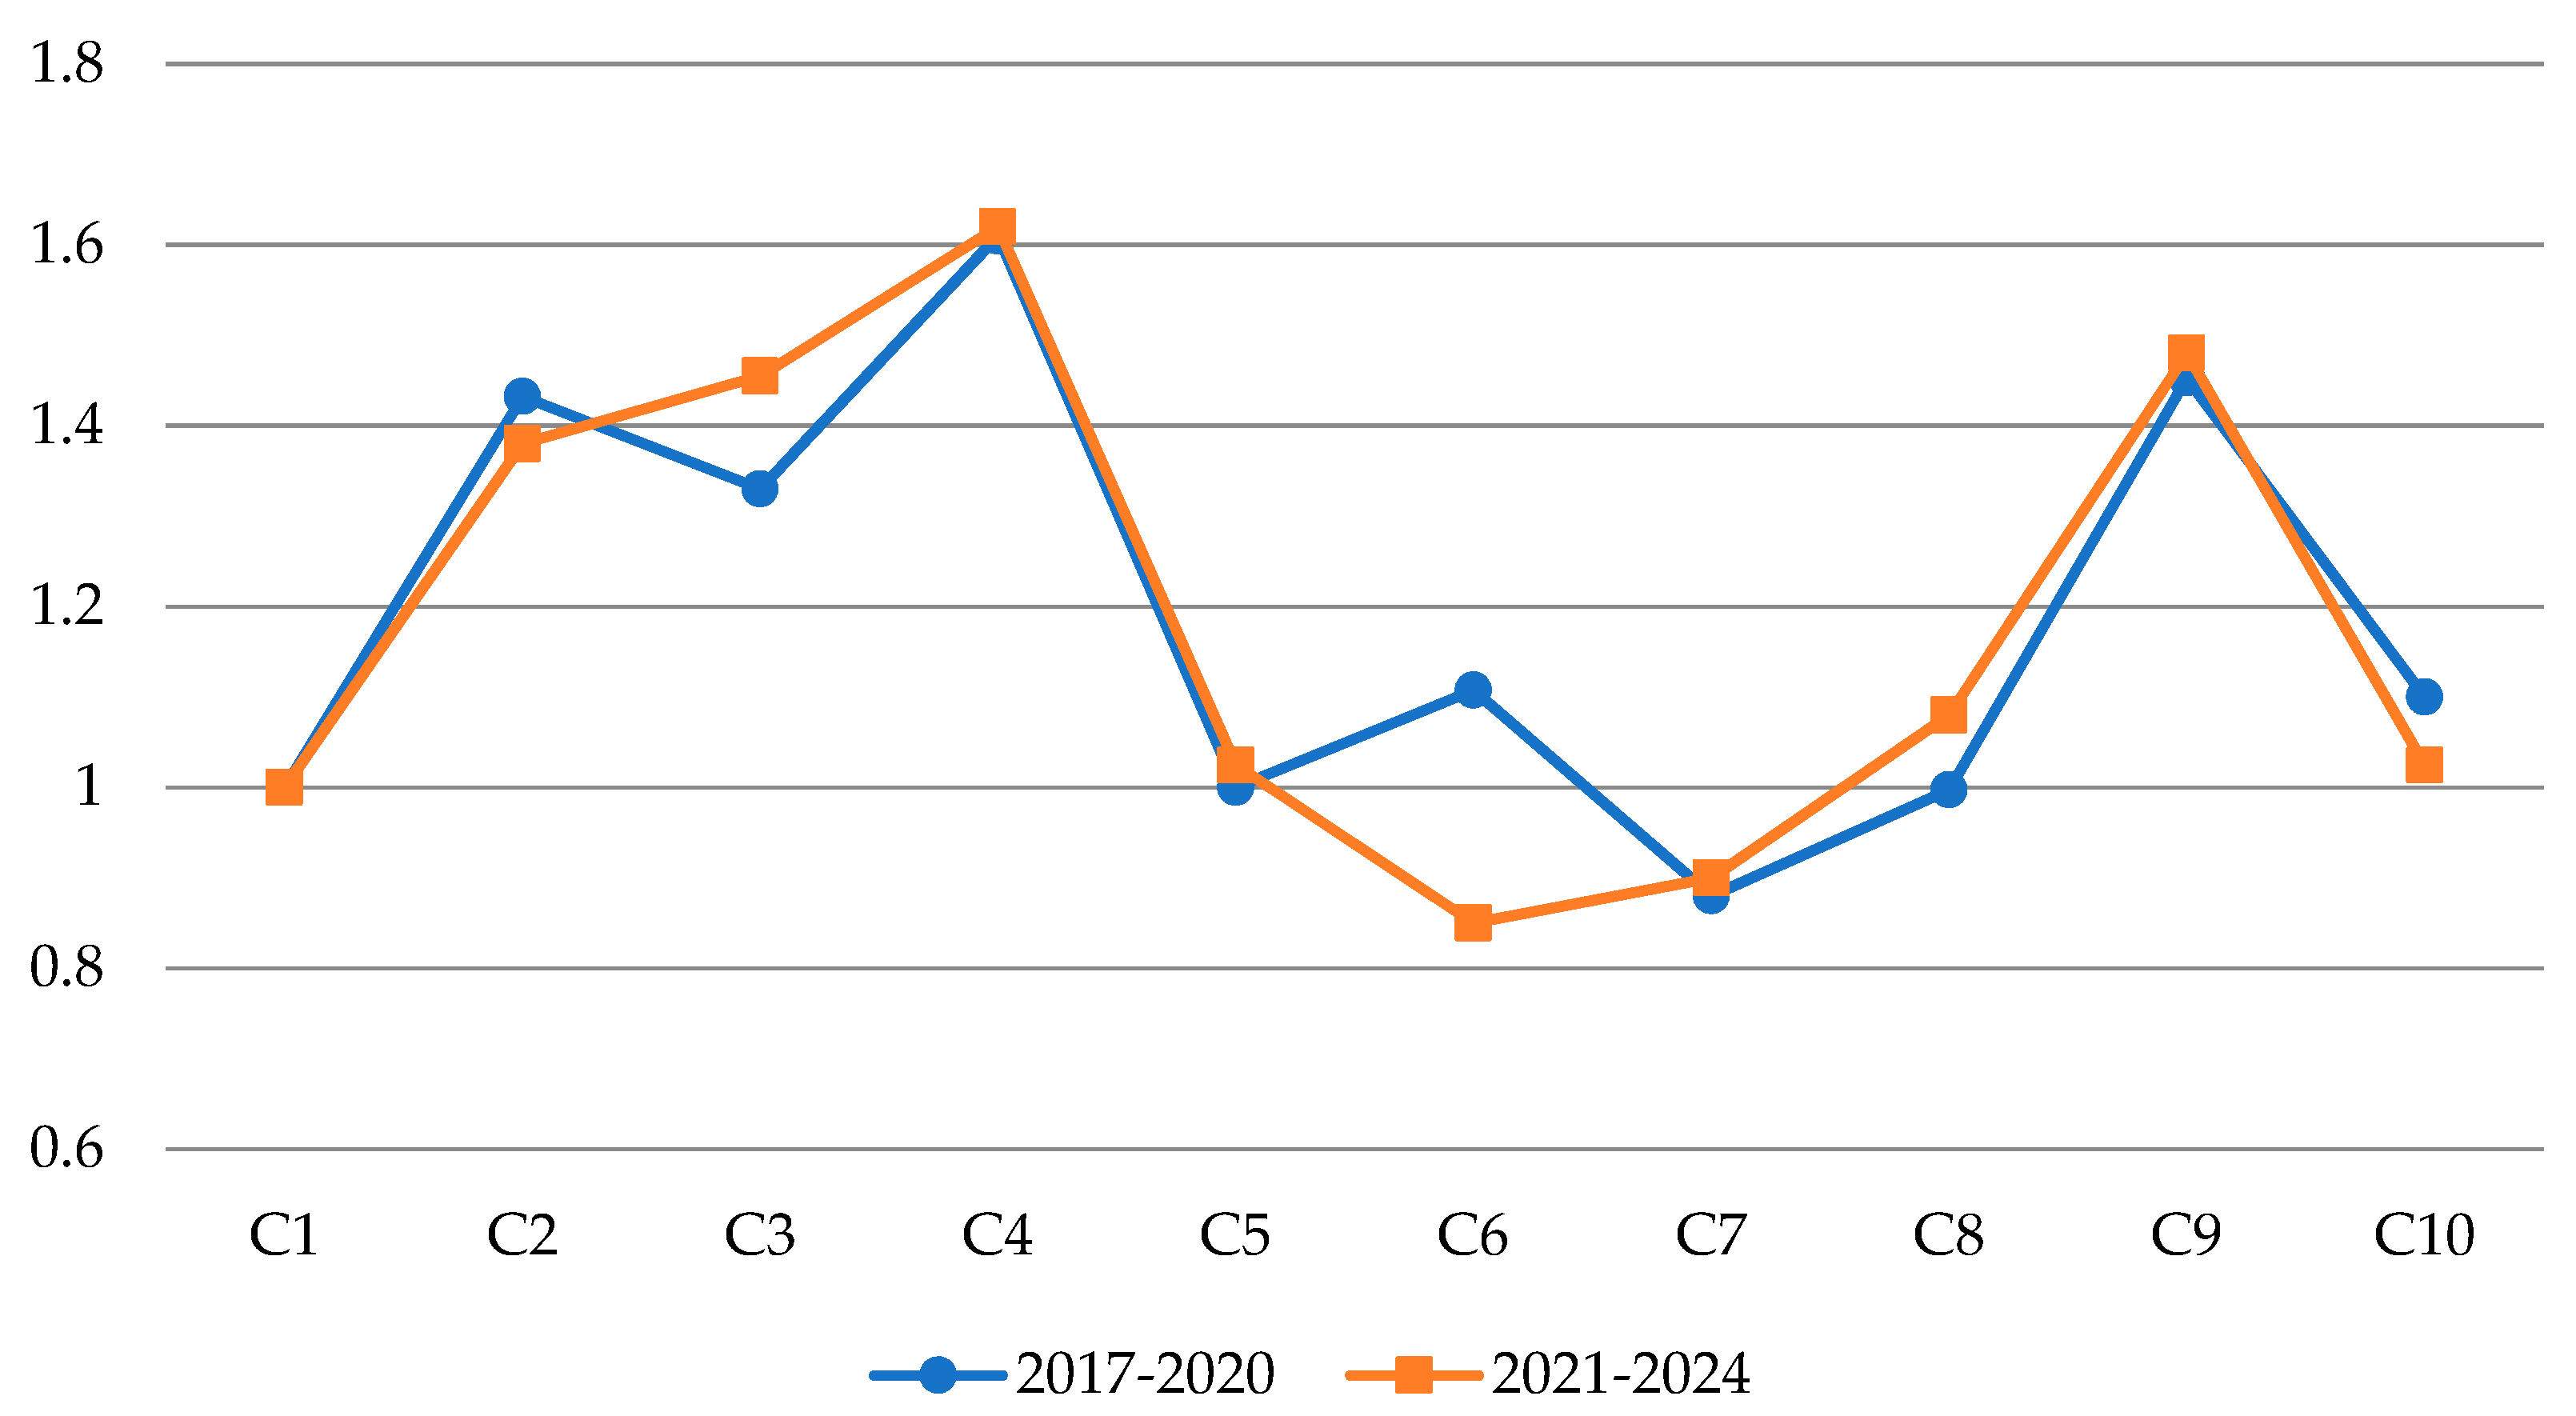
It is also notable that the average efficiency score from 2021 to 2024 is slightly higher than that from 2017 to 2020. However, the average efficiency score of C2-Alphabet and C6-Splunk from 2021 to 2023 decreased compared to those during 2017 to 2020, as can be seen in Figure 4.

4.5. Efficiency Improvement over the Research Period of 2017 to 2024

In this section, the Malmquist productivity index is applied to investigate the efficiency changes over the period of 2017 to 2024. The change in efficiency is categorized into three groups: the catch-up index measuring the efficiency changes of each DMU, frontier-shift measuring the movement of the efficiency frontier over two periods, and the MPI, which is the production of catch-up and frontier-shift. Table 9 summarizes the obtained results.
According to the catch-up scores in Table 9, three DMUs (C4-Salesforce, C6-Splunk, and C10-Twilio) showed a weakening in efficiency, with a catch-up score lower than 1. On the contrary, five DMUs (C3-Microsoft, C5-ServiceNow, C7-Dropbox, C8-Shopify, and C9-Atlassian) demonstrated progress from 2017 to 2024 with a catch-up score above 1. The rest two DMUs (C1-Amazon and C2-Alphabet) displayed no changes in the degree of their efforts attained for improving their efficiency. The results of the frontier-shift indicated the technological regress of C8-Shopify, C9-Atlassian, and C10-Twilio. The rest of the seven DMUs experienced technological progress with the corresponding frontier-shift score higher than 1. MPI is the production of catch-up and frontier-shift represents the total improvement over two time periods. The results in Table 9 indicated the efficiency improvement of seven DMUs from C1 to C7 with the MPI higher than 1. On the other hand, three DMUs (C8-Shopify, C9-Atlassian, and C10-Twilio) showed the regress with the MPI lower than 1.

5. Conclusions and Discussion

The rapid growth in the cloud computing sector, along with its importance, measuring and forecasting the performance of cloud computing providers was considered to be very necessary. Therefore, this study applied the Super-SBM and the past–present–future model in DEA based on the resampling technique to evaluate and predict the performance efficiency of ten cloud computing providers in the United States of America, which is one of the most developing markets in terms of cloud computing services.
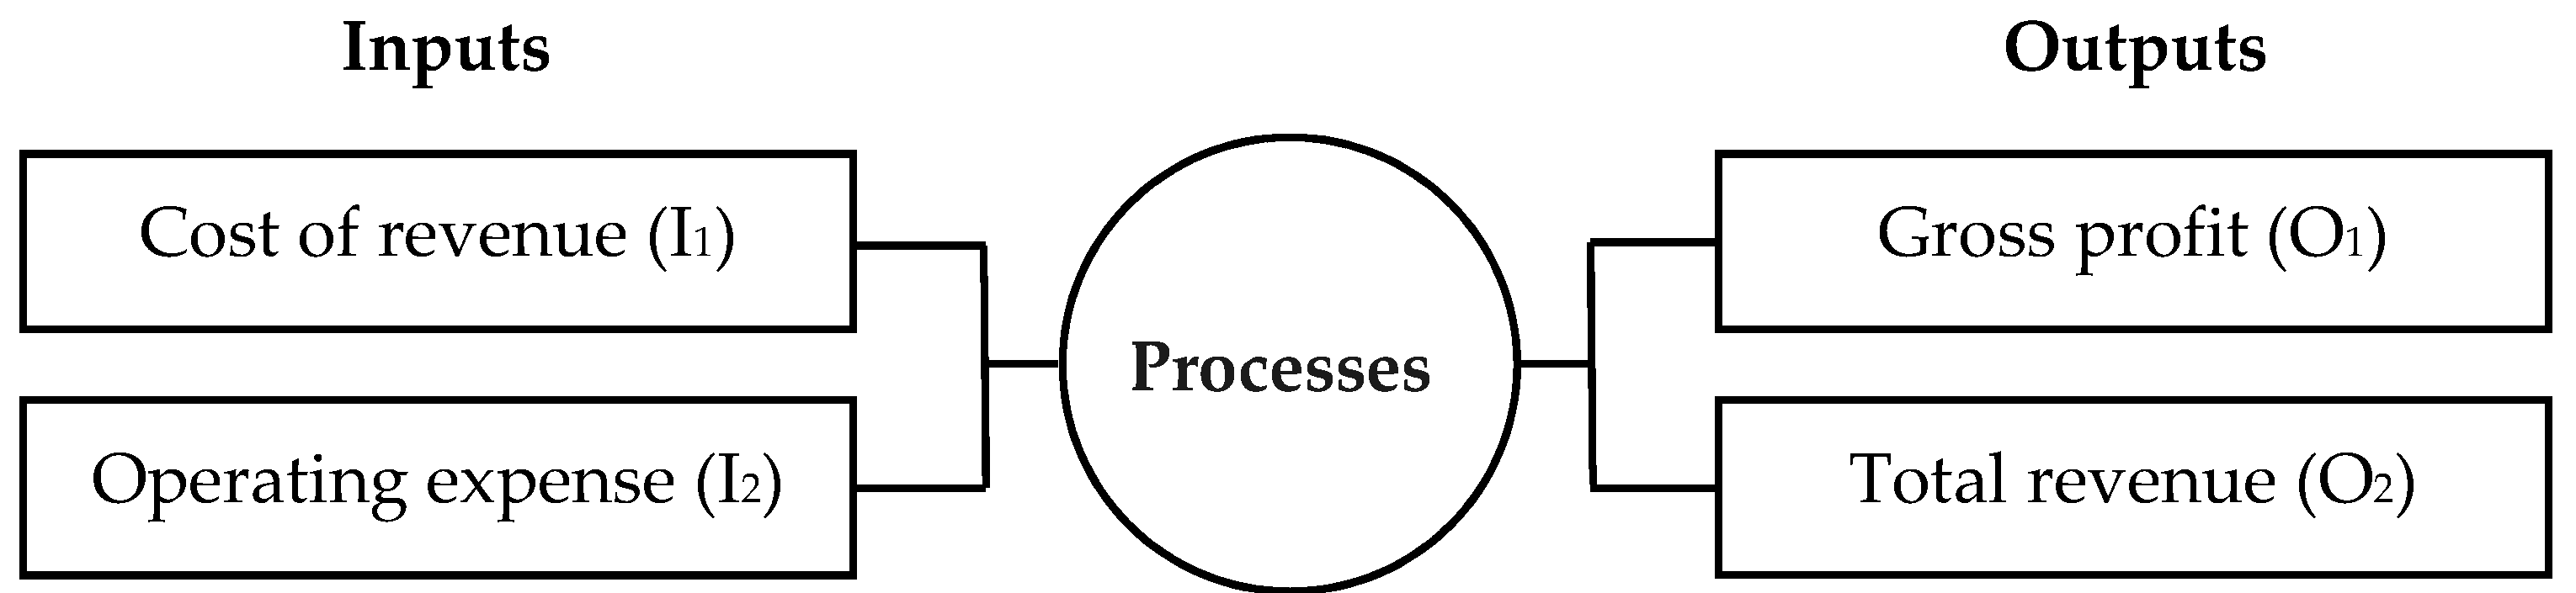
After forming the research framework, the first step was taken is to select the appropriate indicators. Since there was no related study measuring the efficiency of cloud computing providers found in the literature, the inputs and outputs of this study were selected based on reviewing the previous studies that measured the performance of service providers.
The second step was to measure the performance efficiency of ten selected providers over the past and present period (2017–2020) by applying the Super-SBM. This step found that 30% of cloud computing service providers were inefficient due to the problem in controlling the cost of goods sold, operating cost, and the capacity to generate revenues of these providers. However, when observing the whole ten providers as one, the results indicated that the cloud computing sector was efficient with an average efficiency score of 1.19 over the period of 2017 to 2020. During this period, it was also notable that most of the providers fluctuated in terms of efficiency with the corresponding unstable efficiency scores.
After assessing the performance over the past and present periods, the efficiency in the future was predicted by applying the past–present–future model in DEA that was based on the resampling method. Since accuracy was the most severe concern in forecasting, choosing an appropriate number of replicas and a correct prediction model was considered first in this step. In order to ensure the right choice of the number of resampling, 5000 replicas and 500 replicas were conducted. The results of these two were similar in most cases. However, the results of 5000 replicas and 500 replicas in the case of C10 showed a significant difference. Thus, the results of 5000 replicas were chosen. The next step was to identify the most accurate prediction model among the three available models: trend, Lucas weight, and the hybrid model. The accuracy of these three models was checked by comparing the efficiency scores calculated from each prediction model with the actual scores obtained by the Super-SBM model. The one with the smallest forecast-actual ratio would be selected. After the comparison, the Lucas weight model was the selected prediction model with the lowest difference between the forecast and actual score (10.7%). The final step was to forecast the efficiency of these ten providers by using the Lucas weight prediction model. The obtained results showed stable efficiency over the future period of 2021 to 2024. From 2021 to 2024, all providers were forecasted to perform more stably than their performance from 2017 to 2020, with the corresponding efficiency scores slightly changed. It was also noted that the average efficiency score of ten providers in the future would be slightly lower than that over the past period from 2017 to 2020. This result might be explained by the significantly increasing demand for cloud computing services in 2019 and 2020 due to the COVID-19 pandemic.
In the next step, the DEA Malmquist productivity index was used to investigate the efficiency improvement during the research period of 2017 to 2024. The results of MPI revealed that during this research period, 70% of the selected providers showed efficiency progress with an MPI value higher than 1.
The results of this study provided valuable information and practical implications to the decision-makers. The measure of the past and present performance helped better understand how efficient the firm was and how it compared to other providers in the same field. The result of forecasted efficiency helps a firm to have an insight picture of how it would perform in the future. That can help the firm make the appropriate policies and strategies to be more efficient and gain competitive advantages. Additionally, this study will fill the gap in the literature as the first study that measures and predicts the performance efficiency of cloud computing service providers, which will provide a helpful reference for future studies. However, there are still many things that need to be done in this research area. For example, this study only focused on measuring the performance in general without in detail analyzing the performance of each provider. This study applied the new approach of DEA to measure and forecast efficiency at the same time. Thus, further research can apply another forecasting technique to compare the accuracy of the forecast model. Finally, economic efficiency is not the only criterion that needs to be considered regarding the performance of the decision-making unit. In fact, there are two major issues in the cloud computing industry related to how to develop services with high levels of quality of service and maximize the benefit for the service providers. To answer these two questions, the general evaluation of the economic efficiency of cloud computing providers is critical, but there is not enough. In this study, the performance efficiency was evaluated based on the assumption of the non-cooperative game among cloud computing providers in which providers selfishly choose the best strategy to maximize their payoff. However, it will be more practical if the study can analyze the cooperative behavior and conflict between providers based on the theoretical tool-game theory. Further research should focus on the resource allocation problems which arise in the cloud computing industry by applying non-cooperative and cooperative game theory.

Author Contributions

Conceptualization, C.-N.W. and M.-N.N.; Data curation, M.-N.N.; Formal analysis, T.-D.N. and M.-N.N.; Funding acquisition, C.-N.W. and H.-P.H.; Investigation, M.-N.N. and T.-H.-Y.N.; Methodology, C.-N.W., M.-N.N. and T.-D.N.; Project administration, C.-N.W. and H.-P.H. All authors have read and agreed to the published version of the manuscript.

Funding

This research was partly supported by project number 110G02 from the National Kaohsiung University of Sciences and Technology in Taiwan.

Institutional Review Board Statement

Not applicable.

Informed Consent Statement

Not applicable.

Data Availability Statement

Not applicable.

Acknowledgments

The authors appreciate the support from the National Kaohsiung University of Science and Technology in Taiwan.

Conflicts of Interest

The authors declare no conflict of interest.

References

  1. Zatonatska, T.; Dluhopolskyi, O. Modelling the efficiency of the cloud computing implementation at enterprises. Mark. Manag. Innov. 2019, 3, 45–59. [Google Scholar] [CrossRef]
  2. Saini, H.C.; Upadhyaya, A.; Khandelwal, M.K. Benefits of Cloud Computing for Business Enterprises: A Review. In Proceedings of the International Conference on Advancements in Computing & Management (ICACM-2019), Jaipur, India, 13–14 April 2019. [Google Scholar]
  3. Maida, J. Cloud Computing Market by Service and Geography—Forecast and Analysis 2021–2025; Technavio Research: London, UK, 2021. [Google Scholar]
  4. Aljabre, A. Cloud computing for increased business value. Int. J. Bus. Soc. Sci. 2012, 3, 234–239. [Google Scholar]
  5. Hooton, C. Examining the Economic Contributions of the Cloud to the United States Economy; Internet Association: Washington, DC, USA, 2019. [Google Scholar]
  6. Economic and Social Impacts of Google Cloud. Available online: https://www2.deloitte.com/content/dam/Deloitte/es/Documents/tecnologia/Deloitte_ES_tecnologia_economic-and-social-impacts-of-google-cloud.pdf (accessed on 15 August 2021).
  7. Lee, Y.C.; Zomaya, A.Y. Energy efficient utilization of resources in Cloud computing systems. J. Supercomput. 2010, 60, 268–280. [Google Scholar] [CrossRef]
  8. Balcerzak, A.P.; Kliestik, T.; Streimikiene, D.; Smrcka, L. Non-Parametric Approach to Measuring the Efficiency of Banking Sectors in European Union Countries. Acta Polytech. Hung. 2017, 14, 51–70. [Google Scholar]
  9. Lesáková, L. Uses and limitations of profitability ratio analysis in managerial practice. In Proceedings of the 5th International Conference on Management, Enterprise and Benchmarking, Budapest, Hungary, 1–2 June 2007. [Google Scholar]
  10. Wedman, J. Handbook of Improving Performance in the Workplace; John Wiley & Sons, Inc.: Hoboken, NJ, USA, 2010; pp. 51–79. [Google Scholar]
  11. Li, Q.; Gross, T.J.; McCarroll, P. Applying Performance Pyramid Model in STEM Education. J. STEM Educ. Innov. Res. 2021, 22, 25–33. [Google Scholar]
  12. Almeida, A.; Azevedo, A. A multi-perspective performance approach for complex manufacturing environments. J. Innov. Manag. 2016, 4, 125–155. [Google Scholar] [CrossRef]
  13. Asmare, E.; Begashaw, A. Review on parametric and nonparametric methods of efficiency analysis. Open Access Bioinform. 2018, 2, 1–7. [Google Scholar]
  14. Toma, P.; Miglietta, P.P.; Zurlini, G.; Valente, D.; Petrosillo, I. A non-parametric bootstrap-data envelopment analysis approach for environmental policy planning and management of agricultural efficiency in EU countries. Ecol. Indic. 2017, 83, 132–143. [Google Scholar] [CrossRef]
  15. Yu, M.C.; Wang, C.N.; Nguyen, T.D. A Comparative Study on Vietnamese Commercial Bank’s Efficiency: Intermediation Approach versus Profit-based Approach. Int. J. Manag. Appl. Sci. (IJMAS) 2017, 3, 10–13. [Google Scholar]
  16. Charnes, A.; Cooper, W.W.; Rhodes, E. Measuring the efficiency of decision-making units. Eur. J. Oper. Res. 1978, 2, 429–444. [Google Scholar] [CrossRef]
  17. Charnes, A.; Clark, C.T.; Cooper, W.W.; Golany, B. A developmental study of data envelopment analysis in measuring the efficiency of maintenance units in the U.S. air forces. Ann. Oper. Res. 1984, 2, 95–112. [Google Scholar] [CrossRef]
  18. Tone, K. Dealing with Undesirable Outputs in Dea: A Slacks-Based Measure (SBM) Approach. GRIPS Res. Rep. Ser. 2003, 2004, 44–45. [Google Scholar]
  19. Emrouznejad, A.; Yang, G.L. A survey and analysis of the first 40 years of scholarly literature in DEA: 1978–2016. Socio-Econ. Plan. Sci. 2018, 61, 4–8. [Google Scholar] [CrossRef]
  20. Zhang, F.; Fang, H.; Wu, J.; Ward, D. Environmental Efficiency Analysis of Listed Cement Enterprises in China. Sustainability 2016, 8, 453. [Google Scholar] [CrossRef] [Green Version]
  21. Xia, Y.; Wang, X.; Li, H.; Li, W. China’s Provincial Environmental Efficiency Evaluation and Influencing Factors of the Mining Industry Considering Technology Heterogeneity. IEEE Access 2020, 8, 178924–178937. [Google Scholar] [CrossRef]
  22. Iqbal, W.; Altalbe, A.; Fatima, A.; Ali, A.; Hou, Y. A DEA Approach for Assessing the Energy, Environmental and Economic Performance of Top 20 Industrial Countries. Processes 2019, 7, 902. [Google Scholar] [CrossRef] [Green Version]
  23. Behera, S.K.; Farooquie, J.A.; Dash, A.P. Productivity change of coal-fired thermal power plants in India: A Malmquist index approach. IMA J. Manag. Math. 2011, 22, 387–400. [Google Scholar] [CrossRef]
  24. Park, S.H.; Pham, T.Y.; Yeo, G.T. The Impact of Ferry Disasters on Operational Efficiency of the South Korean Coastal Ferry Industry: A DEA-Window Analysis. Asian J. Shipp. Logist. 2018, 34, 248–255. [Google Scholar] [CrossRef]
  25. Zhang, B.; Luo, Y.; Chiu, Y.H. Efficiency evaluation of China’s high-tech industry with a multi-activity network data envelopment analysis approach. Socio-Econ. Plan. Sci. 2019, 66, 2–9. [Google Scholar] [CrossRef]
  26. Wang, Y.; Pan, J.F.; Pei, R.M.; Yi, B.W.; Yang, G.L. Assessing the technological innovation efficiency of China’s high-tech industries with a two-stage network DEA approach. Socio-Econ. Plan. Sci. 2020, 71, 100810. [Google Scholar] [CrossRef]
  27. Bai, X.J.; Yan, W.K.; Chiu, Y.H. Performance evaluation of China’s hi-tech zones in the post financial crisis era-Analysis based on the dynamic network SBM model. China Econ. Rev. 2015, 34, 122–134. [Google Scholar] [CrossRef]
  28. Li, H.; He, H.; Shan, J.; Cai, J. Innovation efficiency of semiconductor industry in China: A new framework based on generalized three-stage DEA analysis. Socio-Econ. Plan. Sci. 2019, 66, 136–148. [Google Scholar] [CrossRef]
  29. Kohl, S.; Schoenfelder, J.; Fügener, A.; Brunner, J.O. The use of Data Envelopment Analysis (DEA) in healthcare with a focus on hospitals. Health Care Manag. Sci. 2019, 22, 245–286. [Google Scholar] [CrossRef]
  30. Xie, N.; Wang, R. A historic Review of Grey Forecasting Models. J. Grey Syst. 2017, 29, 1–29. [Google Scholar]
  31. Islam, M.R.; Ali, S.M.; Fathollahi-Fard, A.M.; Kabir, G. A novel particle swarm optimization-based grey model for the prediction of warehouse performance. J. Comput. Des. Eng. 2021, 8, 705–727. [Google Scholar] [CrossRef]
  32. Liu, X.; Peng, H.; Bai, Y.; Zhu, Y.; Liao, L. Tourism flows prediction based on an improved grey GM (1,1) model. Proc. Soc. Behav. Sci. 2014, 138, 767–775. [Google Scholar] [CrossRef] [Green Version]
  33. Tien, T.L. A research on the grey prediction model GM (1, n). Appl. Math. Comput. 2012, 218, 4903–4916. [Google Scholar] [CrossRef]
  34. Wu, W.; Ma, X.; Zeng, B.; Wang, Y.; Cai, W. Application of the novel fractional grey model FAGMO (1, 1, k) to predict China’s nuclear energy consumption. Energy 2018, 165, 223–234. [Google Scholar] [CrossRef] [Green Version]
  35. Wang, L.-W.; Le, K.-D.; Nguyen, T.-D. Assessment of the Energy Efficiency Improvement of Twenty-Five Countries: A DEA Approach. Energies 2019, 12, 1535. [Google Scholar] [CrossRef] [Green Version]
  36. Chen, Y.S.; Chen, B.Y. Applying DEA, MPI, and grey model to explore the operation performance of the Taiwanese wafer fabrication industry. Technol. Forecast. Soc. Chang. 2011, 78, 536–546. [Google Scholar] [CrossRef]
  37. Carboni, O.A.; Russu, P. Measuring Environmental and Economic Efficiency in Italy: An Application of the Malmquist-DEA and Grey Forecasting Model; CRENoS: Cagliari, Italy, 2014. [Google Scholar]
  38. Wang, C.-N.; Tsai, T.-T.; Hsu, H.-P.; Nguyen, L.-H. Performance Evaluation of Major Asian Airline Companies Using DEA Window Model and Grey Theory. Sustainability 2019, 11, 2701. [Google Scholar] [CrossRef] [Green Version]
  39. Tone, K.; Ouenniche, J. DEA Scores’ Confidence Intervals with Past-Present and Past-Present-Future Based Resampling. Am. J. Oper. Res. 2016, 6, 121–135. [Google Scholar] [CrossRef] [Green Version]
  40. Wang, C.-N.; Le, A.L. Measuring the Macroeconomic Performance among Developed Countries and Asian Developing Countries: Past, Present, and Future. Sustainability 2018, 10, 3664. [Google Scholar] [CrossRef] [Green Version]
  41. Chiu, Y.H.; Lin, T.Y.; Chang, T.H.; Lin, Y.N.; Chiu, S.Y. Prevaluating efficiency gains from potential mergers and acquisitions in the financial industry with the Resample Past–Present–Future data envelopment analysis approach. Manag. Decis. Econ. 2021, 42, 369–384. [Google Scholar] [CrossRef]
  42. Wang, L.W.; Le, K.D.; Nguyen, T.D. Applying SFA and DEA in measuring bank’s cost efficiency in relation to lending activities: The case of Vietnamese commercial banks. Int. J. Sci. Res. 2019, 9, 70–83. [Google Scholar]
  43. Azadi, M.; Emrouznejad, A.; Ramezani, F.; Hussain, F.K. Efficiency measurement of cloud service providers using network data envelopment analysis. IEEE Trans. Cloud Comput. 2019. [Google Scholar] [CrossRef] [Green Version]
  44. Azadi, M.; Moghaddas, Z.; Cheng, T.C.E.; Saen, R.F. Assessing the sustainability of cloud computing service providers for Industry 4.0: A state-of-the-art analytical approach. Int. J. Prod. Res. 2021, 1–18. [Google Scholar] [CrossRef]
  45. Subirats, J.; Guitart, J. Assessing and forecasting energy efficiency on cloud computing platforms. Future Gener. Comput. Syst. 2015, 45, 70–94. [Google Scholar] [CrossRef]
  46. Kim, J.; Kim, Y. Benefits of cloud computing adoption for smart grid security from security perspective. J. Supercomput. 2016, 72, 3522–3534. [Google Scholar] [CrossRef]
  47. Ghazizadeh, A. Cloud computing benefits and architecture in e-learning. In Proceedings of the 2012 IEEE Seventh International Conference on Wireless, Mobile and Ubiquitous Technology in Education, Takamatsu, Japan, 27–30 March 2012. [Google Scholar]
  48. Alshomrani, S.; Qamar, S. Cloud based e-government: Benefits and challenges. Int. J. Multidiscip. Sci. Eng. 2013, 4, 1–7. [Google Scholar]
  49. Mhouti, A.E.; Erradi, M.; Nasseh, A. Using cloud computing services in e-learning process: Benefits and challenges. Educ. Inf. Technol. 2018, 23, 893–909. [Google Scholar] [CrossRef]
  50. Zare, H.; Tavana, M.; Mardani, A.; Masoudian, S.; Saraji, M.K. A hybrid data envelopment analysis and game theory model for performance measurement in healthcare. Health Care Manag. Sci. 2019, 22, 475–488. [Google Scholar] [CrossRef]
  51. Teng, F.; Magoulès, F. A New Game Theoretical Resource Allocation Algorithm for Cloud Computing. Advances in Grid and Pervasive Computing. In Proceedings of the International Conference on Grid and Pervasive Computing, Hualien, Taiwan, 10–13 May 2010; Springer: Berlin/Heidelberg, Germany, 2010. [Google Scholar]
  52. Riahi, S.; Riahi, A. Energy Efficiency Analysis in Wireless Systems by Game Theory. In Proceedings of the 2018 IEEE 5th International Congress on Information Science and Technology (CiSt), Marrakech, Morocco, 21–27 October 2018; IEEE: Piscataway, NJ, USA, 2018. [Google Scholar]
  53. Ghosh, J. Energy Efficiency Analysis by Game Theoretic Approach in the Next Generation Network. IETE Tech. Rev. 2020, 37, 329–338. [Google Scholar] [CrossRef]
  54. Bonnici, J.P.; Grima, S.; Seychell, S. An Analysis of Efficiency and Productivity Change in Microfinance Institutions in the European Union: A DEA-MPI Approach. Int. J. Financ. Insur. Risk Manag. 2019, 9, 94–123. [Google Scholar]
  55. Tone, K. A slacks-based measure of super-efficiency in data envelopment analysis. Eur. J. Oper. Res. 2002, 143, 32–41. [Google Scholar] [CrossRef] [Green Version]
  56. Chang, T.S.; Tone, K.; Wu, C.H. Past-present future Intertemporal DEA models. J. Oper. Res. Soc. 2015, 66, 16–32. [Google Scholar] [CrossRef]
  57. Fisher, R.A. Frequency Distribution of the Values of the Correlation Coefficient in Samples from an Indefinite Large Population. Biometrika 1915, 10, 507–521. [Google Scholar]
  58. Chang, G.W.; Lu, H.J. Forecasting flicker severity by grey predictor. IEEE Trans. Power Deliv. 2012, 27, 2428–2430. [Google Scholar] [CrossRef]
  59. Caves, D.W.; Christensen, L.R.; Diewert, W.E. The Economic Theory of Index Numbers and the Measurement of Input, Output, and Productivity. Econometrica 1982, 50, 1393–1414. [Google Scholar] [CrossRef]
  60. Färe, R.; Grosskopf, S.; Norris, M.; Zhang, Z. Productivity Growth, Technical Progress, and Efficiency Change in Industrialized Countries. Am. Econ. Rev. 1994, 84, 66–83. [Google Scholar]
  61. Cook, W.D.; Tone, K.; Zhu, J. Data envelopment analysis: Prior to choosing a model. Omega 2014, 44, 1–4. [Google Scholar] [CrossRef]
  62. Yang, H.H.; Chang, C.Y. Using DEA window analysis to measure efficiencies of Taiwan’s integrated telecommunication firms. Telecommun. Policy 2009, 33, 98–108. [Google Scholar] [CrossRef]
  63. Lu, W.M.; Hung, S.W. Exploring the efficiency and effectiveness in global e-retailing companies. Comput. Oper. Res. 2011, 38, 1351–1360. [Google Scholar] [CrossRef]
  64. Kwon, H.-B. Performance modeling of mobile phone providers: A DEA-ANN combined approach. Benchmarking Int. J. 2014, 21, 1120–1144. [Google Scholar] [CrossRef]
  65. Yang, Z.; Shi, Y.; Yan, H. Scale, congestion, efficiency and effectiveness in e-commerce firms. Electron. Commer. Res. 2016, 20, 171–182. [Google Scholar] [CrossRef]
  66. Ko, K.; Chang, M.; Bae, E.-S.; Kim, D. Efficiency Analysis of Retail Chain Stores in Korea. Sustainability 2017, 9, 1629. [Google Scholar] [CrossRef] [Green Version]
  67. Shah, A.A.; Wu, D.; Korotkov, V. Are Sustainable Banks Efficient and Productive? A Data Envelopment Analysis and the Malmquist Productivity Index Analysis. Sustainability 2019, 11, 2398. [Google Scholar] [CrossRef] [Green Version]
  68. Wang, C.-N.; Dang, T.-T.; Nguyen, N.-A.-T.; Le, T.-T.-H. Supporting Better Decision-Making: A Combined Grey Model and Data Envelopment Analysis for Efficiency Evaluation in E-Commerce Marketplaces. Sustainability 2020, 12, 10385. [Google Scholar] [CrossRef]
  69. Wang, C.-N.; Nguyen, N.-A.-T.; Dang, T.-T.; Trinh, T.-T.-Q. A Decision Support Model for Measuring Technological Progress and Productivity Growth: The Case of Commercial Banks in Vietnam. Axioms 2021, 10, 131. [Google Scholar] [CrossRef]
  70. National Association of Securities Dealers Automatic Quotation System (Nasdaq). Available online: https://www.nasdaq.com/ (accessed on 17 August 2021).
Figure 1. Overall performance model for cloud computing companies.
Axioms 10 00309 g001
Figure 2. Bar chart and scatter plot of efficiency scores from 2017 to 2020.
Axioms 10 00309 g002
Figure 3. Forecasted efficiency score from 2021 to 2024.
Axioms 10 00309 g003
Figure 4. Average efficiency score during 2017 to 2020 vs. 2021 to 2024.
Axioms 10 00309 g004
Table 1. Characteristics of 10 listed US cloud computing companies.
DMUsCompany Name
C1Amazon
C2Alphabet
C3Microsoft
C4Salesforce
C5ServiceNow
C6Splunk
C7Dropbox
C8Shopify
C9Atlassian
C10Twilio
Table 2. List of previous studies using the data envelopment analysis method.
No.Author (s)Input FactorsOutput FactorsResearch Areas
1Yang et al. (2009) [62]Operating expenses, Operating costs, Assets Operating revenues, Mobile phone calls, Mobile phone subscribersEvaluating the efficiencies of the three leading telecommunication firms in Taiwan
2Lu et al. (2011) [63]Operating expenses, Liability, Equity, EmployeeNet income, Net sales, Intangible value, Market valueEvaluating the operating performance of 30 global e-retailing companies
3He-Boong Kwon (2014) [64]Cost, AssetRevenue, Operating incomeInvestigating the comparative performance of major mobile phone providers
4Yang et al. (2016) [65]Operating expense, Total assets, The number of employeesRevenue, Market shareExamining the operational efficiency of e-commerce firms
5Ko et al. (2017) [66]Store size, Number of items, Number of employees, Rental costSales revenue, Number of customersExamining the relative efficiency of retail chain stores in Korea
6Shah et al. (2019) [67]Assets, Equity, Employees, ExpenseRevenue, ProfitMeasuring the performance and productivity of the sustainable and non-sustainable banks
7Wang et al. (2020) [68]Asset, Liabilities, EquityRevenue, Gross profitAssessing the efficiency score of the ten largest e-commerce marketplaces in the US
8Wang et al. (2021) [69]Assets, Deposit, Operating expense, LiabilitiesLoan, Net incomeMeasuring the performance of the commercial banking system in Vietnam
Table 3. Descriptive statistics of the inputs and outputs from 2017 to 2020.
YearStatisticsInput FactorsOutput Factors
Cost of RevenueOperating ExpenseGross ProfitTotal Revenue
2017Max137,183173,76065,272177,866
Min119.161282.199216.125399.02
Average22,152.0725,560.8117,363.3239,515.39
SD41,439.0451,124.4224,628.0760,430.86
2018Max173,183220,46677,270232,887
Min172.69464.461349.226650.067
Average27,684.8531,972.5722,490.0250,174.88
SD52,304.6864,768.6331,252.0477,556.87
2019Max205,768265,98189,961280,522
Min210.285978.702608.9171134.468
Average32,789.4838,160.5426,882.8659,672.34
SD62,144.2178,020.2136,758.8192,432
2020Max291,824363,16597,795386,064
Min268.8071331.28915.6611614.173
Average43,252.449,043.831,530.2374,782.62
SD87,057.44106,410.142,629.72121,402.4
Table 4. Results of the efficiency from 2017 to 2020.
DMUs.2017201820192020DMUs2017201820192020
Efficiency ScoresRanking
C11.001.001.001.00C17788
C21.561.401.421.35C22333
C31.081.301.391.55C36442
C41.601.571.661.61C41111
C50.960.991.001.05C58896
C61.261.211.220.74C65659
C70.850.760.901.01C71010107
C80.930.891.061.11C89965
C91.441.481.601.29C93224
C101.411.281.030.68C1045710
Table 5. Comparisons of 5000 and 500 replicas (Fisher 95%) for the year 2020.
DMUs5000 Replicas500 ReplicasDifference
97.50%DEA2.50%97.50%DEA2.50%97.50%2.50%
C11.001.001.001.0011.0000
C25.681.350.625.680.890.630−0.01
C37.711.551.067.621.651.020.090.04
C42.721.610.592.721.030.5600.03
C51.821.050.551.831.040.57−0.01−0.02
C61.820.740.521.731.510.500.090.02
C71.351.010.531.361.390.52−0.010.01
C82.421.110.372.270.410.360.150.01
C92.541.291.082.521.571.090.02−0.01
C102.870.680.402.561.180.390.310.01
Table 6. Correlation matrix of inputs and outputs in 2020.
Cost of RevenueOperating ExpenseGross ProfitTotal Revenue
Cost of revenue1.000.990.720.97
Operating expense0.991.000.640.93
Gross profit0.720.641.000.87
Total revenue0.970.930.871.00
Table 7. Forecast scores by the Lucas weight model, actual scores, and confidence interval in 2020.
DMUs97.50%Forecasted ScoreActual Score2.50%
C11.001.001.001.00
C25.151.381.350.87
C37.031.431.551.11
C42.451.621.610.70
C51.651.021.050.67
C61.640.860.740.59
C71.290.891.010.62
C82.211.071.110.46
C92.361.531.291.14
C102.461.040.680.46
Table 8. Efficiency score from 2021 to 2024.
DMUs2021202220232024DMUs2021202220232024
Efficiency ScoresRanking
C11.001.001.001.00C17778
C21.381.381.381.38C21234
C31.451.461.461.45C32343
C41.621.621.621.62C43111
C51.021.031.031.02C55666
C60.860.850.840.85C69101010
C70.900.900.900.90C710999
C81.081.081.081.08C86555
C91.501.471.471.48C94422
C101.031.021.021.03C108887
Table 9. Efficiency improvement from 2017 to 2024.
DMUsCatch-UpFrontier-ShiftMPI
C11.001.041.04
C21.001.011.01
C31.051.011.06
C40.991.031.01
C51.011.011.02
C60.971.031.00
C71.011.011.02
C81.020.940.96
C91.010.960.97
C100.980.890.89
Average1.010.991.00
Publisher’s Note: MDPI stays neutral with regard to jurisdictional claims in published maps and institutional affiliations.

