1. Introduction
Microscopy is a key analytical method that is applied in most research fields to understand various effects that influence the properties or the behavior of components or materials. With reference to automotive batteries, two main fields of application can be distinguished.
The first field involves the visualization of chemical processes that occur within the battery during operation, which supports the identification and the understanding of the mechanisms involved. The information gathered in this field enables researchers to find solutions to problems and improve these batteries. This information is particularly useful during the early development of batteries. In this field of application, very small samples are typically analyzed in great detail to obtain the best possible quality of data. For such an analysis, special half cells [
1] are also built that allow researchers optical access to very small scale effects. Special sample generation methods are applied that allow chemical reactions to occur; this enables, for instance, an in situ analysis of the formation of new layers within the battery at the time of operation [
2,
3,
4].
The second field involves the collection of microscopic images of surfaces of single components or their cross-sections, which provide much information essential to the derivation of the chemical or the mechanical properties of the cells. The latter is necessary to determine the loading thresholds of batteries and thus integrate them safely into an electric vehicle. In the following text, some examples of such data are described briefly.
Numerical finite element models of Li-ion batteries have been recently developed with different levels of detail to, e.g., estimate the mechanical load that can be applied to cell and its associated risk of failure during a crash. In such models, the thickness of the single battery layers is crucial information that is typically derived from microscopic images [
5,
6]. In addition, microscopic images support the understanding of the layer mechanical properties in that they provide important information about the microstructure of these layers (anisotropy of separator [
6]). This microstructural information can be used as input to define mechanical testing scenarios and derive mechanical properties of battery components, thus they can be translated into a working simulation model.
Some properties of batteries that mainly influence their electrical properties or their performance levels can also be visualized and understood by using microscopic imaging. Examples include the porosity of the separator [
7,
8] or the grain size of the active material (AM) [
9].
In the literature, the post-mortem analysis of Li-ion batteries by generating microscopic images is a frequently used investigation method [
10,
11,
12]; however, the steps necessary to produce “good” imaging results have not been described in detail.
This study was carried out to establish a “best-practice” approach for the post-mortem analysis of samples generated from Li-ion pouch cells. An overview is provided of a method to safely dismount and disassemble battery modules from a battery pack without inducing damage to the battery pouch. A central aspect of this work is a comparison between two different analytical techniques used to measure various battery component parameters, such as layer thickness and particle size. A conclusion was drawn regarding the accuracy of the measured results from two different sample generation methods and their usability in different research fields.
This study was carried out on a state-of-the-art Li-ion pouch cell disassembled from a fresh uncycled battery pack, which is applied in an electric vehicle that is currently commercially available.
2. Method
In this section, the extraction procedure of cells from the battery modules, the sample generation procedure from individual cells, the sample pre-treatment for microscopic analysis, and the microscopic methodology used are presented and discussed in more detail.
2.1. From Battery Pack to Cell
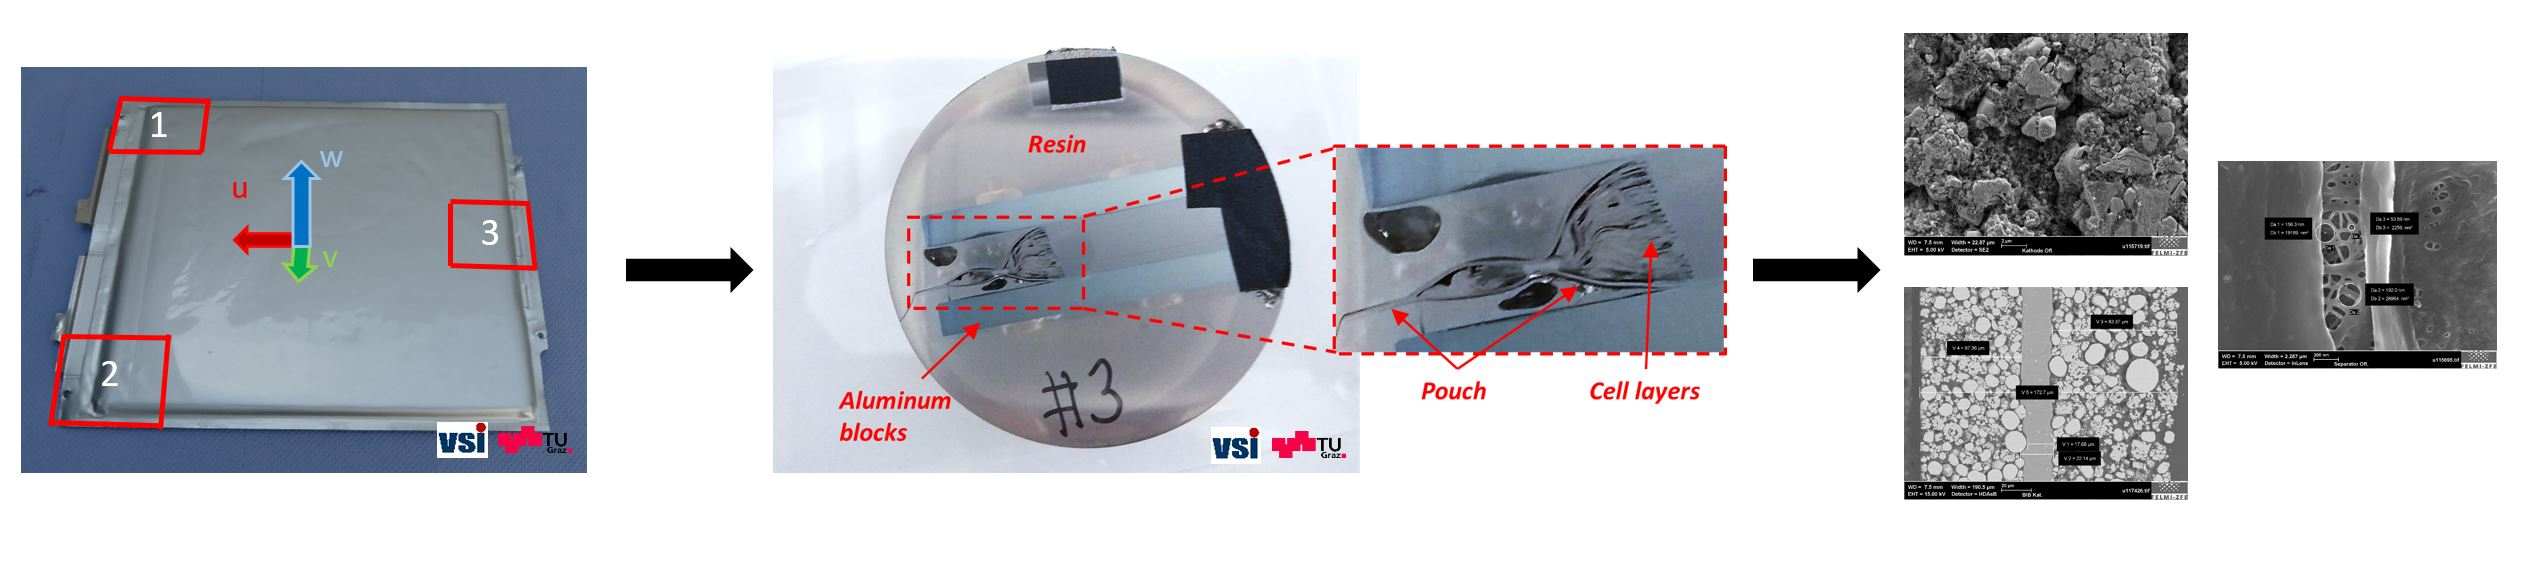
The battery pack disassembled in this work contained 24 identical battery modules, each of which consisted of eight 41 Ah Li-ion pouch cells with cut-off voltage limits of 2.5 V and 4.2 V. Twelve of the modules were positioned in the front of the battery pack and arranged horizontally with their connection tabs oriented towards the middle of the pack. The other twelve modules were arranged vertically in the back of the battery pack and oriented so that their connectors also faced towards the internal pack structure (
Figure 1a). Due to the shipping safety regulations [
13], the battery pack had a pre-set state of charge (SOC) value of about 30%; therefore, extra precautions had to be taken during the pack disassembly. After disconnecting and dismounting the bus bars, the battery modules were taken out (
Figure 1b) and then disassembled.
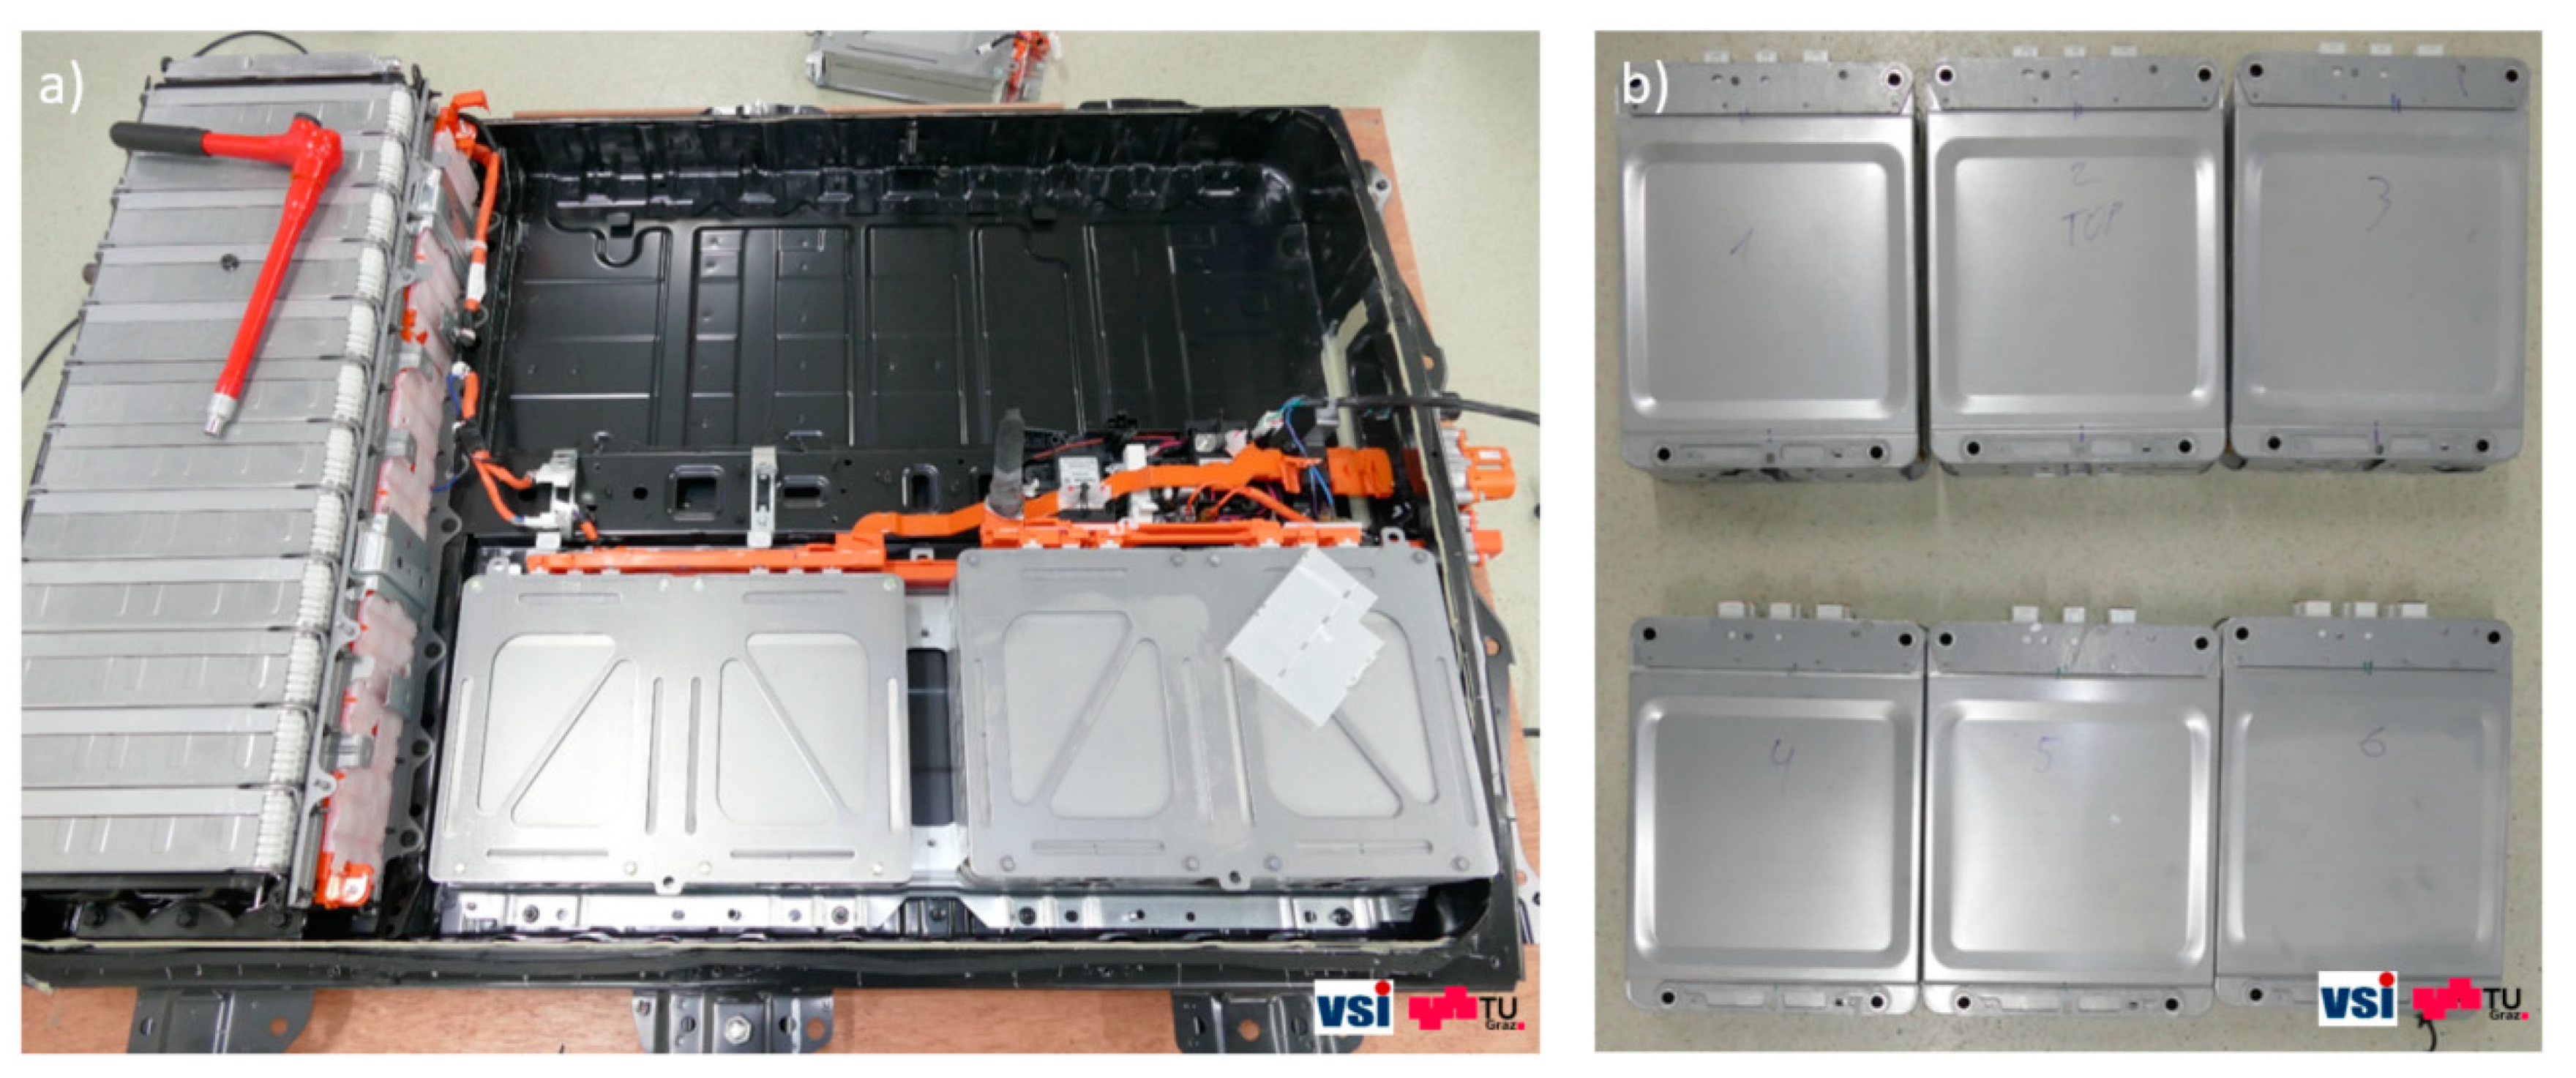
A general problem typically faced when disassembling modules that contain Li-ion pouch cells is that most of the batteries are glued to each other. An inaccurate disassembly procedure could result in deformation of the pouch surface or even damage to the internal battery structure. This might not only affect the electrical or the mechanical performance of the battery but may also decrease the safety of the battery and result in instant cell failure. To overcome this problem, a safe and clean method to separate all cells was adopted as part of this study. In a first step of the module disassembly process, the caps of the bolts (
Figure 2a), which hold the entire structure together, were removed. The stacked cell structure was then divided into two substructures comprising four cells (
Figure 2c) by using glue removal solvent and a nylon rope with a diameter of 0.7 mm. The nylon rope was mounted on one of the connecting bolts (
Figure 2b) and slid entirely between the two cell stacks. After the structure was sprayed with the solvent, three minutes were allowed to let the glue dissolve, and the rope was then used to “cut” through the adhesive by manually applying a constant force at its free end. This procedure ensures a clean disassembly process and does not cause any damage to the pouch of the batteries. In a next step, after the four bolts seen in
Figure 2c were removed, the battery housing was also dismounted by making use of the same procedure described above. An intermediate step of the module disassembly process can be seen in
Figure 2d. Two module sub-structures are visible in this figure, each of which contained four batteries as well as compression pads that were integrated in the module, the battery housing, and all connecting bolts.
The cells were then separated from each other by first cutting through the battery tabs with a sharp blade (
Figure 2e) and then removing the glue between them using the same nylon rope technique as described above (
Figure 2f). It is important to keep the cell tabs as large as possible in order to allow a sufficient contact area for battery electrical characterization and further cycling investigations. The final step in the module disassembly process was the removal of the plastic frame from around each battery. This frame was connected to the pouch at four different points located on each battery corner (
Figure 2g). Careful drilling through these points allowed the frame to be removed by simply pulling it off to the side (
Figure 2h).
2.2. Generation of Samples for Cross-Sectional Analysis
The purpose of an extensive cross-sectional analysis of the battery is two-fold. On the one hand, the results of this analysis allow the determination of the battery layer thickness. On the other hand, information can be gathered about manufacturing details and layer arrangement of the cells. Two different approaches for sample generation were adopted in this study to evaluate the thicknesses of the battery components and identify some cell characteristics that were otherwise not visible.
For the first approach, small samples with a size of 5 mm × 5 mm were cut out from each individual battery layer after the battery disassembly. In order to minimize the influence of the mechanical cutting process, the edges of the samples were post-processed by utilizing a broad-ion-beam cutting technique (see
Section 2.2.2), resulting in a defect-free, cross-sectional sample surface (i.e., lacking residuals or cracks induced by mechanical grinding process). This enables the precise measurement of the size of the active materials (AM) within the battery layers and the corresponding current collectors (CC) as well as the thickness of the battery separator.
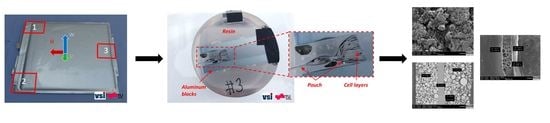
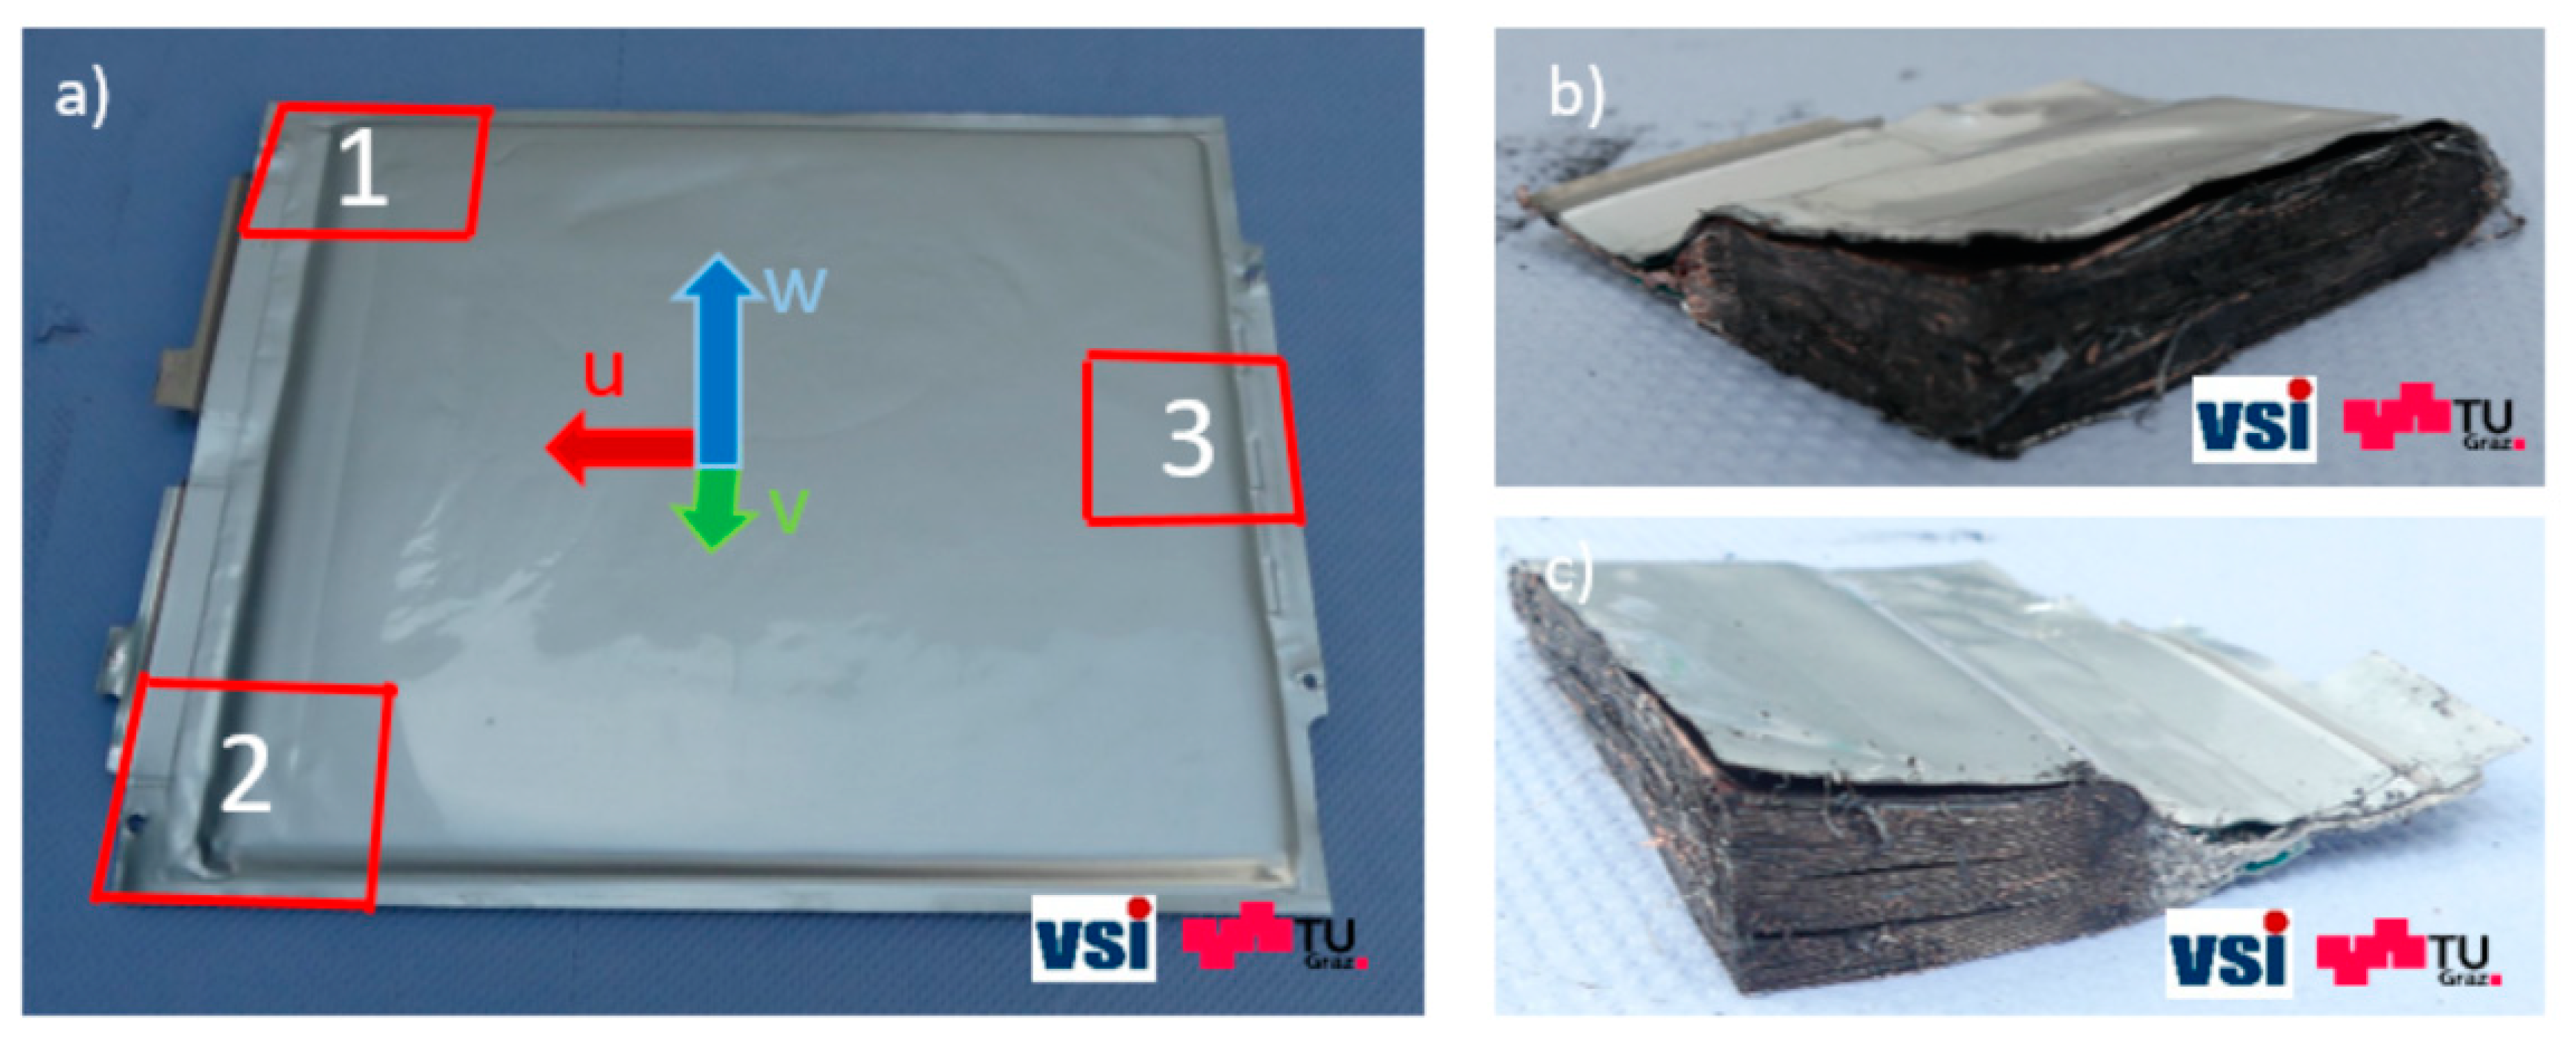
During the second approach, the stacked layer structure was investigated. The results of this investigation not only allow the visualization of the layer arrangement inside the battery but also provide better insight into critical battery areas (e.g., close to the battery tabs or at the cell edges). For this purpose, one cell was deep-discharged to 0 V, and stacked component samples (50 mm × 50 mm) were generated from three different locations in the battery (
Figure 3a) by cutting through each layer individually with a ceramic knife. The use of ceramic tools is a safety measure that is usually taken to prevent any internal short circuits during cell opening [
14,
15]. Representative samples cut out from positions 1 and 2 can be seen in
Figure 3b,c, respectively.
Stacked layer sample generation was not conducted in a controlled environment. This led to the evaporation of the electrolyte; however, this had no influence on the imaging results, since a focus was placed on identifying interesting manufacturing details rather than determining the precise size of the layers. The specimen post-preparation process for microscope imaging is described in
Section 2.2.1 and
Section 2.2.2.
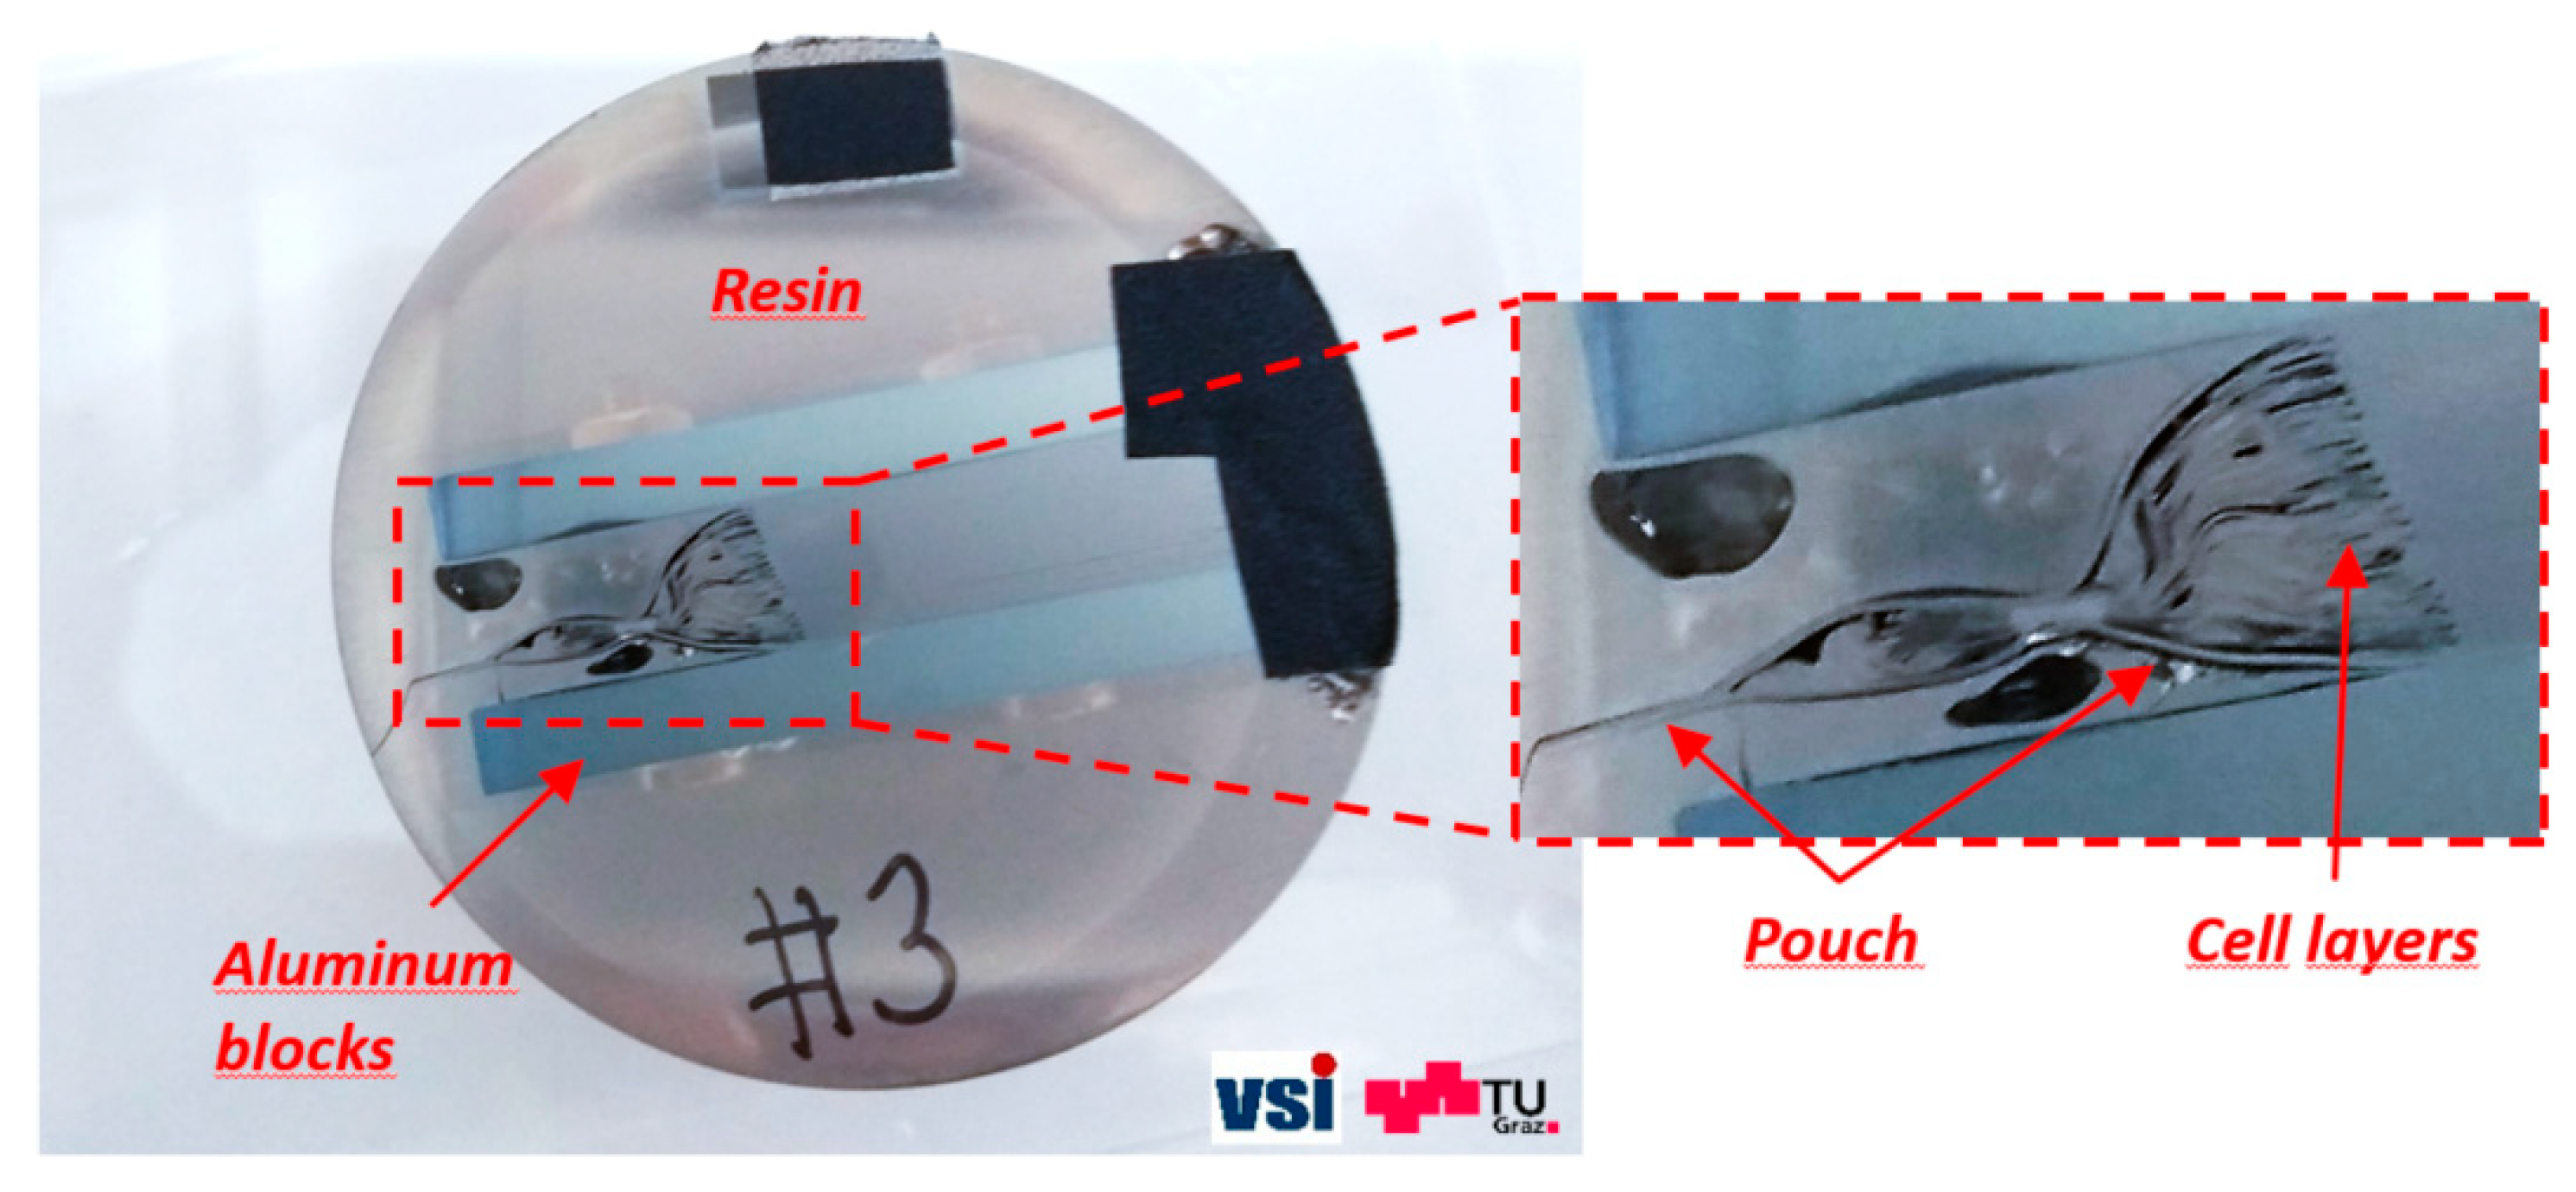
2.2.1. Post-Preparation of the Stacked Component Sample for Microscopic Investigations
As already mentioned, large areas (i.e., 50 mm × 50 mm) were cut out of the pouch cell to prepare the cross-sections of the complete stack of electrodes (
Figure 3). To prevent the stack of electrodes from shifting during the mechanical preparation process, the complete structure was fixed with a specially designed clamp. The sample was then embedded into a two-component, cold-mounting epoxy resin, which is characterized by its relatively long curing time but excellent properties to adhere to most materials. The vacuum impregnation of the sample was carried out in a vacuum chamber of a Struers CITOVAC system at a low pressure to minimize the formation of preparation artefacts while mechanically polishing the cross-sectional region. The embedded structure was polished in a dry state with silicon carbide grinding papers and subsequently coated with a 10 nm thin, high-purity carbon film for subsequent scanning electron microscopy (SEM) investigations. The sample is shown in
Figure 4.
2.2.2. Post-Preparation of Single Layers via Broad Ion Beam (BIB) Cutting
For the preparation of the cross-sections of the individual layers, all generated samples from the anode, the cathode, and the separator were pre-treated and glued to a tungsten blade, allowing for a small amount of overhang. This blade was then transferred into a Gatan Ilion Broad Ion Beam Milling system (BIB or Slope Cutter). The Gatan Ilion ion polisher is used to prepare high-quality planar cross sections from samples that cannot be polished with classic mechanical methods to achieve the desired quality (for example, porous multilayer samples with a high hardness difference between the layers, such as is found in electrodes from batteries, Li-ion, or fuel cells) [
16,
17]. The overhang of the sample was milled with low-energy argon ions that originated from two ion-guns positioned at different angles with respect to the sample. This technique was used to create a 1 mm-broad artefact-and damage-free surface for subsequent investigations [
18]. To prevent the heat-induced damage that can be caused by ion bombardment, the specimen temperature was reduced to ensure that the milling area remained close to the ambient temperature during the milling process.
2.3. Method for Surface Analysis
For the surface analysis, small samples with the size of 5 mm × 5 mm were cut out from the battery anode, the cathode, and the separator, respectively. Separator samples were placed immediately into a propylene carbonate (PC) replacement electrolyte solution after extraction from the battery to prevent them from drying out and shrinking. All samples were mounted on SEM sample stubs and coated with a 10 nm-thin, high-purity carbon film using a LEICA EM ACE200 coater [
19].
All scanning electron microscopy investigations were performed using a ZEISS Ultra 55 Field Emission Scanning Electron Microscope (FESEM). High-resolution surface characterization of the morphology was conducted with secondary electrons (SE) in the high vacuum mode at a 5 keV excitation energy, whereas material characterization was done with backscattered electrons (BSE) and energy dispersive X-ray spectroscopy (EDXS) and an excitation energy of 15 keV.
Secondary electrons are inelastically scattered primary electrons with an energy <50 eV. They are emitted from the immediate surface area of the incident primary electron beam, offering the best lateral resolution in the range of several nanometres [
20]. SE images were acquired with an SE2 detector (Everhart Thornley Detector—ETD) and Secondary Electron Inlens Detector (SEI), both of which provide topographic contrast.
Backscattered electrons are elastically scattered in the field of the atomic nucleus. The energy ranges from >50 eV to the excitation energy. The higher the atomic number (atomic weight) of a phase or region is, the more electrons are backscattered from this specimen area (material contrast). BSE images acquired with the HDAsB detector (High Definition Angle Selective Backscatter Electron Detector) provide material (W-contrast) and additional orientation contrast (especially in the images of the Broad Ion Beam cuts).
2.4. Method for Chemical Analysis
In order to gain information about the chemical composition of the surface, high-energy electrons were directed toward the samples, causing the inner shell electrons to become ionized, thus leaving a vacancy in the inner shell. When this vacancy was subsequently filled by electrons from higher shells, the energy difference could be observed as an X-ray quantum or Auger electron. These energies are specific for each element and are called characteristic X-ray radiation. The continuous X-ray was generated by electrons that were decelerated in the Coulomb field of the atomic nucleus, thereby continuously losing their kinetic energy in the form of Bremsstrahlung [
19,
21]. EDXS spectra were acquired with an EDAX Super Octane Silicon Drift Detection System (Energy Resolution of about 123 eV @ MnKa) equipped with a silicon nitride window for the highest sensitivity in the low energy region.
2.5. Light Microscopy Investigation Approach
Light microscopy imaging was conducted on the stacked component sample (
Section 2.2.1) and on a cross-section of an unprocessed anode as well as on the surfaces of the individual layers. The system used was a Keyence VHX-6000 digital microscope equipped with a VH-Z500T high-resolution zoom lens. The optical imaging results were compared to SEM images, and the advantages and the disadvantages of both methods were highlighted for the specific use case.
3. Results
In this section, not only the SEM imaging results of all cross-section investigations are presented but also the methods used to derive the surface properties and the chemical compositions of all battery components. The interesting manufacturing details of the cell under investigation are identified, and the thickness measurements of all battery layers are described in detail. Optical microscopy imaging results are shown at the end of this section and then compared to those obtained from the SEM analysis.
3.1. Layer Properties in Cross-Section and Identification of Cell-Specific Details
By analyzing all stacked samples (see
Section 2.2) in cross-section, it was possible to identify some interesting manufacturing details of the investigated pouch cell. An examination of Sample #3 (
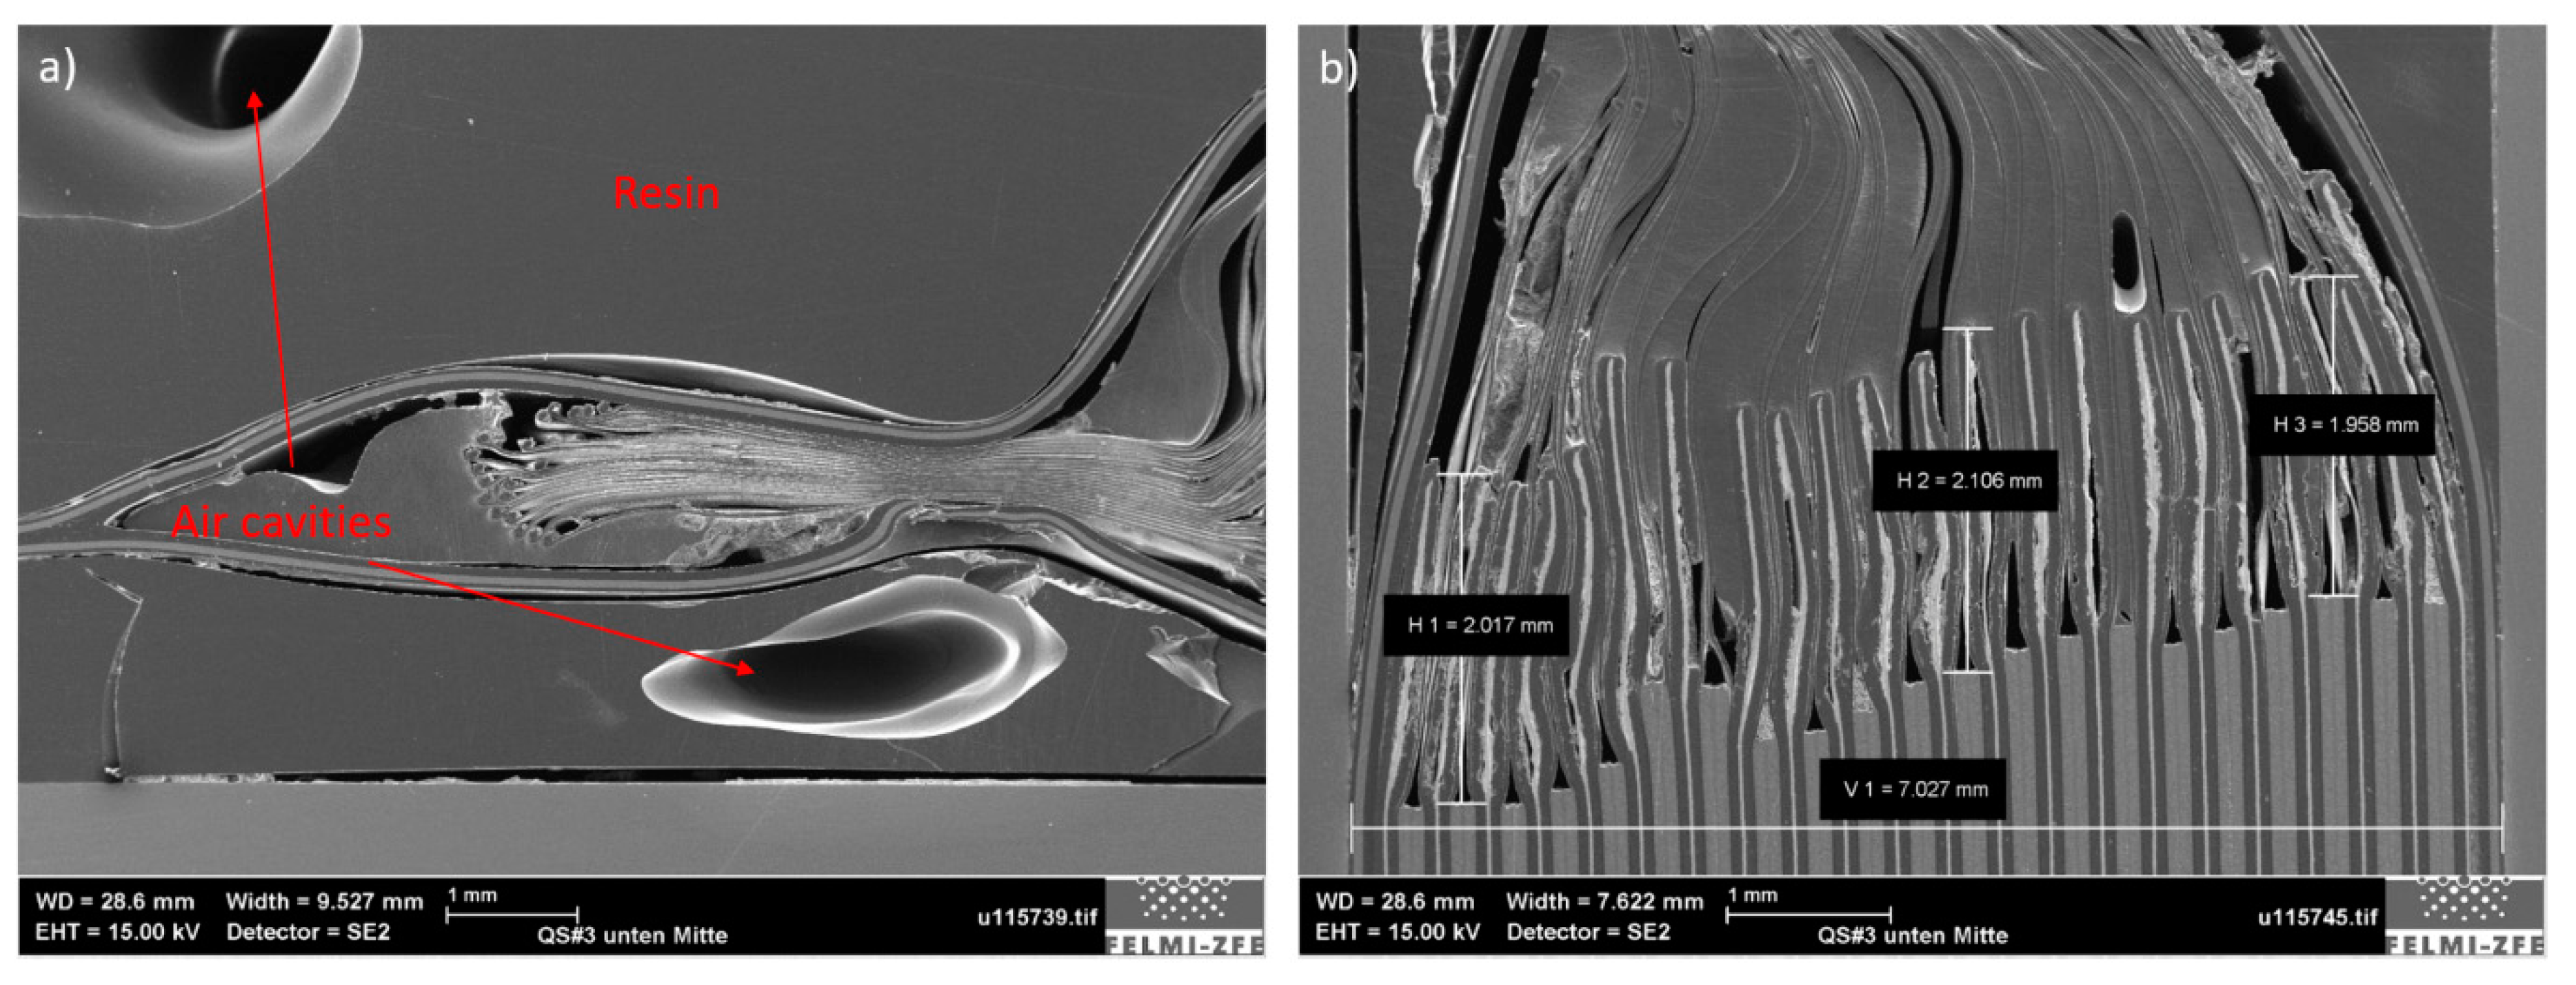
Figure 4), which was generated from the middle of the cell side opposite the battery tabs, reveals the fact that all separator membranes were welded to the pouch at the sealing point near the edge (
Figure 5a). In terms of the mechanical behavior of the battery and possible battery failure, this feature indicates that the separator could experience high tensile strain if a mechanical force were to act on the battery close to its edge, and mechanical rupture of the separator membrane could occur. This occurrence would expose both battery electrodes to direct contact, which is a prerequisite for a premature electrical failure and thermal runaway.
If the sample is examined from its edge to its middle, it can be seen that the separator membrane comes first into contact with the anode and after two mm with the cathode (
Figure 5b). The reason for this phenomenon is in part due to the battery geometry in this area. Close to the battery edge, the distances between layers are smaller due to the hot-welded area of the pouch. The lack of cathode layers in this battery section ensures that no short circuit will occur, even if some of the battery layers came too close to each other. Another purpose of a longer anode layer is to increase the stiffness of the battery near the edge, which leads to smoothing of the load distribution in the case of edge loading.
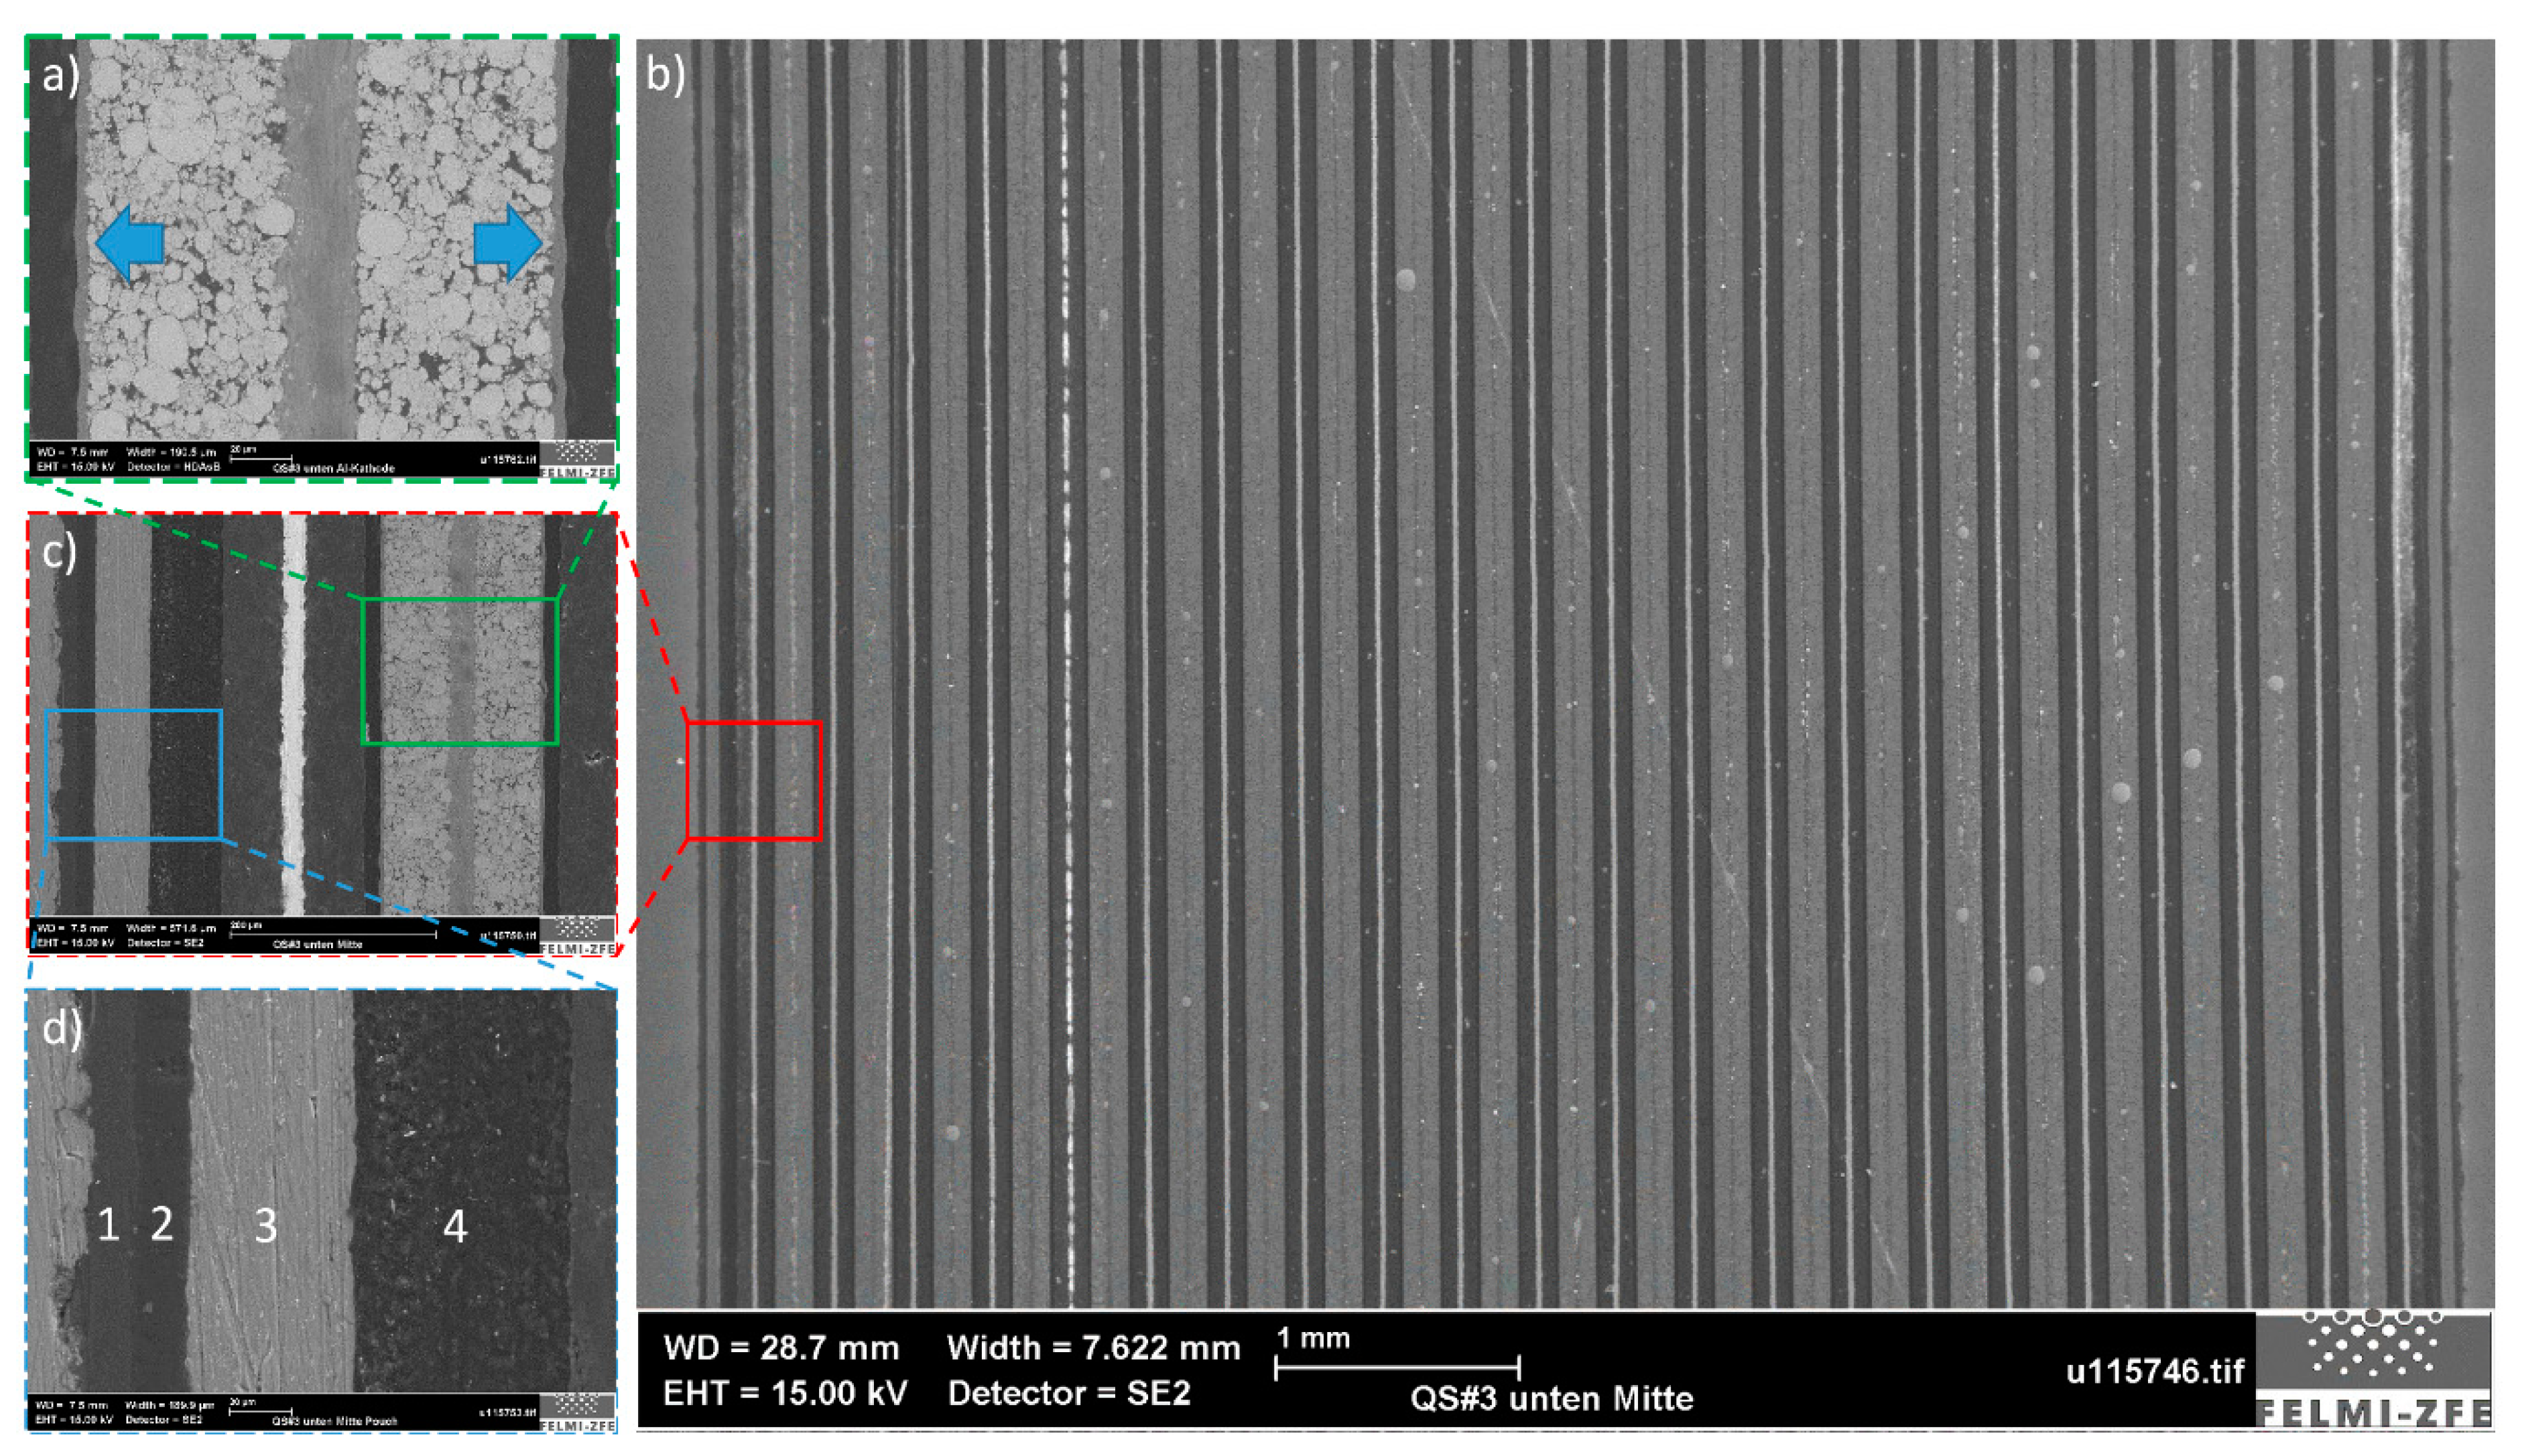
In
Figure 6b, the layer arrangement in the pouch cell can be seen. The investigated battery contained 22 anode layers, 21 cathode layers and 44 separator foils, whereby the two outermost layers on both side of the battery were anodes. This observation suggests that the active material, which was deposited on the outer side of the last copper foil, remained electrochemically inactive and did not participate in the charge transfer and the energy storage process. This can be seen in
Figure 6c, where the pouch and the neighboring anode-separator-cathode stack are visible. In this study, the pouch was identified as a four-layer, metallic-polymer compound consisting of one Al layer (3, in
Figure 6d) and three polymer layers (1, 2 and 4, in
Figure 6d). Another specific characteristic of the battery under investigation is visible in
Figure 6a. A small 3 µm-thin layer can be seen between each cathode and separator. With EDXS analysis, this was identified as an aluminium oxide (Al
2O
3 or also called alumina) layer. Such a layer in lithium ion-batteries is typically deposited on top of the separator membrane to enhance its thermal properties, enabling it to preserve its mechanical integrity at temperatures up to 200 °C [
22,
23]. The performance of lithium-ion batteries with coated alumina separator foils is the same at room temperature as that of those with a polymer separator. The former, however, is characterized by its safer operation and increased cyclability under extreme temperature conditions in the range from −30 °C to +60 °C [
22,
23].
To test the hypothesis that an alumina (Al
2O
3) layer was directly deposited on top of the separator surface on the cathode side, individual layers were analyzed in cross-section, the results of which are presented later in this section. A conformation is also provided in
Section 3.2, whereby the surfaces on both sides of the polymer membrane as well as those of the anode and the cathode were analyzed in more detail.
Samples #1 and #2, which were respectively generated at the anode and the cathode tabs of the investigated cell, showed comparable results to each other. For this reason, only the representative results for Sample #1 are presented. The first characteristic location was the contact position of all copper current collectors and the anode tab. Here, the contact was achieved by point-welding all layers together, as shown in
Figure 7a. Another cell-specific detail can be seen in
Figure 7d. An area close to each welding point can be seen, where an additional separator layer was added to the battery stack. This layer had a length of ca. 2 mm, as measured from the beginning of the cathode layer (
Figure 7b) towards the middle of the cell (
Figure 7d). The purpose of integrating an additional membrane in the tab area was to increase battery safety and prevent separator damage during charging/discharging due to the increased heat generation in the tab area [
24].
The thicknesses of the individual components were also measured from the stacked-layer sample. These results are shown in
Figure 7c,e for the anode and the cathode, respectively. The overall thickness of the anode layer was about 140 µm and comprised 20 µm of CC and 60 µm of AM on both sides. The cathode was 20 µm wider than the anode due to its thicker AM (about 65 µm) and CC (25 µm). The separator size of the stacked sample was evaluated as approximately 20 µm.
As mentioned in
Section 2.2, single-layer samples were also investigated in cross-section. After broad-ion-beam cutting, all specimens were left with a clean surface, which made the precise determination of the thicknesses of the copper and the aluminium current collectors and the thicknesses of their corresponding active materials possible. In this way, more highly accurate results could be obtained as compared to those determined from the stacked-layer sample (
Figure 7c,e).
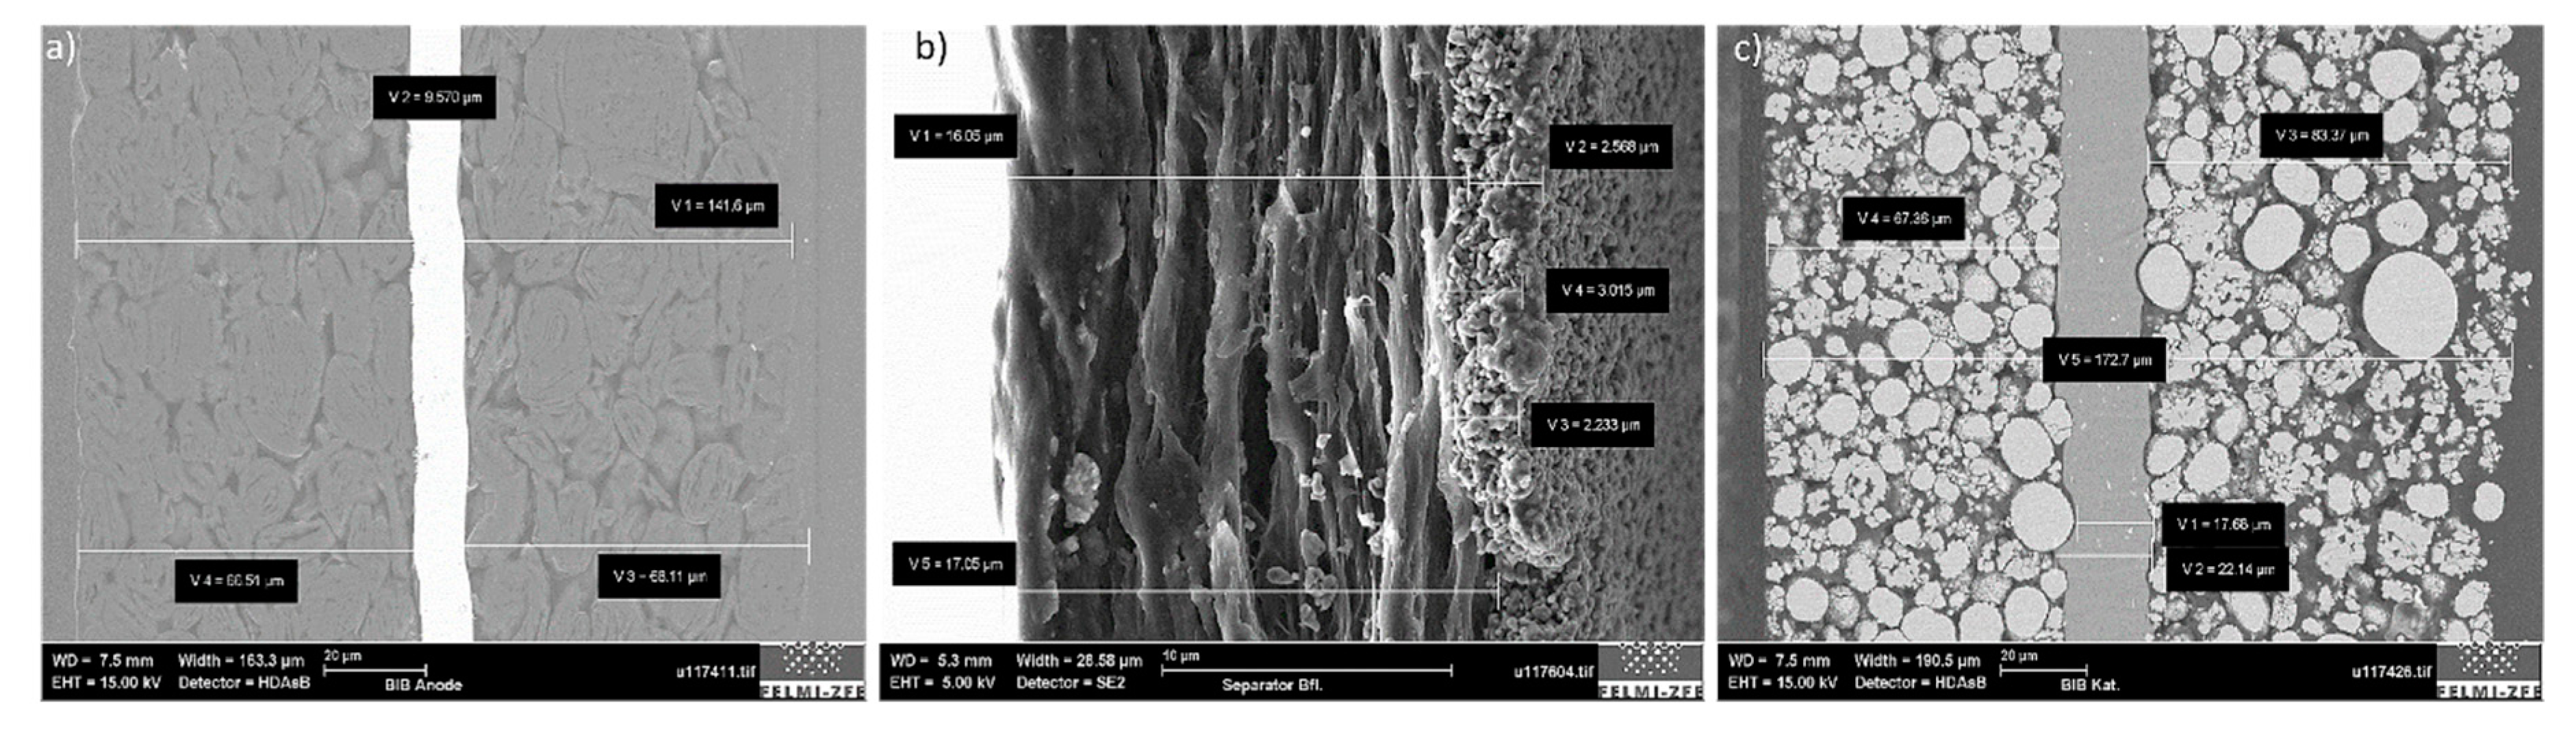
Figure 8a shows the battery anode in cross-section with a total thickness of about 140 µm, which could be divided into a 10 µm copper current collector and two active materials on each side of it, each with a thickness of 65 µm. The anode active material grains and the binder are also visible in this figure, which holds the entire AM structure together. In
Figure 8b, the separator can be seen; it consisted of one 17 µm polypropylene layer and the 3 µm deposited alumina protective layer. In the cathode (
Figure 8c), the aluminium current collector thickness was determined to be around 20 µm, and the corresponding active material was −75 µm. Different particle sizes were visible, the sizes of which were determined during the sample surface analysis (
Section 3.2.1).
All measured layer thicknesses are summarized in Table 1, and the reasons for all differences in the layer sizes are discussed in detail in the Discussion section.
3.2. Derivation of Surface Properties and Chemical Composition
3.2.1. Grain Size of Active Materials and Chemical Composition
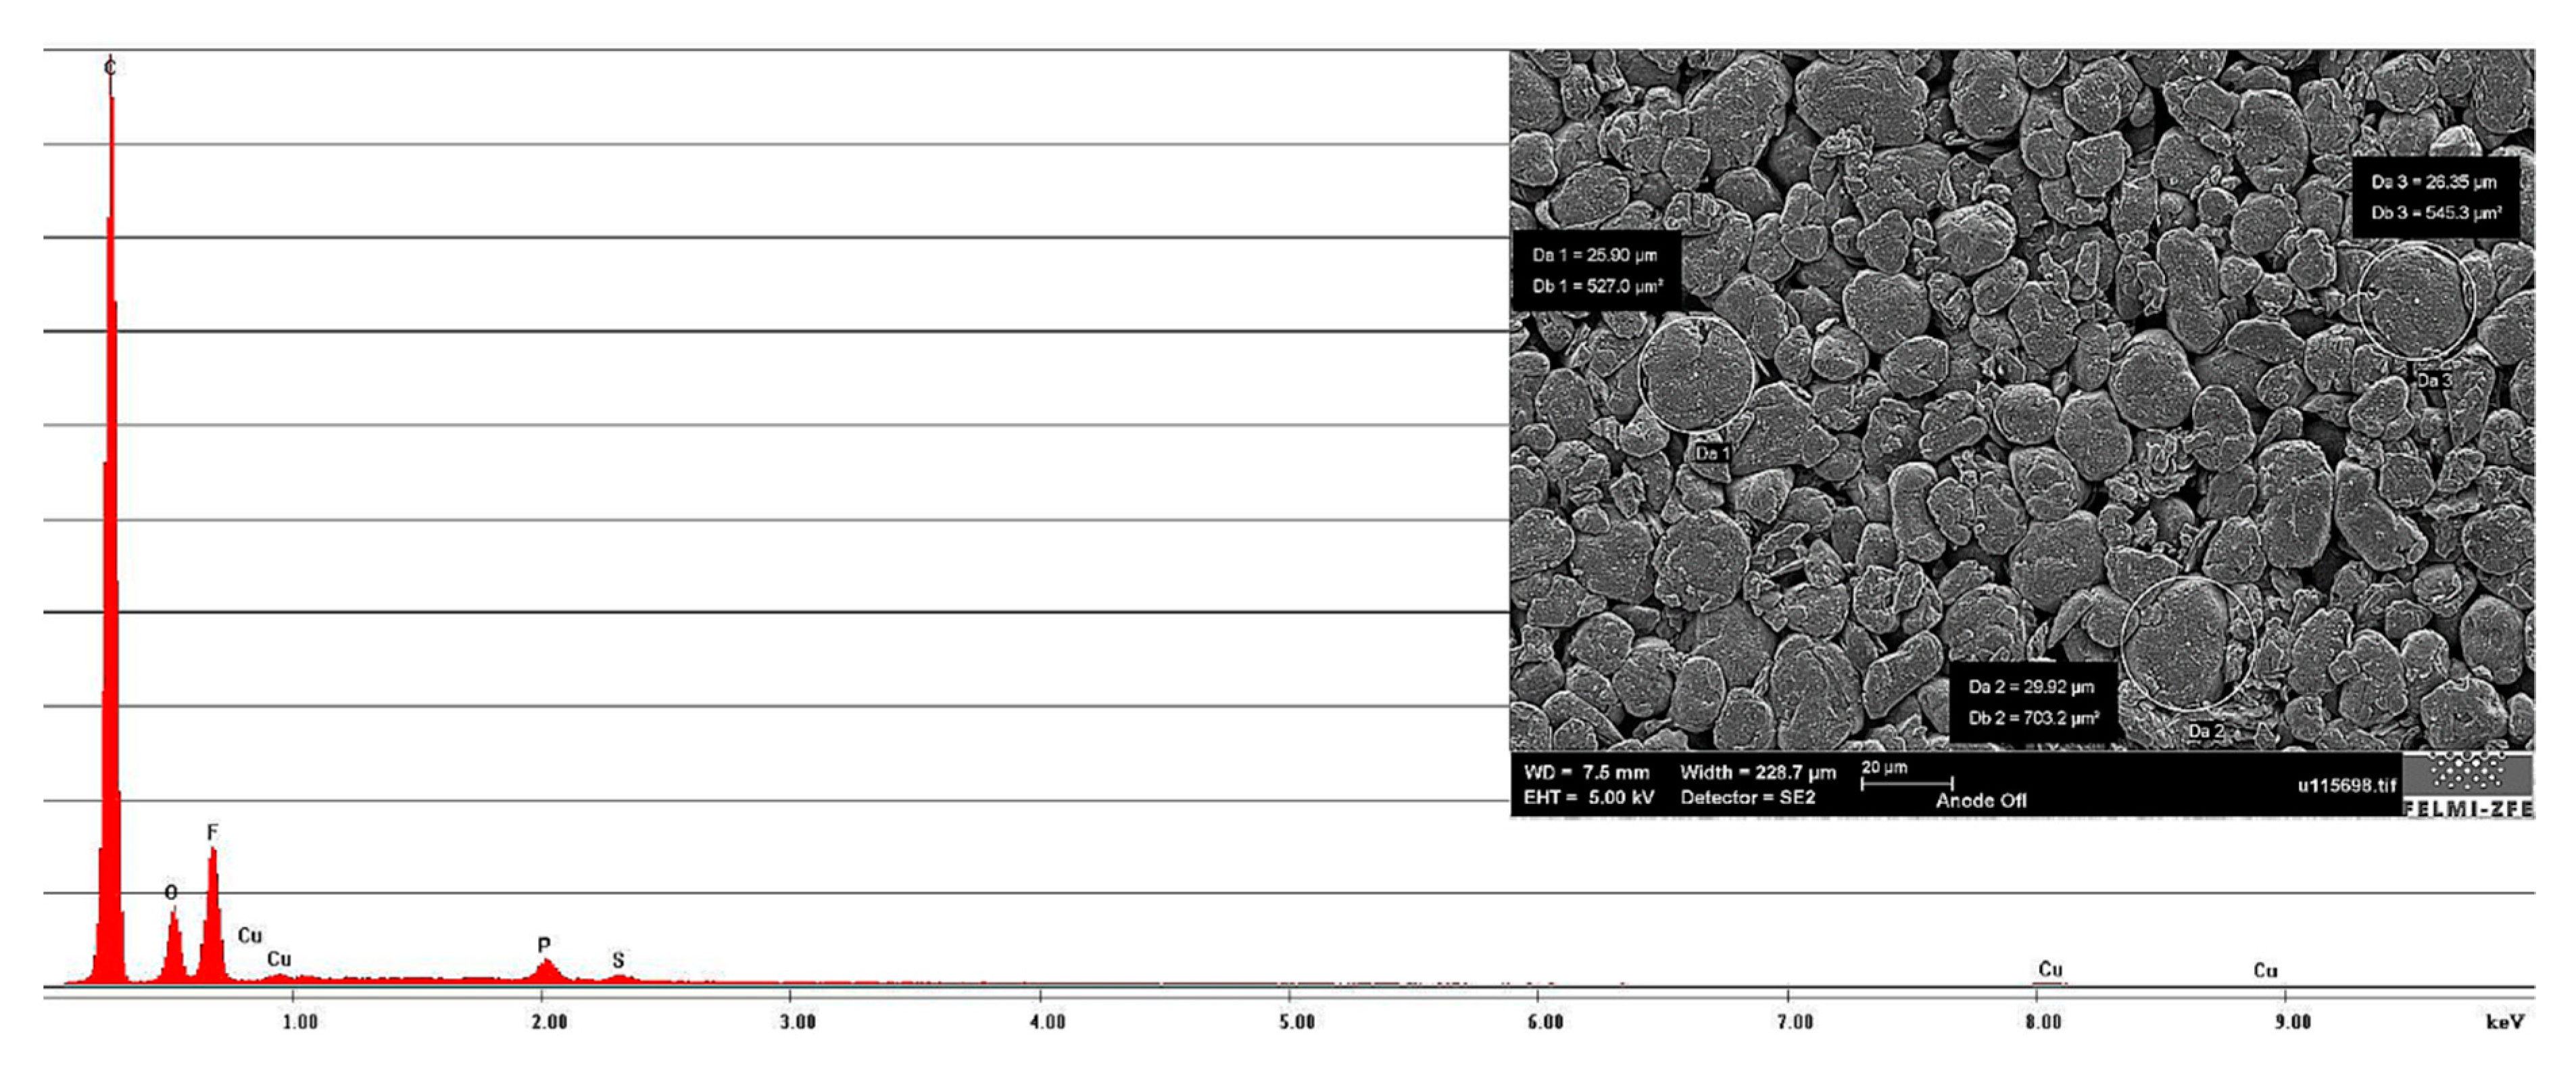
By taking a look at the anode surface, visible in
Figure 9, a granular structure could be clearly identified. The diameter of the biggest particles was found to be approximately 25 µm. The results of the chemical analysis revealed a high carbon (C) content, allowing the classification of the anode active material as graphite. The traces of phosphorous (P) were identified here as remainders of the electrolyte (assumed to be LiPF
6 dissolved in a carbonate-mixture solvent). A high fluorine (F) peak was also visible in the EDXS-spectrum. While the high fluorine content is usually ascribed to the fluorinated binder, this was very likely not the case here. Based on additional experiments, it was possible to determine that the anode active layers could be easily removed with water. This indicated that a water-based slurry was used in the anode manufacturing process. Under these conditions, a conclusion can be made that the fluorine signal can be assigned to the electrolyte decomposition products that are part of the SEI found on the surfaces of the graphite particles. The small copper (Cu) peaks that appear in the spectrogram were due to the sample generation process and can be neglected.
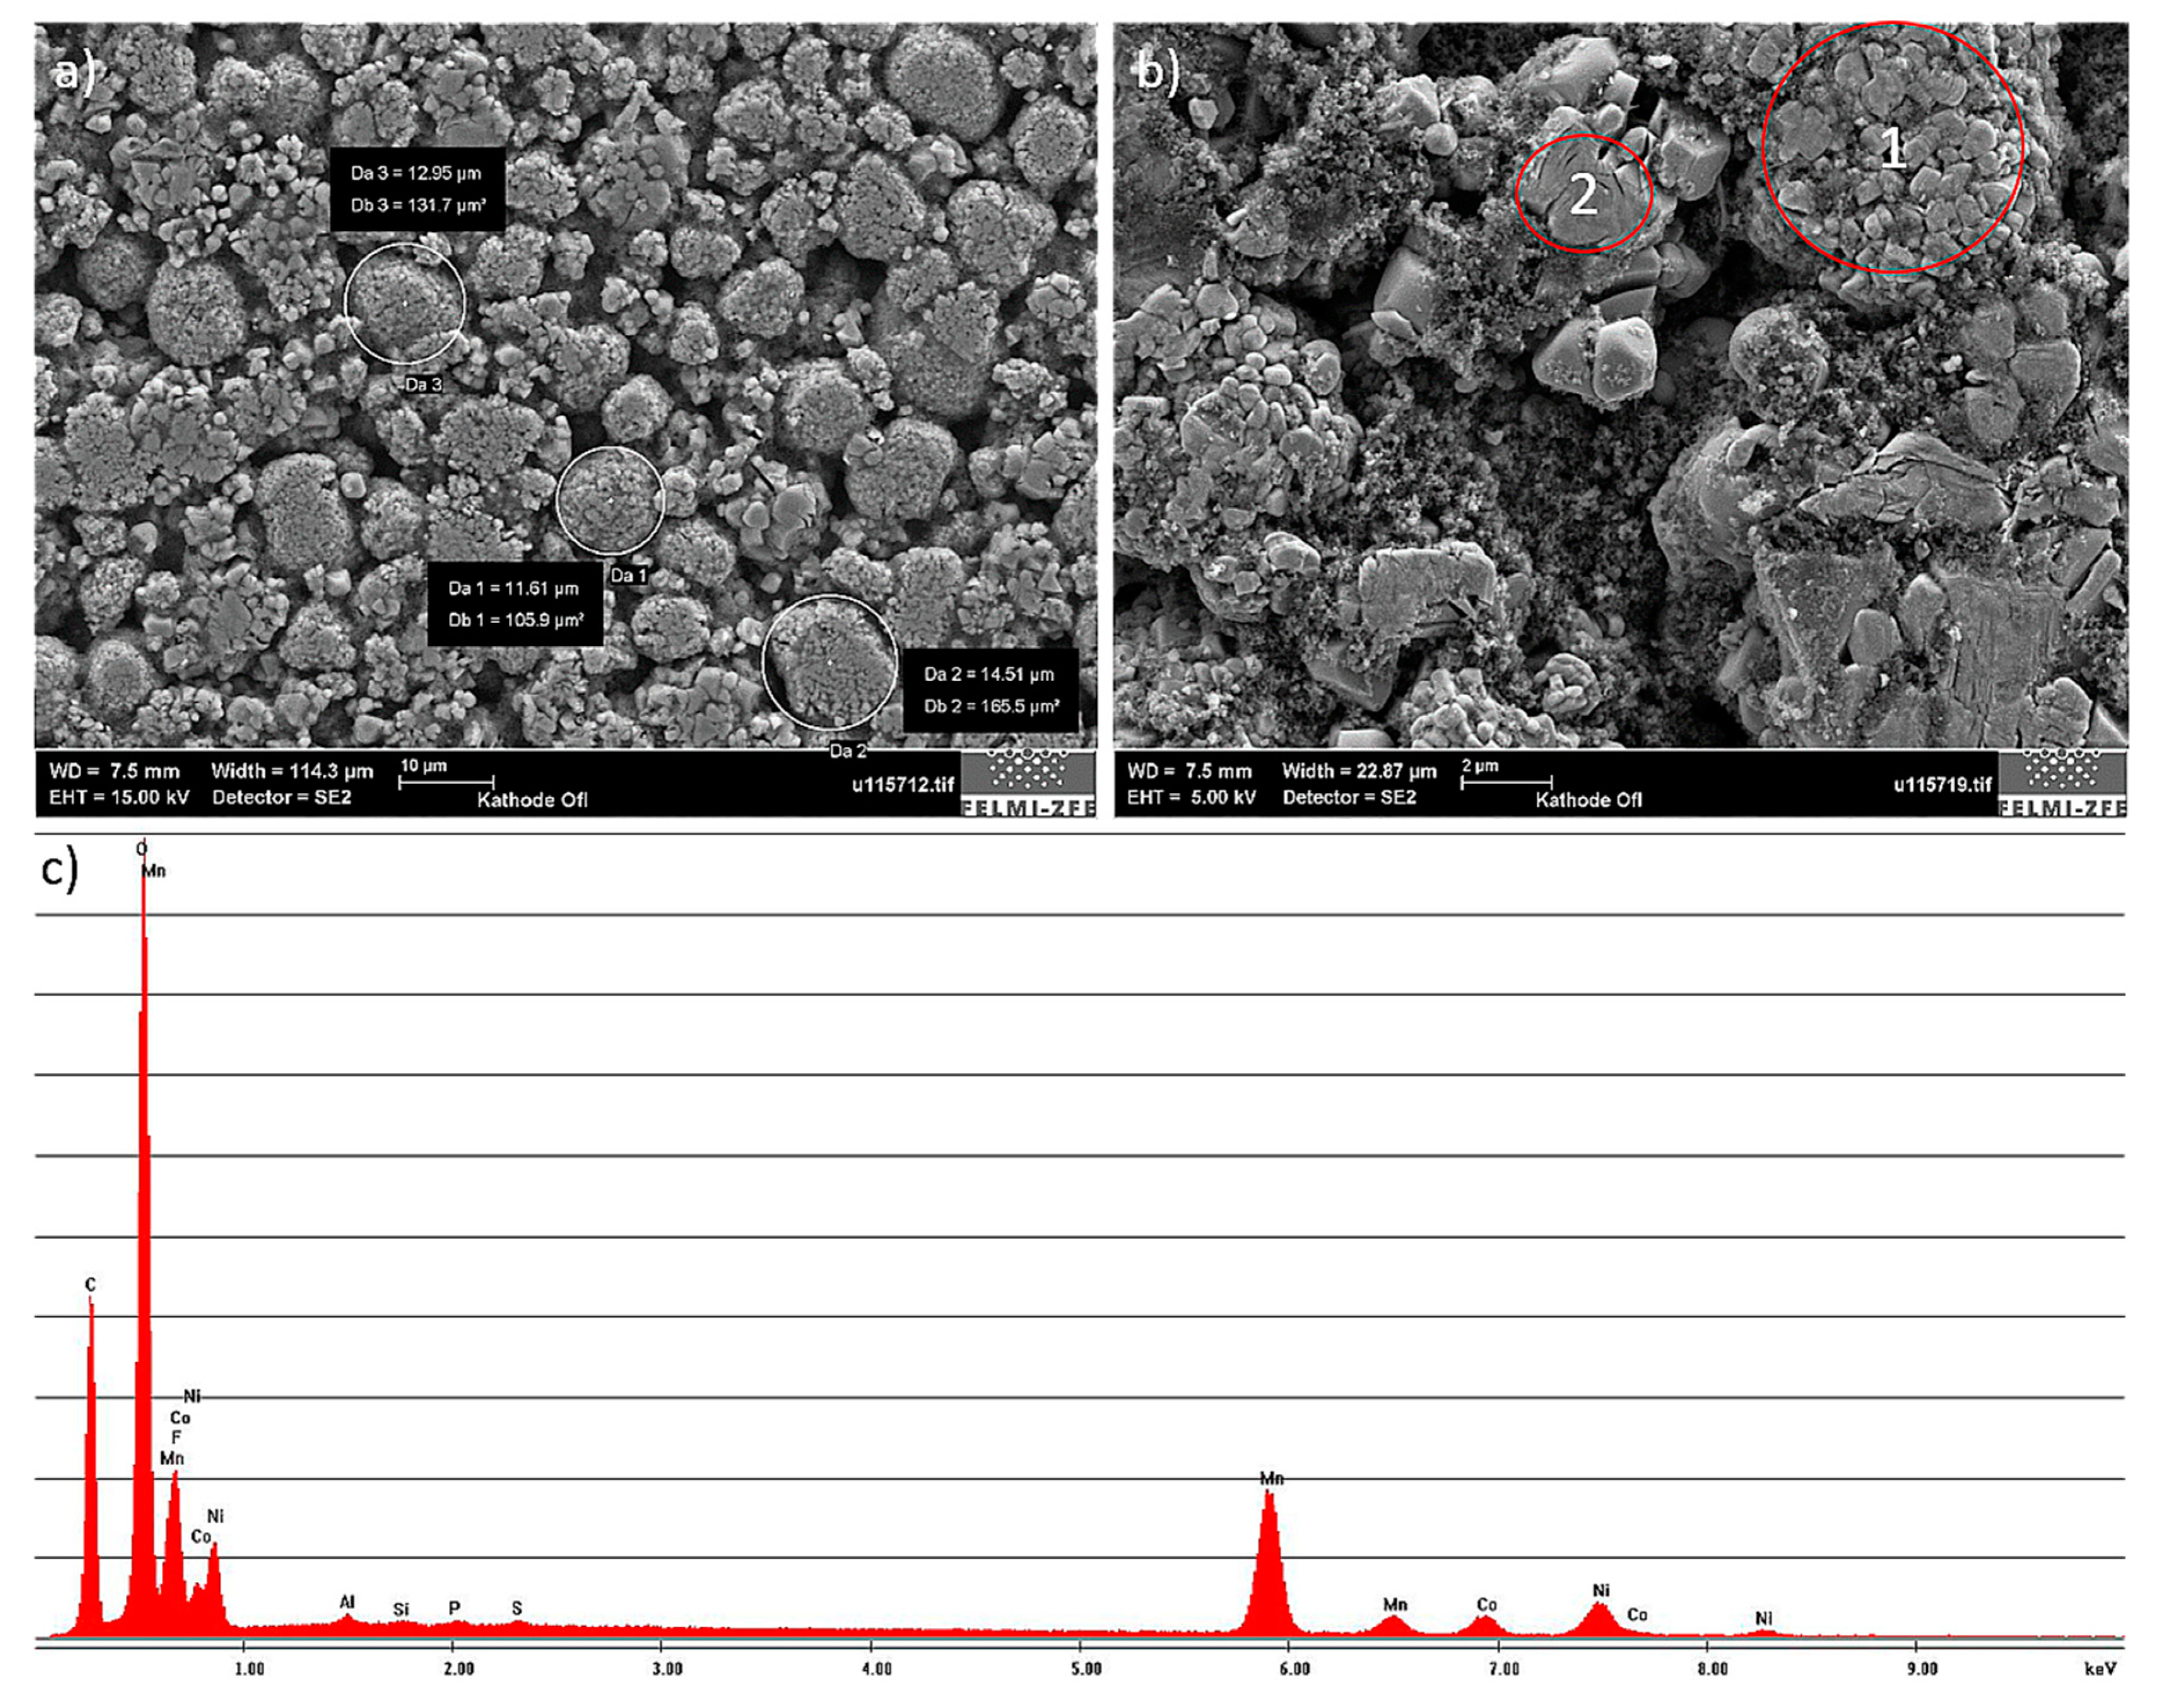
The cathode also showed a granular surface structure (
Figure 10a), whereby the largest particles were about 15 µm. Chemical elements identified by using EDXS were manganese (Mn), cobalt (Co), nickel (Ni), oxygen (O), and carbon (C). This led to the conclusion of a LiNiMnCoO
2 (NMC) cathode chemistry. Two different types of structures were visible on the cathode surface, which are marked with red circles in
Figure 10b. The results of a detailed analysis of the formed compounds show that the compound marked by “1” had the formerly mentioned NMC chemistry, whereas the second structure was determined to be a manganese oxide (LMO) compound. Taking this into account, the chemistry of the cathode layer could be established as a blend of NMC and LMO.
3.2.2. Separator Surface Structure and Pore Size
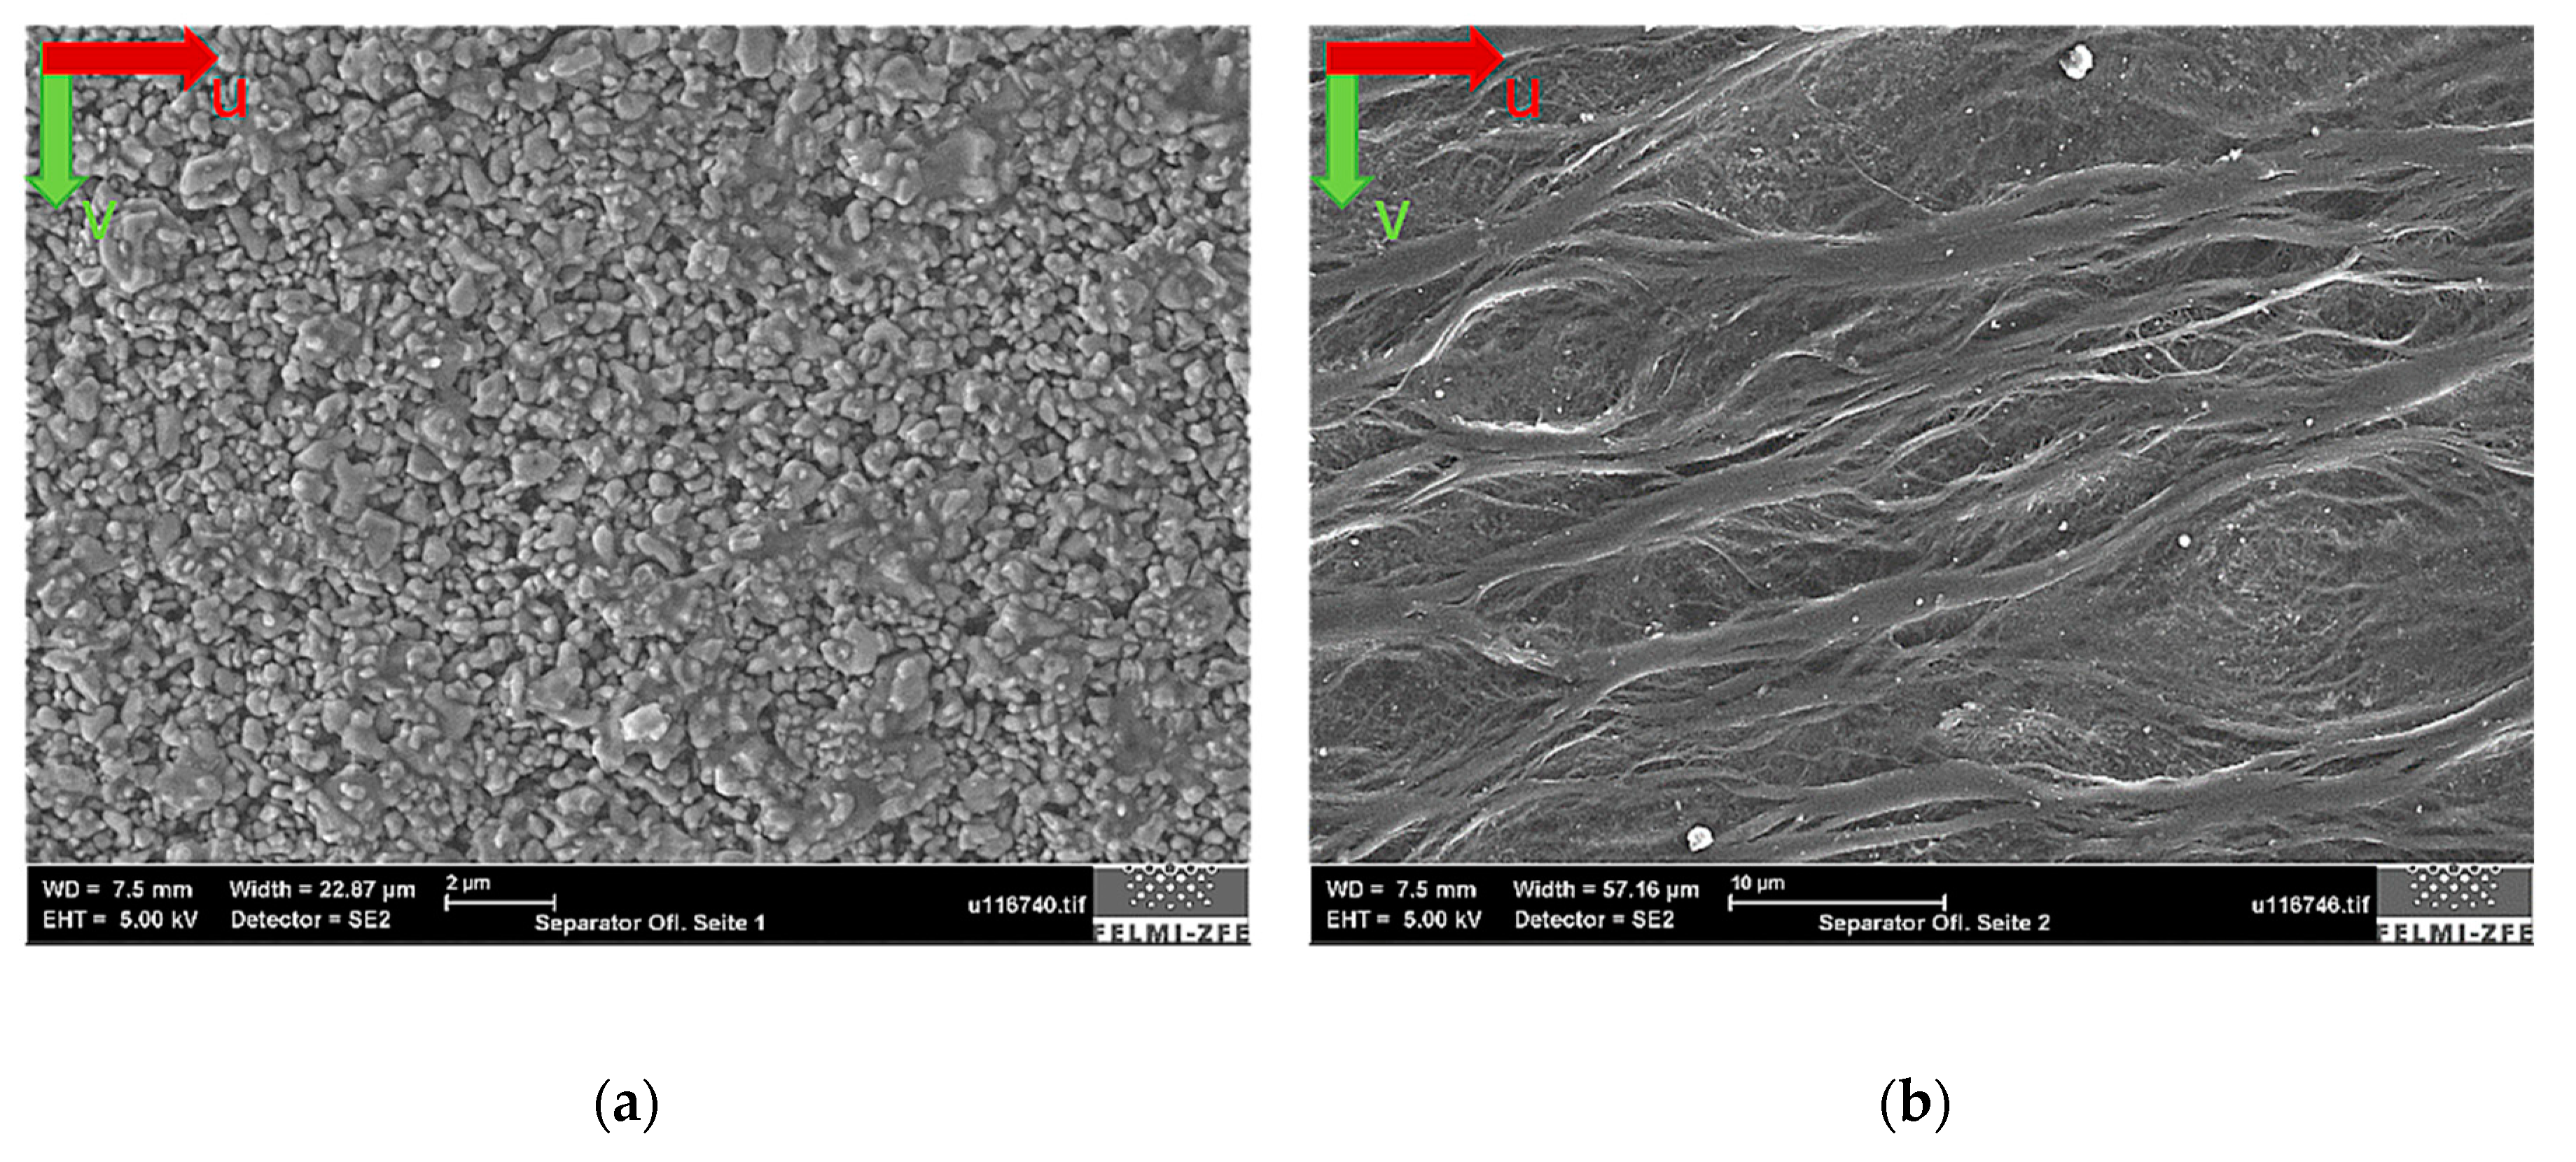
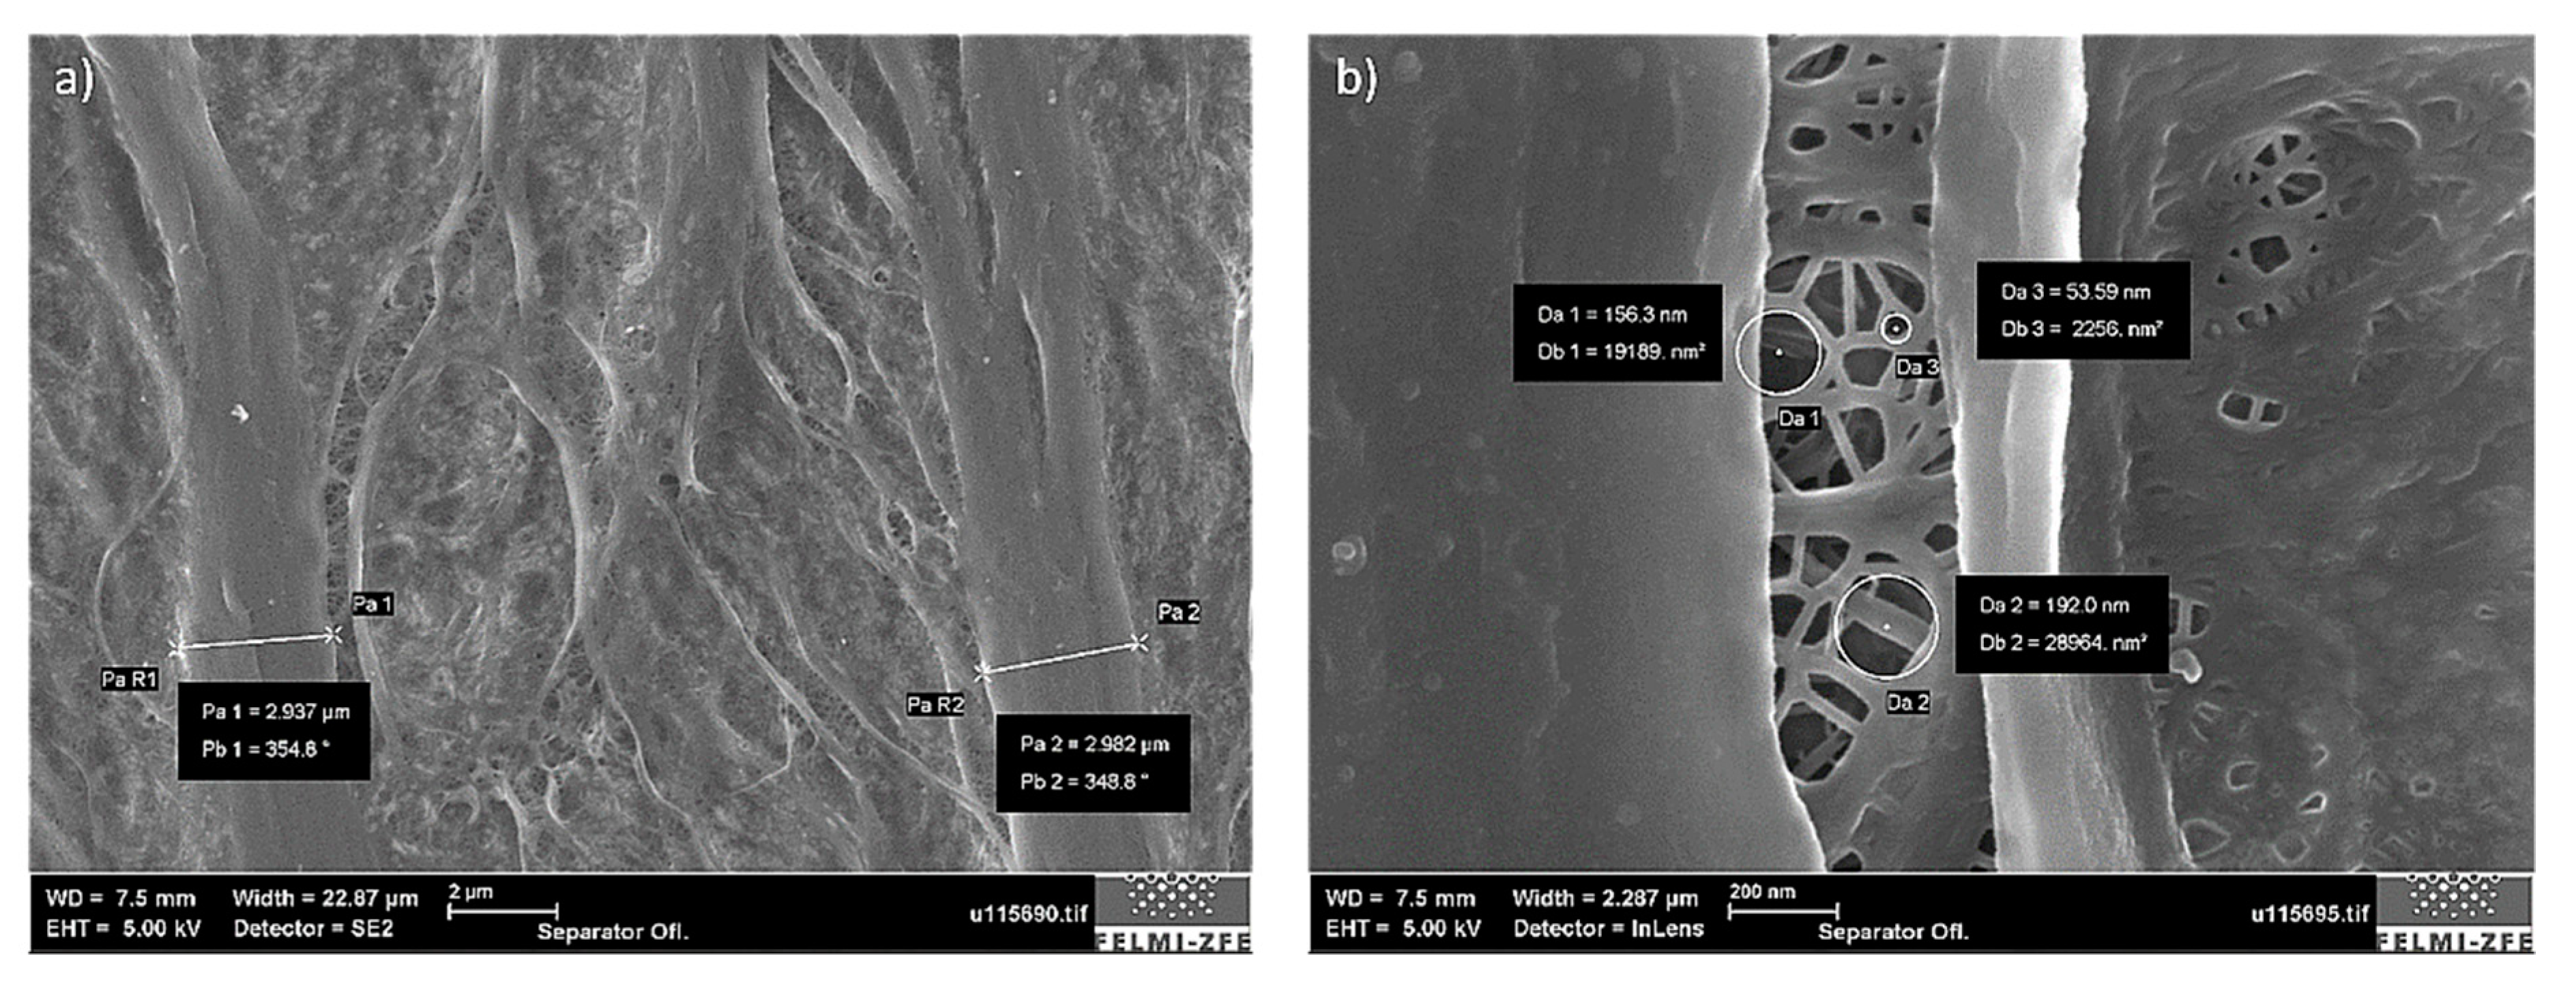
The separator surface structure was investigated to determine the separator fiber thickness and the pore size as well as to determine whether an alumina layer was deposited on the separator membrane, as already stated above.
Figure 11 shows the SEM image results. To the left side, the Al
2O
3 layer is clearly visible. The right side depicts the fiber structure of the polypropylene membrane. The separator fibers were aligned in a direction perpendicular to the battery tabs (machine direction seen as the u-direction on
Figure 3a).
The total separator fiber thickness was around 3 µm, as indicated in
Figure 12a. The underlying pore structure revealed pores with different diameters, the smallest of which were approximately 50 nm (
Figure 12b). A general requirement for the pore size in lithium-ion batteries is that they must be in the sub-micrometre range to prevent dendritic lithium penetration from occurring during the consecutive battery lifetime [
25].
3.3. Measurement Results Light Microscopy
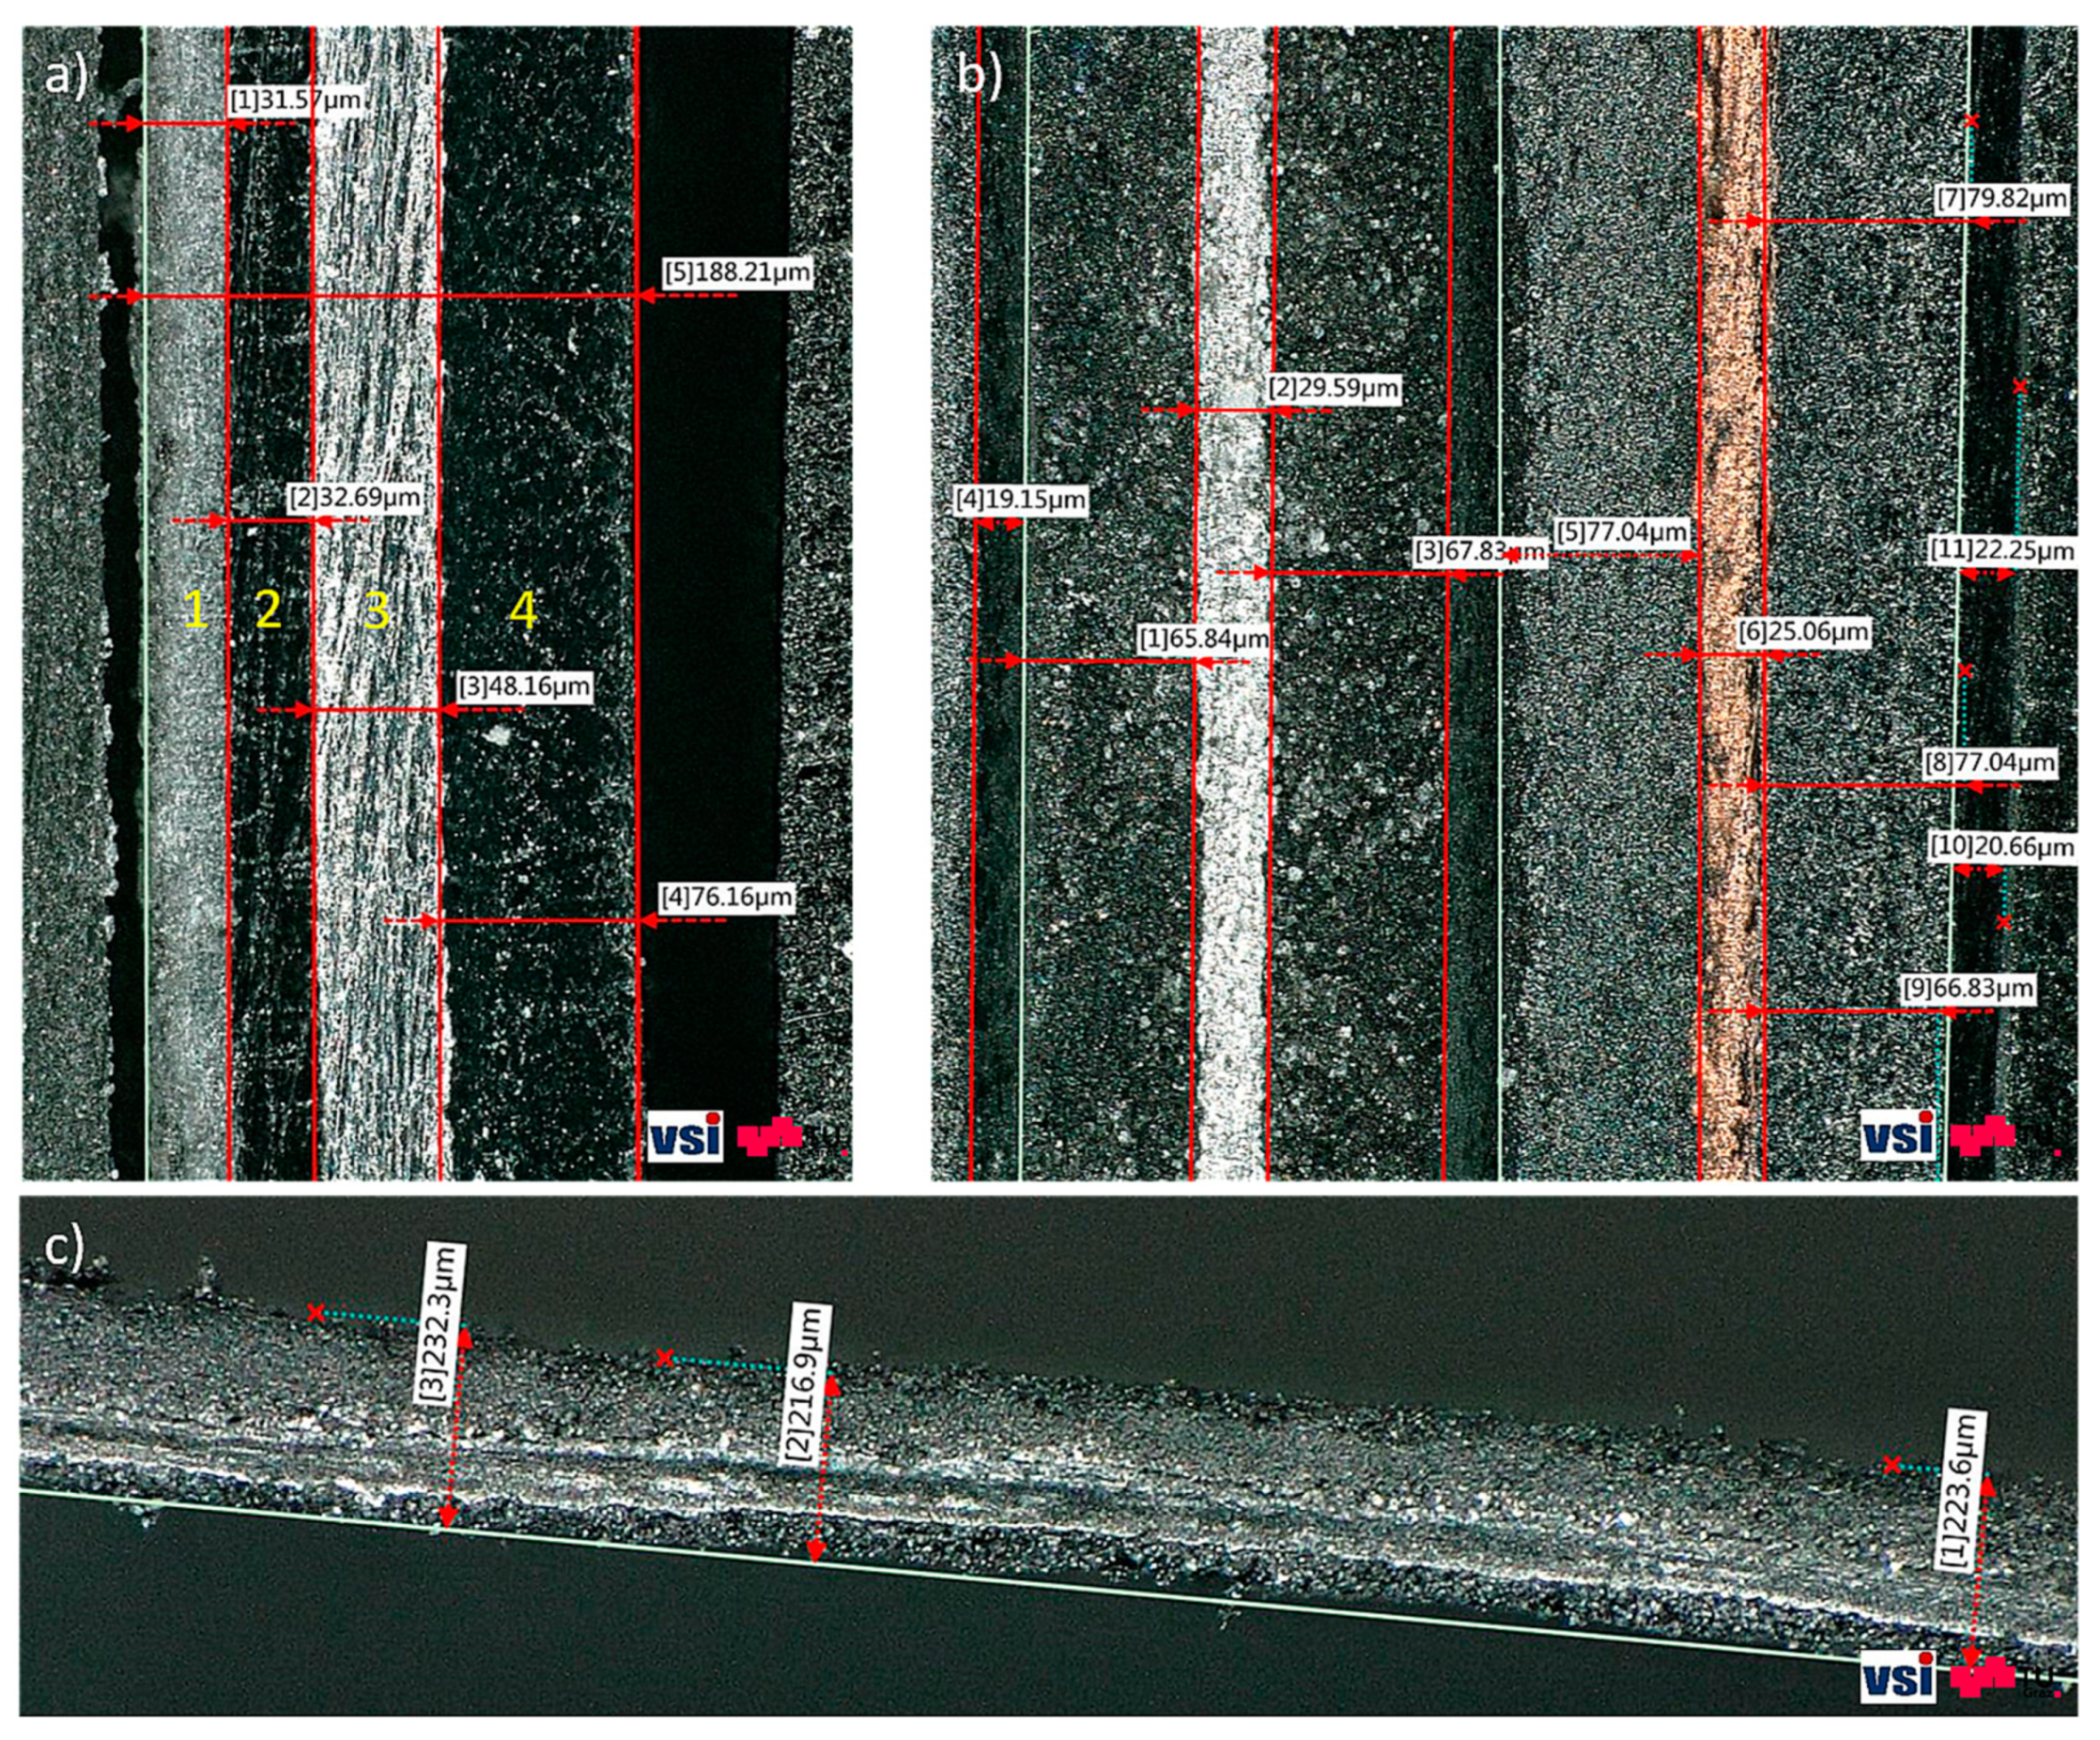
Images of the stacked component structure and the cross-sectional images of the anode were also generated by making use of the test setup, as described in
Section 2.5. In
Figure 13a, the pouch is visualised as a four-layered structure with an overall thickness of 188 µm. It was also possible to measure the thicknesses of all other battery components in the stacked structure (
Figure 13b), although the additional alumina layer on top of the separator was not visible. The total anode thickness was determined to be 175 µm and consisted of a 25 µm-thick Copper CC and a 75 µm-thick AM. The total cathode thickness was approximately 160 µm, including an active material layer of 65 µm and an aluminium current collector of 30 µm. A single, unprocessed anode layer in cross-section can be seen in
Figure 13c, where a deviation in the thickness measurement can be observed as compared to
Figure 8a. This effect can be explained by the sample generation procedure. As a result of the mechanical cutting-out process, the edge of the sample was damaged, resulting in a large variation in sample thickness and inaccurate results.
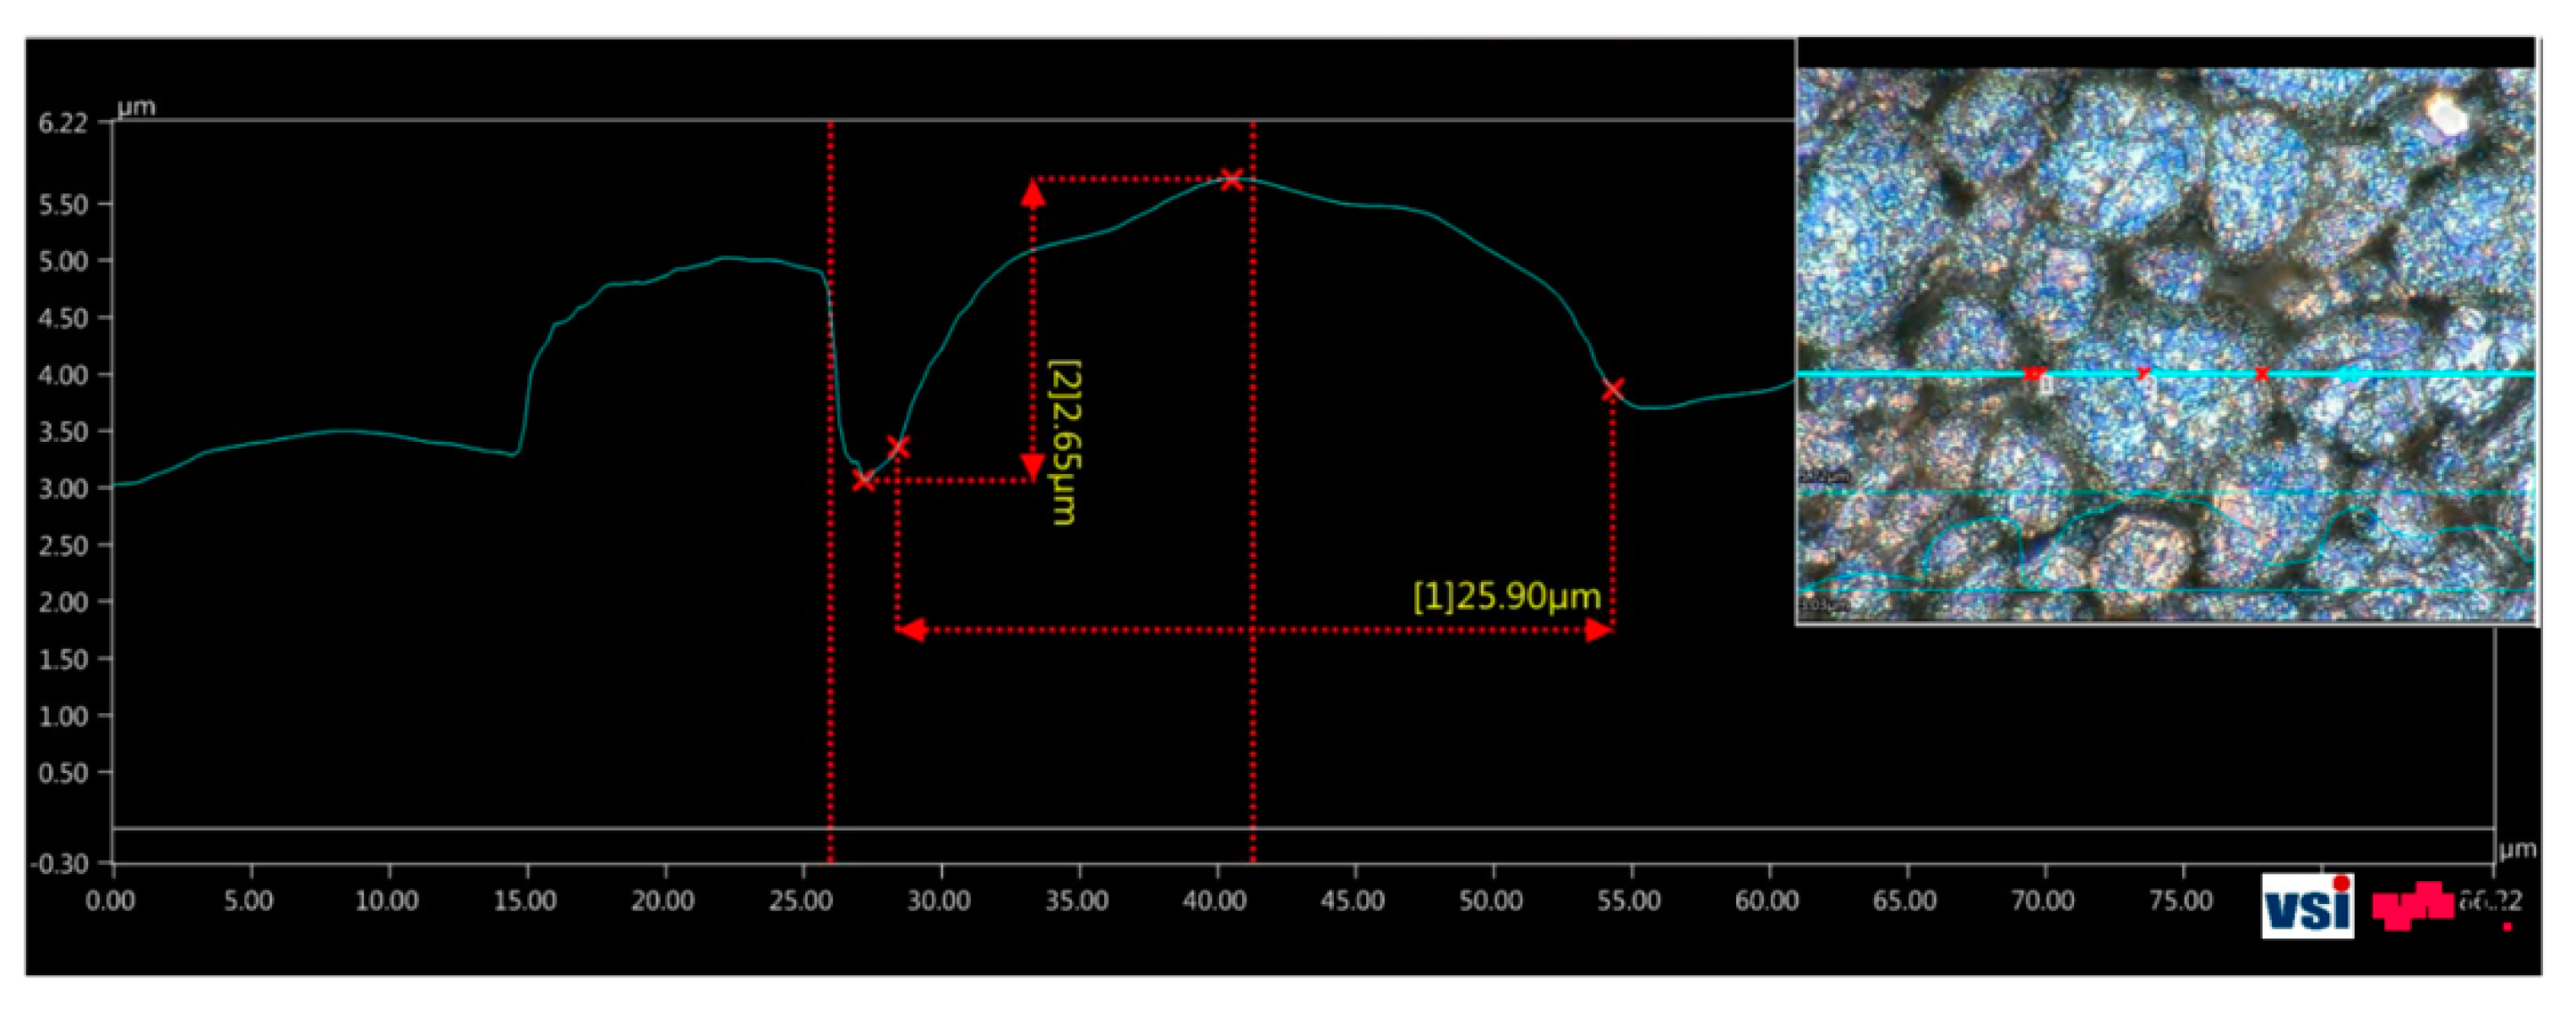
Light microscopy was also used for the identification of the particle sizes in the anode and the cathode surface materials. As an example, the anode surface results are shown.
The imaged surface of the graphite layer is visible at the top right corner of
Figure 14. The generated image contains data along the U-, the V-, and the W-axes, which could be used to conduct volume, distance, and profile measurements on the graphite particles or on the layer surface. Such a profile measurement through the particle of interest allowed the determination of its size (
Figure 14). The largest carbon grains measured had diameters of approximately 25 µm, which was consistent with the data presented in
Section 3.2.1.
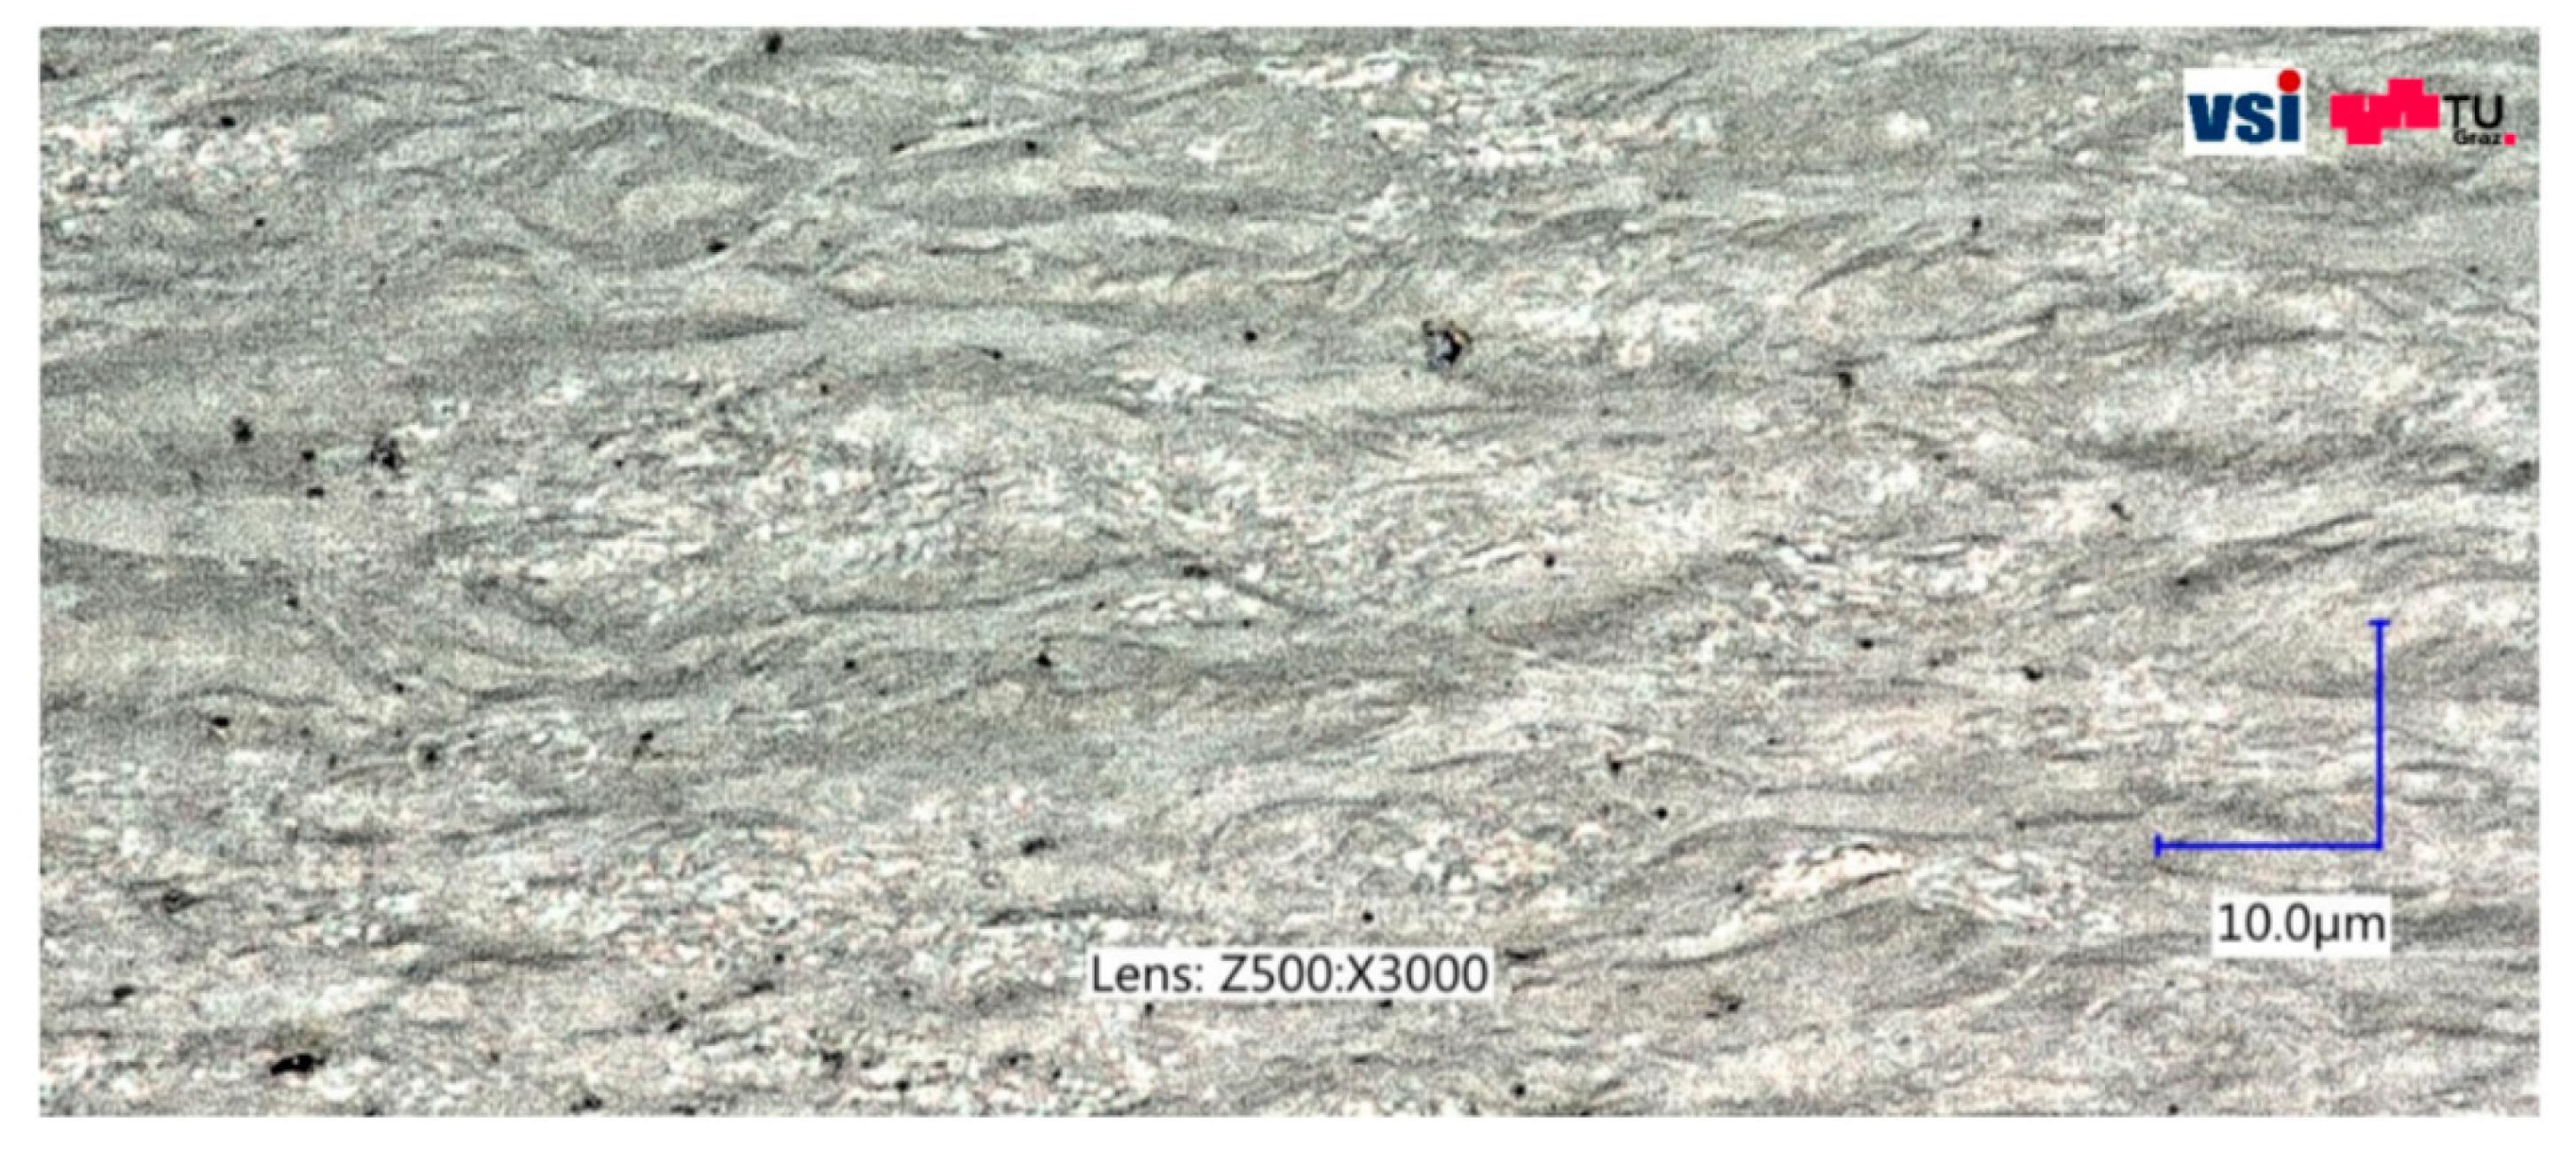
An inspection of the separator surface structure revealed only the membrane fibers, although no information could be gathered regarding the pore size or the fiber thickness (
Figure 15). Nevertheless, the machine direction (u-direction in
Figure 3a) of the separator could be identified by examining the fiber propagation direction.
4. Discussion
The correct determination of the layer thicknesses depended primarily and substantially on the sample generation and the preparation methods used. In this paper, two different investigation approaches for battery component thickness determination are presented. In the first approach, the sizes of single layers in cross section, which were prepared by broad-ion-beam (BIB) cutting, were measured. In the second approach, the battery layer thicknesses were measured directly from the stacked component structure, as described in
Section 2.2.1. A comparison of all the obtained values is shown in
Table 1.
A large difference can be seen in the values determined for both current collectors. The measured thickness of the copper from the stacked sample was double that of the thickness from the BIB-prepared anode sample. The measurement results of the active material thicknesses also varied between the samples, depending on how they were prepared. There are several reasons for the observed variations in thickness:
The variation in the widths of the current collectors is ascribed to the effects of sample polishing. Due to their different material hardness properties, copper and aluminium tend to bend to the sides during the polishing process, thus leading to different final results;
The differences in the observed active material thicknesses arise from differences in the pressure acting on the binder due to the constraint of the stacked structure between two plates;
The difference in pouch thickness can also be accounted for by differences in the applied external clamp pressure.
The approach that gave the best result in the battery layer thickness investigation was the approach taken in the investigation conducted on single-layer components. It was necessary to use the BIB-cutting method in this case to produce an artefact-free cross section and reduce any effects of the sample generation procedure. The sum of all battery layers multiplied by their corresponding thicknesses resulted in a whole-cell thickness of about 8 mm, which corresponded to the thickness measurements made before the cell disassembly and the manufacturers’ data. In comparison, the error obtained when determining the layer size from the stacked structure was about 5%. For detailed battery layer models used for mechanical simulations, for example, this level of accuracy is insufficient. Carrying out an investigation of the layer stack, however, had other advantages and enabled us to identify cell characteristics and visualize layer arrangements inside the battery.
In this study, we used two different imaging techniques, each of which had its own advantages and disadvantages. Depending on the type of information that was relevant for the specific use case, both techniques proved useful and yielded good results. Light microscopy can be used to make layer size measurements rapidly if the sample quality is good or to determine the particle sizes of the anode and the cathode active materials. A huge drawback of optical microscope systems, however, is their resolution. Optical systems are limited to a sample size of several micrometers, which is the reason why the separator coating was not visible in the light microscopy images. For the investigation of smaller structures that form on the battery electrodes or for the determination of pore size of the separator, SEM is a more suitable technique. One of the strengths of SEM is that objects with sub-micrometer sizes can be visualized. Another advantage of electron microscope systems is that they can be used for chemical analysis. During their lifetime, batteries experience changes to their internal layers due to parasitic side reactions with the electrolyte, leading to the formation of decomposition products. Valuable chemical information about such degradation products can be obtained with the use of EDXS.
Comparable studies [
26,
27] have shown values for the thicknesses of individual layers that are consistent with the ones obtained in this study. No information, however, has been previously provided on the types of samples used, their generation procedures, or the measurement setups. The testing methodology proposed in this paper provides a rapid and convenient way to obtain highly accurate results by eliminating factors that can have huge impact on the measurement itself (sample cutting-out process).
5. Conclusions
In this paper, we described the development of a “best practice” methodology for sample generation and preparation as well as an investigation of the battery layer structure and chemical composition.
A unique battery pack and battery module disassembly procedure was presented in this work, which provided insight on how to acquire damage-free pouch cells for a subsequent post-mortem analysis. A new sample generation and preparation method for the visualization of the battery layer arrangement and the analysis of the battery manufacturing details was described. The analysis of the stacked layer samples revealed interesting artefacts inside the battery under investigation, examples of which included an additional separator layer in the battery tab area, and showed that the separator and the pouch were welded along the battery edge. The methodology used proved useful for the investigation of pouch cells, especially because it yields highly accurate results and can be easily adapted for investigations on different pouch cell types.
The best results for the thicknesses of all battery layers were obtained through investigations conducted on single components, the cross-sections of which were prepared by broad-ion-beam cutting. In this case, a high-resolution optical imaging system could be used, because all battery layers were thicker than 10 µm. It was also possible to rapidly determine the size of the particles of the active material of both electrodes using light microscopy. Our findings indicate, however, that different investigation techniques (SEM, EDXS) should be used to conduct a more detailed structural analysis of the anode (e.g., visualization of coatings or additional layers, determination of the pore size of the separator, or visualization of grain structure) and to determine the material composition of the individual layers.
The results of this work highlight the need for precise sample generation and preparation methods for the post-mortem analysis of batteries and the need for careful selection of a suitable sample investigation technique based on the specific use case. In the field of battery safety research, qualitative results can only be obtained if the battery layer size and the material composition can be precisely determined. The findings of this research will help other researchers construct better mechanical and multi-physical models, which can accurately be used to predict safety hazards associated with lithium ion batteries.
Author Contributions
Conceptualization, G.G. and G.K.; methodology, G.K., L.A. and H.S.; investigation, G.K. and H.S.; writing—original draft preparation, G.K. and H.S.; writing—review and editing, G.G., I.H., H.M.R.W., M.W. and A.F.; review and supervision, W.S.; project administration, C.E.
Funding
This work was conducted as part of the research project SafeBattery. The K-project SafeBattery is funded by the Federal Ministry for Transport, Innovation and Technology (BMVIT), Federal Ministry of Digital and Economic Affairs (BMDW), Austria and Land Steiermark within the framework of the COMET—Competence Centers for Excellent Technologies program. The COMET program is administered by the FFG.
Acknowledgments
The authors thank the consortium members of the SafeBattery project for their valuable input to this work.
Conflicts of Interest
The authors declare no conflict of interest.
Nomenclature
| SEM | Scanning Electron Microscopy |
| AM | Active Material |
| CC | Current Collector |
| SOC | State of Charge |
| FESEM | Field Emission Scanning Electron Microscope |
| EDXS | Energy Dispersive X-ray Spectroscopy |
| EBSD | Electron Backscatter Diffraction |
| BIB | Broad-ion Beam |
| BSE | Backscattered Electrons |
| SE | Secondary Electrons |
| SEI | Secondary Electron Inlens Detector |
| ETD | Everhart Thornley Detector |
| HDAsB | High Definition Angle Selective Backscatter Electron Detector |
| C | Carbon |
| P | Phosphorous |
| F | Fluorine |
| Cu | Copper |
| Li | Lithium |
| Ni | Nickel |
| Mn | Manganese |
| Co | Cobalt |
| O | Oxygen |
| NMC | Lithium-nickel-manganese-cobalt-oxide |
| LMO | Lithium-manganese-oxide |
References
- Qian, D.; Ma, C.; More, K.L.; Meng, Y.S.; Chi, M. Advanced analytical electron microscopy for lithium-ion batteries. NPG Asia Mater. 2015, 7, e193. [Google Scholar] [CrossRef]
- Chen, D. Microscopic Investigations of Degradation in Lithium-Ion Batteries; Karlsruhe Institute of Technology (KIT): Karlsruhe, Germany, 2012. [Google Scholar]
- Steiger, J. Mechanisms of Dendrite Growth in Lithium Metal Batteries; Karlsruhe Institute of Technology (KIT): Karlsruhe, Germany, 2015. [Google Scholar]
- Unocic, R.R.; Sun, X.-G.; Sacci, R.L.; Adamczyk, L.A.; Alsem, D.H.; Dai, S.; Dudney, N.J.; More, K.L. Direct visualization of solid electrolyte interphase formation in lithium-ion batteries with in situ electrochemical transmission electron microscopy. Microsc. Microanal. 2014, 20, 1029–1037. [Google Scholar] [CrossRef] [PubMed]
- Breitfuss, C.; Sinz, W.; Feist, F.; Gstrein, G.; Lichtenegger, B.; Knauder, C.; Ellersdorfer, C.; Moser, J.; Steffan, H.; Stadler, M.; et al. A ‘Microscopic’ Structural Mechanics FE Model of a Lithium-Ion Pouch Cell for Quasi-Static Load Cases. SAE Int. J. Passeng. Cars Mech. Syst. 2013, 6, 1044–1054. [Google Scholar] [CrossRef]
- Zhu, J.; Zhang, X.; Luo, H.; Sahraei, E. Investigation of the deformation mechanisms of lithium-ion battery components using in-situ micro tests. Appl. Energy 2018, 224, 251–266. [Google Scholar] [CrossRef]
- Rajagopalan Kannan, D.R.; Terala, P.K.; Moss, P.L.; Weatherspoon, M.H. Analysis of the Separator Thickness and Porosity on the Performance of Lithium-Ion Batteries. Int. J. Electrochem. 2018, 2018, 1–7. [Google Scholar] [CrossRef]
- Krafft, R.; Schappacher, F.; Winter, M. Pore size change in commercial lithium-ion battery separators. In Proceedings of the Battery Power, Aachen, Germany, 27 April 2015. [Google Scholar]
- Cen, Y.; Qin, Q.; Sisson, R.D.; Liang, J. Effect of Particle Size and Surface Treatment on Si/Graphene Nanocomposite Lithium-Ion Battery Anodes. Electrochim. Acta 2017, 251, 690–698. [Google Scholar] [CrossRef]
- Waldmann, T.; Wilka, M.; Kasper, M.; Fleischhammer, M.; Wohlfahrt-Mehrens, M. Temperature dependent ageing mechanisms in Lithium-ion batteries—A Post-Mortem study. J. Power Sources 2014, 262, 129–135. [Google Scholar] [CrossRef]
- Stiaszny, B.; Ziegler, J.C.; Krauß, E.E.; Schmidt, J.P.; Ivers-Tiffée, E. Electrochemical characterization and post-mortem analysis of aged LiMn2O4–Li(Ni0.5Mn0.3Co0.2)O2/graphite lithium ion batteries. Part I: Cycle aging. J. Power Sources 2014, 251, 439–450. [Google Scholar] [CrossRef]
- Waldmann, T.; Quinn, J.B.; Richter, K.; Kasper, M.; Tost, A.; Klein, A.; Wohlfahrt-Mehrens, M. Electrochemical, Post-Mortem, and ARC Analysis of Li-Ion Cell Safety in Second-Life Applications. J. Electrochem. Soc. 2017, 164, A3154–A3162. [Google Scholar] [CrossRef] [Green Version]
- Tadiran Batteries GmbH. Transport of Lithium Metal and Lithium Ion Batteries; Tadiran Batteries GmbH: Budingen, Germany, 2017. [Google Scholar]
- Waldmann, T.; Iturrondobeitia, A.; Kasper, M.; Ghanbari, N.; Aguesse, F.; Bekaert, E.; Daniel, L.; Genies, S.; Gordon, I.J.; Löble, M.W.; et al. Review—Post-Mortem Analysis of Aged Lithium-Ion Batteries: Disassembly Methodology and Physico-Chemical Analysis Techniques. J. Electrochem. Soc. 2016, 163, A2149–A2164. [Google Scholar] [CrossRef]
- Moretti, A.; Carvalho, D.V.; Ehteshami, N.; Paillard, E.; Porcher, W.; Brun-Buisson, D.; Ducros, J.-B.; de Meatza, I.; Eguia-Barrio, A.; Trad, K.; et al. A Post-Mortem Study of Stacked 16 Ah Graphite//LiFePO4 Pouch Cells Cycled at 5 °C. Batteries 2019, 5, 45. [Google Scholar] [CrossRef]
- Wagner, J.; Zankel, A.; Reingruber, H.; Mayrhofer, C.; Schröttner, H.; Rattenberger, J. Diamond Knife Versus Gallium Ions; Elsevier: Amsterdam, The Netherlands, 2013; pp. 287–288. [Google Scholar]
- Stoeckl, B.; Subotić, V.; Preininger, M.; Schwaiger, M.; Evic, N.; Schroettner, H.; Hochenauer, C. Characterization and performance evaluation of ammonia as fuel for solid oxide fuel cells with Ni/YSZ anodes. Electrochim. Acta 2019, 298, 874–883. [Google Scholar] [CrossRef]
- Velkavrh, I.; Ausserer, F.; Klien, S.; Voyer, J.; Diem, A.; Lingenhöle, K.; Kafexhiu, F.; Mandrino, D.; Podgornik, B.; Rattenberger, J.; et al. Properties of nitrocarburised and oxidised steel surfaces and the correlation with their tribological behavior under unlubricated sliding conditions. Wear 2018, 410–411, 127–141. [Google Scholar] [CrossRef]
- Rattenberger, J.; Melischnig, A.; Schröttner, H.; Letofsky-Papst, I.; Mertschnigg, S.; Hofer, F. Sputtering Thin Films for High Resolution Scanning Electron Microscopy; Elsevier: Amsterdam, The Netherlands, 2014. [Google Scholar]
- Schröttner, H. Die Elektronenmikroskopie in der Materialforschung; Elsevier: Amsterdam, The Netherlands, 2008; p. 23. [Google Scholar]
- Rattenberger, J.; Schröttner, H.; Wagner, J.; Hofer, F. X-ray microanalysis in the environmental or variable pressure scanning electron microscope. In Proceedings of the Microscopy Conference 2013, Regensburg, Deutschland, 25–30 August 2013; pp. 146–147. [Google Scholar]
- Sharma, G.; Jin, Y.; Lin, Y.S. Lithium Ion Batteries with Alumina Separator for Improved Safety. J. Electrochem. Soc. 2017, 164, A1184–A1191. [Google Scholar] [CrossRef]
- Orendorff, C.J. The Role of Separators in Lithium-Ion Cell Safety. Interface Mag. 2012, 21, 61–65. [Google Scholar] [CrossRef]
- Jung, W.; Kim, H.K.; Kim, M.; Lee, K.-J. Spatial measurement of heat generation in a pouch-type lithium-ion battery. Int. J. Precis. Eng. Manuf. 2016, 17, 1085–1089. [Google Scholar] [CrossRef]
- Arora, P.; Zhang, Z. Battery Separators. Chem. Rev. 2004, 104, 4419–4462. [Google Scholar] [CrossRef] [PubMed]
- Rieger, B.; Schlueter, S.; Erhard, S.V.; Schmalz, J.; Reinhart, G.; Jossen, A. Multi-scale investigation of thickness changes in a commercial pouch type lithium-ion battery. J. Energy Storage 2016, 6, 213–221. [Google Scholar] [CrossRef]
- Taheri, P.; Yazdanpour, M.; Bahrami, M. Transient three-dimensional thermal model for batteries with thin electrodes. J. Power Sources 2013, 243, 280–289. [Google Scholar] [CrossRef]
Figure 1.
(a) Disassembly of the battery pack showing horizontally and vertically oriented modules inside. A total number of 24 modules were extracted, each of which contained eight cells; (b) six modules, which were taken out of the battery pack.
Figure 1.
(a) Disassembly of the battery pack showing horizontally and vertically oriented modules inside. A total number of 24 modules were extracted, each of which contained eight cells; (b) six modules, which were taken out of the battery pack.
Figure 2.
Battery module disassembly method. (a) Removal of the caps and bolts that hold the module together; (b) separation of the two four-cell stack with a 0.7 mm nylon rope; (c) module separated into two parts; (d) module disassembled into parts (two four-cell stacks, module housing, compression pad, and connection bolts); (e) cutting the tab connection; (f) separation of the cells from each other using a nylon rope; (g) location of the connection points between the plastic frame and the pouch; and (h) removal of the plastic frame.
Figure 3.
(a) Sample generation locations for the investigation of the stacked layer structure. #1—anode tab, #2—cathode tab, #3—middle of the side opposite to the tabs. (b) Sample generated at position 1; (c) sample generated at position 2.
Figure 3.
(a) Sample generation locations for the investigation of the stacked layer structure. #1—anode tab, #2—cathode tab, #3—middle of the side opposite to the tabs. (b) Sample generated at position 1; (c) sample generated at position 2.
Figure 4.
Dry-polished layer stack structure used for identification of cell-specific parameters and layer arrangements. The presented sample was generated from the side of battery that was opposite to the battery tabs.
Figure 4.
Dry-polished layer stack structure used for identification of cell-specific parameters and layer arrangements. The presented sample was generated from the side of battery that was opposite to the battery tabs.
Figure 5.
Cross-sectional images of Sample #3 as generated from the battery side, positioned opposite to the cell tabs. (a) View of the sample edge where the separator is welded at the pouch sealing point; (b) extension of the separator from the edge towards the middle of the battery and the cell layer arrangement.
Figure 6.
Imaging results of Sample #3. (a) Closer view of the battery cathode, where a small 3 µm layer is visible on both sides of the active material; (b) battery layer arrangement; (c) closer look at battery anode, cathode, separator, and pouch; and (d) the four-layer battery pouch, consisting of one Al layer (3) and three carbon oxide layers (1, 2, and 4).
Figure 7.
Imaging results of Sample #1, generated at the anode tab. (a) All copper current collectors extended to the tab area, where they were point-welded; (b) additional separator layer was measured from the beginning of the cathode layer with (d) a length of about 2 mm. (c) Measured anode and (e) cathode thicknesses from the stacked layer sample.
Figure 8.
Single-layer analysis in cross-section of the (a) anode, (b) the separator, and (c) the cathode after the broad-ion-beam cutting procedure.
Figure 8.
Single-layer analysis in cross-section of the (a) anode, (b) the separator, and (c) the cathode after the broad-ion-beam cutting procedure.
Figure 9.
Anode surface image with measured grain size and energy dispersive X-ray spectroscopy (EDXS)-spectrum of the anode, showing the chemical elements on the anode surface.
Figure 9.
Anode surface image with measured grain size and energy dispersive X-ray spectroscopy (EDXS)-spectrum of the anode, showing the chemical elements on the anode surface.
Figure 10.
Surface imaging and structure identification of the battery cathode. (a) The cathode granular surface structure, whereby the largest grains were about 15 µm. (b) The two types of structures identified on the cathode surface; here, “1” marks the LiNiMnCoO2 (NMC) compound, whereas “2” marks the formed manganese oxide (LMO). (c) Chemical elements determined on the anode surface by EDXS.
Figure 11.
SEM images of the separator surface structure on both sides. To the left (a), an Al2O3 (alumina) layer deposited on the membrane surface is visible. To the right (b), the fiber structure of the microporous membrane can be seen. Here, “u” and “v” denote the machine and the transversal directions of the battery and its layers.
Figure 12.
Separator fiber thickness and pore size determination: (a) shows the thickness of the largest fibers with diameters of about 3 µm, (b) reveals a pore size of about 50 nm.
Figure 12.
Separator fiber thickness and pore size determination: (a) shows the thickness of the largest fibers with diameters of about 3 µm, (b) reveals a pore size of about 50 nm.
Figure 13.
Cross-sectional imaging results generated by high-resolution light microscopy. (a) Pouch identified as a four-layer structure (carbon oxides marked with 1, 2, and 4 and aluminium marked with 3); (b) thickness measurements of the anode, the cathode, and the separator comparable to those determined with the SEM; (c) cross-sectional image of an unprocessed anode layer.
Figure 14.
Measurement of particle sizes in the anode surface material with an optical microscope.
Figure 14.
Measurement of particle sizes in the anode surface material with an optical microscope.
Figure 15.
Separator structure as visualised by optical microscopy. The largest fibers propagate in the machine direction of the separator.
Figure 15.
Separator structure as visualised by optical microscopy. The largest fibers propagate in the machine direction of the separator.
Table 1.
Table containing values for the measured thicknesses of all battery components prepared using the broad-ion-beam (BIB) cutting and mechanical polishing methods.
Table 1.
Table containing values for the measured thicknesses of all battery components prepared using the broad-ion-beam (BIB) cutting and mechanical polishing methods.
| Thicknesses of Single Layer Component Samples, Prepared by the BIB-Cutting Method |
| Component | Thickness (µm) | Component | Thickness (µm) | Component | Thickness (µm) |
| Anode | 140 | Cathode | 170 | Separator | 20 |
| Anode CC | 10 | Cathode CC | 20 | Pouch | 190 |
| Anode AM | 65 | Cathode AM | 75 | | |
| Thicknesses as Measured from the Polished Stacked Component Structure |
| Component | Thickness (µm) | Component | Thickness (µm) | Component | Thickness (µm) |
| Anode | 140 | Cathode | 155 | Separator | 20 |
| Anode CC | 20 | Cathode CC | 25 | Pouch | 170 |
| Anode AM | 60 | Cathode AM | 65 | | |
© 2019 by the authors. Licensee MDPI, Basel, Switzerland. This article is an open access article distributed under the terms and conditions of the Creative Commons Attribution (CC BY) license (http://creativecommons.org/licenses/by/4.0/).

 ,
, 


