Review

Big Data and Its Applications in Smart Real Estate and the Disaster Management Life Cycle: A Systematic Analysis

1
Faculty of Built Environment, University of New South Wales, Kensington, Sydney, NSW 2052, Australia
2
School of Project Management, University of Sydney, Camperdown, Sydney, NSW 2006, Australia
*
Author to whom correspondence should be addressed.
Big Data Cogn. Comput. 2020, 4(2), 4; https://0-doi-org.brum.beds.ac.uk/10.3390/bdcc4020004
Submission received: 10 March 2020 / Revised: 21 March 2020 / Accepted: 24 March 2020 / Published: 26 March 2020

Abstract

:
Big data is the concept of enormous amounts of data being generated daily in different fields due to the increased use of technology and internet sources. Despite the various advancements and the hopes of better understanding, big data management and analysis remain a challenge, calling for more rigorous and detailed research, as well as the identifications of methods and ways in which big data could be tackled and put to good use. The existing research lacks in discussing and evaluating the pertinent tools and technologies to analyze big data in an efficient manner which calls for a comprehensive and holistic analysis of the published articles to summarize the concept of big data and see field-specific applications. To address this gap and keep a recent focus, research articles published in last decade, belonging to top-tier and high-impact journals, were retrieved using the search engines of Google Scholar, Scopus, and Web of Science that were narrowed down to a set of 139 relevant research articles. Different analyses were conducted on the retrieved papers including bibliometric analysis, keywords analysis, big data search trends, and authors’ names, countries, and affiliated institutes contributing the most to the field of big data. The comparative analyses show that, conceptually, big data lies at the intersection of the storage, statistics, technology, and research fields and emerged as an amalgam of these four fields with interlinked aspects such as data hosting and computing, data management, data refining, data patterns, and machine learning. The results further show that major characteristics of big data can be summarized using the seven Vs, which include variety, volume, variability, value, visualization, veracity, and velocity. Furthermore, the existing methods for big data analysis, their shortcomings, and the possible directions were also explored that could be taken for harnessing technology to ensure data analysis tools could be upgraded to be fast and efficient. The major challenges in handling big data include efficient storage, retrieval, analysis, and visualization of the large heterogeneous data, which can be tackled through authentication such as Kerberos and encrypted files, logging of attacks, secure communication through Secure Sockets Layer (SSL) and Transport Layer Security (TLS), data imputation, building learning models, dividing computations into sub-tasks, checkpoint applications for recursive tasks, and using Solid State Drives (SDD) and Phase Change Material (PCM) for storage. In terms of frameworks for big data management, two frameworks exist including Hadoop and Apache Spark, which must be used simultaneously to capture the holistic essence of the data and make the analyses meaningful, swift, and speedy. Further field-specific applications of big data in two promising and integrated fields, i.e., smart real estate and disaster management, were investigated, and a framework for field-specific applications, as well as a merger of the two areas through big data, was highlighted. The proposed frameworks show that big data can tackle the ever-present issues of customer regrets related to poor quality of information or lack of information in smart real estate to increase the customer satisfaction using an intermediate organization that can process and keep a check on the data being provided to the customers by the sellers and real estate managers. Similarly, for disaster and its risk management, data from social media, drones, multimedia, and search engines can be used to tackle natural disasters such as floods, bushfires, and earthquakes, as well as plan emergency responses. In addition, a merger framework for smart real estate and disaster risk management show that big data generated from the smart real estate in the form of occupant data, facilities management, and building integration and maintenance can be shared with the disaster risk management and emergency response teams to help prevent, prepare, respond to, or recover from the disasters.

1. Introduction

More than 2.5 quintillion bytes of data are generated every day, and it is expected that 1.7 MB of data will be created by each person every second in 2020 [1,2]. This exponential growth in the rate of data generation is due to increased use of smart phones, computers, and social media. With the wide use of technology, technological advancement, and acceptance, high-speed and massive data are being generated in various forms, which are difficult to process and analyze [3], giving rise to the term “big data”. Almost 95% of businesses are producing unstructured data, and they spent $187 billion dollars in 2019 for big data management and analytics [4].
Big data is generated and used in every possible field and walk of life, including marketing, management, healthcare, business, and other ventures. With the introduction of new techniques and cost-effective solutions such as the data lakes, big data management is becoming increasingly complicated and complex. Fang [5] defines data lake as a methodology enabled by a massive data repository based on low-cost technologies that improve the capture, refinement, archival, and exploration of raw data within an enterprise. These data lakes are in line with the sustainability goals of organizations, and they contain the mess of raw unstructured or multi-structured data that, for the most part, have unrecognized value for the firm. This value, if recognized, can open sustainability-oriented avenues for big data-reliant organizations. The use of big data in technology and business is relatively new; however, many researchers are giving significant importance to it and found various useful methods and tools to visualize the data [6]. To understand the generated data and make sense of it, visualization techniques along with other pertinent technologies are used, which help in understanding the data through graphical means and in deducing results from the data [7]. It is worth highlighting that data analyses are not limited to data visualizations only; however, the current paper focuses on visualization aspects of data analyses. Furthermore, as data continue growing bigger and bigger, traditional methods of information visualization are becoming outdated, inefficient, and handicapped in analyzing this enormously generated data, thus calling for global attention to develop better, more capable, and efficient methods for dealing with such big data [8,9]. Today, there is extensive use of real-time-based applications, whose procedures require real-time processing of the information for which advanced data visualization methods of learning are used. Systems operating on the real-time processing of the data need to be much faster and more accurate because the input data are constantly generated at every instant, and results are required to be obtained in parallel [8]. Big data has various applications in banking, smart real estate, disaster risk management, marketing, and healthcare industries, which are risky compared to other industries and require more reliability, consistency, and effectiveness in the results, thus demanding more accurate data analytics tools [10,11]. Investments in big data analyses are baked with the aim of gaining a competitive edge in one’s own field. For example, business having huge amounts of data and knowing how to use these data to their own advantage have leverage in the market to proceed toward their goals and leave behind competitors. This includes attracting more customers, addressing the needs of existing ones, more personalization, and data immersion to keep the customers motivated to use their systems. Similarly, every other field requires correct use of information, which in turn requires tools and technologies that could possibly ensure analysis of data clusters and patterns by arranging the available information in an organized manner and isolating meaningful results from the large datasets.
The process of big data analytics constitutes a complete lifecycle comprising the identification of data sources, data repository, data cleaning and noise reduction, data extraction, data validation, data mining, and data visualizations [12]. The first stage deals with the identification of data sources and pertinent data collection. In this stage, different data sources to collect the desired data are determined, and data are gathered from them which is pertinent to the problem domain and severity. Data collected from diverse resources contain more hidden patterns and relationships which are of interest to the experts and may be in structured or unstructured form. Specialized tools and technologies are needed to extract useful data, keywords, and information from these resources. In the second stage, these data are stored in a database or a data repository using NoSQL databases [13]. Organizations such as Apache and Oracle developed various frameworks which allow analytic tools to get and process data from these databases. The third stage deals with data cleaning and noise reduction [12]. In this stage, the redundant, irrelevant, empty, or corrupt data objects are eliminated from the collected data, which reduces the size, as well as complexity, of the data. The next stage deals with data extraction, where the data in different or unidentified formats are extracted and transformed into a common or compatible format, so that the data can be read and used by the data analytics tool [14]. This also involves extracting data from the relevant fields and delivering the data to the analytics engine to decrease the data volume. In the fifth stage, validation rules, specific to the business case, are applied to the data, to validate their relevance and need. This is a difficult task to perform due to the complexity of the extracted data. To simplify the data processing in this step, an aggregation function is applied, which combines data from multiple sets into lesser numbers based on same field names. At the sixth stage, hidden and unique patterns from the data are established using data mining techniques to make important business decisions. These data mining methods depends on the nature of problem, which can be predictive, descriptive, or diagnostic [14]. Finally, at the last stage, the data are visualized by displaying the results of analysis in a graphical form, which makes it simple and easy to understand for the viewers.
Big data analytics is a highly promising field in the present era; however, it presents several challenges to the experts and professionals due to the inherent complexities and complicated operations. These include problems related to the data discrepancy, redundancy, integrity, security, memory, space, processing time, organization, visualization, and heterogeneous sources of data [15]. It is now quite challenging to manage, organizes, and represent the huge data repositories in an efficient manner. Similarly, data pre-processing methods like transformation, noise reduction, filtering, and classification have their own set of challenges. All these factors make the process of big data analysis even more perplexing. To deal with the issues related to big data analytics and to bring ease in big data analysis tasks, many tools and technologies were developed and released for mainstream use. The aim of this paper is to shed light on the concept of big data, specify its defining characteristics, and discuss the current tools and technologies being used for big data analytics. By performing a comparative analysis of these tools, the paper gives concluding remarks about some of the best technologies developed for efficient big data analytics. Overall, this paper reviews the basics of big data along with existing methods of data analytics. Various stages like data acquisition, storage, cleaning, and visualization are involved in the data analytics process [16], which are discussed in this paper along with the comparison of available tools for each stage. Due to the ability of learning patterns intelligently, machine learning has a major role in data analytics [17], which is discussed in addition to the issues that surround its usage. In addition, the challenges faced by big data analysis pertinent to storage or security are also discussed.
Big data has applications in various filed including smart real estate [18] and disaster management [19], which were explored and highlighted in current study. These areas were selected based on their novelty, demand, and interrelationships or interdependencies. For example, among the four key phases of disaster risk management, three (prevention, preparedness, and response) can be addressed through big data originating from smart real estate. Real estate managers keep a record of the number of people using a facility through strata management and the associated facilities in the buildings that can be helpful in preventing disasters or addressing them once they occur. Smart real estate is receiving great attention from researchers around the world and is a nascent area that was recently defined by Ullah et al. [18] as the usage of various electronic sensors to collect and supply data to consumers, agents, and real estate managers, which can be used to manage assets and resources efficiently in an urban area. Furthermore, the key focus of smart real estate is on disruptive technologies such as big data, making it a candidate for exploration in the current study. Moreover, the regrets among customers of real estate are increasing mainly due to the poor quality of information provided to them through online means and platforms [20], which can be regulated and enhanced through applications of big data. Furthermore, big data can be shared, integrated, and mined for give people a deeper understanding of the status of smart real estate operations and help them make more informed decisions for renting or purchasing residential or commercial spaces that can optimize the allocation of urban resources, reduce the operational costs, and promote a safe, efficient, green, harmonious, and intelligent development of the smart real estate and cities as a whole using the seven Vs (variety, volume, variability, value, visualization, veracity, and velocity) of big data [21]. Thus, it is imperative to investigate the applications of big data for addressing the information needs of smart real estate stakeholders. Similarly, disaster risk management is a critical area when it comes to technological involvement and utilizations, especially for dealing with issues such as flood detection, bushfires assessments, and associated rescue operations [19]. Disaster risk is the potential loss of life, injury, or destroyed or damaged assets that occur for a system, society, or community in a specific period. It is determined probabilistically as a function of hazard, exposure, and capacity [22]. Disaster risk management is the application of disaster risk reduction policies and strategies, to prevent new disaster risks, reduce existing disaster risks, and manage residual risks, contributing to the strengthening of resilience and reduction of losses. The associated actions can be categorized into prospective disaster risk management, corrective disaster risk management, and compensatory disaster risk management [23,24]. There are four phases of disaster risk management: prevention, mitigation, response, and recovery [25]. Enormous amounts of visual data are generated and changed during each phase of disaster risk management, which makes it difficult for human-operated machinery and equipment to analyze and respond accordingly. For example, for the prevention stage, Cheng et al. [26] presented the idea of Bluetooth-enabled sensors installed on building walls that can help detect and prevent fire risks and hazards by sensing temperatures of the buildings and walls using big data analysis. Yang et al. [27] highlighted that social media-based big data analytics and text mining can help mitigate ongoing disasters and reduce the associated risks. Ofli et al. [28] argued that aerial imagery and drone-based photography can be used to respond to ongoing disasters, thereby reducing the risks of potential life and property losses through human–computer-integrated machine learning and other big data applications for disaster risk management. Similarly, Ragini et al. [29] proposed a methodology to visualize and analyze the sentiments on the various basic needs of the people affected by the disaster using a combined subjective phrase and machine learning algorithm through social media for ensuring big data-based effective disaster response and recovery. Therefore, big data and its associated technologies such as machine learning, image processing, artificial intelligence, and drone-based surveillance can help facilitate the rescue measures and help save lives and finances. While there are several applications and potential uses of big data in disaster risk management and mitigation, there are certain limitations as well. Disaster response needs more improved operations, and lack of big data availability for supply networks is a major limitation [30]. Furthermore, it is challenging for traditional disaster management systems to collect, integrate, and process large volumes of data from multiple sources in real time. Updating of the traditional systems may need additional finances, which is a constraint for developing countries. Moreover, the constraint of generating results in a small amount of time for emergency rescue and response, growing big data management issues, and limited computational power makes the current traditional disaster management inadequate for the efficient and successful application of high-tech big data systems [31]. The technical expertise and skill set required for extracting fast, swift, and meaningful data from the available big data is another challenge faced by the disaster risk management team.

2. Materials and Methods

A detailed literature retrieval was carried out using a combination of different key words on the search engines of some of the most common and popular academic search engines, indexing published papers of high-impact-factor journals and top-tier conferences for each of the three focal points: big data (S1), big data application in smart real estate management (S2), and big data in disaster management (S3). These search engines include Google Scholar, Scopus, IEEE Xplore, Elsevier, Scopus, Science Direct, ACM, Springer, and MDPI for S1 and Scopus for S2 and S3. After choosing a set of platforms for article retrieval, next step was to formulate a set of keywords or queries to be used in the search engines of platform. Different queries were formulated using various key terms such as big data, data analysis, datasets, data analytic tools, data volume, data variety, data handling, data usage, and data creation for S1. Some resultant queries formulated using these keywords were “big data”, “big data analytic tools”, “big data volume”, “big data analysis”, etc. Similarly, for S2, the keywords included “big data smart real estate”, “big data smart property management”, “big data real estate management”, “big data real estate development”, and “big data property development”. Lastly, for S3, the keywords included “big data disaster management” and “big data in disaster”. The aim was to extract research papers explaining the concept of big data and its most distinctive characteristics, as well as articles proposing or discussing the existing analytic tools for big data for S1. For S2 and S3 the aims were to check the applications of big data in smart real estate and disaster management respectively. Hence, the search queries were formed, keeping in mind the major objectives and the research questions of this study. The search results revealed more than 200,000 articles published in the last decade (2010–2020), which were subsequently narrowed down according to predefined inclusion and exclusion criteria for S1. Upon narrowing down the results to identify the articles that fitted the scope of current study, the search was further refined by using themes and a combination of keywords that revealed only the papers that were a perfect fit for the research questions of this study. As a result, a total of 179,962 papers were retrieved based on the refined themes and keywords. Figure 1 illustrates the methodology used for collecting, screening, and filtering these research articles. Accordingly, for S2 and S3, the numbers of initially retrieved articles were 1548 and 1261, respectively.
This paper adopts the systematic review approach, commonly used as a useful approach in relevant files of construction and property management [32,33], and it provides a high level of evidence on the usefulness of big data techniques and the potential applications in the field. Furthermore, this study also critically reviews some key papers and evaluates opinions and suggested applications. Critical reviews are also widely used in the field [34,35]. In this paper, the first step of the review process was to query formulation where the search phrases “S1”, “S2”, and “S3” were defined. The OR operation between terms shows that papers based on at least one of these queries had to be retrieved. After formulating a set of keywords, the queries were used in the search engines of the highlighted platforms to retrieve relevant journal and conference papers. These articles were filtered based on four predefined criteria, which were up-to-date focus (2010 and onward), presence of the keywords in the title or abstract, English language, and no duplications. A final analysis was done by examining the content of each article to verify its relevance and the need for this study by the research team, comprising all the authors; it took four months to complete the task. After this step, a final set of research articles were selected for further analyses and inclusion in the current study. Table 1 illustrates the number of articles that were selected at the end of the article retrieval phase 1 for S1, S2, and S3. In subsequent phases, further shortlisting was performed, and the final number of reviewed articles was reduced accordingly.
The aim of this paper is to shed light on big data analysis and methods, as well as point toward the new directions that can possibly be achieved with the rise in technological means available to us for analyzing data. In addition, the applications of big data in newly focused smart real estate and the high demand in disaster and risk management are also explored based on the reviewed literature. The enormity of papers present exploring big data were linked with the fact that, each year, from 2010 and onward, the number of original research articles and reviews exponentially increased. A keyword analysis was performed using the VosViewer software for the articles retrieved to highlight the focus of the big data articles published during the last decade. The results shown in Figure 2 highlight that the most repeated keywords in these articles comprised data analytics, data handling, data visualization tools, data mining, artificial intelligence, machine learning, and others. Thus, Figure 2 highlights the focus of the big data research in last decade.
Figure 3 presents similar analyses to Figure 2 for S2 and highlights that, in the case of the focus on smart real estate and property management, recent literature revolves around keywords such as housing, decision-making, urban area, forecasting, data mining, behavioral studies, human–computer interactions, artificial intelligence, energy utilizations, economics, learning system, data mining, and others. This shows a central focus on data utilizations for improving human decisions, which is in line with recent articles such as Ullah et al. [18], Felli et al. [36], and Ullah et al. [20], where it was highlighted that smart real estate consumers and tenants have regrets related to their buy or rent decisions due to the poor quality or lack of information provided to them.
Figure 4 shows the same analyses for S3, where the keywords published in retrieved articles are highlighted and linked for the last decade on the integration of big data applications for disaster and its risk management. Keywords such as information management, risk management, social networking, artificial intelligence, machine learning, floods, remote sensing, data mining, digital storage, smart city, learning systems, and GIS are evident from Figure 4. Again, these keywords focus on the area of information management and handling for addressing the core issues such as disaster management and disaster risk reduction.
Figure 5 presents the rough trend that was initially observed when narrowing down papers needed for the temporal review. A steep rise in big data can be seen in the years 2013–2014, 2015–2016, and 2017–2018, while a less substantial incline was seen in 2016–2017. From here onward, the search was further refined, and only those papers which truly suited the purpose of this review were selected.
Figure 5 also shows and confirms the recent focus of researchers on big data, as well as its analytics and management. Thus, the argument of focusing the review on the last decade was further strengthened and verified as per the results of reviewed papers, where the growth since 2010 can be seen in terms of published articles based on the retrieval criteria defined and utilized in the current study. From fewer than 200 articles published in the year 2010 to more than 1200 in 2019, the big data articles saw tremendous growth, pointing to the recent focus and interests of the researchers. In addition to this, using GoogleTrends, an investigation was carried out with the search filters of worldwide search and time restricted from 1 January 2010 to 1 March 2020 to show the recent trends of search terms, big data, disaster big data, and real estate big data, as shown in Figure 6. The comparison shows the monthly trends for disaster-related big data and real estate big data searches, highlighting that real estate-related big data searches (47) were double the searches for disaster big data (23). A significant rise can be seen in big data for real estate papers during February–April 2014, September–November 2016, and July–September 2018. Similarly, for big data usage in disaster management, spikes in the trend can be seen during mid-2013, late 2014, mid-2015, early 2017, and early 2018. The figure is also consistent with the big data trend in Figure 2, where an average number of publications occurred in 2016–2017. It is no surprise that the search patterns peaked in 2016–2017 and, as a result, many articles were published and ultimately retrieved in the current study.
The next stage was based on screening the retrieved articles based on well-defined criteria based on four rules. Firstly, only articles published from 1 January 2010 and onward were selected, because the aim was to keep a recent focus and to cover articles published in the last decade, as the concept of big data and its usage became common only recently, and the last few years saw a rapid rise in technologies being developed for big data management and analysis. Secondly, only articles written in the English language were selected; thus, articles written in any other language were excluded. Thirdly, only journal articles including original research papers and reviews were included. Articles written as letters, editorials, conference papers, webpages, or any other nonstandard format were eliminated. Lastly, no duplicate or redundant articles could be present and, thus, when the same article was retrieved from multiple search engines or sources, it was discarded. Finally, a total of 182 published articles were narrowed down after the screening phase for S1 (135), 18 for S1* and 28 for S2, and 19 for S3. These papers were then critically analyzed one by one to determine their fit within the scope of the research objectives and questions, with the aim of bringing the existence of big data to light in such a way that the concept of big data in the modern world could be understood. Subsequently, the roots of big data, how data are generated, and the enormity of data existing today were identified and tabulated as a result of the rigorous review, along with the applications in smart real estate, property, and disaster risk management. This was followed by reviewing and tabulating the big data tools which currently exist for analyzing and sorting the big data. After critical analysis, out of the previously shortlisted 182 papers, 139 were selected to be reviewed in greater detail. This shortlist procedure included papers focusing on big data reviews, big data tools and analytics, and big data in smart real estate and disaster management. Short papers, editorial notes, calls for issues, errata, discussions, and closures were excluded from the final papers reviewed for content analyses. These papers were not only reviewed for their literature but were also critically analyzed for the information they provide and the leftover gaps that may require addressing in the future. To follow a systematic review approach, the retrieved articles were divided into three major groups of “big data”, “big data analytic tools and technologies”, and “applications of big data in smart real estate, property and disaster management”. The papers belonging to the big data category explore the concept of big data, as well as its definitions, features, and challenges. The second category of papers introduces or discusses the tools and technologies for effective and efficient analysis of big data, thus addressing the domain of big data analytics. Table 2 presents the distribution of articles retrieved in each phase, among these two categories.

3. Results

3.1. Review Results

Once the 139 articles were shortlisted, different analyses were conducted on these retrieved articles. Firstly, the articles were divided into five types: original research and big data technologies, review, conference, case study, and others, as shown in Figure 7. Expectedly, the shortlisted articles mainly focused on big data technologies (59), followed by others (29), review (23), conference (18), and case study (10). Similar analyses were conducted by Martinez-Mosquera et al. [37]; however, none of the previously published articles explored big data applications in the context of smart real estate or disaster and risk management, which is the novelty of the current study. The current study further provides an integrated framework for the two fields.
After classification of articles into different types, keyword analyses were conducted to highlight the most repeated keywords in the journals. These were taken from the keywords mentioned under the keyword categories in the investigated papers. A minimum inclusion criterion of at least 10 occurrences was used for shortlisting the most repeated keywords. When performing the analysis, some words were merged and counted as single terms; for example, the terms data and big data were merged since all the papers focused on big data. Similarly, the terms disaster, disaster management, earthquake, and natural disaster were merged and included in disaster risk management. The relevance score in Table 3 was calculated by dividing the number of occurrences of a term by the total occurrences to highlight its share.
After highlighting the most repeated keywords, journals contributing the most to the shortlisted papers were studied. Table 4 shows the top five journals/sources from which the articles were retrieved. An inclusion criterion of at least 15 documents was applied as the filter for shortlisting the top sources. Consequently, the majority of articles hailed from lecture notes in computer science followed by IOP conference series and others.
Similarly, once the sources were highlighted, the following analyses were aimed at highlighting the top contributing authors, countries, and organizations contributing to the study area. Figure 8 shows the contributions by authors in terms of the number of documents and their citations. A minimum number of six documents with at least six citations was the filter applied to shortlist these authors.
After highlighting the top contributing authors, countries with top contributions to the field of big data were investigated, as shown in Figure 9. A minimum inclusion criterion was set at 10 documents from a specific country among the shortlisted papers. The race is led by China with 34 papers, followed by the United States of America (USA) with 24 papers among the shortlist. However, when it comes to the citations, the USA is leading with 123 citations, followed by China with 58 citations.
After highlighting the top countries contributing to the field of big data and its applications to real estate and disaster management, in the next step, affiliated institutes were investigated for authors contributing to the body of knowledge. A minimum inclusion criterion of three articles was set as the shortlist limit. Table 5 shows the list of organizations with the number of documents contributed by them and the associated citations to date. This is led by Japan, followed by the USA, in terms of number of citations, with a tie for the number of papers, i.e., six documents were discovered for these countries.

3.2. Big Data and Its Seven Vs

Big data is the name given to datasets containing large, varied, and complex structures with issues related to storage, analysis, and visualization for data processing [7]. Massive amounts of data are generated from a variety of sources like audios, videos, social networking, sensors, and mobile phones, which are stored in the form of databases that require different applications for the analyses [38]. Big data is characterized by its high volume, sharing, creation, and removal in seconds, along with the high inherent variations and complexities [16]. Thus, it can be structured, unstructured, or semi-structured and vary in the form of text, audio, image, or video [39]. Previously, methods used for the storage and analysis of big data were slow in speed because of the low processing capabilities and lack of technology. Until 2003, humans were able to create a mere five exabytes, whereas, today, in the era of disruption and technological advancements, the same amount of data is created in the span of two days. The rapidness of data creation comes with a set of difficulties that occur in storage, sorting, and categorization of such big data. The expansion of data usage and generation reaches its heights today, and, in 2013, the data were reported to be 2.72 zettabytes, exponentially increasing to date [6].
Initially, big data was characterized by its variety, volume, and velocity, which were known as the three Vs of data [6]; however, later value and veracity were later added to the previously defined aspects of the data [40]. Recently, variability and visualization were also added to the characteristics of big data by Sheddon et al. [41]. These seven Vs along with the hierarchy, integrity, and correlation can help integrate the functions of smart real estate including safe, economical, and more intelligent operation, to help the customers make better and more informed decisions [21]. These seven Vs for defining the characteristics of big data are illustrated and summarized in Figure 10. Each of these Vs is explained in the subsequent sections.

3.2.1. Variety

Variety is one of the important characteristics of big data that refers to the collection of data from different sources. Data vary greatly in the form of images, audio, videos, numbers, or text [39], forming heterogeneity in the datasets [42]. Structured data refer to the data present in tabular form in spreadsheets, and these data are easy to sort because they are already tagged, whereas text, images, and audio are examples of unstructured data that are random and relatively difficult to sort [6]. Variety not only exist in formats and data types but also in different kinds of uses and ways of analyzing the data [43]. Different aspects of the variety attribute of big data are summarized in Table 6. The existence of data in diverse shapes and forms adds to its complexity. Therefore, the concept of a relational database is becoming absurd with the growing diversity in the forms of data. Thus, integration or using the big data directly in a system is quite challenging. For example, on the worldwide web (WWW), people use various browsers and applications which change the data before sending them to the cloud [44]. Furthermore, these data are entered manually on the interface and are, therefore, more prone to errors, which affects the data integrity. Thus, variety in data implies more chances of errors. To address this, the concept of data lakes was proposed to manage the big data, which provides a schema-less repository for raw data with a common access interface; however, this is prone to data swamping if the data are just dumped into a data lake without any metadata management. Tools such as Constance were proposed and highlighted by Hai et al. [45] for sophisticated metadata management over raw data extracted from heterogeneous data sources. Based on three functional layers of ingestion, maintenance, and querying, Constance can implement the interface between the data sources and enable the major human–machine interaction, as well as dynamically and incrementally extract and summarize the current metadata of the data lake that can help address and manage disasters and the associated risks [46]. Such data lakes can be integrated with urban big data for smarter real estate management, where, just like the human and non-human resources of smart real estate, urban big data also emerge as an important strategic resource for the development of intelligent cities and strategic directions [21]. Such urban big data can be converged, analyzed, and mined with depth via the Internet of things, cloud computing, and artificial intelligence technology to achieve the goal of intelligent administration of smart real estate.

3.2.2. Volume

Volume is another key attribute of big data which is defined as the generation of data every second in huge amounts. It is formed by the amount of data collected from different sources, which require rigorous efforts, processing, and finances. Currently, data generated from machines are large in volume and are increasing from gigabytes to petabytes. An estimate of 20 zettabytes of data creation is expected by the end of 2020, which is 300 times more than that of 2005 [39]. Thus, traditional methods for storage and analysis of data are not suitable for handling today’s voluminous data [6]. For examples, it was reported that, in one second, almost one million photographs are processed by Facebook, and it stores 260 billion photographs, which takes storage space of more than 20 petabytes, thus requiring sophisticated machines with exceptional processing powers to handle such data [42]. Data storage issues are solved, to some extent, by the use of cloud storage; however, this adds the risk of information security, as well as data and privacy breaches, to the set of worries [16].
The big volume of data is created from different sources such as text, images, audio, social media, research, healthcare, weather reports etc. For example, for a system dealing with big data, the data could come from social media, satellite images, web servers, and audio broadcasts that can help in disaster risk management. Traditional ways of data handling such as the SQL cannot be used in this case as the data are unorganized and heterogeneous and contain unknown variables. Similarly, unstructured data cannot be directly arranged into tables before usage in a relational database management system such as Oracle. Moreover, such unstructured data have a volume in the range of petabytes, which creates further problems related to storage and memory. The volume attribute of big data is summarized in Table 6 where a coherence of terms can be seen in most of the reviewed studies.
Smart real estate organizations such as Vanke Group and Fantasia Group in China are using big data applications for handling a large volume of real estate data [48]. Fantasia came up with an e-commerce platform that combines commercial tenants with customers through an app on cell phones. This platform holds millions of homebuyers’ data that help Fantasia in efficient digital marketing, as well as improving the financial sector, hotel services, culture, and tourism. Similarly, big data applications help Vanke Group by handling a volume of 4.8 million property owners. After data processing, Vanke put forward the concept of building city support services, combining community logistics, medical services, and pension with these property owners’ big data.

3.2.3. Velocity

The speed of data generation and processing is referred to as the velocity of big data. It is defined as the rate at which data are created and changed along with the speed of transfer [39]. Real-time streaming data collected from websites represent the leading edge provided by big data [43]. Sensors and digital devices like mobile phones create data at an unparalleled rate, which need real-time analytics for handling high-frequency data. Most retailers generate data at a very high speed; for example, almost one million transactions are processed by Walmart in one hour, which are used to gather customer location and their past buying patterns, which help manage the creation of customer value and personalized suggestions for the customers [42]. Table 6 summarizes the key aspects of velocity, presented by researchers.
Many authors defined velocity as the rate at which the data are changing, which may change overnight, monthly, or annually. In the case of social media, the data are continuously changing at a very fast pace. New information is shared on sites such as Facebook, Twitter, and YouTube every second, which can help disaster managers plan for upcoming disasters and associated risk, as well as know the current impacts of occurring disasters. For example, Ragini et al. [29] highlighted that sentiment analyses from social media using big data analytic tools such as machine learning can be helpful to know the needs of people facing a disaster for devising and implementing a more holistic response and recovery plan. Similarly, Huang et al. [49] introduced the concept of DisasterMapper, a CyberGIS framework that can automatically synthesize multi-sourced data from social media to track disaster events, produce maps, and perform spatial and statistical analysis for disaster management. A prototype was implemented and tested using the 2011 Hurricane Sandy as a case study, which recorded the disasters based on hashtags posted by people using social media. In all such systems, the velocity of processing remains a top priority. Hence, in the current era, the rate of change of data is in real time, and night batches for data update are not applicable. The fast rate of change of data requires a faster rate of accessing, processing, and transferring this data. Owing to this, business organizations now need to make real-time data-driven decisions and perform agile execution of actions to cope with the high rate of change of such enormous data. In this context, for smart real estate, Cheng et al. [50] proposed a big data-assisted customer analysis and advertising architecture that speeds up the advertising process, approaching millions of users in single clicks. The results of their study showed that, using 360-degree portrait and user segmentation, customer mining, and modified and personalized precise advertising delivery, the model can reach a high advertising arrival rate, as well as a superior advertising exposure/click conversion rate, thus capturing and processing customer data at high speeds.

3.2.4. Value

Value is one of the defining features of big data, which refers to finding the hidden value from larger datasets. Big data often has a low value density relative to its volume. High value is obtained by analyzing large datasets [42]. Researchers associated different aspects and terms with this property, as summarized in Table 6.
The value of big data is the major factor that defines its importance, since a lot of resources and time is spent to manage and analyze big data, and the organization expects to generate some value out of it. In the absence of value creation or enhancement, investing in bid data and its associated techniques is useless and risky. This value has different meanings based on the context and the problem. Raw data are meaningless and are usually of no use to a business unless they are processed into some useful information. For example, for a disaster risk management-related decision-making system, the value of big data lies in its ability to make precise and insightful decisions. If value is missing, the system will be considered a failure and will not be adopted or accepted by the organizations or their customers.
In the context of smart real estate, big data can generate neighborhood value. As an example, Barkham et al. [51] argued that some African cities facilitated mobility and access to jobs through smart real estate big data-generated digital travel information. Such job opportunities enhance the earning capacities that eventually empowers the dwellers to build better and smarter homes, thus raising the neighborhood value. Furthermore, such big data generates increased accessibility and better options, which can help tackle the affordability issues downtown that can help flatten the real estate value curve.

3.2.5. Veracity

Veracity is defined as the uncertainty or inaccuracy in the data, which can occur due to incompleteness or inconsistency [39]. It can also be described as the trustworthiness of the data. Uncertain and imprecise data represent another feature of big data, which needs to be addressed using tools and techniques developed for managing uncertain data [42]. Table 6 summarizes the key aspects of veracity as explained by different authors.
Uncertainty or vagueness in data makes the data less trusted and unreliable. The use of such uncertain, ambiguous, and unreliable data is a risky endeavor and can have devastating effects on the business and organizational repute. Therefore, organizations are often cautious of using such data and strive for inducing more certainty and clarity in the data.
In the case of smart real estate decision-making, using text data extracted from tweets, eBay product descriptions, and Facebook status updates introduces new problems associated with misspelled words, lack of or poor-quality information, use of informal language, abundant acronyms, and subjectivity [52]. For example, when a Facebook status or tweet includes words such as “interest”, “rate”, “increase”, and “home”, it is very hard to infer if the uploader is referring to interest rate increases and home purchases, or if they are referring to the rate of increased interest in home purchases. Such veracity-oriented issues in smart real estate data require sophisticated software and analytics and are very hard to address. Similar issues are also faced by disaster managers when vague words such as “disaster”, “rate”, “flood”, or “GPS” are used.

3.2.6. Variability

For the explanation of unstructured data, another characteristic of big data used is called variability. It refers to how the meaning of the same information constantly changes when it is interpreted in a different way. It also helps in shaping a different outcome by using new feeds from various sources [13]. Approximately 30 million tweets are quantitatively evaluated daily for sentiment indicator assessments. Conditioning, integration, and analytics are applied to the data for evaluation under the service of context brokerage [16]. Table 6 presents various aspects of the variability property of big data.
Variability can be used in different ways in smart real estate. Lacuesta et al. [53] introduced a recommender system based on big data generated by heart rate variability in different patients, and they recommended places that allow the person to live with the highest wellness state. Similarly, Lee and Byrne [54] investigated the impact of portfolio size on real estate funds and argued that big data with larger variability can be used to assess the repayment capabilities of larger organizations. In the case of disaster management, Papadopoulos et al. [55] argued that the variability related to changes in rainfall patterns or temperature can be used to plan effectively for hydro-meteorological disasters and associated risks.

3.2.7. Visualization

For the interpretation of patterns and trends present in the database, visualization of the data is conducted. Artificial intelligence (AI) has a major role in visualization of data as it can precisely predict and forecast the movements and intelligently learn the patterns. A huge amount of money is invested by many companies in the field of AI for the visualization of large quantities of complex data [41,47]. Table 6 presents the key aspects of big data visualization.
Visualization can help attract more customers and keep the existing ones motivated to use the system more due to the immersive contents and ability to connect to the system. It helps in giving a boost to the system and, consequently, there is no surprise in organizations investing huge sums in this aspect of big data. For such immersive visualization in smart real estate, Felli et al. [36] recommended 360 cameras and mobile laser measurements to generate big data, thereby visualizing resources to help boost property sales. Similarly, Ullah et al. [18] highlighted the use of virtual and augmented realties, four-dimensional (4D) advertisements, and immersive visualizations to help transform the real estate sector into smart real estate. For disaster management, Ready et al. [56] introduced a virtual reality visualization of pre-recorded data from 18,000 weather sensors placed across Japan that utilized HTC Vive and the Unity engine to develop a novel visualization tool that allows users to explore data from these sensors in both a global and local context.

3.3. Big Data Analytics

Raw data are worthless, and their value is only increased when they are arranged into a sensible manner to facilitate the extraction of useful information and pertinent results. For the extraction of useful information from fast-moving and diverse big data, efficient processes are needed by the organization [42]. As such, big data analytics is concerned with the analysis and extraction of hidden information from raw data not processed previously. It is also defined as the combination of data and technology that filters out and correlates the useful data and gains insight from it, which is not possible with traditional data extraction technologies [57]. Currently, big data analytics is used as the principal method for analyzing raw data because of its potential to capture large amounts of data [58]. Different aspects of big data analytics such as capture, storage, indexing, mining, and retrieval of multimedia big data were explored in the multimedia area [59]. Similarly, various sources of big data in multimedia analytics include social networks, smart phones, surveillance videos, and others. Researchers and practitioners are considering the incorporation of advanced technologies and competitive schemes for making efficient decisions using the obtained big data. Recently, the use of big data for company decision-making gained much attention, and many organizations are eager to invest in big data analytics for improving their performance [60]. Gathering varied data and the use of automatic data analytics helps in taking appropriate informed decisions that were previously taken by the judgement and perception of decision-makers [61]. Three features for the definition of big data analytics are the information itself, analytics application, and results presentation [58,62]. Big data analytics is adopted in various sectors of e-government, businesses, and healthcare, which facilitates them in increasing their value and market share [63]. For enhancing relationships with customers, many retail companies are extensively using big data capabilities. Similarly, big data analytics is used for improving the quality of life and moderating the operational cost in the healthcare industry [11,64]. In the field of business and supply chain management, data analytics helps in improving business monitoring, managing the supply chain, and enhancing the industry automation [58]. Similarly, Pouyanfar et al. [59] referred to the event where Microsoft beat humans at the ImageNet Large-Scale Visual Recognition Competition in 2015 and stressed the need for advanced technology adoption for the analysis of visual big data. The process of information extraction from big data can be divided into two processes: data management and analytics. The first process includes the supporting technologies that are required for the acquisition of data and their retrieval for analysis, while the second process extracts insight and meaningful information from the bulk of data [42]. Big data analytics includes a wide range of data which may be structured or unstructured, and several tools and techniques are present for the pertinent analyses. The broader term of data analytics is divided into sub-classes that include text analytics, audio analytics, video analytics, and social media analytics [59].

3.3.1. Text Analytics

Techniques that are used for the extraction of information from textual data are referred to as text analytics. Text analytics can analyze social network feeds on a specific entity to extract and predict users’ opinions and emotions to help in smart decision-making. Generally, text analytics can be divided into sentiment analysis, summarization, information extraction, and question answering [59]. Many big companies like Walmart, eBay, and Amazon rely on the use of big data text analytics for managing their vast data and enhancing communication with their customers [65]. News, email, blogs, and survey forms are some of the examples of the textual data obtained from various sources and used by many organizations. Machine learning, statistical analysis, and computational linguistics are used in textual analysis of the big data [42]. Named entity recognition (NER) and relation extraction (RE) are two functions of information extraction which are used to recognize named entities within raw data and classify them in predefined classes such as name, date, and location. Recent solutions for NER prefer to use statistical learning approaches that include maximum entropy Markov models and conditional random fields [66]. Piskorski et al. [67] discussed traditional methods of information extraction along with future trends in this field. Extractive and abstractive approaches for the summarization of text are used, in which the former approach involves the extraction of primary units from the text and joining them together, whereas the latter approach involves the logical extraction of information from the text [42]. Gambhir et al. [68] surveyed recent techniques for text summarization and deduced that the optimization-based approach [69] and progressive approach [70] gave the best scores for Recall-Oriented Understudy for Gisting Evaluation (ROUGE)-1 and ROUGE-2. For the analysis of positive or negative sentiments toward any product, service, or event, sentiment analysis techniques are used which fall into three categories of document level, sentence level, and aspect-based techniques [42]. For the extraction of essential concepts from a sentence, Dragoni et al. used a fuzzy framework which included WordNet, ConceptNet, and SenticNet [71]. Similarly, SparkText, which is an efficient text mining framework for large-scale biomedical data, was developed on the Apache Spark infrastructure, as well as on the Cassandra NoSQL database that utilizes several well-known machine-learning techniques [59]. In the case of smart real estate management, Xiang et al. [72] used text analytics to explore important hospitality issues of hotel guest experience and satisfaction. A large quantity of consumer reviews extracted from Expedia.com were investigated to deconstruct hotel guest experience and examine its association with satisfaction ratings, which revealed that the association between guest experience and satisfaction appears very strong. Similarly, text analytics can be used to investigate smart real estate investor psychology, as well as information processing and stock market volatility [73]. Similarly, text mining through cyber GIS frameworks such as DisasterMapper can synthesize multi-source data, spatial data mining [74,75,76], text mining, geological visualization, big data management, and distributed computing technologies in an integrated environment to support disaster risk management and analysis [49].

3.3.2. Audio Analytics

The compression and packaging of audio data into a single format is referred to as audio analytics. It involves the extraction of meaningful information from audio signals. Audio files mainly exist in the format of uncompressed audio, lossless compressed audio, and lossy compressed audio [77]. Audio analytics are used extensively in the healthcare industry for the treatment of depression, schizophrenia, and other medical conditions that require patients’ speech patterns [32]. Moreover, it was used for analyzing customer calls and infant cries, revealing information regarding the health status of the baby [42]. In the case of smart real estate, audio analytics can be helpful in property auctioning [78]. Similarly, the use of visual feeds using digital cameras and associated audio analytics based on conversations between the real estate agent and the prospective buyer can help boost real estate sales [79]. In the case of disaster risk management and mitigation, audio analytics can help in event detection, collaborative answering, surveillance, threat detection, and telemonitoring [77].

3.3.3. Video Analytics

A major concern for big data analytics is video data, as 80% of unstructured data comprise images and videos. Video information is usually larger in size and contains more information than text, which makes its storage and processing difficult [77]. Server-based architecture and edge-based architecture are two main approaches used for video analytics, where the latter architecture is relatively higher in cost but has lower processing power compared to the former architecture [42]. Video analytics can be used in disaster risk management for accident cases and investigations, as well as disaster area identification and damage estimation [80]. In the case of smart real estate, video analytics can be used for threat detection, security enhancements, and surveillance [81]. Applications such as the Intelligent Vision Sensor turn video imagery into actionable information that can be used in building automation and business intelligence applications [82].

3.3.4. Social Media Analytics

Information gathered from social media websites is analyzed and used to study the behavior of people through past experiences. Analytics for social media is classified into two approaches: content-based analytics, which deals with the data posted by the user, and structure-based analytics, which includes the synthesis of structural attributes [42]. Social media analytics is an interdisciplinary research field that helps in the development of a decision-making framework for solving the performance measurement issues of the social media. Text analysis, social network analysis, and trend analysis have major applications in social media analytics. Text classification using support vector machine (SVM) is used for text mining. For the study of relationships between people or organizations, social network analysis is used which helps in the identification of influential users. Another analysis method famous in social media analytics is trend analysis, which is used for the prediction of emerging topics [83]. The use of mobile phone apps and other multimedia-based applications is an advantage provided by big data. In the case of smart real estate management, big data was used to formulate and introduce novel recommender systems that can recommend and shortlist places for users interested in exploring cultural heritage sites and museums, as well as general tourism, using machine learning and artificial intelligence [84]. The recommender system keeps a track of the users’ social media browsing including Facebook, Twitter, and Flickr, and it matches the cultural objects with the users’ interest. Similarly, multimedia big data extracted from social media can enhance both real-time detection and alert diffusion in a well-defined geographic area. The application of a big data system based on incremental clustering event detection coupled with content- and bio-inspired analyses can support spreading alerts over social media in the case of disasters, as highlighted by Amato et al. [85].

3.4. Data Analytics Process

With the large growth in the amount of data every day, it is becoming difficult to manage these data with traditional methods of management and analysis. Big data analytics receives much attention due to its ability to handle voluminous data and the availability of tools for storage and analysis purposes. Elgendy et al. [43] described data storage, processing, and analysis as three main areas for data analytics. In addition, data collection, data filtering and cleaning, and data visualizations are other processes of big data analytics. Further data ingestion is an important aspect of data analysis; however, the current study focuses on the analytic processes only.

3.4.1. Data Collection

The first step for the analysis of big data is data acquisition and collection. Data can be acquired through different tools and techniques from the web, Excel, and other databases as shown in Table 7. The table lists a set of tools for gathering data, the type of analysis task they can perform, and the corresponding application or framework where they can be deployed. Sentiment analysis from data refers to finding the underlying emotion or tone. The tools developed to perform sentiment analysis can automatically detect the overall sentiment behind given data, e.g., negative, positive, or neutral. Content analysis tools analyze the given unstructured data with the aim of finding its meaning and patterns and to transform the data into some useful information. Semantria is a sentiment analysis tool, which is deployable over the web on cloud. Its plugin can be installed in Excel and it is also available as a standalone application programming interface (API). Opinion crawl is another tool to extract opinions or sentiments from text data but can only be deployed over the web. Open text is a content analysis tool which can be used within software called Captiva. This is an intelligent capture system, which collects data from various sources like electronic files and papers and transforms the data into a digital form, making them available for various business applications. Trackur is another standalone sentiment analysis application. It is a monitoring tool that monitors social media data and collects reviews about various brands to facilitate the decision-makers and professionals of these companies in making important decisions about their products.

3.4.2. Data Storage

For the accommodation of collected structured and unstructured data, databases and data warehouses are needed, for which NoSQL databases are predominantly used. There are other databases as well; however, the current study only focuses on NoSQL databases. Features and applications of some NOSQL databases, as well as their categories, features, and applications, are discussed in Table 8. A further four categories as defined by Martinez-Mosquera et al. [37] are used to classify the databases which are column-oriented, document-oriented, graph, and key value. Apache Cassandra is a NoSQL database management system, which can handle big data over several parallel servers. This is a highly fault-tolerant system as it has no single point of failure (SPOF), which means that it does not reach any such state where entire system failure occurs. It also provides the feature of tunable consistency, which means that the client application decides how up to date or consistent a row of data must be. MangoDB is another distributed database available over the cloud which provides the feature of load balancing; this improves the performance by sending multiple concurrent requests of clients to multiple database servers, to avoid overloading a single server.
CouchDB is a clustered database which means that it enables the execution of one logical database server on multiple servers or virtual machines (VMs). This set-up improves the capacity and availability of the database without modifying the APIs. Terratore is a database for storing documents, which is accessible through the HTTP protocol. It supports both single-cluster and multi-cluster deployments and offers advanced data scaling features. The documents are stored by partitioning and then distributing them across various nodes. Hive is a data warehouse which is built on top of the Hadoop framework and offers data query features by providing an interface such as the SQL for different files and data stored within the Hadoop database [98]. Hbase is a distributed and scalable database for big data which allows random and real-time access to the data for both reading and writing. Neo4j is a graph database which enables the user to perform graphical modeling of big data. It allows developers to handle data by using a graph query language called Cypher which enables them to perform create, read, update, and delete (CRUD) operations on data.

3.4.3. Data Filtering

In order to extract structured data from unstructured data, the data are filtered through some tools which filter out the useful information necessary for the analyses. Some data filtering tools and their features are compared in Table 9.
Import.io is a web data integration tool which transforms unstructured data into a structured format so that they can be integrated into various business applications. After specifying the target website URL, the web data extraction module provides a visual environment for designing automated workflows for harvesting data, going beyond HTML parsing of static content to automate end-user interactions yielding data that would otherwise not be immediately visible. ParseHub is a free, easy to use, and powerful web scraping tool which allows users to get data from multiple pages, as well as interact with AJAX, forms, dropdowns, etc. Mozenda is a web scraping tool which allows a user to scrape text, files, images, and PDF content from web pages with a point-and-click feature. It organizes data files for publishing and exporting them directly to TSV, comma-separated values (CSV), extensible markup language (XML), Excel (XLSX), or JavaScript object notation (JSON) through an API. Content Grabber is a cloud-based web scraping tool that helps businesses of all sizes with data extraction. Primary features of Content Grabber include agent logging, notifications, a customizable user interface, scripting capabilities, scripting, agent debugger, error handling, and data export. Octoparse is a cloud-based data scraping tool which turns web pages into structured spreadsheets within clicks without coding. Scraped data can be downloaded in CSV, Excel, or API format or saved to databases.

3.4.4. Data Cleaning

Collected data contain a lot of errors and imperfections that affect the results leading to wrong analysis. Errors and imperfections of the data are removed through data cleaning tools. Some data cleaning tools are listed in Table 10. DataCleaner is a data quality analysis application and solution platform for DQ solutions. At its core lies a strong data profiling engine which is extensible, thereby adding data cleansing, transformations, enrichment, deduplication, matching, and merging. MapReduce is a programming model and an associated implementation for processing and generating big datasets with a parallel, distributed algorithm on a cluster. A MapReduce program is composed of a map procedure, which performs filtering and sorting, such as sorting students by first name into queues, with one queue for each name, and a reduce method, which performs a summary operation such as counting the number of students in each queue, yielding name frequencies. OpenRefine (previously Google Refine) is a powerful tool for working with messy data that cleans the data, transforms the data from one format into another, and extends the data with web services and external data. It works by running a small server on the host computer, and the internet browser can be used to interact with it. Reifier helps improve business decisions through better data. By matching and grouping nearly similar records together, a business can identify the right customers for cross-selling and upselling, improve market segmentation, automate lead identification, adhere to compliance and regulation, and prevent fraud. Trifacta accelerates data cleaning and preparation with a modern platform for cloud data lakes and warehouses. This ensures the success of your analytics, ML, and data onboarding initiatives across any cloud, hybrid, or multi-cloud environment.

3.4.5. Data Analysis and Visualization

For the extraction of meaningful information from raw data, visualization techniques are applied. Several tools and techniques are used for information visualization, depending on the type of data and the intended visual outcome associated with the dataset. Most of the tools perform the extraction, analysis, and visualization in integrated fashion using data mining and artificial intelligence techniques [16]. Advantages and disadvantages of some data visualization tools are discussed in Table 11. Tableau products query relational databases, online analytical processing cubes, cloud databases, and spreadsheets to generate graph-type data visualizations. The products can also extract, store, and retrieve data from an in-memory data engine. Power BI is a business analytics service by Microsoft that aims to provide interactive visualizations and business intelligence capabilities with an interface simple enough for end users to create their own reports and dashboards. Plotly’s team maintains the fastest growing open-source visualization libraries for R, Python, and JavaScript. These libraries seamlessly interface with our enterprise-ready deployment servers for easy collaboration, code-free editing, and deploying of production-ready dashboards and apps. Gephi is the leading visualization and exploration software for all kinds of graphs and networks. It is an open-source and free data visualization tool which runs on Windows, Mac OS X, and Linux. Similarly, Microsoft Excel can perform calculations, graphing, pivot tables, and a macro programming language called Visual Basic for applications. In the smart real estate context, 360 cameras, VR- and AR-based immersive visualizations, 4D advertisements, etc. can help boost property sales by keeping the customers more immersed and involved in the property inspections [36]. In addition, novel features such as virtual furnishing and VR-powered abilities to move the furniture and items around virtually are the applications of data visualizations in smart real estate [18,20,101].

3.5. Frameworks for Data Analysis

There are two main frameworks that are utilized for data analytics. These include the Hadoop Framework and Apache Spark.

3.5.1. Hadoop Framework

For the analysis of big data, Hadoop is a popular open-source software that is used by many organizations. The Hadoop framework is governed by Google architecture that processes large datasets in distributed environments [39]. It consists of two stages: storage and analysis. The task of storage is carried out by its own Hadoop Distributed File System (HDFS) that can store TB or PB of data with high streaming access [107]. The complete architecture of the HDFS is presented on the webpage of DataFlair [108]. Similarly, for the analysis of obtained data, MapReduce is used by the Hadoop framework that allows writing programs in order to transform large datasets into more management datasets. MapReduce routines can be customized for the analysis and exploration of unstructured data across thousands of nodes [107]. MapReduce splits the data into manageable chunks and then maps these splits accordingly. The number of splits is reduced accordingly and stored on a distributed cache for subsequent utilizations. Additionally, the data are stored in a master-salve pattern. The NameNode manages the DataNodes and stores the metadata in the cluster. All the changes to the file system, size, location, and hierarchy are recorded by it. Any deleted files and blocks in the HDFS are recorded in the Edit Log and stored in the nodes. The actual data are stored in the DataNode and respond to the request of the clients. DataNode creates, deletes, and replicates the blocks based on the decisions of NameNode. The activities are processed and scheduled with the help of YARN, which is controlled by Resource Manager and Node Manager. Resource Manager is a cluster-level component and runs on the master machine, while NodeManager is a node-level component which monitors resource consumption and tracks log management.

3.5.2. Apache Spark

Apache Spark is another data processing engine that has a performing model similar to MapReduce with an added ability of data-sharing abstraction. Previously, processing of wide-range workloads needed separate engines like SQL, machine learning, and streaming, but Apache Spark solved this issue with the Resilient Distributed Datasets (RDD) extension. RDD provides data sharing and automatic recovery from failures by using lineage which saves time and storage space. For details of Apache Spark, the work of Zaharia et al. [109] is useful.

3.5.3. Hadoop Framework vs. Apache Spark

Both data analysis engines perform the task of analyzing raw data efficiently, but there exist some differences in their performance. The PageRank algorithm and logistic regression algorithm for machine learning were used to compare the performance of both analysis tools. The performance of Hadoop and Apache Spark using the PageRank algorithm and logistic regression algorithm is illustrated in Figure 11a,b, respectively. Spark Core is a key component of Apache Spark and is the base engine for processing large-scale data. It facilitates building additional libraries which can be used for streaming and using different scripts. It performs multiple functions such as memory management, fault recovery, networking with storage systems, and scheduling and monitoring tasks. In Apache Spark, real-time streaming of data is processed with the help of Spark Streaming, which gives high throughput without any obstacles. A new module of ApacheSpark is Spark SQL, which integrates relational processing with functional programming and extends the limits of traditional relational data processing. It also facilitates querying data. GraphX provides parallel computation and API for graphs. It extends the Spark RDD abstraction with the help of the Resilient Distributed Property Graph, giving details on the vertex and edge of the graph. Furthermore, the MLiB function facilitates performing machine learning processes in Apache Spark.
Statistics depict from the algorithm that the number of iterations in the Hadoop framework is greater than that in Apache Spark. Similarly, most machine learning algorithms work iteratively. MapReduce uses coarse-grained tasks which are heavier for iterative algorithms, whereas Spark use Mesos, which runs multiple iterations on the dataset and yields better results [110]. A comparison of some important parameters for both frameworks is shown in Table 12. Overall, Hadoop and Apache Spark do not need to compete with each other; rather, they complement each other. Hadoop is the best economical solution for batch processing and Apache Spark supports data streaming with distributed processing. A combination of the high processing speed and multiple integration support of Apache Spark with the low cost of Hadoop provides even better results [110].

3.6. Machine Learning in Data Analytics

Machine learning is a domain of artificial intelligence (AI) used for extracting knowledge from voluminous data in order to make or reach intelligent decisions. It follows a generic algorithm for building logic on the given data without the need for programming. Basically, machine learning is a data analytics technique that uses computational methods for teaching computers to learn information from the data [3]. Many researchers explored the field of machine learning in data analytics such as Ruiz et al. [17], who discussed the use of machine learning for analysis of massive data. Al-Jarrah et al. [111] presented a review of theoretical and experimental literature of data modeling. Dorepalli et al. [112] reviewed the types of data, learning methods, processing issues, and applications of machine learning. Moreover, machine learning is also used in statistics, engineering, and mathematics to resolve various issues of recognition systems and data mining [113]. Typically, machine learning has three sub-domains that are supervised learning, unsupervised learning, and reinforcement learning, as discussed in Table 13.
All machine learning techniques are efficient in processing data; however, as the size of the data grows, the extraction and organization of discriminative information from the data pose a challenge to the traditional methods of machine learning. Thus, to cope up with the growing demand of data processing, advanced methods for machine learning are being developed that are intelligent and much efficient for solving big data problems [113]. As such, one developed method is representation learning [114], which eases the task of information extraction by capturing a greater number of input configurations from a reasonably small data size. Furthermore, deep belief networks (DBNs) and convolution neural networks (CNNs) are used extensively for speech and hand-written digit recognition [115]. Deep learning methods with higher processing power and advanced graphic processors are used on large databases [113]. Traditional methods of machine learning possess centralized processing, which is addressed with the use of distributed learning that distributes the data among various workstations, making the process of data analysis much faster. Classical methods of machine learning mostly use the same feature space for training and testing of the dataset, which creates a problem for the older techniques to tackle heterogeneity in the dataset. In new set-ups, transfer learning intelligently applies the previously gained knowledge to the new problem and provides faster solutions. In most applications, there may exist abundant data with missing labels. Obtaining labels from the data is expensive and time-consuming, which is solved using active learning [112]. This creates a subset of instances from the available data to form labels which give high accuracy and reduce the cost of obtaining labeled data. Similarly, kernel-based learning proved to be a powerful technique that increases the computational capability of non-linear learning algorithms. An excellent feature of this learning technique is that it can map the sample implicitly using only a kernel function, which helps in the direct calculation of inner products. It provides intelligent mathematical approach in the formation of powerful nonlinear variants of statistical linear techniques. Although many of the achievements made in machine learning facilitated the analysis of big data, there still exist some challenges. Learning from data that has high speed, volume, and different types is a challenge for machine learning techniques [113]. Some of the challenges for machine learning are discussed in Table 14 along with possible remedies.
AI and machine learning methods are being increasingly integrated in systems dealing with a wide variety of issues related to disasters. This includes disaster prediction, risk assessment, detection, susceptibility mapping, and disaster response activities such as damage assessment after the occurrence of a disaster. In Nepal, in April 2015, an earthquake of 7.8 magnitude hit 21 miles off the southeast coast of Lamjung. The standby task force was successful in mobilizing 3000 volunteers across the country within 12 hours after the quake, which was possible due to the revolutionized AI system in Nepal. Volunteers in that area started tweeting and uploading crisis-related photographs on social media. Artificial Intelligence for Disaster Response (AIDR) used those tagged tweets to identify the needs of people based on categories such as urgent need, damage to infrastructure, or even help regarding resource deployment. Similarly, Qatar developed a tool known as the Qatar Computing Research Institute (QCRI) for disaster management. The tool was developed by the Qatar Foundation to increase awareness and to develop education and science in a community. For disaster risk management, QCRI aims to provide its services by increasing the efficiency of agencies and volunteer facilities. The tool has an AI system installed which helps in recognizing tweets and texts regarding any devastated area or crisis. The QCRI then provides an immediate solution to overcome the crisis [122]. OneConcern is a tool developed to analyze disaster situations. The tool creates a comprehensive picture of the location during an emergency operation. This image is used by emergency centers to investigate the situation and provide an immediate response in the form of relief goods or other rescue efforts. The tool also helps in the creation of a planning module that can be useful in identifying and determining the areas prone to a disaster. The vulnerable areas can then be evacuated to avoid loss of life. Until now, OneConcern identified 163,696 square miles area and arranged shelter for 39 million people. It also examined 11 million structures and found 14,967 faults in their construction, thereby providing precautionary measures before a natural disaster hit.

3.7. Big Data Challenges and Possible Solutions

Massive data with heterogeneity pose many computational and statistical challenges [123]. Basic issues such as security and privacy, storage, heterogeneity, and incompleteness, as well as advanced issues such as fault tolerance, are some challenges posed by big data.

3.7.1. Security and Privacy

With the enormous rate of data generation, it becomes challenging to store and manage the data using traditional methods of data management. This gives rise to an important issue which is the privacy and security of the personal information. Many organizations and firms collect personal information of their clients without their knowledge in order to increase value to their businesses, which can have serious consequences for the customers and organizations if accessed by hackers and irrelevant people [124]. Verification and trustworthiness of data sources and identification of malicious data from big databases are challenges. Any unauthorized person may steal data packets that are sent to the clients or may write on a data block of the file. To deal with this, there are solutions such as the use of authentication methods, like Kerberos, and encrypted files. Similarly, logging of attack detection or unusual behavior and secure communication through a Secure Sockets Layer (SSL) and Transport Layer Security (TLS) are potential solutions [125].

3.7.2. Heterogeneity and Incompleteness

Within big databases, data are gathered from different sources that vary greatly, leading to heterogeneity in the data [39]. Unstructured, semi-structured, and structured data differ in their properties and associated information extraction techniques. Transformation from unstructured data to structured data is a crucial challenge for data mining. Moreover, due to malfunctioning of any sensor or fault in systems, the issue of incomplete data poses another challenge [125]. Potential solutions to this issue include data imputation for missing values, building learning models, and filling the data with the most frequent values.

3.7.3. Fault Tolerance

Failure or damage may occur during the analysis of big data, which may require restarting the cumbersome process from scratch. Fault tolerance sets the range for any failure in order to recover data without wasting time and cost. Maintaining a high fault tolerance for heterogeneous complex data is extremely difficult, and it is impossible to achieve 100% reliable tolerance. To tackle this issue, potential solutions include dividing the whole computation into sub-tasks and the application of checkpoints for recursive tasks [124].

3.7.4. Storage

Earlier, data were stored on hard disk drives (HDDs) which were slower in I/O performance. As data grew bigger and bigger, most technologies switched to cloud computing, which generates data at a high speed, the storage of which is a problem for analytics tools [39]. To tackle this, the use of solid-state drives (SDDs) and phase change memory (PCM) are potential solutions [126].

4. Applications of Big Data and Pertinent Discussions

The growth of data increased enormously during last two decades, which encouraged global researchers to explore new machine learning algorithms and artificial intelligence to cope with the big data. Various applications of big data are found in medicine, astrology, banking, and finance departments for managing their big databases [10,127]. In the healthcare industry, huge amounts of data are created for record keeping and patient care, which are used in improving healthcare facilities by providing population management and disease surveillance at reduced cost [128]. Similarly, machine learning models for early disease diagnosis and prediction of disease outbreak and genomic medicine are now being used popularly [129]. As an example, Chen et al. [130] experimented on a hospital to study the outbreak of cerebral infarction using a CNN-based machine learning model which achieved a prediction accuracy of 94.8%. Now, big data also incorporates psychiatric research that gathers data for the person’s anxiety attacks and irregular sleep patterns to diagnose any psychological illness [131]. Similarly, GPS-enabled trackers were developed for asthma patients by Asthmapolis that record inhaler usage by the patients. These recorded data are gathered in a central database used to analyze the needs of individual patients [132]. In the field of agriculture, smart farming and precision agriculture are major technological advancements that incorporate cloud computing and machine learning algorithms [133]. In this context, Singh et al. proposed a model for forecasting moisture in soil by using time series analysis [134]. Data generated from various sources like wind direction predictors, GPS-enabled tractors, and crop sensors are used to elevate agricultural operations. Primarily Europe and North America use big data applications for agriculture, but most countries are still deprived of them [135]. Similarly, other industries such as the aviation industry are growing rapidly and producing large amounts of data from weather sensors, aircraft sensors, and air. The application of big data analytics for aviation is necessary as latest aircrafts like the Boeing 787 obtains 1000 or more flight parameters, whereas older aircrafts like Legacy captured only 125+ parameters [136]. Similarly, social media platforms like Facebook, Instagram, and Twitter generate data, its analysis is necessary to understand and gather public opinion or feedback about any product or service [18,137], which can be analyzed using machine learning applications of big data. Machine learning algorithms are used to analyze the behavior of the user via real-time analysis of the content browsed by them, and relevant online advertisements are recommended accordingly. Moreover, the detection of spam using data mining techniques also employs the use of machine learning [138]. In addition, Hadoop and machine learning algorithms are used by banks for analysis of loan data to check the reliability of lending organizations, thereby increasing profitability and innovation [139]. Recent studies in the field of construction, city, and property management specially reported that compatibility, interoperability, value, and reliability are critical factors of digital technology adoption and implementation [140,141,142,143,144]. The network intrusion traffic challenge was resolved efficiently by Suthaharan et al. [145] using machine learning and big data technologies. Distributed manufacturing industries use big data approaches to find new opportunities [146]. Similarly, electrical power industries implement big data approaches for electricity demand forecasting [147]. Processes of decision-making, value creation [148], innovation, and supply chain [149] were significantly enhanced using big data analytics techniques. Zhou et al. investigated a trajectory detection method to improve taxi services using big data from GPS [150]. Applications of big data are also found in creating competitive advantages by troubleshooting, personalization, and detection of areas that require improvement [151]. For predictive modeling, high-cardinality features are not used very often because of their randomness. To address this, Moeyersoms et al. [152] introduced transformation functions in a churn predictive model that included high-cardinal features.

4.1. Big Data Applications for Smart Real Estate and Property Management

Big data recently made its way into the real estate and property management industry and was used in various forms such as visualization of properties and 360 videos [36], virtual and augmented realities [153], stakeholder management [20], online customer management [101,154], and the latest disruptive Big9 technologies including artificial intelligence, robotics, and scanners that are transforming it from traditional to smart real estate [18]. This was also applied to domains of smart cities, especially in the fields of informatics and information handling [155]. Among the practical aspects and money-making perspectives, the newly introduced idea of bitcoin houses is an amazing application of big data in the smart real estate industry [156]. Believed to be the first income-generating house, the idea of a bitcoin house revolves around big data that has more than 40 containers of data miners installed at the house, which can generate 100% off-grid electricity and earnings of over $1M per month, with the potential to be the first self-paying home mortgage house in the world. Similarly, Kok et al. [157] suggested using an automated valuation model to produce the value of properties instantly. In their study, a model was developed with an absolute error of 9%, which compares favorably with the accuracy of traditional appraisals, and which can produce an instant value at every moment in time at a very low cost to automate the real estate industry and move toward a smart real estate and property industry using big data. The model bases its roots in the concepts of machine learning and artificial intelligence to analyze the big data. Among the companies utilizing big data in real estate, Du et al. [48] highlighted real estate and property companies in China such as Xinfeng, CICC, Haowu, and others who successfully started utilizing big data for addressing stakeholder needs such as property information, buyer demand, transaction data, page view, buyer personal information, and historical transaction information. Likewise, Barkham et al. [51] stated the cities and their smart real estate initiatives powered by big data including The Health and Human Services Connect center in New York for improved efficiency of public services, Data Science for Social Good in Chicago, Transport for London, IBM operations center for city safety in Brazil, and others. Table 15 lists the key stakeholders of real estate in accordance with Ullah et al. [18] as the customers that include buyers and users of the real estate services, the sellers including owners and agents, and the government and assessment agencies. The table further lists the names, the focus of different organizations, the required resources, and examples of how big data is utilized by these organizations in the world for addressing the needs of smart real estate stakeholders.
Big data can be generated by software and tools owned by agencies and the sellers of properties, which gives personalized suggestions and recommendations to the prospective buyers or users of the service to make better and informed decisions. However, it is important to have a centralized independent validation system in check that can be operated by the government or assessment agencies to protect the privacy of the users, along with verification of the data and information provided to the prospective buyers. In this way, trust can be generated between the key real estate stakeholders, i.e., the sellers and buyers, which can reduce, if not eliminate, the regrets related to ill-informed decisions made by the buyers or users. A conceptual model is presented in Figure 12 for this purpose. As highlighted by Joseph and Varghese [158], there is a risk of big data brokers misleading the consumers and exploiting their interests; therefore, regulators and legislators should begin to develop consumer protection strategies against the strong growth for big data brokers. The model in Figure 12 supports this argument and presents an intermediary organization for keeping an eye on the misuse of data and manipulations by big data agents and brokers.

4.2. Big Data Applications for Disaster and Risk Management

Big data systems proved to be valuable resources in disaster preparedness, management, and response. The disaster risk management authorities can use big data to monitor the population in case of an emergency. For example, areas having a high number of elderly people and children can be closely tracked so that they can be rescued as a priority. Additional post-disaster activities like logistics and resource planning and real-time communications are also facilitated by big data. Agencies associated with early disaster management also use big data technologies to predict the reaction of citizens in case of a crisis [162]. In the current era, big data-based technologies are growing at an exponential rate, and research suggests that approximately 90% of data in the world were produced in the last two years [163]. The emergency management authorities can use these data to make more informed and planned decisions in both pre- and post-disaster scenarios. The data were combined with geographical information and real-time imagery for disaster risk management in emergencies [19]. During the Haiti earthquake incident, big data was used to rescue people in the post-disaster scenario. By conducting an analysis on the text data available regarding the earthquake, maps were created to identify the vulnerable and affected population from the area [164]. At this time, the concept of digital humanitarian was first introduced, which involves the use of technology like crowdsourcing to generate maps of affected areas and people [165]. Since then, it is a norm to use technology for disaster risk management and response. Various research studies were done on analyzing the sentiments of people at the time of disaster to identify their needs during the crisis [19,122,162,164,165,166]. Advanced methods of satellite imagery, machine learning, and predictive analysis are applied to gather information regarding any forthcoming disaster along with its consequences. Munawar et al. [19] captured multispectral aerial images using an unmanned aerial vehicle (UAV) at the target site. Significant landmark objects like bridges, roads, and buildings were extracted from these images using edge detection [167], Hough transform, and isotropic surround suppression techniques [168,169]. The resultant images were used to train an SVM classifier to identify the occurrence of flood in a new test image. Boakye et al. proposed a framework that uses big data analytics to predict the results of a natural disaster in the society [162]. Machine learning and image processing also provide heat maps of the affected area, which are helpful in providing timely and quick aid to affected people [166]. Table 16 shows the uses of big data for disaster risk management, as well as the phases and features of big data.
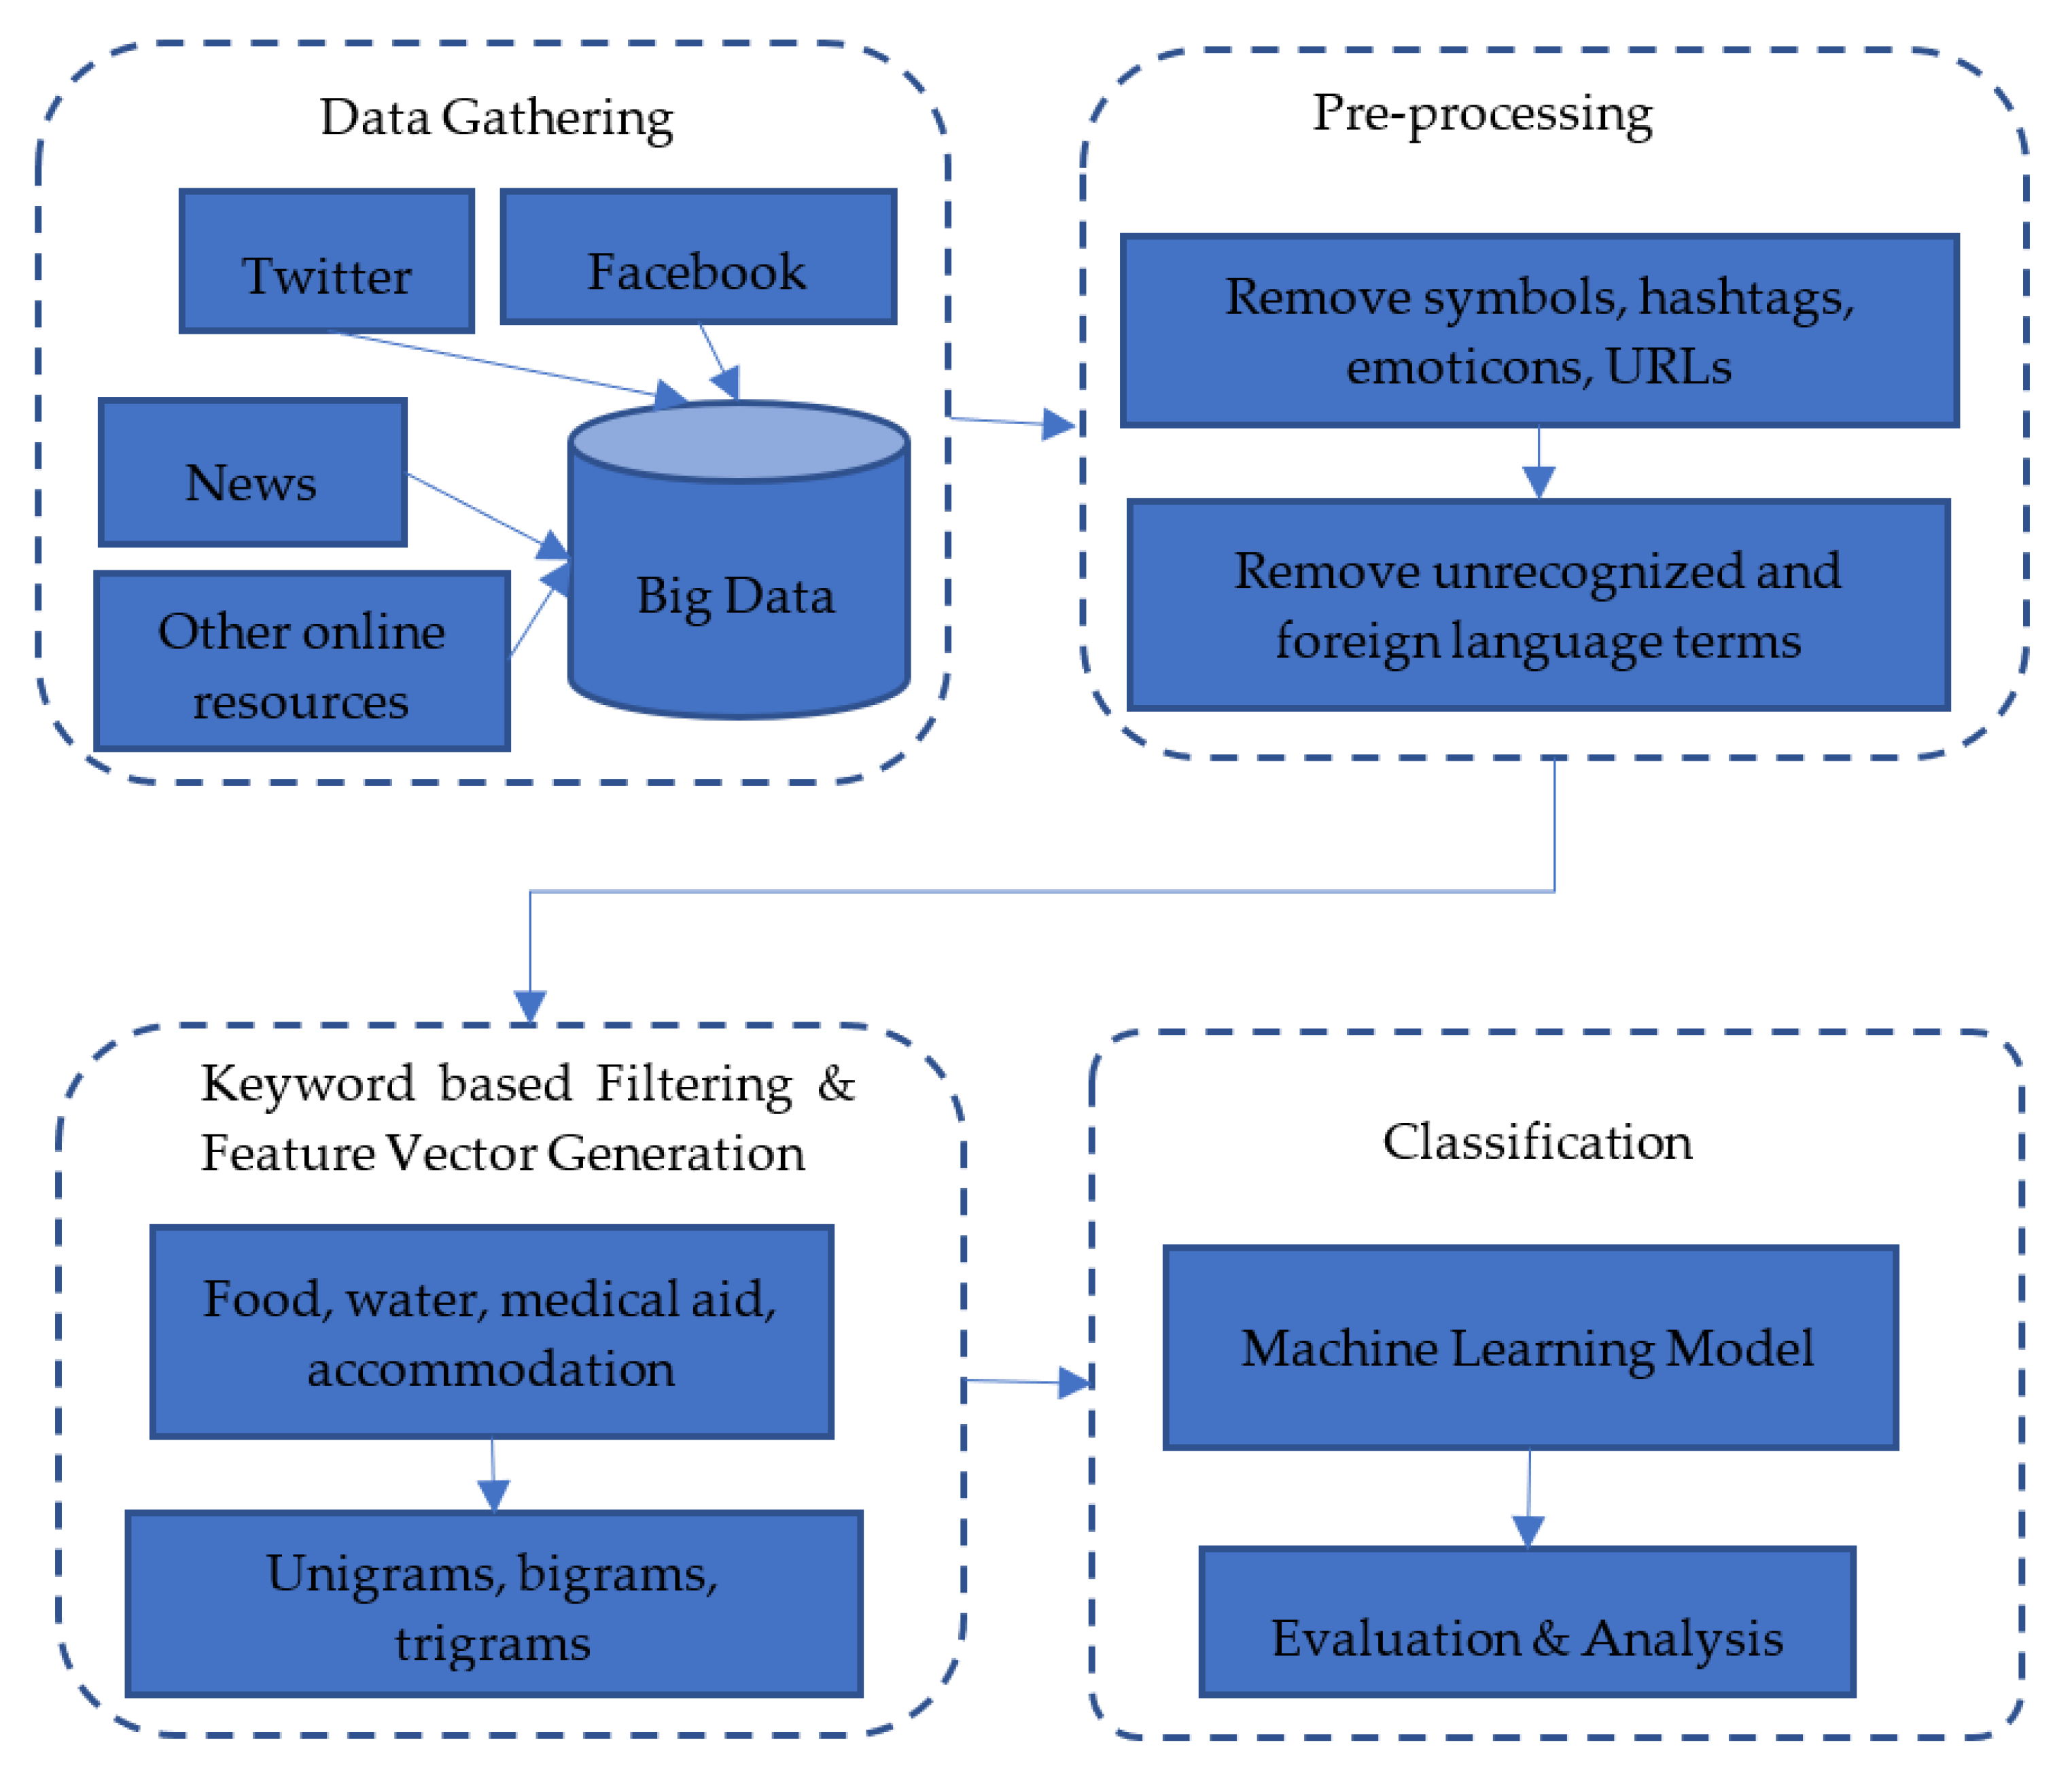
Social media is one of the best resources to gather real-time data at the time of crisis. It is being increasingly used for communication and coordination during emergencies [184]. This calls for a system to be able to effectively manage these data and filter the data related to the needs and requests of the people during the post-disaster period. To be able to provide timely help, the big data generated from the social networks should be mined and analyzed to determine factors like which areas need the most relief services and should be prioritized by the relief workers, and what services are required by the people there [137]. In this section, we propose a framework that extracts the data from various social media networks like Facebook, Twitter, news APIs, and other sources. The extracted data are mostly in the unstructured form and need to undergo cleaning and pre-processing to remove irrelevant and redundant information. This also involves removing URLs, emoticons, symbols, hashtags, and words from a foreign language. After applying these pre-processing steps, the data need to be filtered so that only relevant data are retained. During a post-disaster period, the basic needs of the people are related to food, water, medical aid, and accommodation. Hence, some keywords related to these four categories must be defined, so that only the data related to them are extracted. For example, the terms related to the keyword “food” may be “hunger, starved, eat”. A wide range of terms related to each keyword need to be defined so that maximum data related to them are extracted. It is also crucial to gather these data along with information related to the geographical location, so that location-wise aid could be provided. After gathering these data, the next step will be to train a machine learning model, to predict which area needs emergency services and which facilities are needed by the people over there. Before supplying data for classification, the data must be represented in the form of a feature vector so that they can be interpreted by the algorithm. A unigram-, bigram-, or trigram-based approach can be used for generation of a feature vector from the data. The basic workflow of the system is presented in Figure 13.
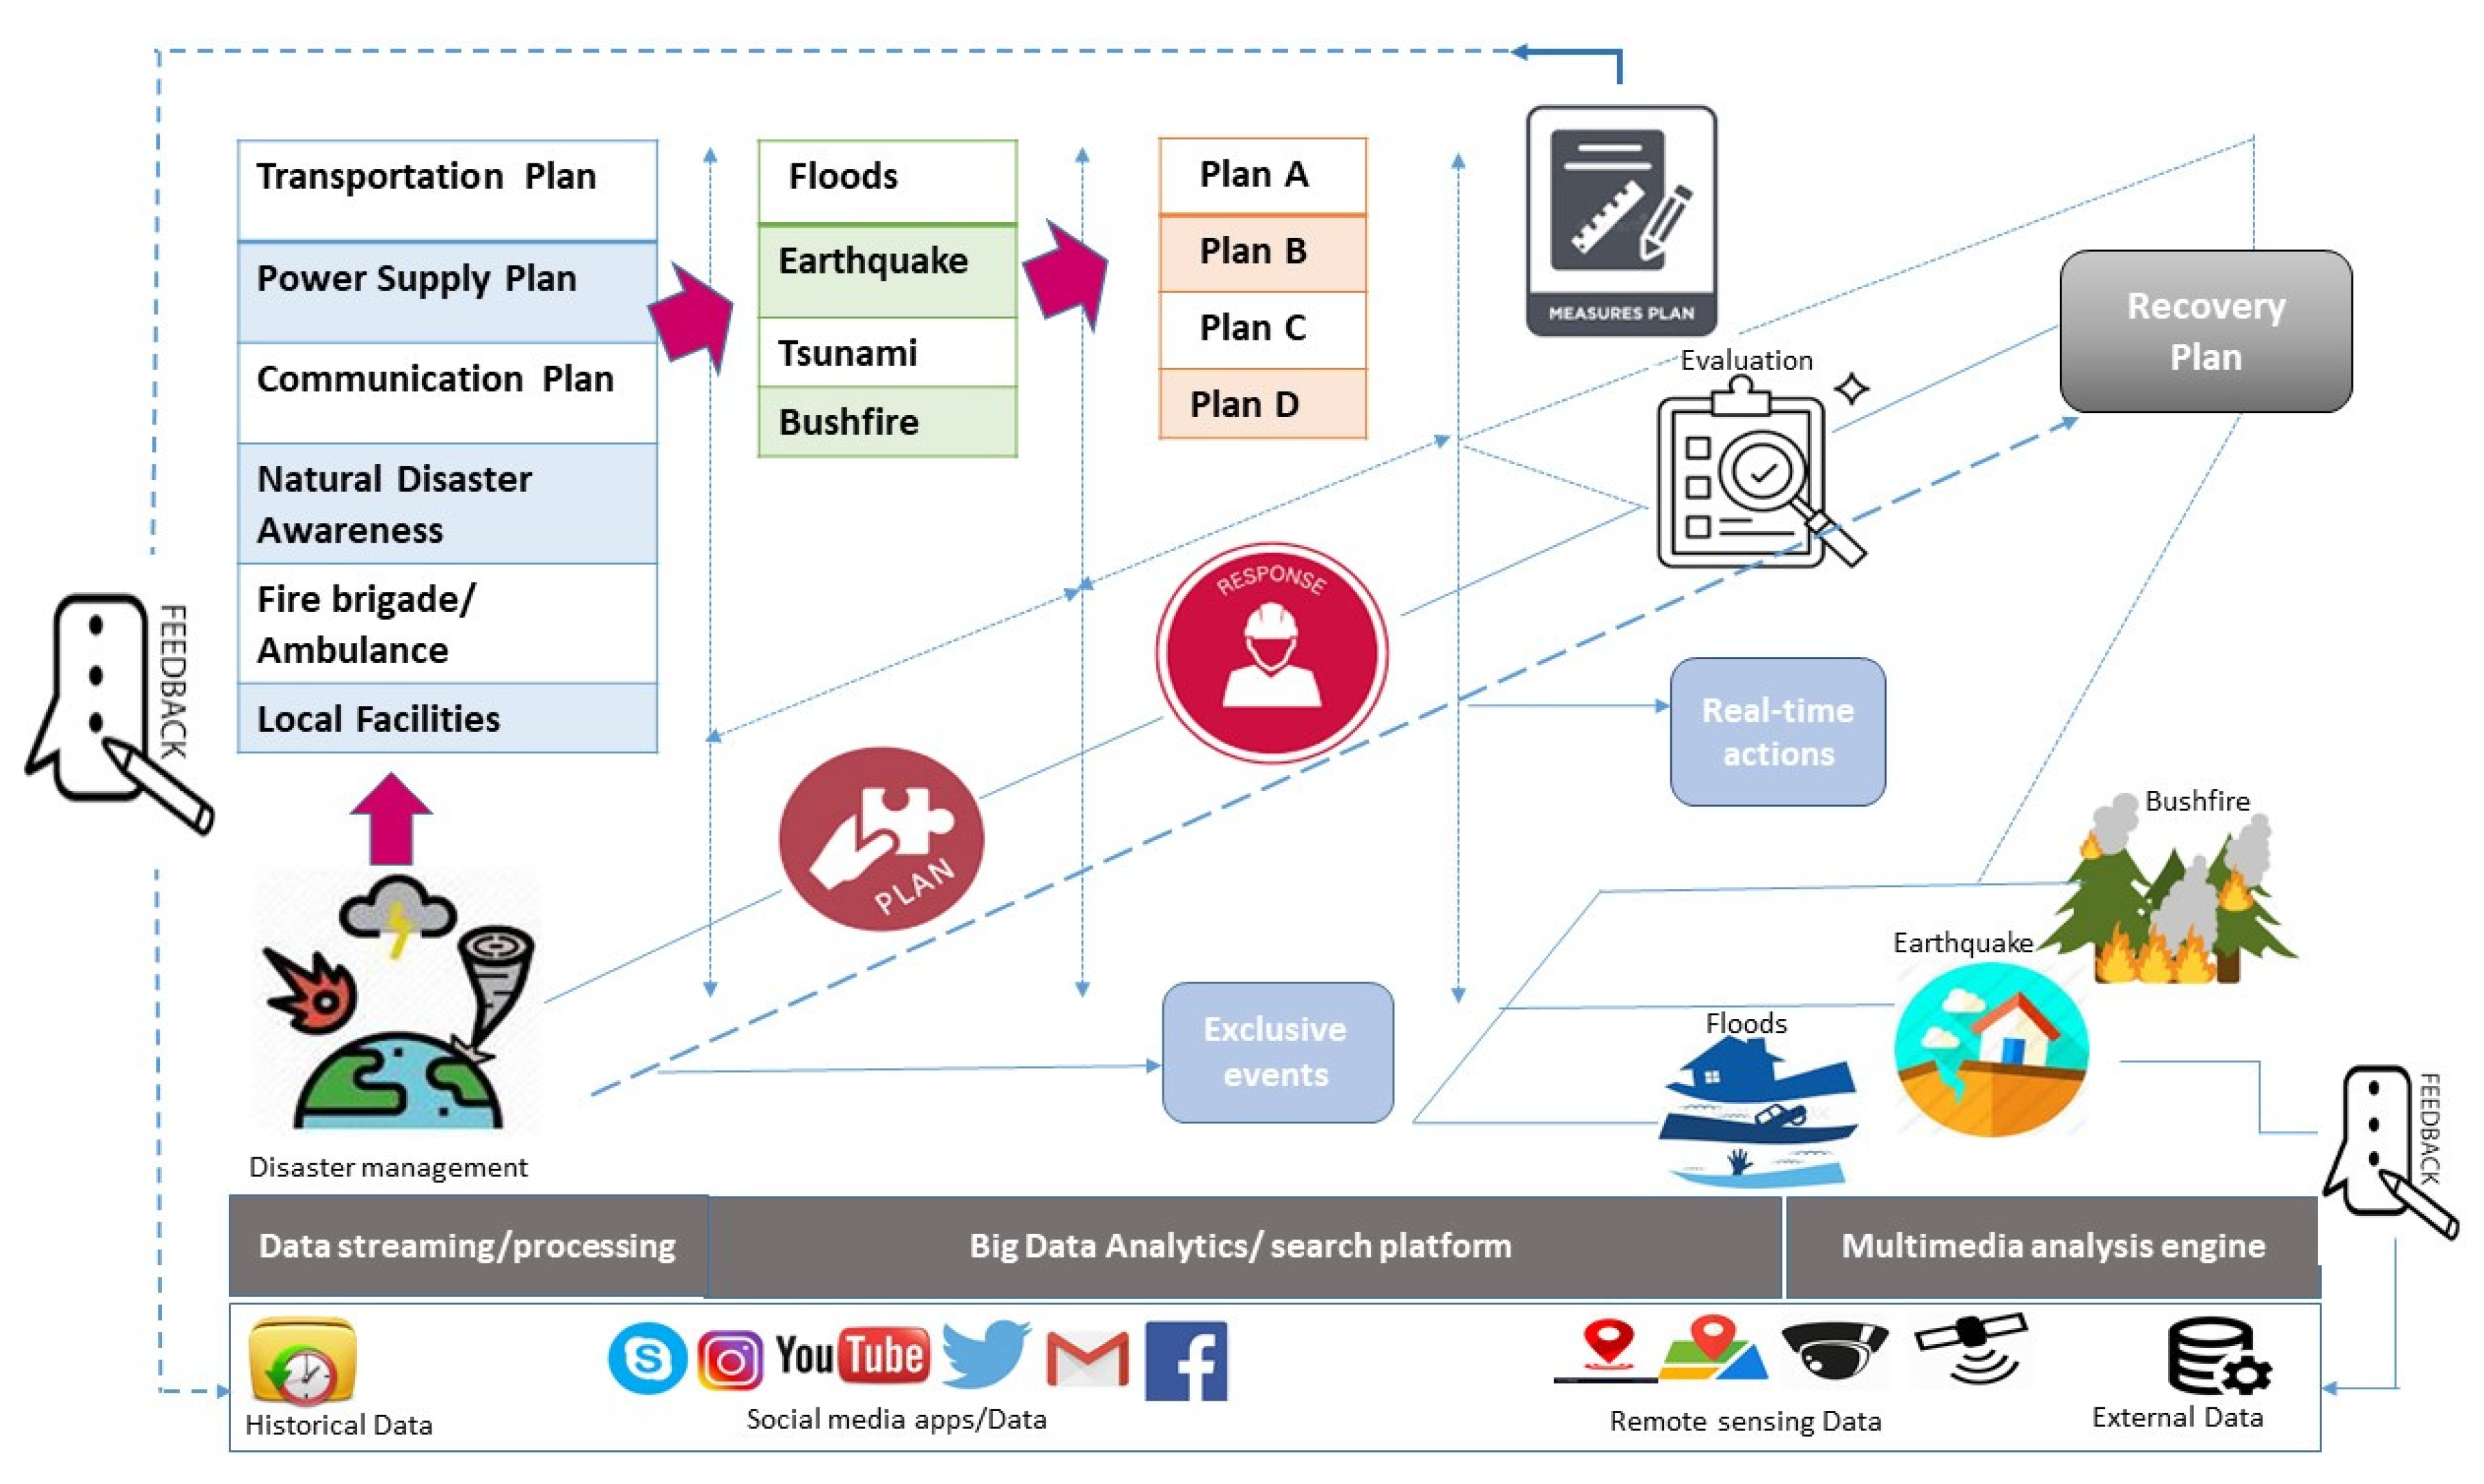
The integration of big data into disaster risk management planning can open many new avenues. At the time of disasters like floods, bush fires, storms, etc., there is a bulk of data generated as new reports, statistics, and social media posts, which all provide a tally of injuries, deaths, and other losses incurred [77,83,137]. An overview of the suggested system is provided by Figure 14. The collective historical data containing analytics of previous disasters are shared with the local authorities such as fire brigades, ambulances, transportation management, and disaster risk management officials. Acquisition of information leads to the formulation of plans to tackle the disaster and cope with the losses. This plan of action is generated based on the analysis of big data. Firstly, the data are processed to pick specifics of current disaster, while analyzing the issue helps in moving toward a response. This step involves more than one plan of action to have backup measures for coping with unforeseen issues. All these steps are fundamentally guided and backed with information gained through the rigorous processing of big data gathered as a bulk of raw information in the first step. The response stage is a merger of several simultaneous actions including management of disaster, evaluation of the plan, and real-time recovery measures for overcoming the disaster and minimizing losses. This method not only holds the potential for creating an iterative process which can be applied to various disasters but can also create an awareness and sense of responsibility among people regarding the importance of big data in disaster response and effective risk management.
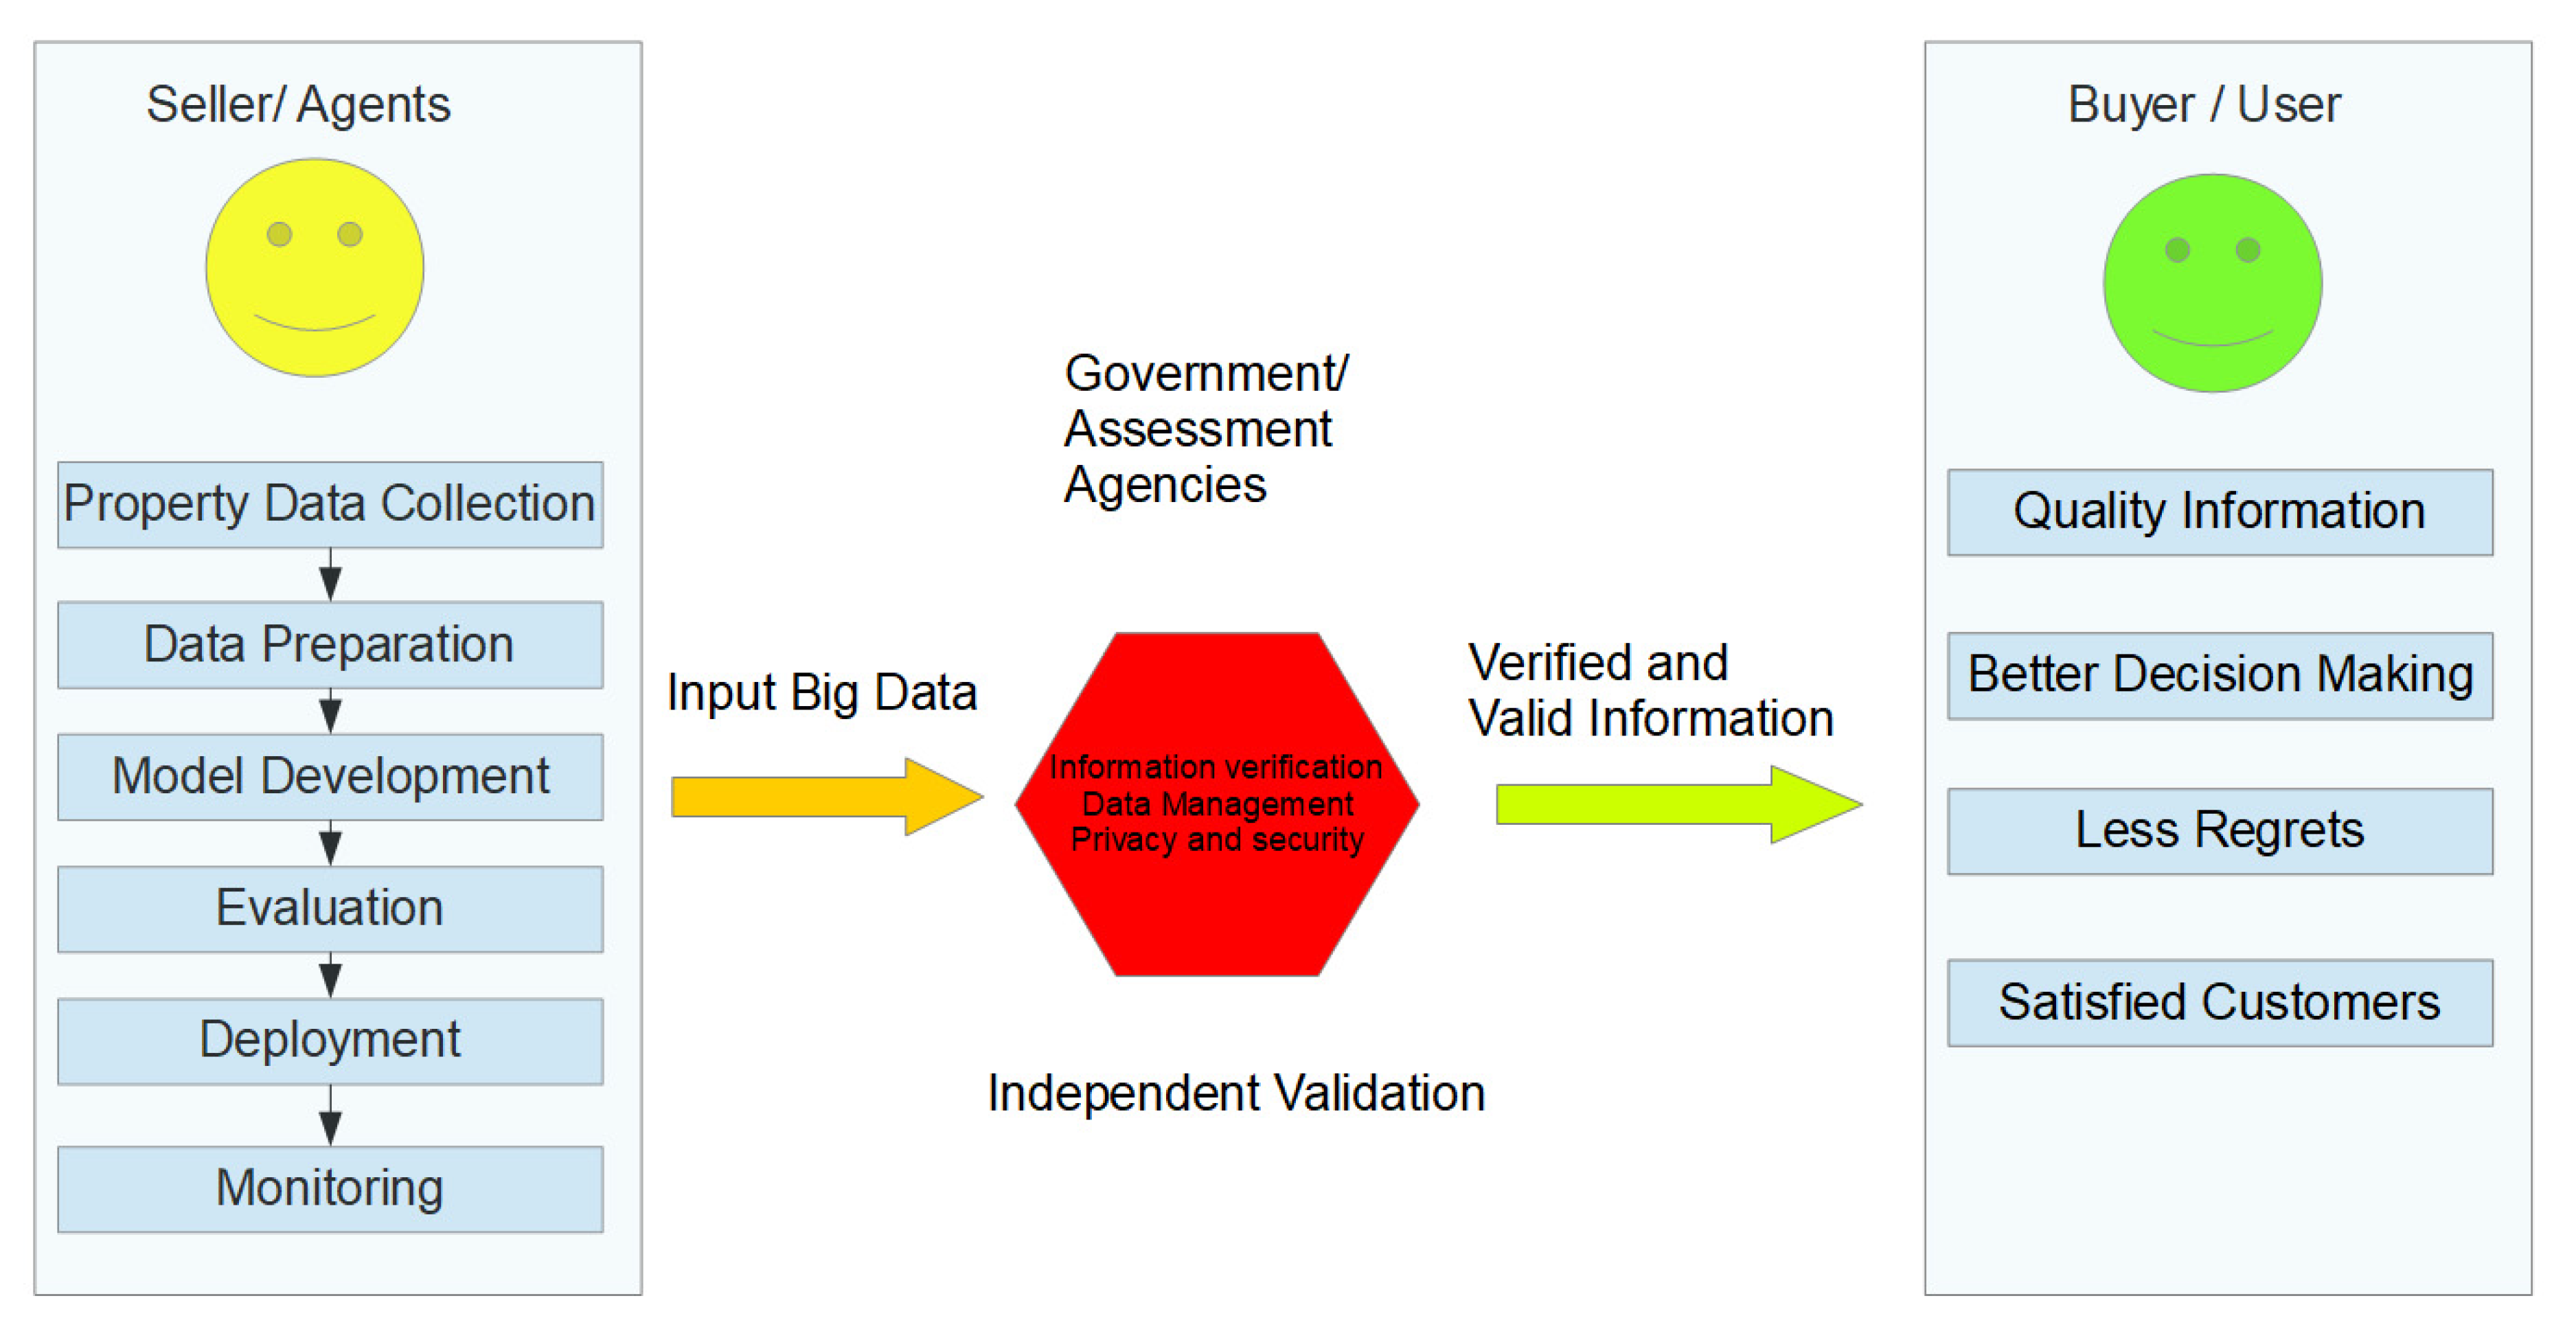
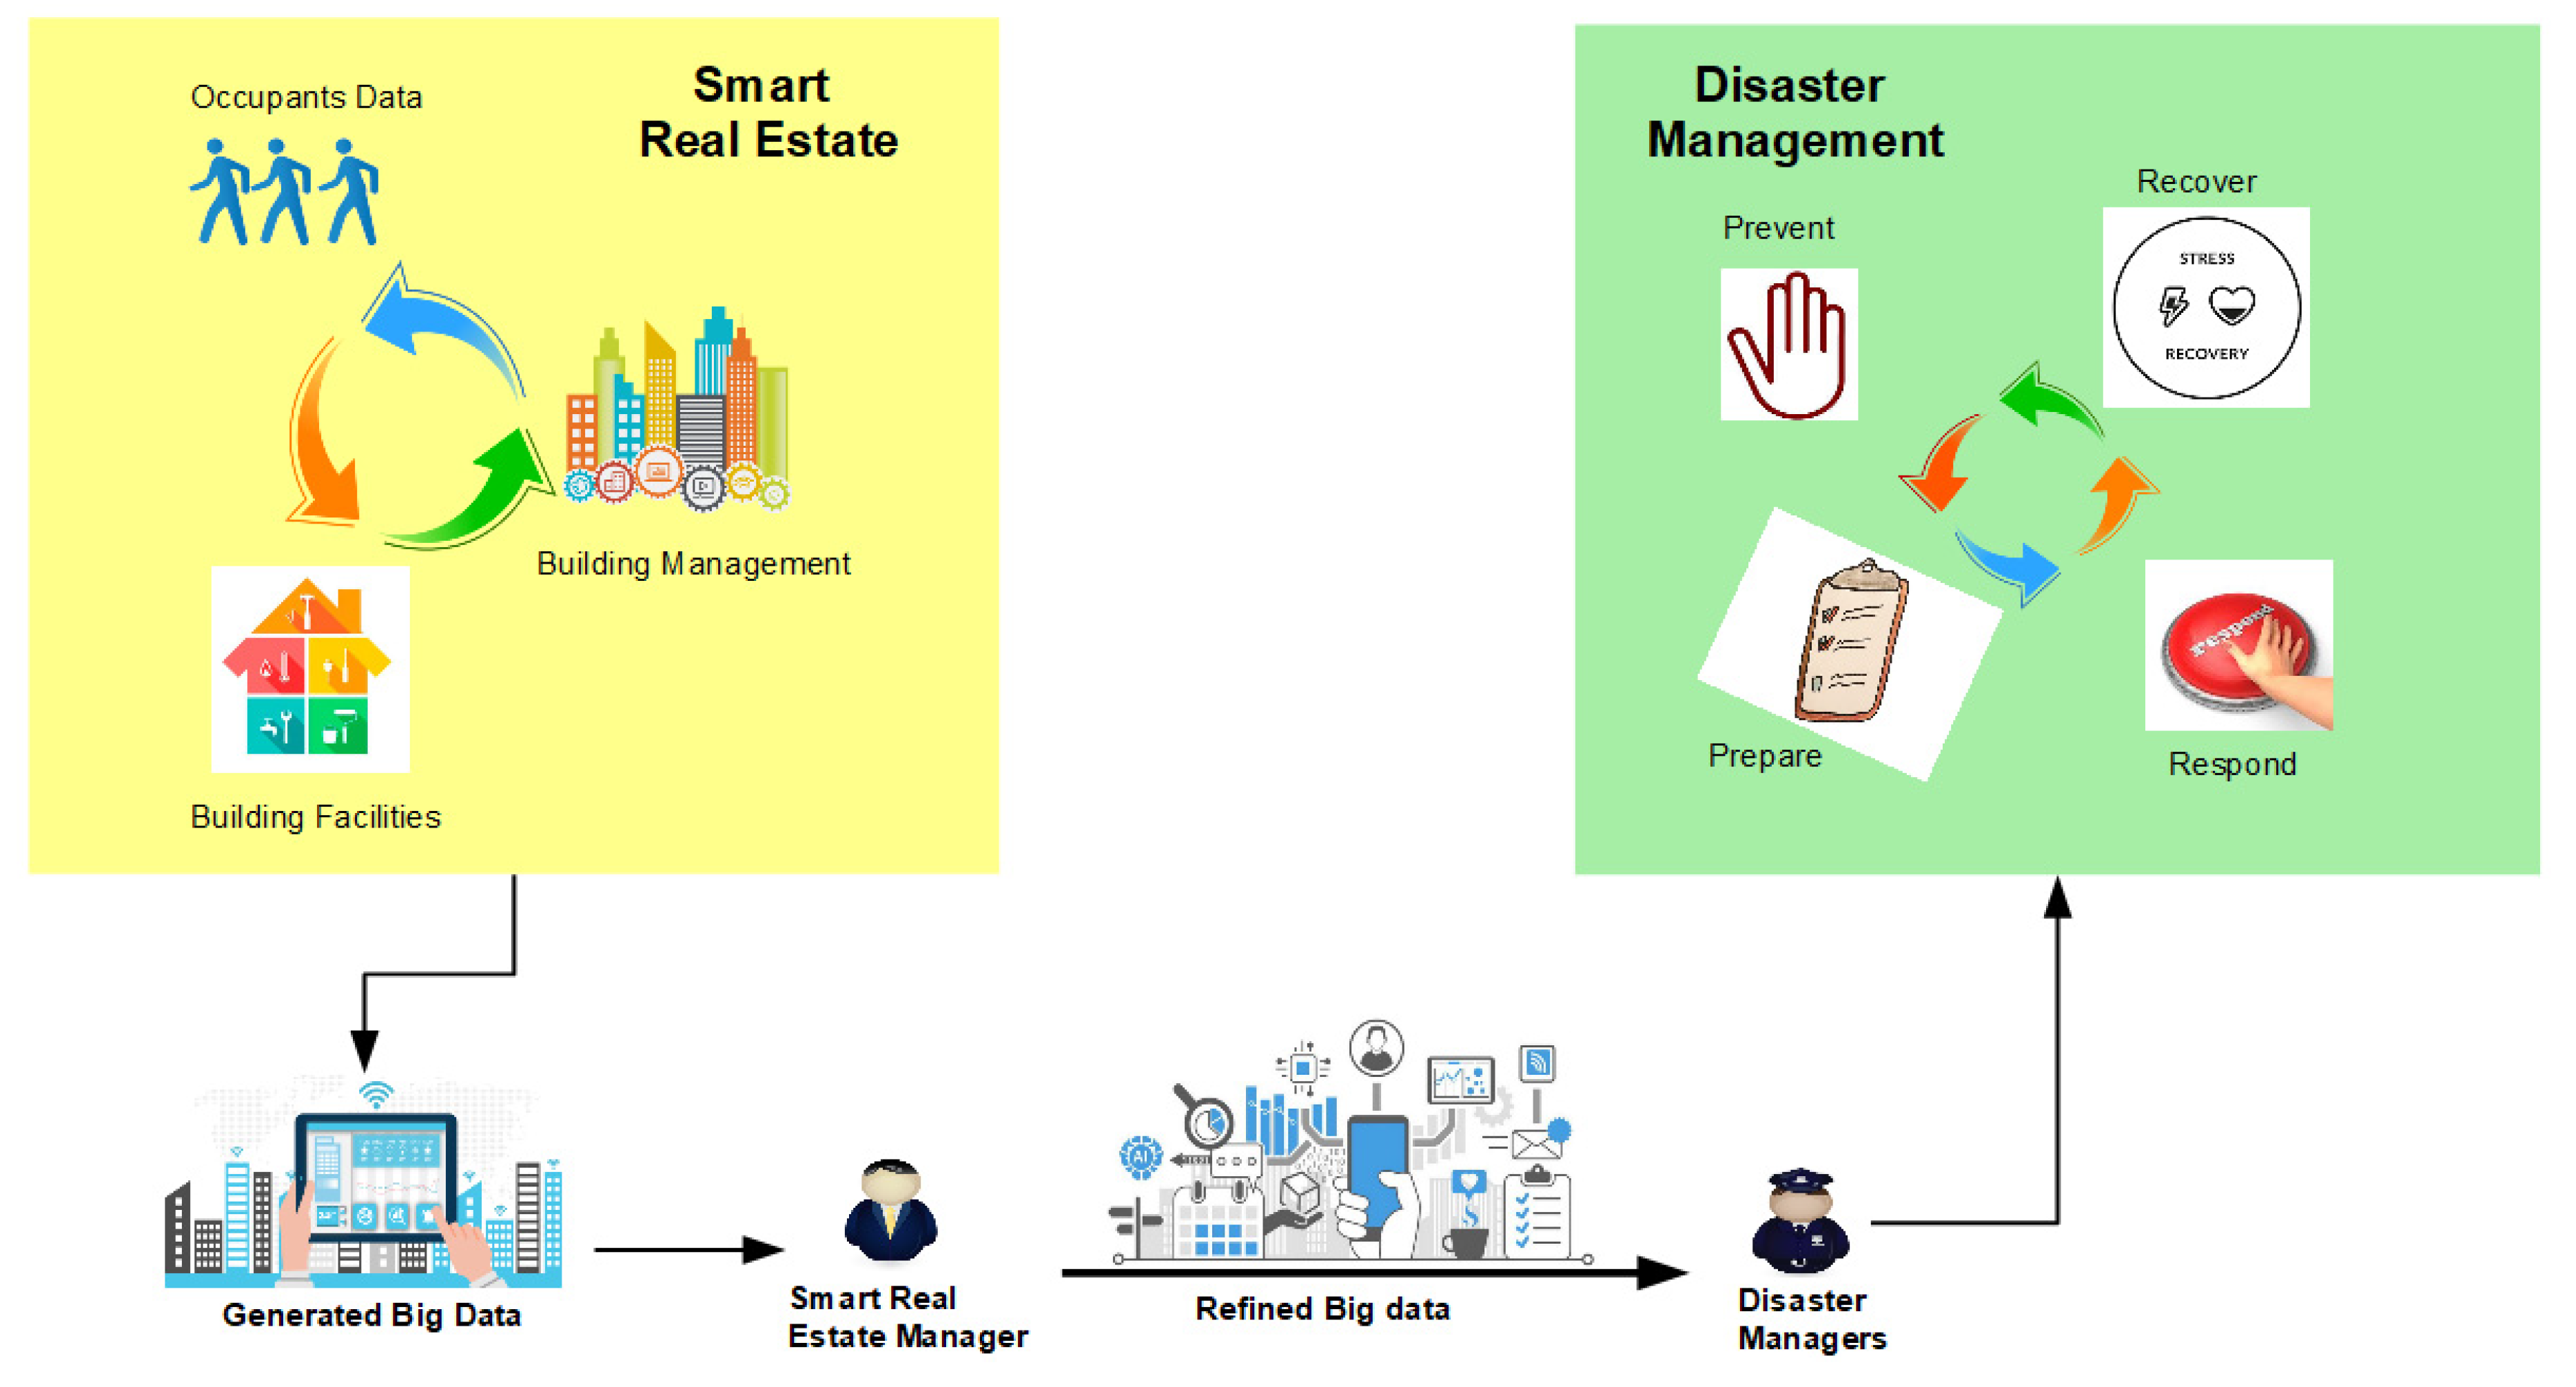
Based on the applications of big data in smart real estate and disaster management, a merging point can be highlighted where the input big data from smart real estate can help plan for disaster risks and manage them in case of occurrence, as shown in Figure 15. The data of building occupants are usually maintained by the building managers and strata management. These data coupled with the data from building integration, maintenance, and facility management constitutes smart real estate big data controlled by the real estate managers. These data, if refined and shared with the disaster managers and response teams by the smart real estate management agencies and managers, can help in planning for disaster response. For example, the data related to available facilities at the building can help prepare the occupants for upcoming disasters through proper training and awareness, who can respond to these disasters in an efficient way. Similarly, knowledge of smart building components and the associated building management data can help address the four key areas of disaster risk management: prevent, prepare, respond, and recover. The proposed merging framework is inspired by the works of Grinberger et al. [185], Lv et al. [186], Hashem et al. [187], and Shah et al. [30]. Grinberger et al. [185] used data obtained from smart real estate in terms of occupant data in terms of socioeconomic attributes such as income, age, car ownership, and building data based on value and floor space to investigate the disaster preparedness response for a hypothetical earthquake in downtown Jerusalem. Lv et al. [186] proposed a model for using big data obtained from multimedia usage by real estate users to develop a disaster management plan for service providers such as traffic authorities, fire, and other emergency departments. Hashem et al. [187] proposed an integrated model based on wireless sensing technologies that can integrate various components of smart cities for industrial process monitoring and control, machine health monitoring, natural disaster prevention, and water quality monitoring. Similarly, Shah et al. [30] proposed a disaster-resilient smart city concept that integrates IoT and big data technologies and offers a generic solution for disaster risk management activities in smart city incentives. Their framework is based on a combination of the Hadoop Ecosystem and Apache Spark that supports both real-time and offline analysis, and the implementation model consists of data harvesting, data aggregation, data pre-processing, and a big data analytics and service platform. A variety of datasets from smart buildings, city pollution, traffic simulators, and social media such as Twitter are utilized for the validation and evaluation of the system to detect and generate alerts for a fire in a building, pollution level in the city, emergency evacuation path, and the collection of information about natural disasters such as earthquakes and tsunamis. Furthermore, Yang et al. [25] proposed real-time feedback loops on nature disasters to help real estate and city decision-makers make real-time updates, along with a precision and dynamic rescue plan that helps in in all four phases of disaster risk management: prevention, mitigation, response, and recovery; this can help the city and real estate planners and managers to take prompt and accurate actions to improve the city’s resilience to disasters.
This is a two-way process where data from smart real estate can help prepare for disasters and vice vera. Big data used in preparedness and emergency planning may increase urban resilience as it will help to produce more accurate emergency and response plans. As such, Deal et al. [188] argued that, for achieving the holistic results for developing urban resilience and promoting preparedness among the communities for disaster, there is a need to be able to translate big data at scales and in ways that are useful and approachable through sophisticated planning support systems. Such systems must possess a greater awareness of application context and user needs; furthermore, they must be capable of iterative learning, be capable of spatial and temporal reasoning, understand rules, and be accessible and interactive. Kontokosta and Malik [189] introduced the concept of benchmarking neighborhood resilience by developing a resilience to emergencies and disasters index that integrates physical, natural, and social systems through big data collected from large-scale, heterogeneous, and high-resolution urban data to classify and rank the relative resilience capacity embedded in localized urban systems. Such systems can help improve urban resilience by preparing and producing accurate emergency responses in the case of disasters. Similarly, Klein et al. [190] presented the concept of a responsive city, in which citizens, enabled by technology, take on an active role in urban planning processes. As such, big data can inform and support this process with evidence by taking advantage of behavioral data from infrastructure sensors and crowdsourcing initiatives to help inform, prepare, and evacuate citizens in case of disasters. Furthermore, the data can be overlaid with spatial information in order to respond to events in decreasing time spans by automating the response process partially, which is a necessity for any resilient city management. Owing to these systems and examples, it can be inferred that smart real estate and disaster risk management can act as lifelines to each other, where big data generated in one field can be used to help strengthen the other, which, if achieved, can help move toward integrated city and urban management.

4.3. Discussion

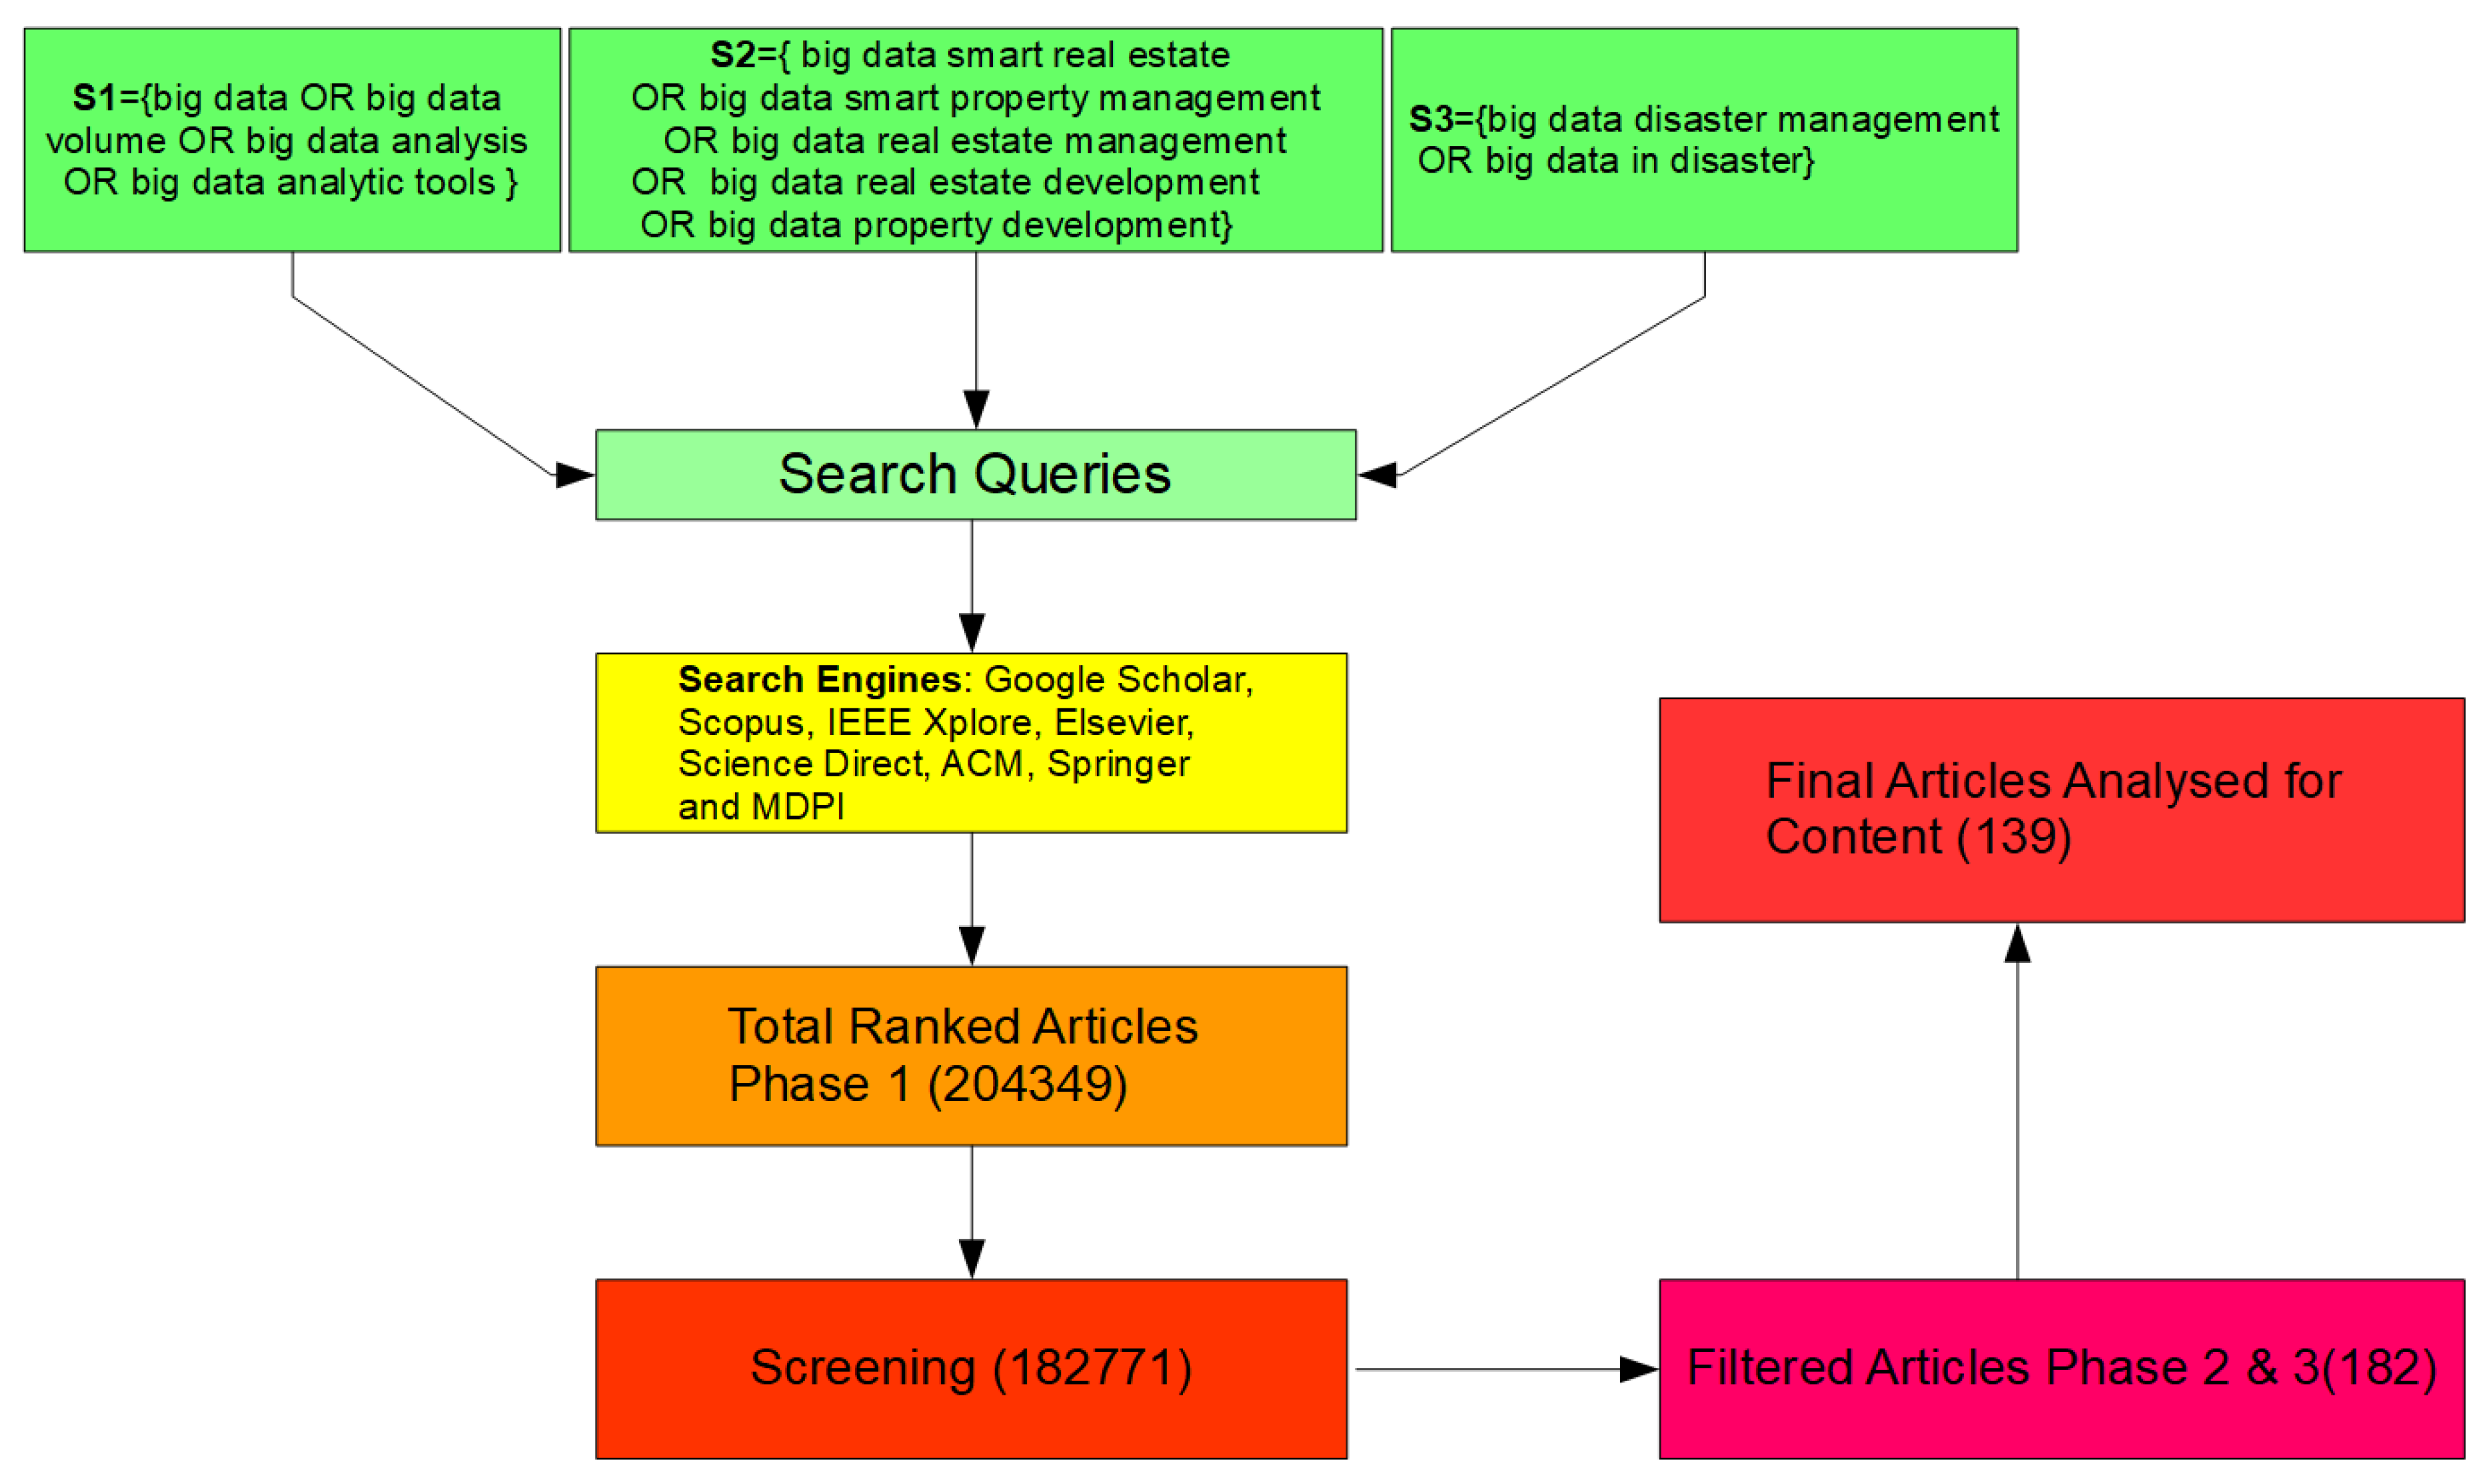
The current review provides a systematic view of the field of big data applications in smart real estate and disaster and risk management. This paper reviewed 139 articles on big data concepts and tools, as well as its applications in smart real estate and disaster management. Initially, the seven Vs of big data were explored with their applications in smart real estate and disaster management. This was followed by big data analytics tools including text, audio, video, and social media analytics with applications in smart real estate and disaster management. Next, big data analytics processes comprising data collection, storage, filtering, cleaning, analysis, and visualization were explored along with the technologies and tools used for each stage. Then, the two main frameworks for big data analytics, i.e., Hadoop and Apache Spark, were reviewed and compared based on their parameters and performance. Afterward, the applications of machine learning for big data were explored. This was followed by the challenges faced by big data, and potential solutions to its implementation in different fields were discussed. Lastly, a dedicated section explored the applications of big data in various fields with a specific focus on smart real estate and disaster management and how big data can be used to integrate the two fields. These findings and critical analyses distinguish this review from previous reviews. Another difference of this review compared with previous attempts is the focus of the present review on the applications of big data in smart real estate and disaster management that highlights the potential for integrating the two fields. The findings and major analyses are discussed below.
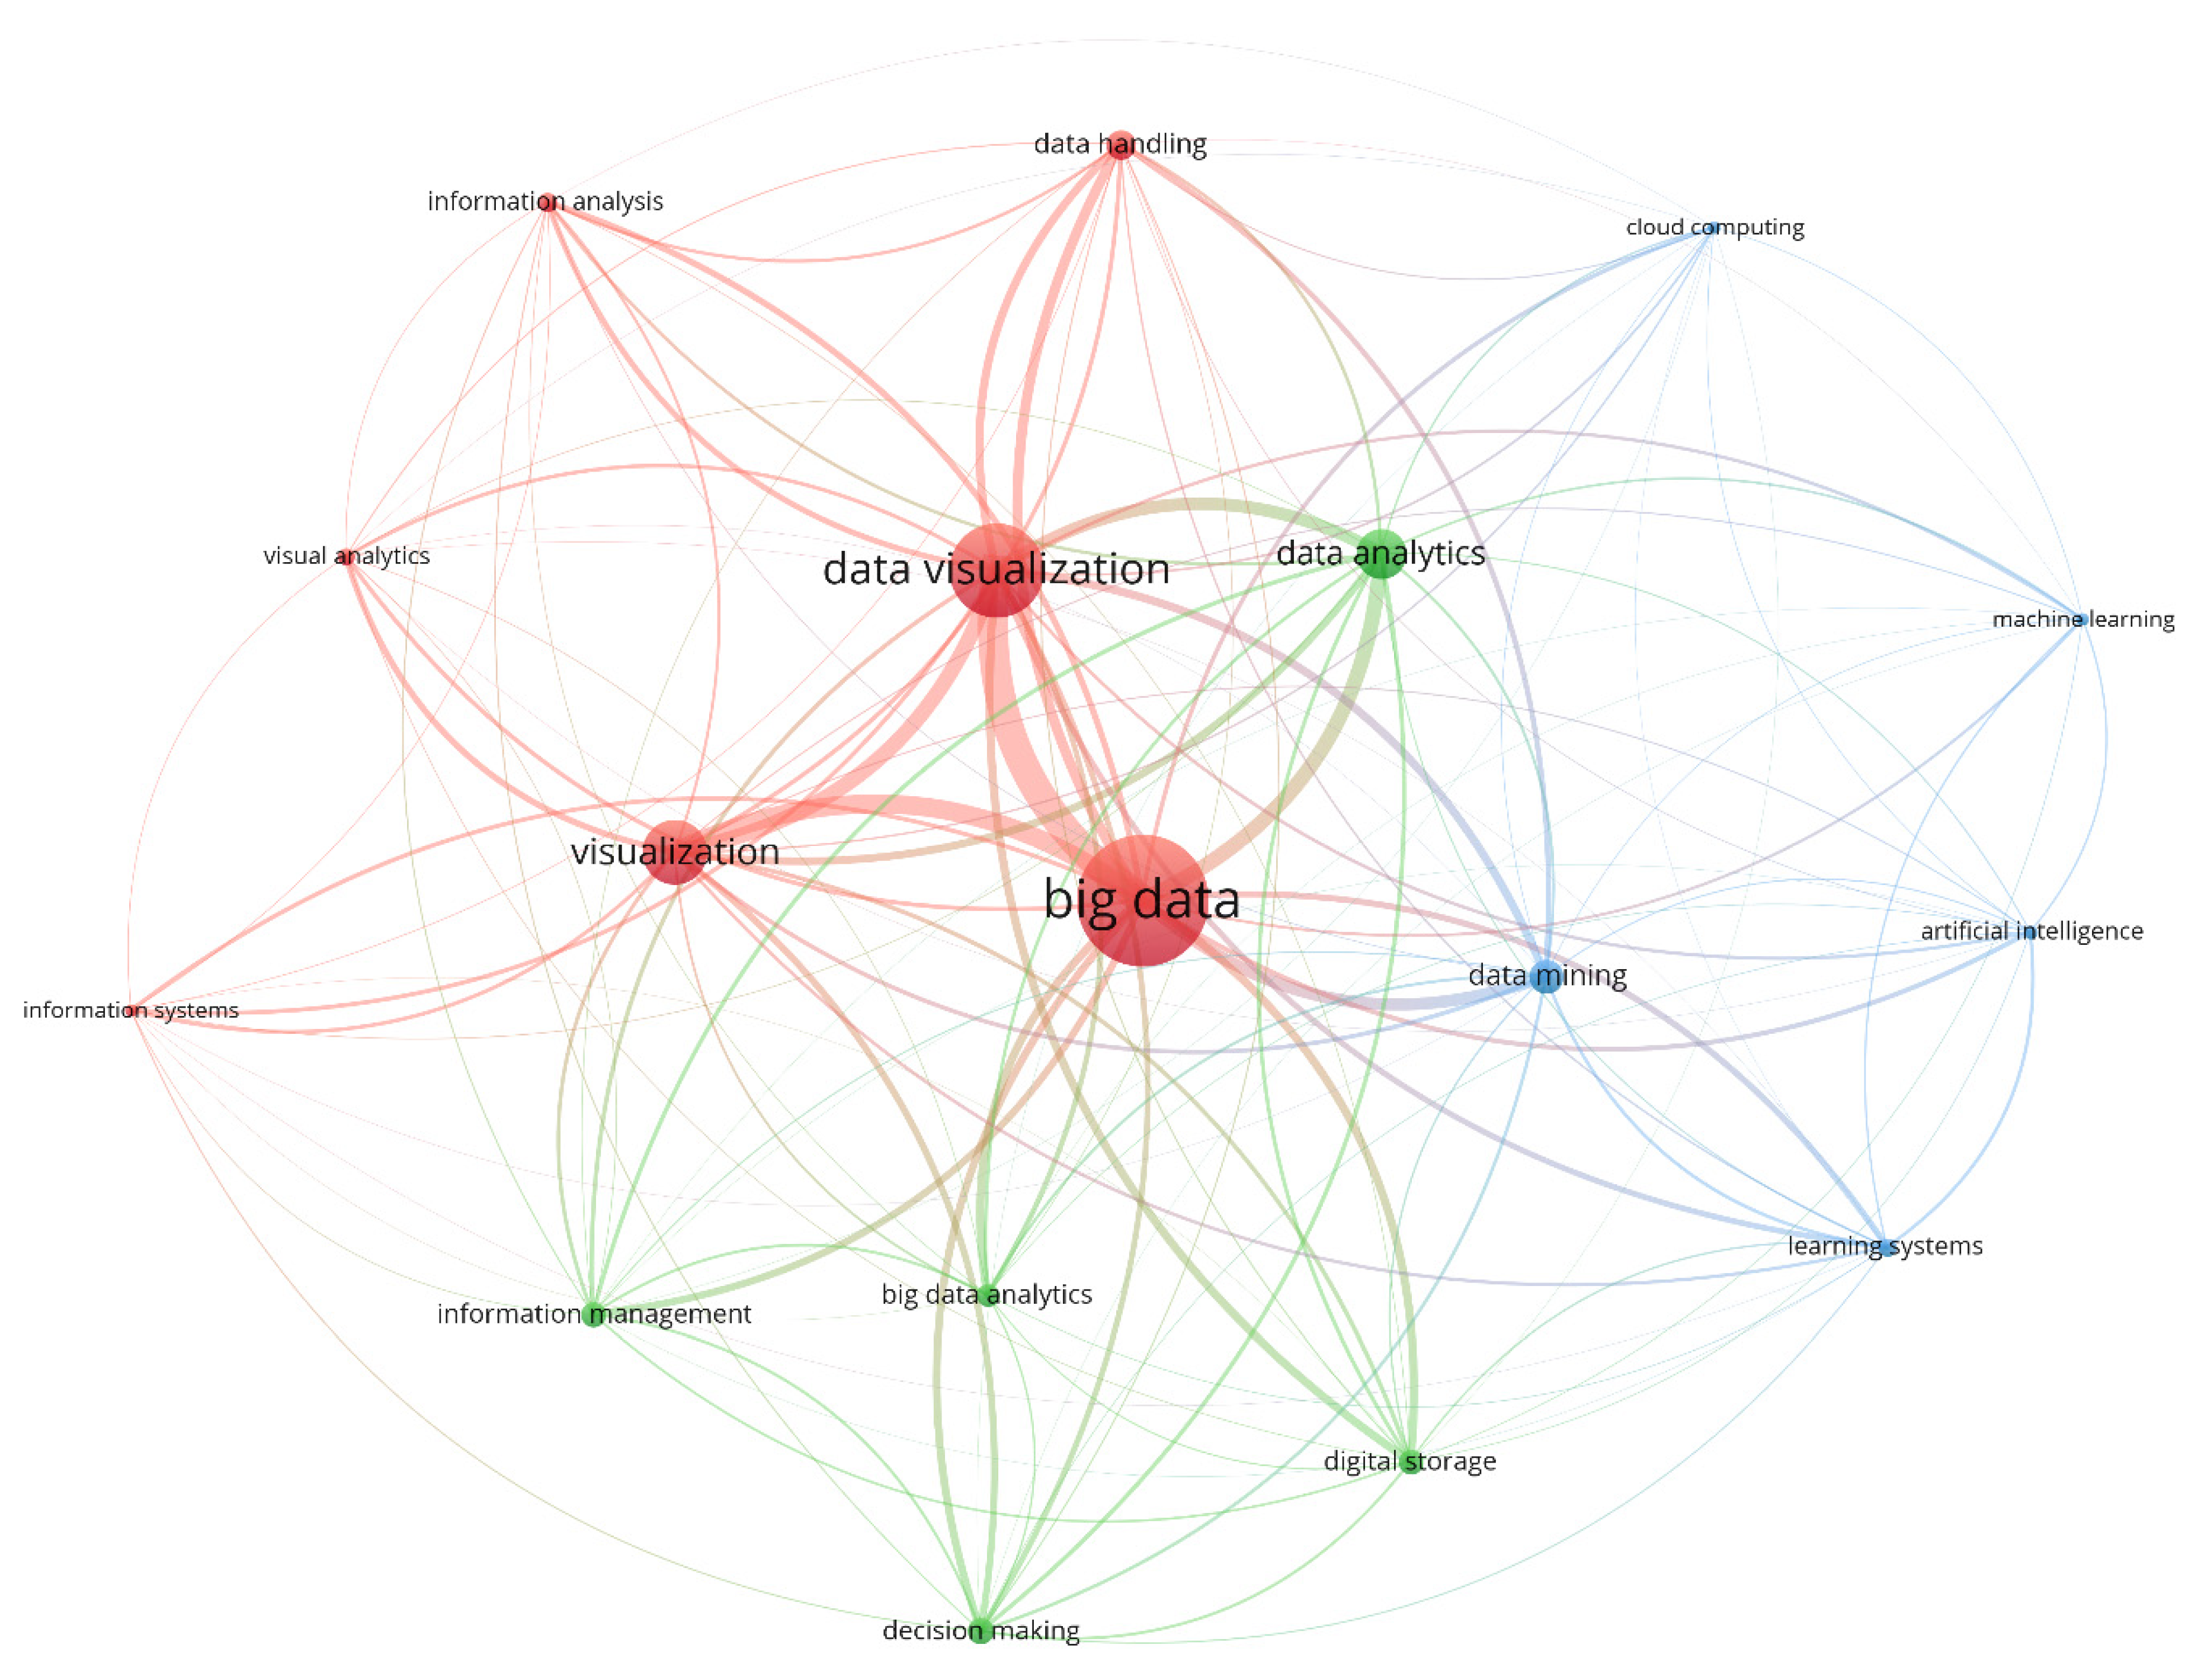
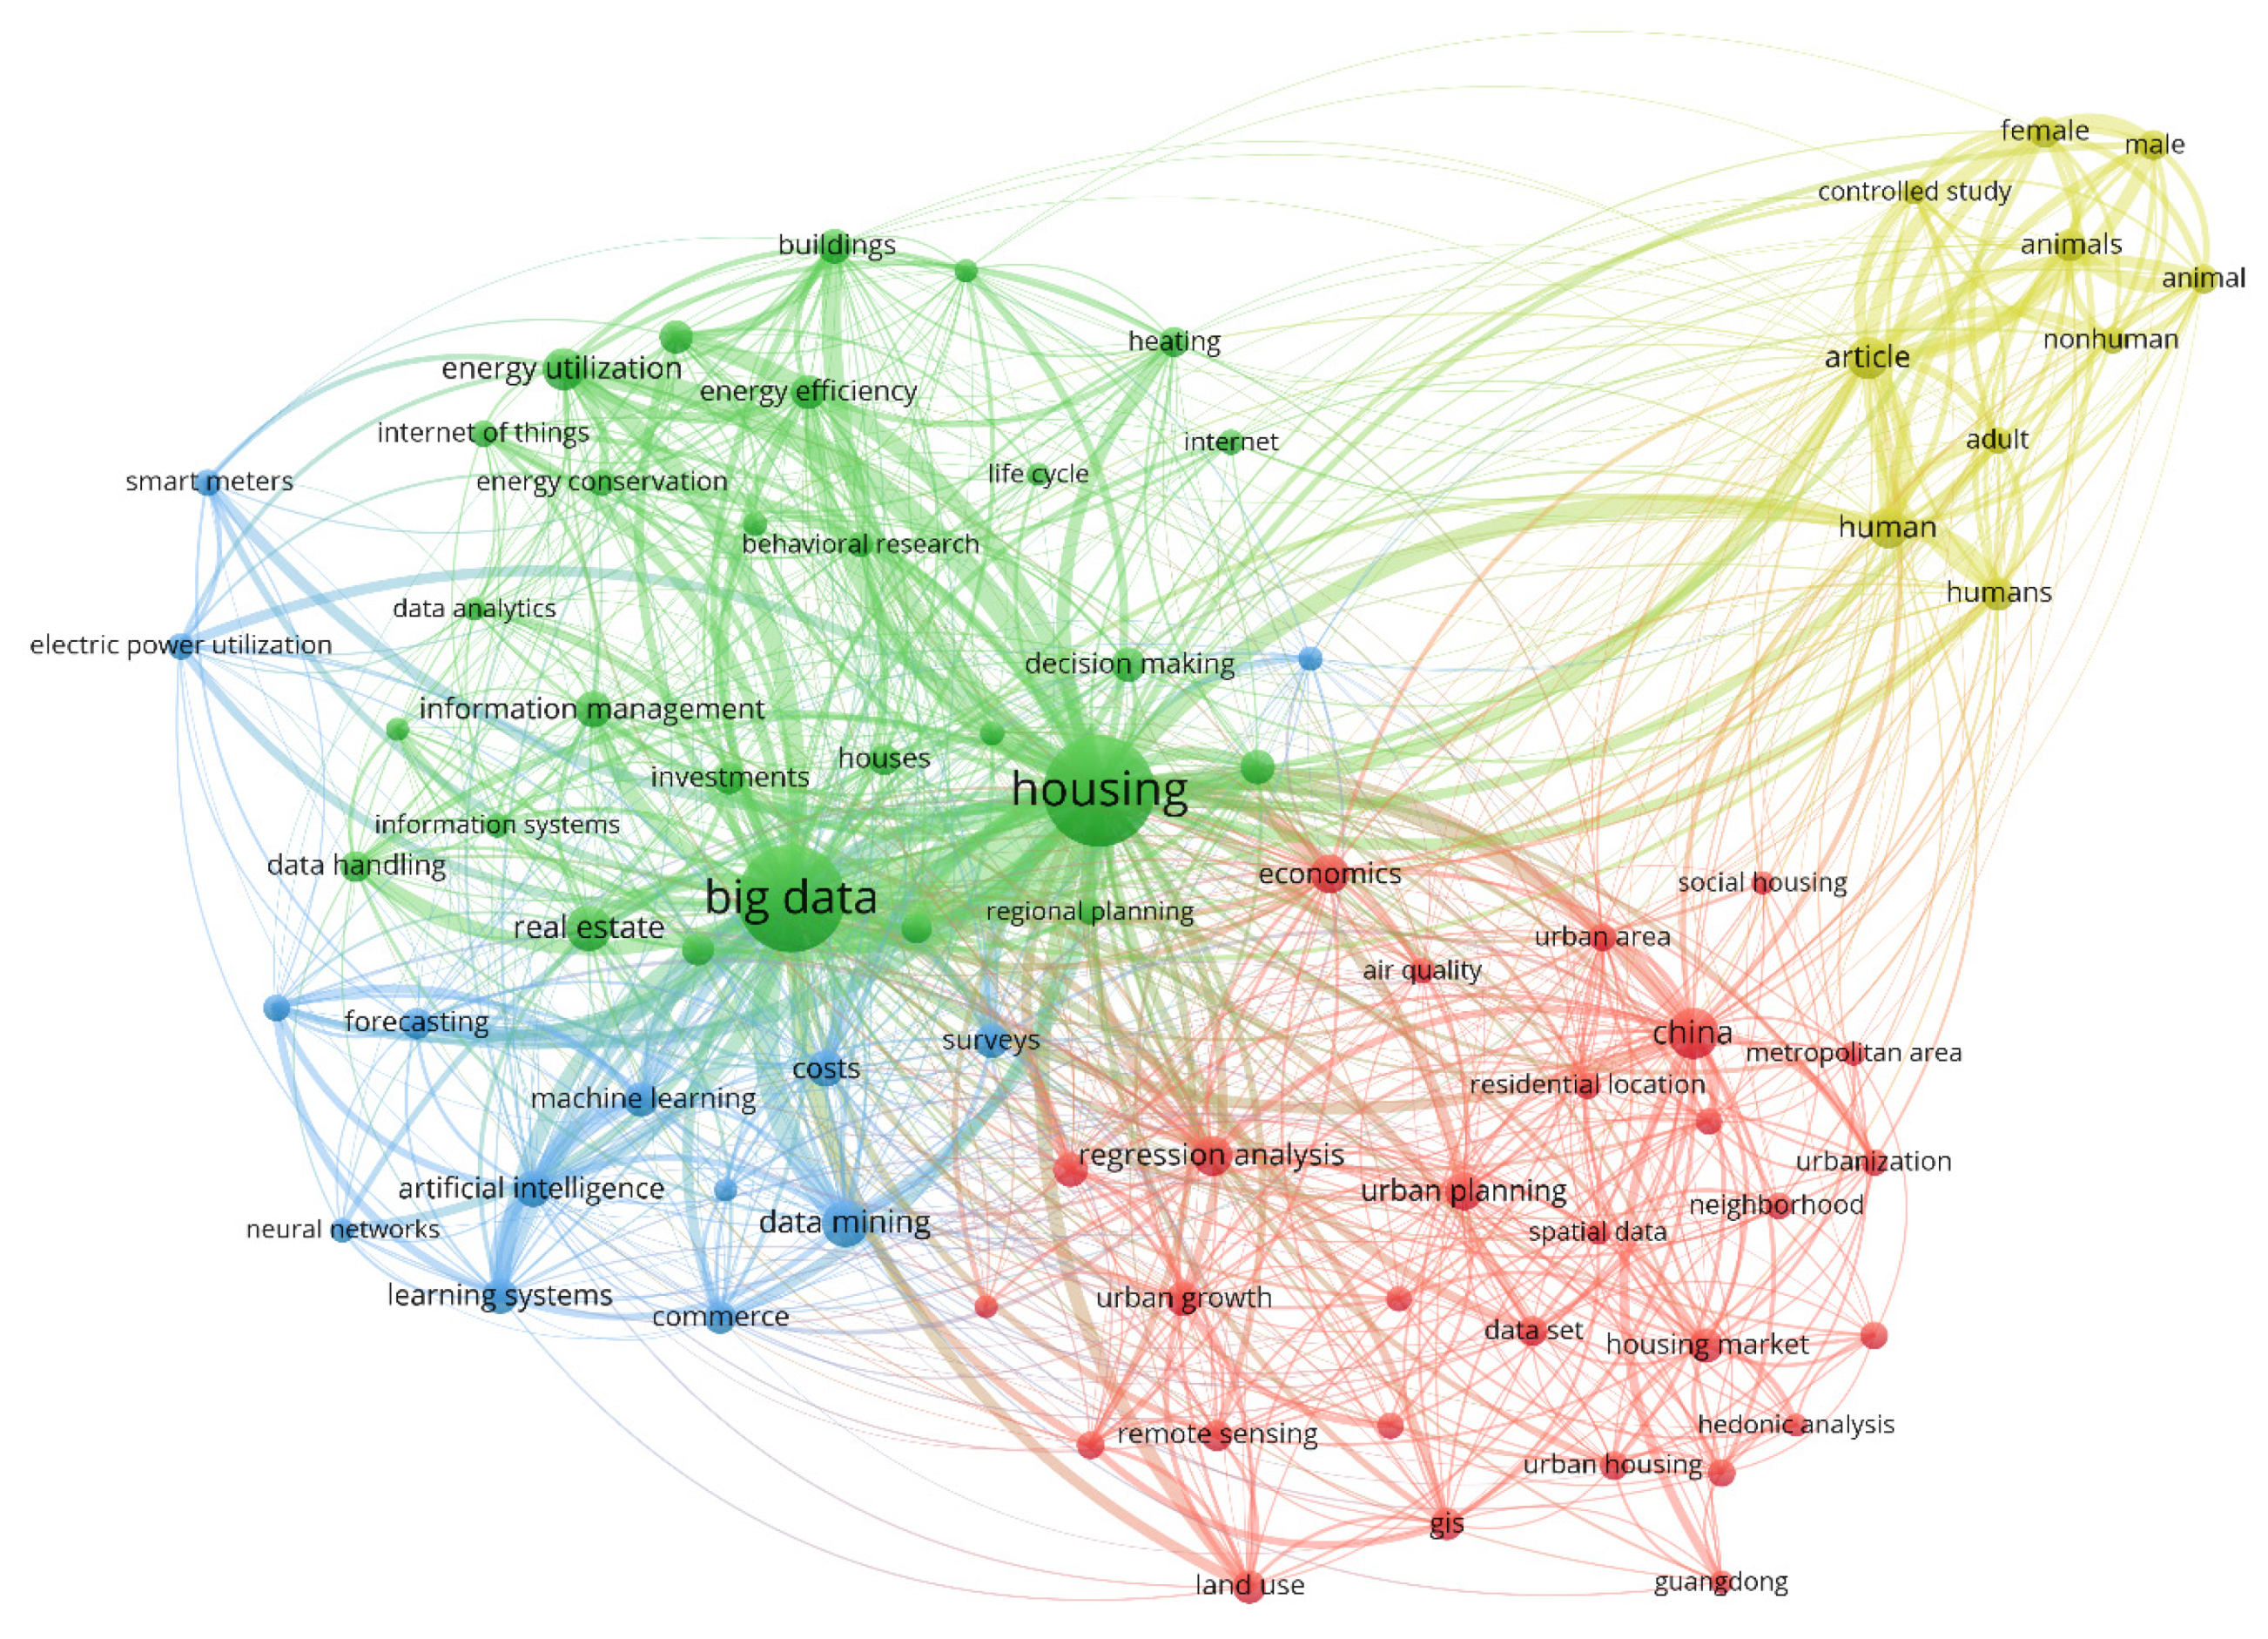
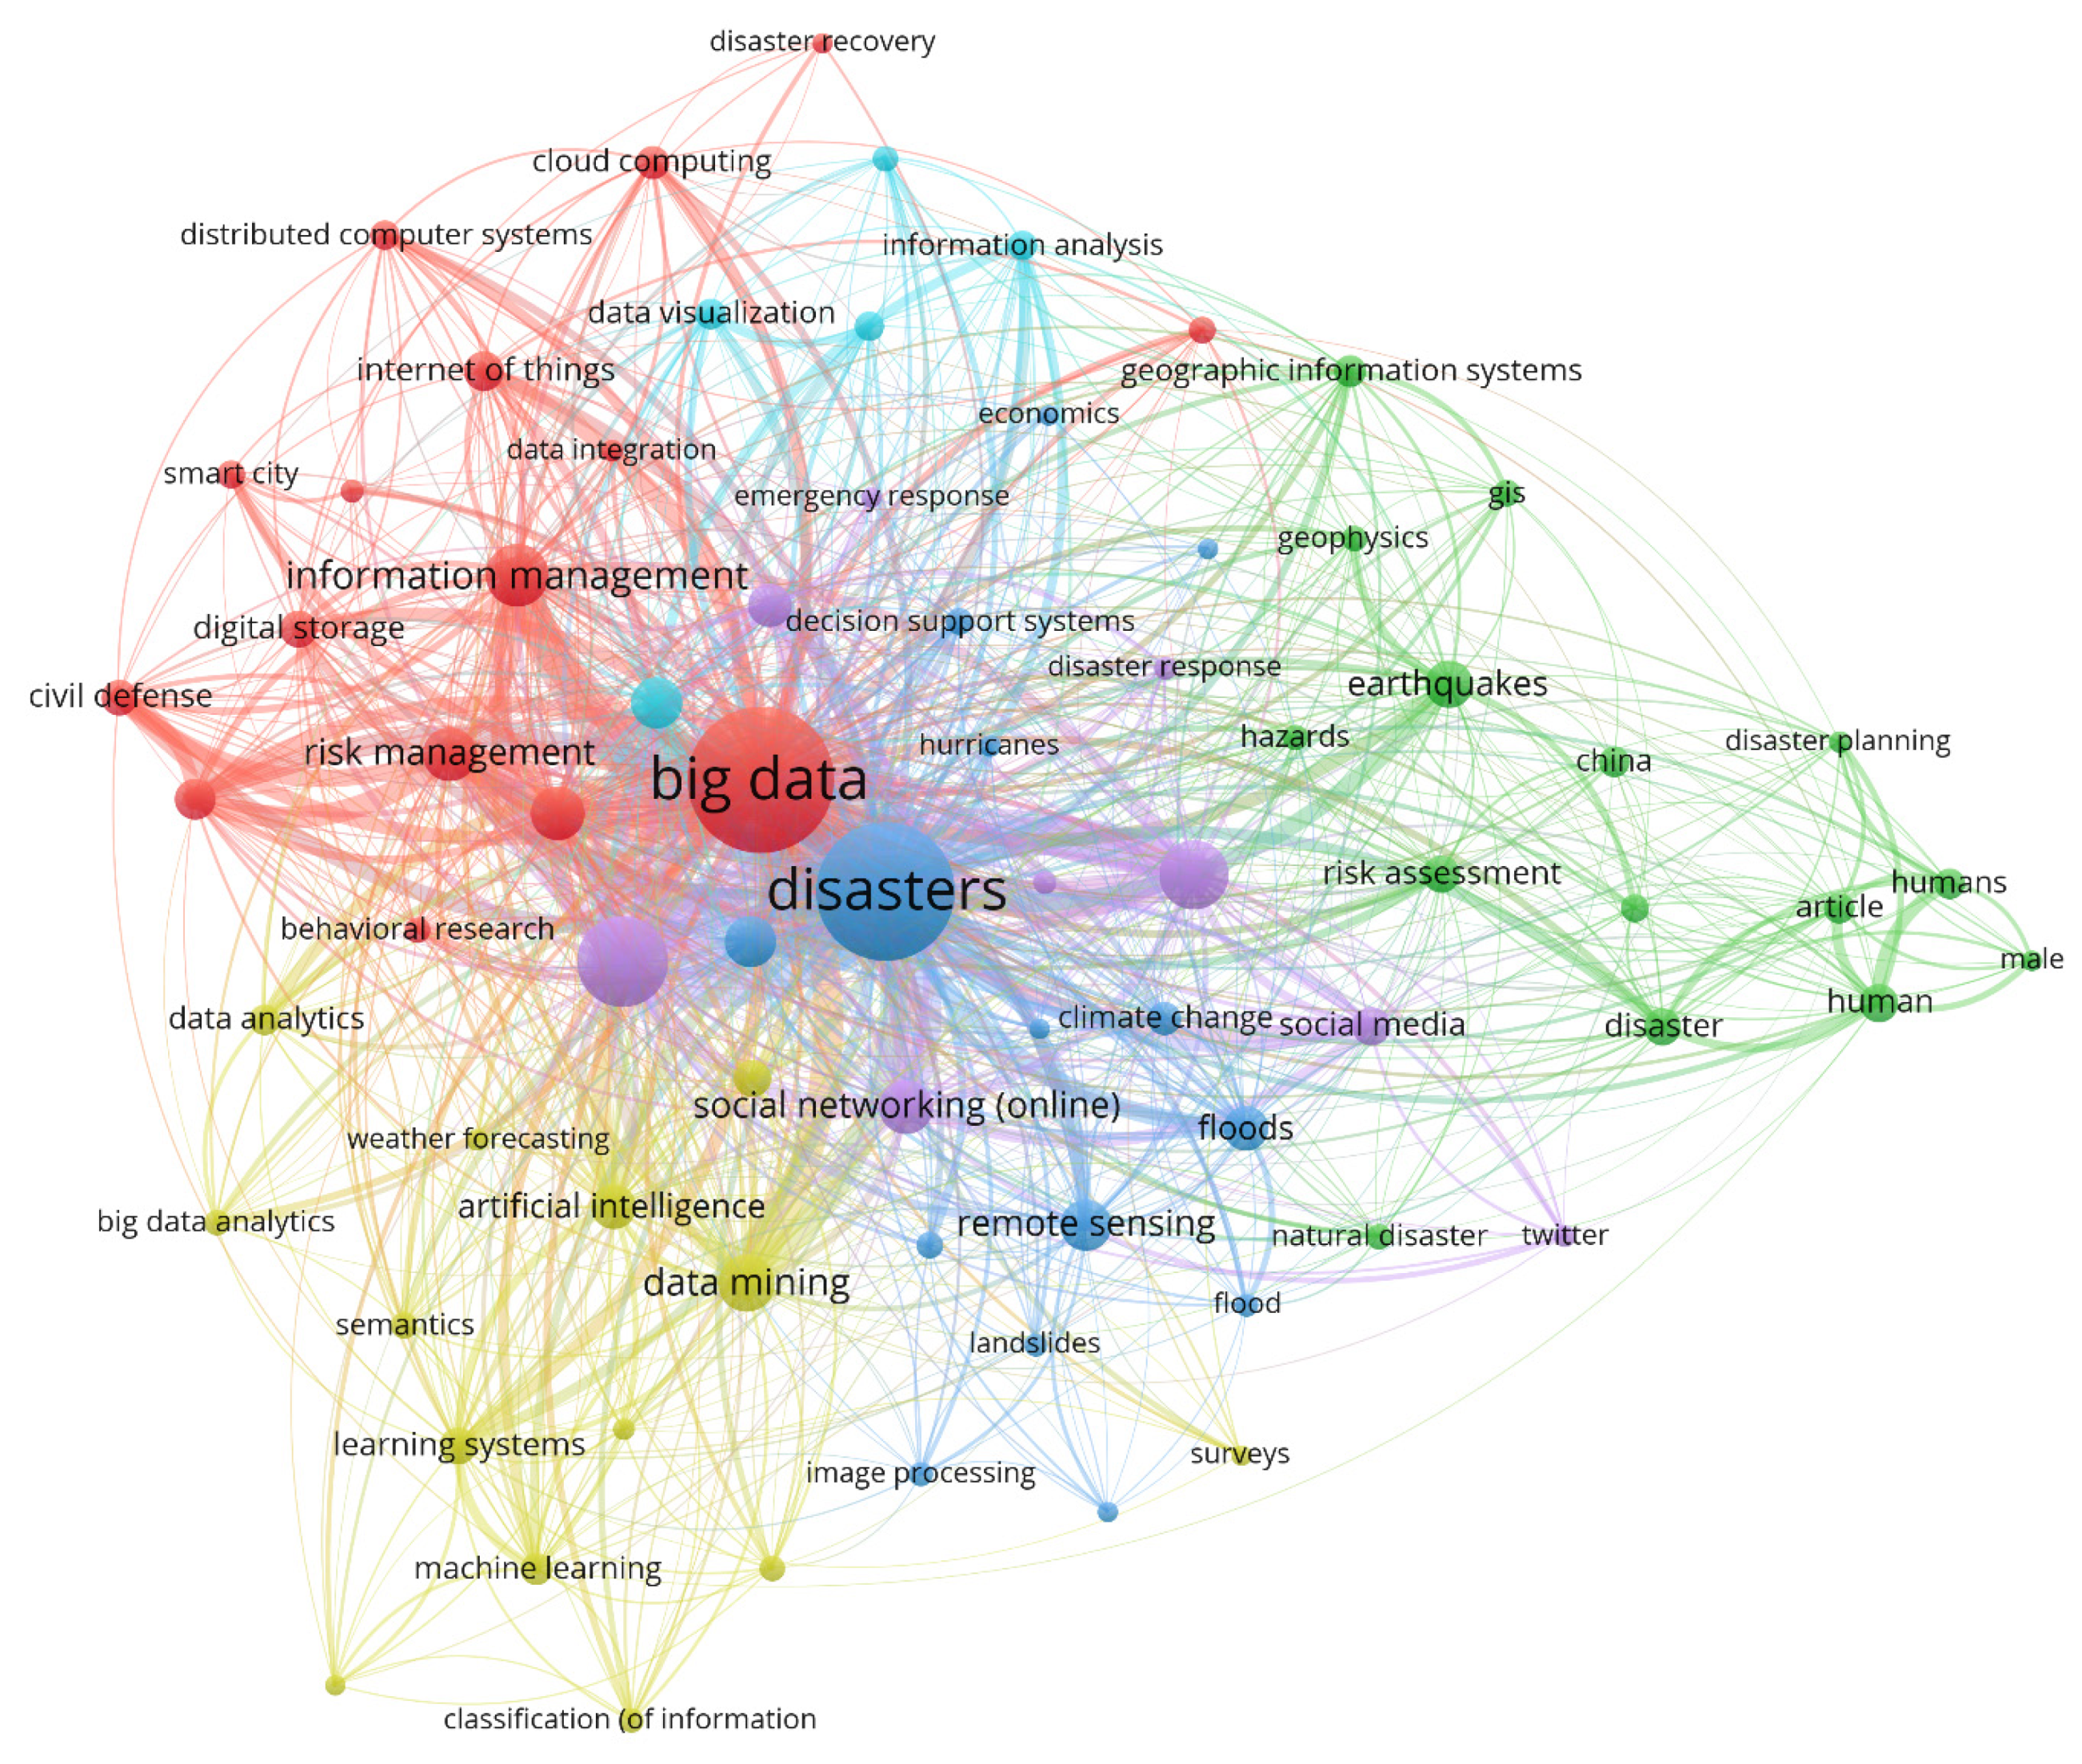
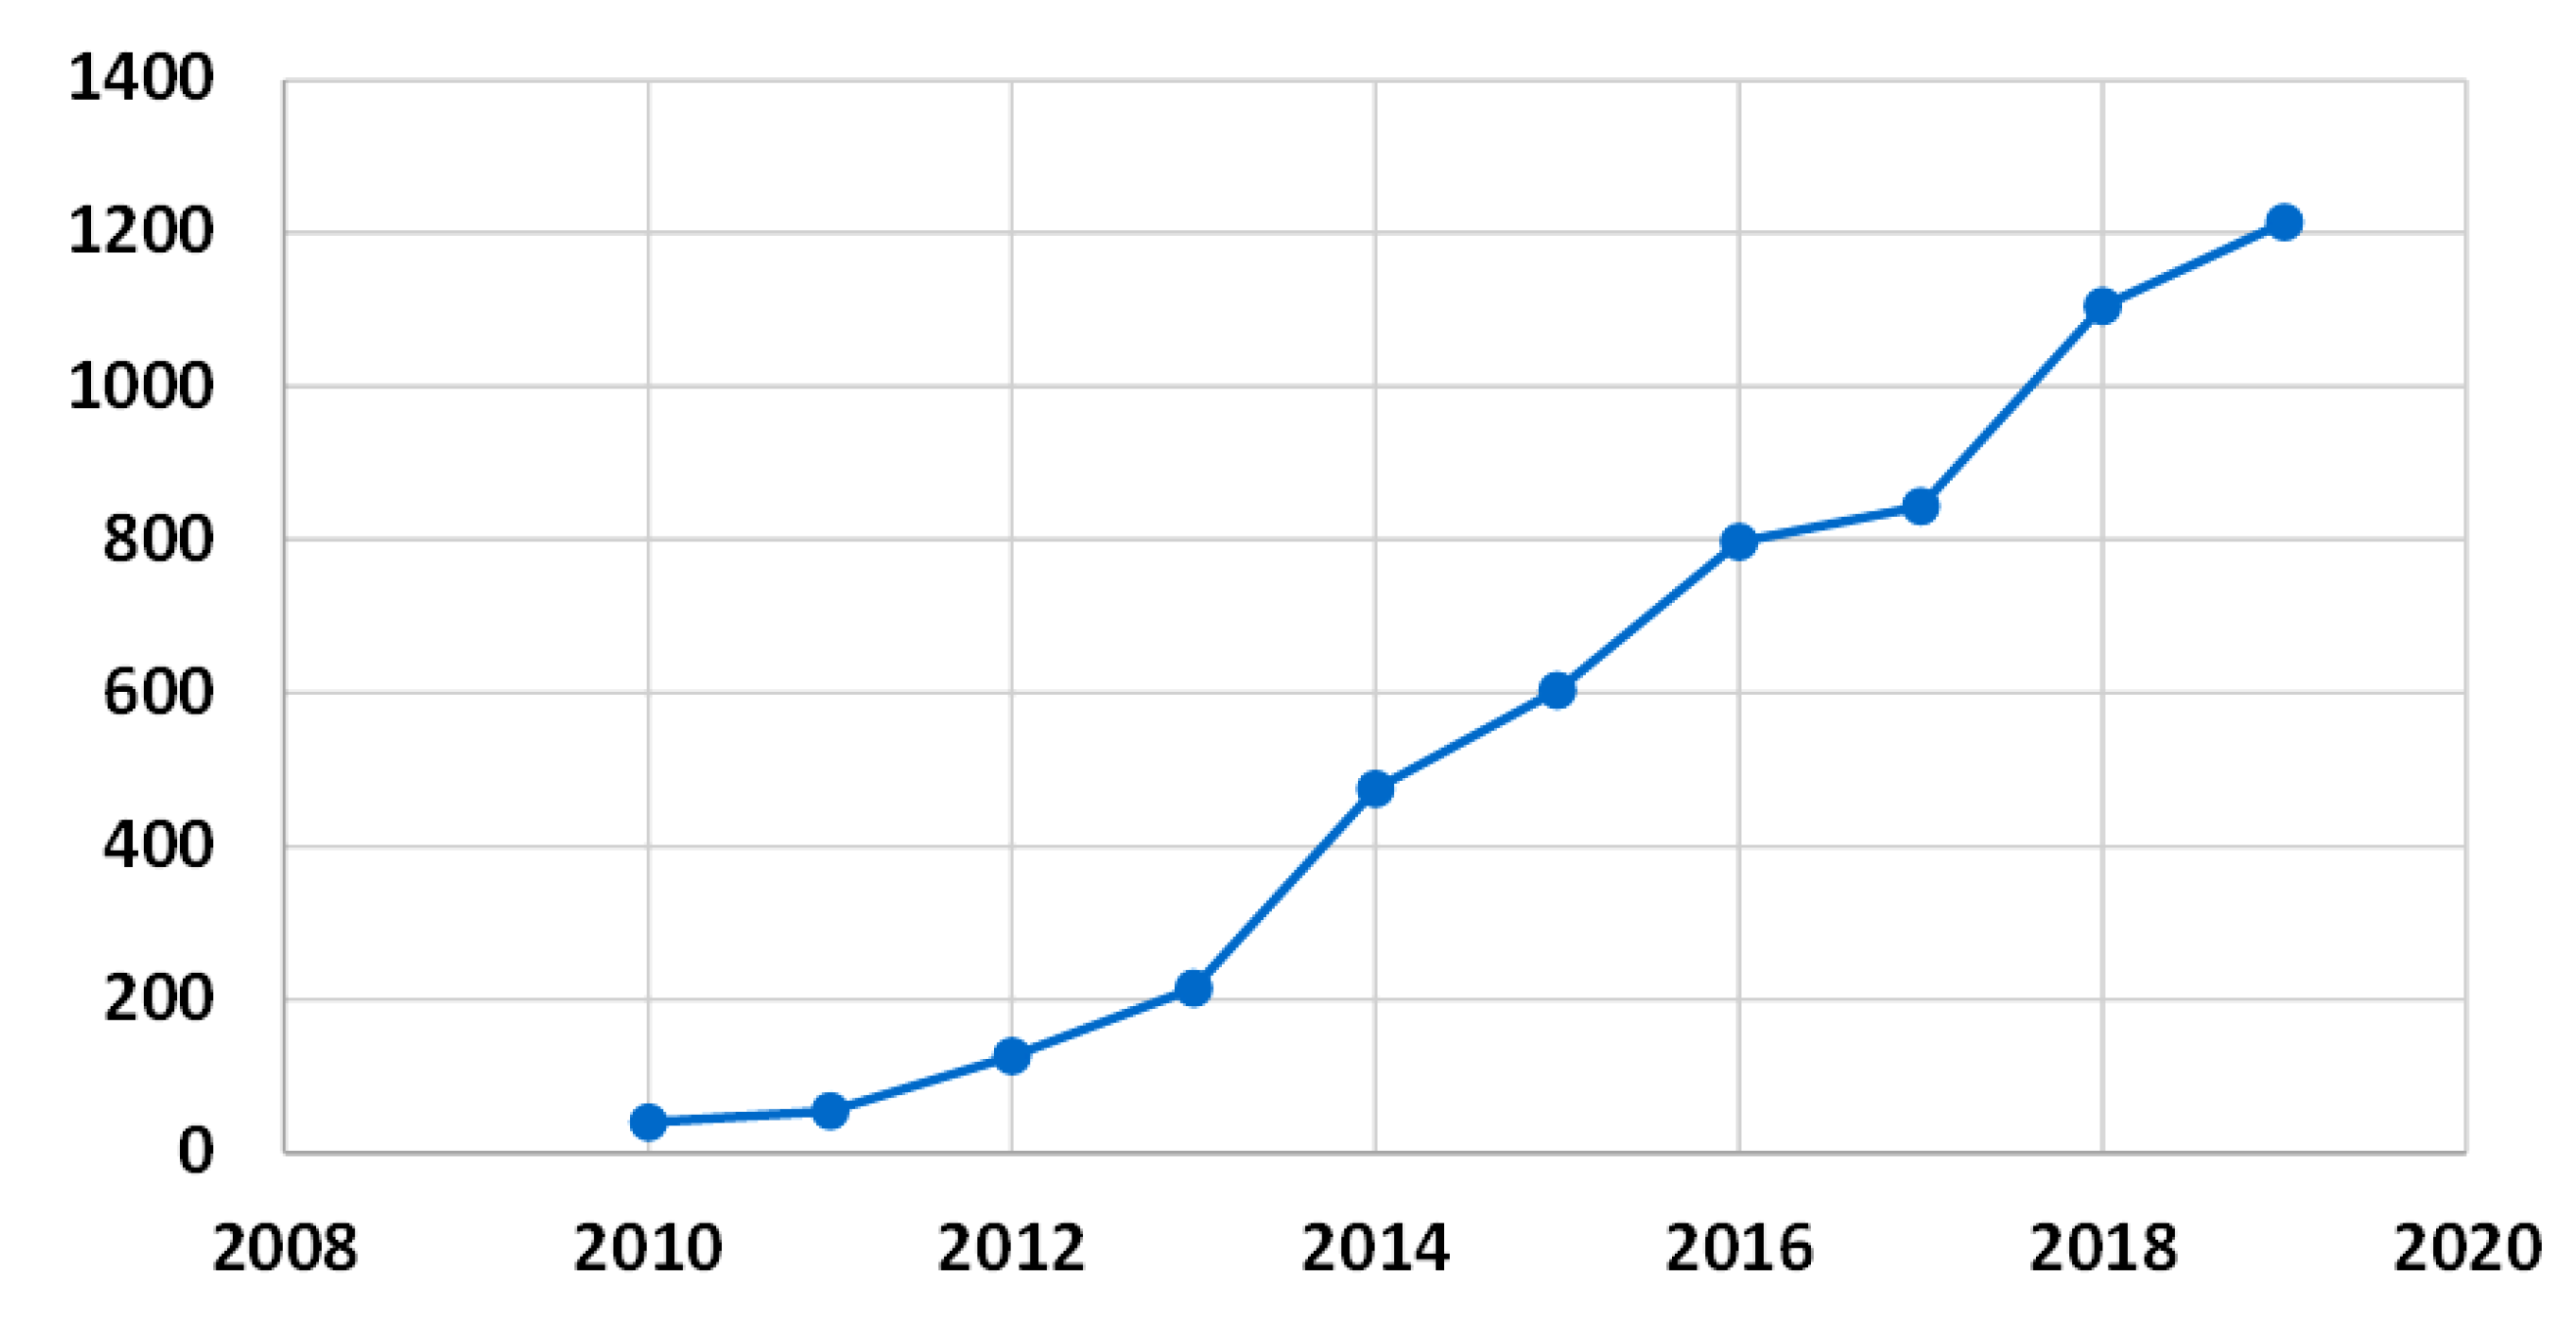
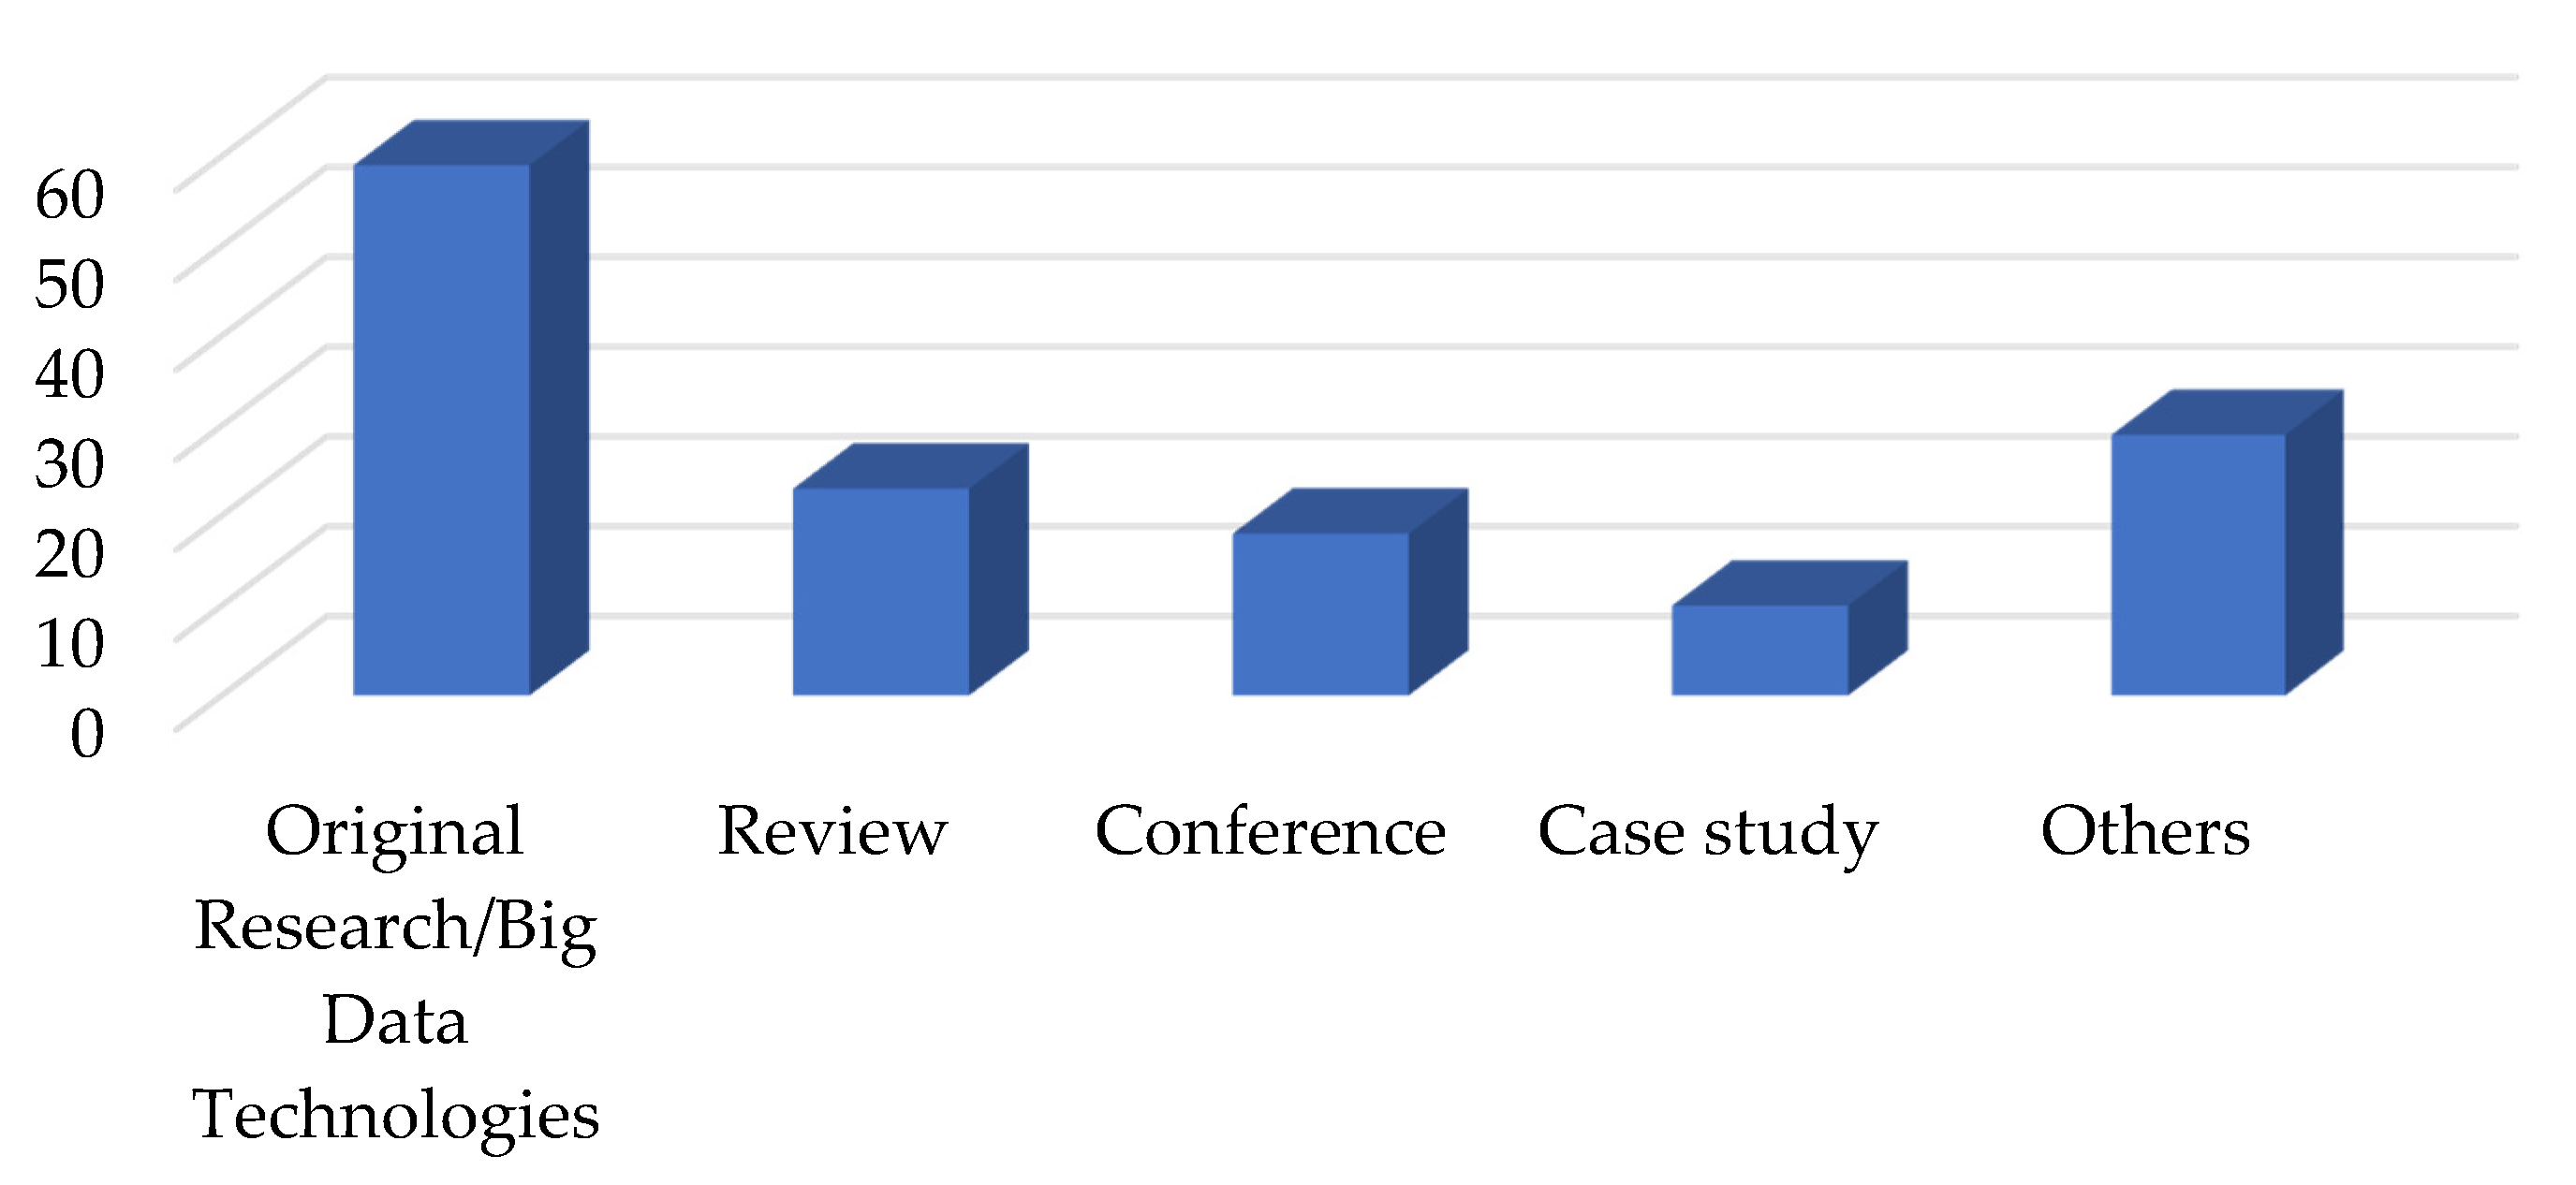
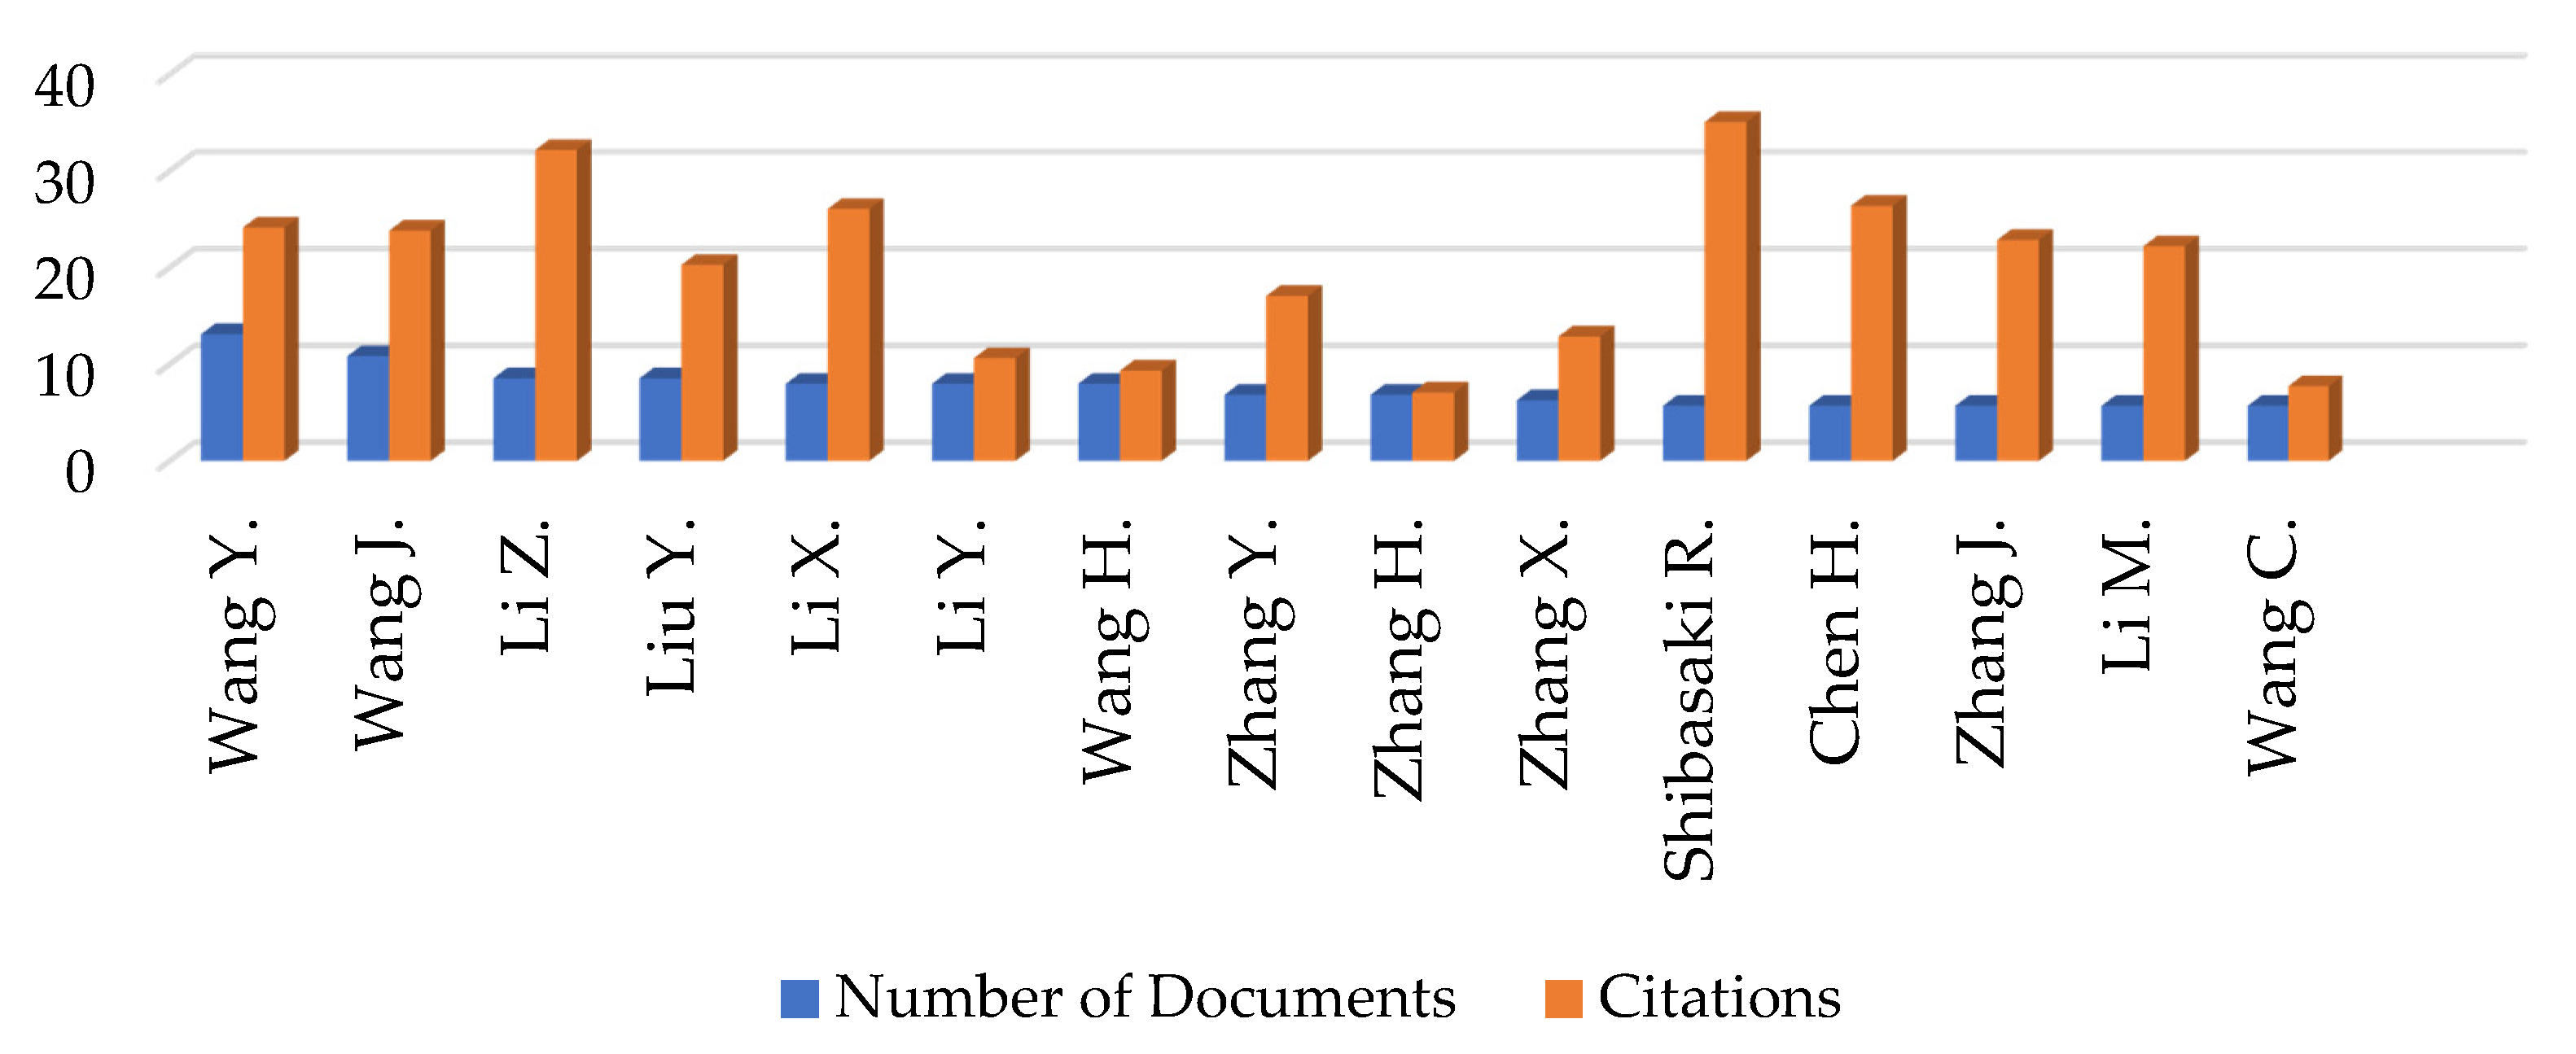
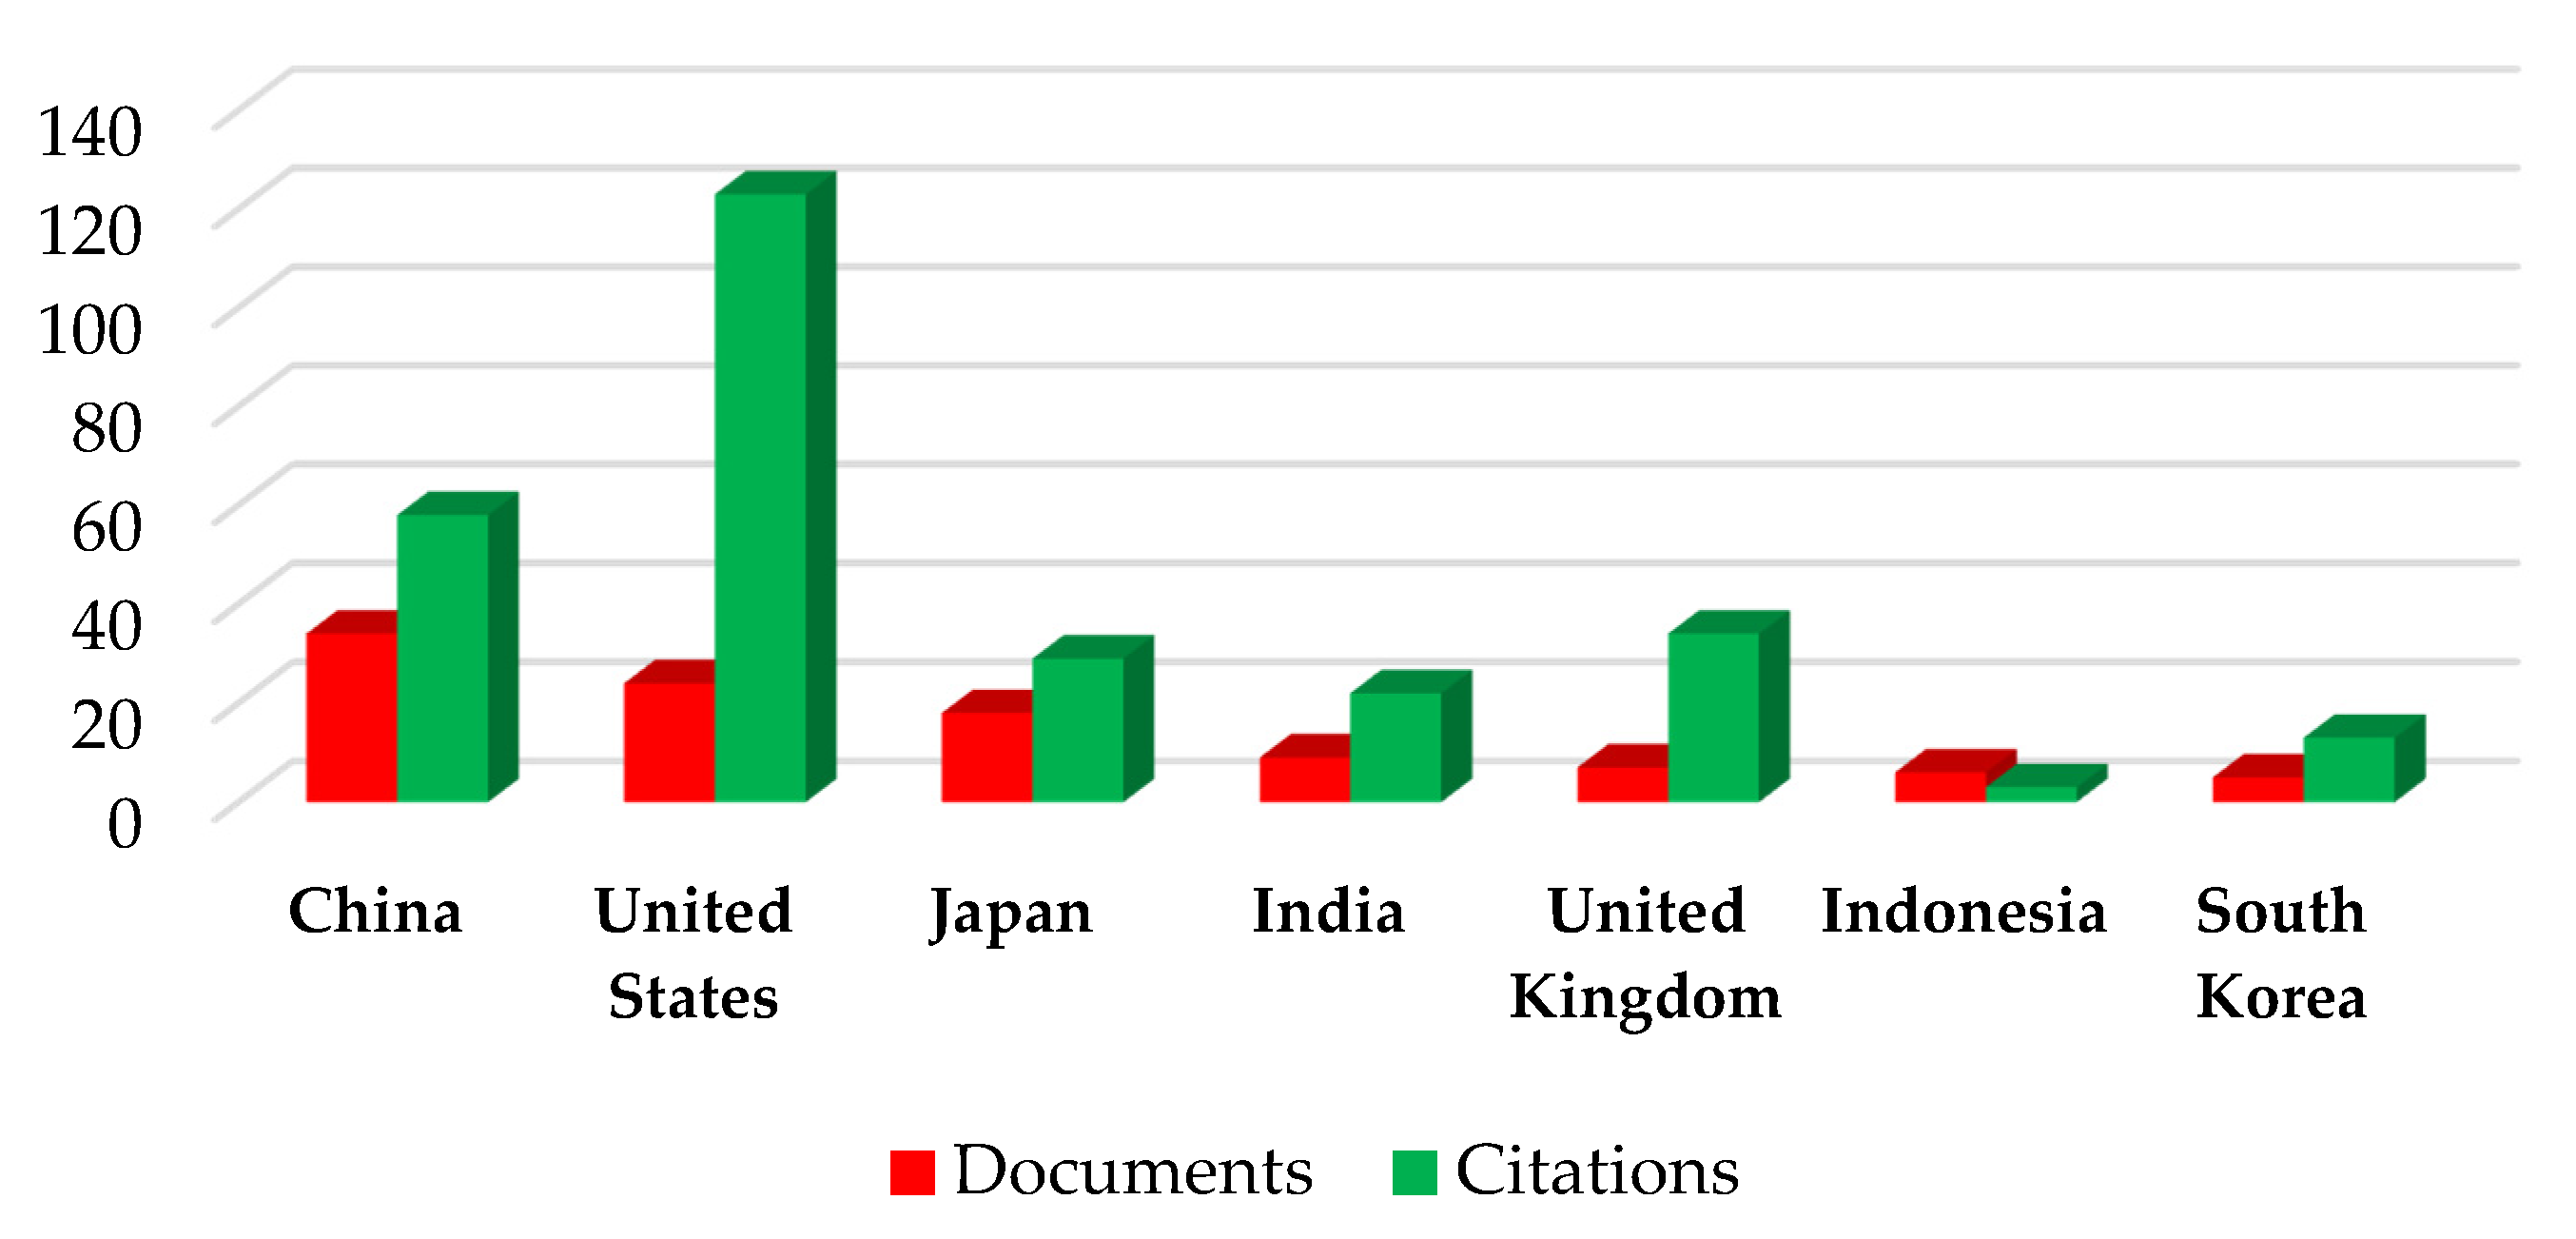
Firstly, it was found that the definition of big data continues to vary, and no exact size is defined to specify the volume of data that qualifies as big data. The concept of big data was found to be relative, and any data that cannot be handled by the traditional databases and data processing tools are classified as big data. In terms of the papers published in the area of big data, there as a significant growth in the number of articles in the last 10 years. A total of 139 relevant papers were investigated in detail, consisting of original research on big data technologies (59), reviews (23), conferences (18), and case studies (10). The analyses revealed that the keywords most frequently used in big data papers were dominated by analysis system, investigations, disaster risk management, real estate technologies, urban area, and implementation challenges. Furthermore, the publications were dominated by the journal lecture notes in computer science followed by the IOP conference series. In terms of the author-specific contributions Wang Y. and Wang J. lead the reviewed articles with 13 and 11 contributions and 24 citations each. Similarly, in country-specific analysis, China leads the reviewed articles with 34 publications followed by the United States with 24 articles; however, in terms of citations, the USA leads the table with 123 citations followed by China with 58 citations. Furthermore, in terms of the affiliated organizations of authors contributing the most to the articles reviewed, the Center for Spatial Information Science, University of Tokyo, Japan and the School of Computing and Information Sciences, Florida International University, Miami, Fl 33199, United States lead the race with six articles each, followed by the International Research Institute of Disaster Science (Irides), Tohoku University, Aoba 468-1, Aramaki, Aoba-Ku, Sendai, 980-0845, Japan with five articles.
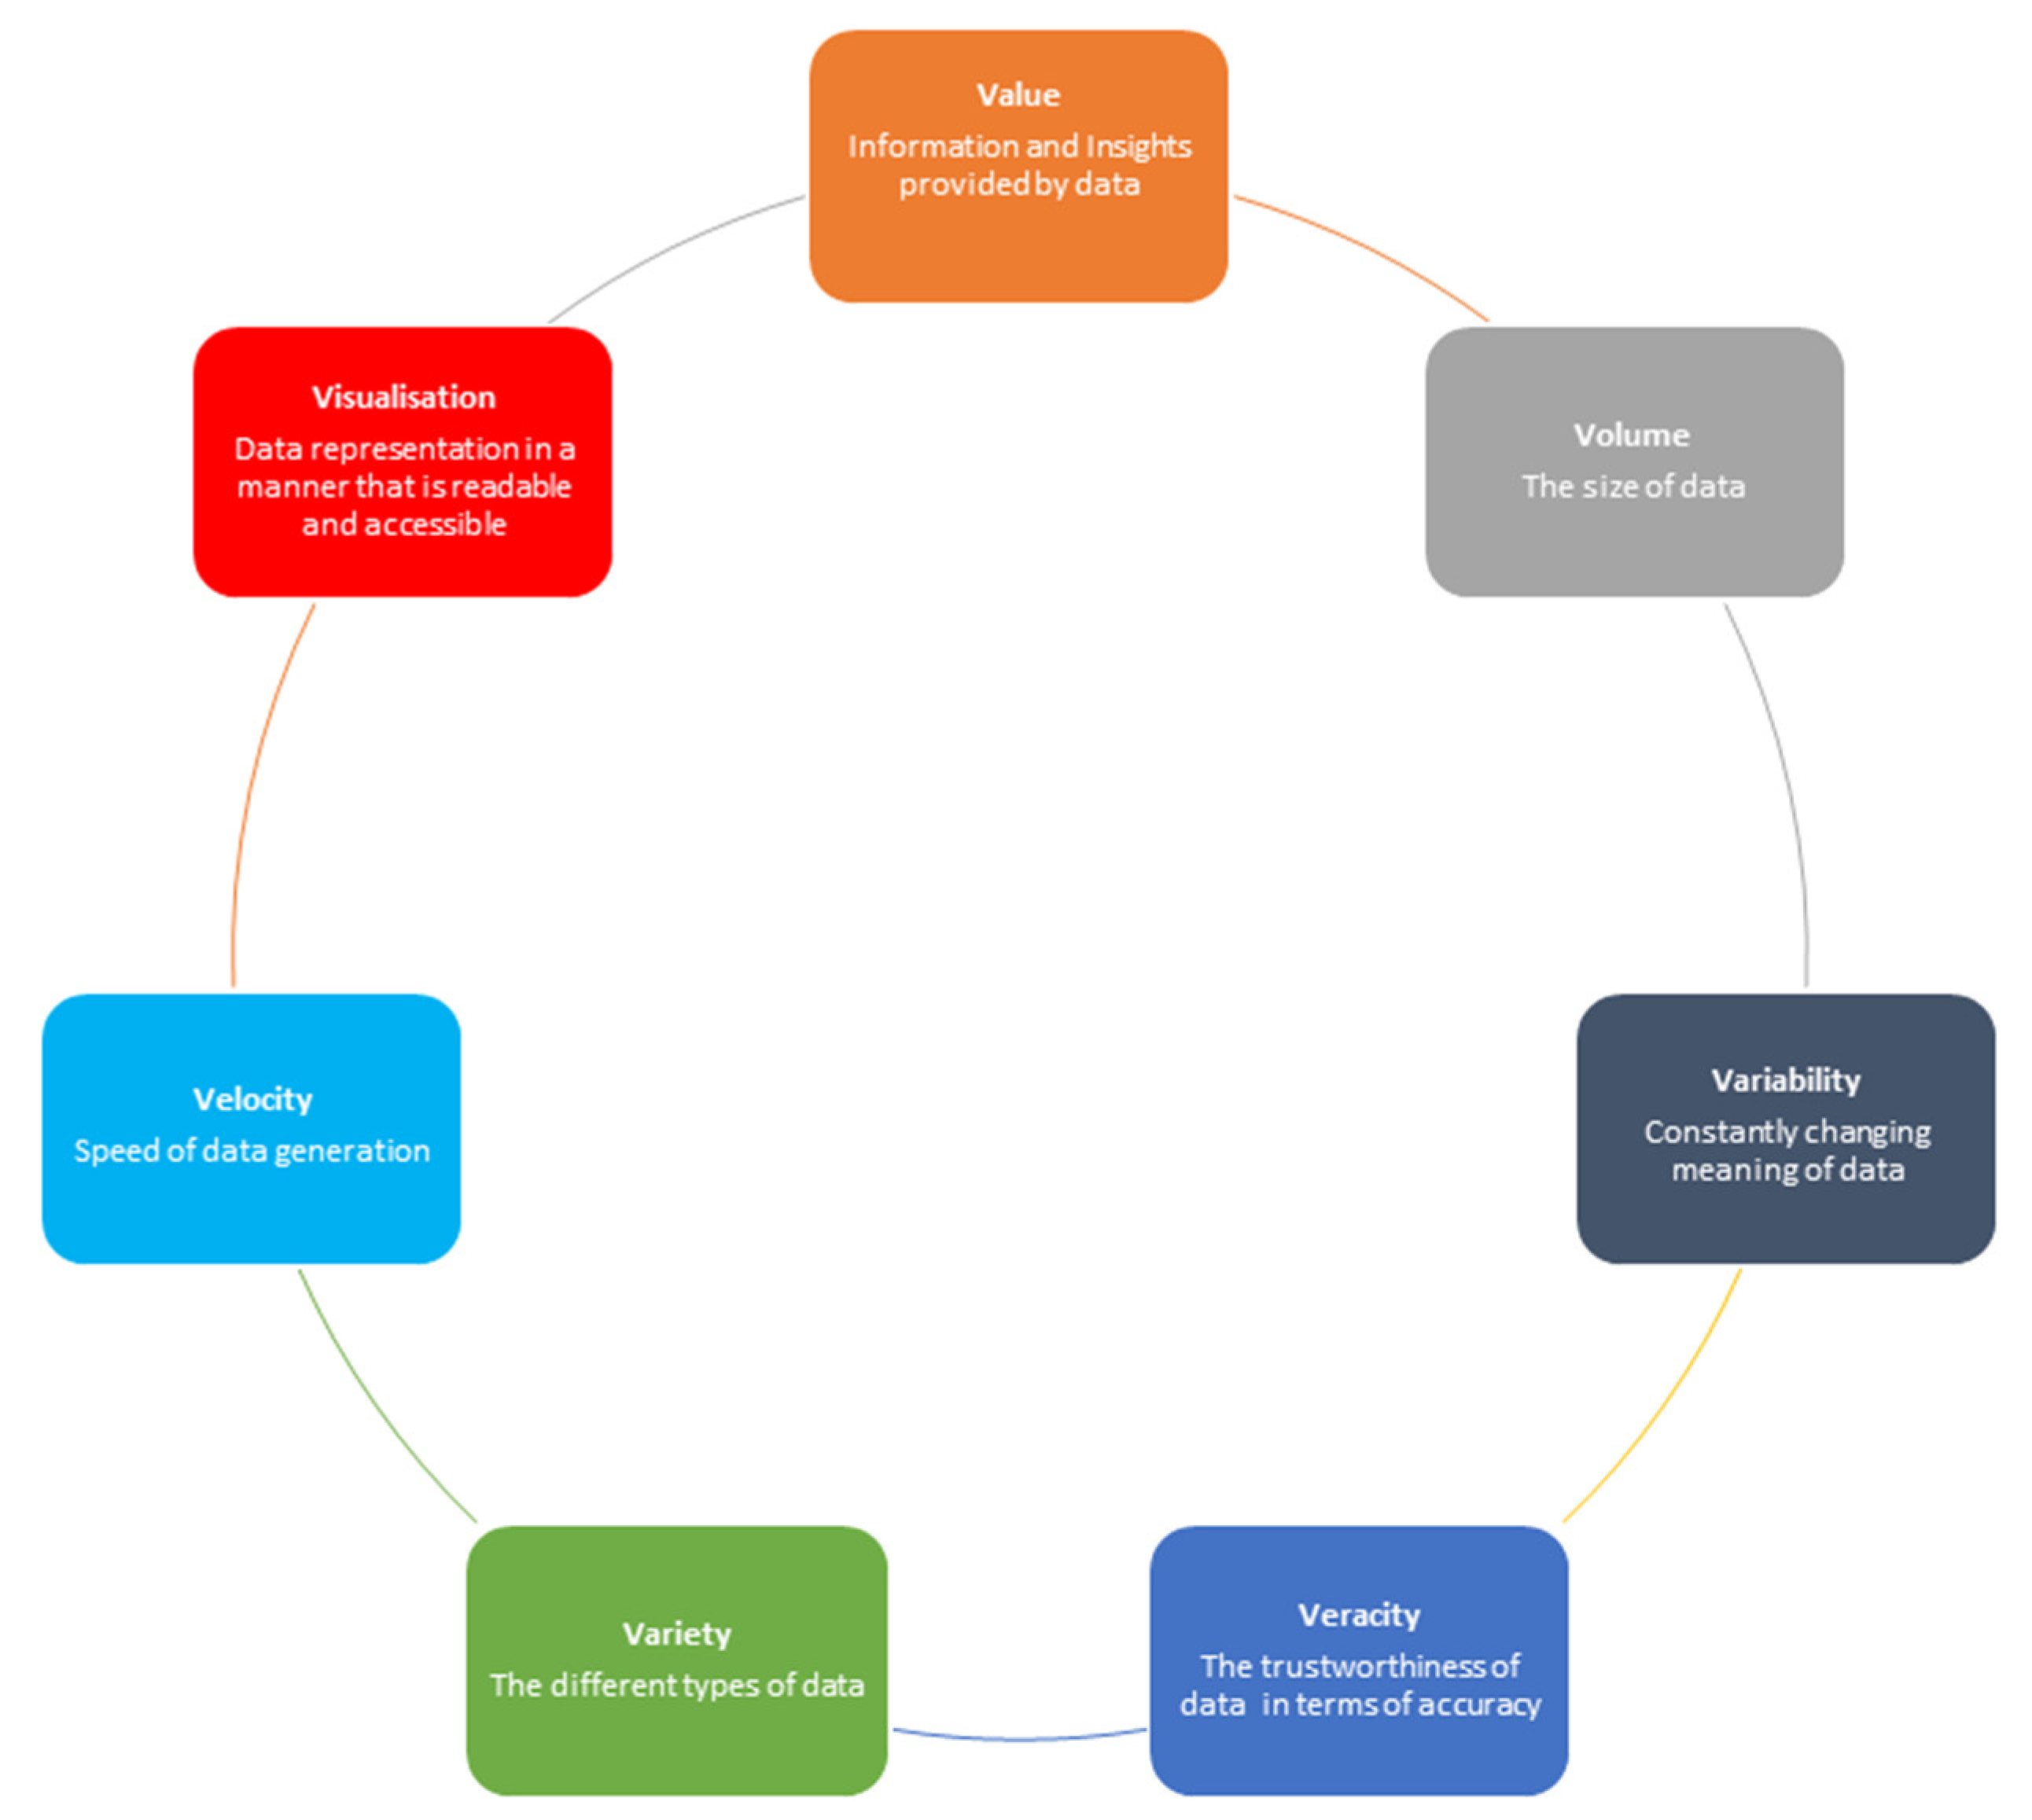
In the next step, a seven Vs model was discussed from the literature to review the distinctive features of big data, including variety, volume, velocity, value, veracity, variability, and visualization. Various tools and technologies used in each stage of the big data lifecycle were critically examined to assess their effectiveness, along with implementation examples in smart real estate and disaster management. Variety can help in disaster risk management through major machine–human interactions by extracting data from data lakes. It can help in smart real estate management through urban big data that can be converged, analyzed, and mined with depth via the Internet of things, cloud computing, and artificial intelligence technology to achieve the goal of intelligent administration of the smart real estate. The volume of big data can be used in smart real estate through e-commerce platforms and digital marketing for improving the financial sector, hotel services, culture, and tourism. For the velocity aspect, new information is shared on sites such as Facebook, Twitter, and YouTube every second that can help disaster risk managers plan for upcoming disasters, as well as know the current impacts of the occurring disasters, using efficient data extraction tools. In smart real estate, big data-assisted customer analysis and advertising architecture can be used to speed up the advertising process, approaching millions of users in single clicks, which helps in user segmentation, customer mining, and modified and personalized precise advertising delivery to achieve high advertising arrival rate, as well as superior advertising exposure/click conversion rate. In case of the value aspect of big data, disaster risk management decision-making systems can be used by disaster managers to make precise and insightful decisions. Similarly, in smart real estate, neighborhood value can be enhanced through creation of job opportunities and digital travel information to promote smart mobility. In the context of the veracity of big data, sophisticated software tools can be developed that extract meaningful information from vague, poor-quality information or misspelled words on social media to promote local real estate business and address or plan for upcoming disasters. Variability of the big data can be used to develop recommender systems for finding places with the highest wellness state or assessing the repayment capabilities of large real estate organizations. Similarly, variability related to rainfall patterns or temperature can be used to plan effectively for hydro-meteorological disasters. In the case of the visualization aspect of big data, 360 cameras, mobile and terrestrial laser scanners [74,144,191,192,193,194], and 4D advertisements can help boost the smart real estate business. Similarly, weather sensors can be used to detect ambiguities in weather that can be visualized to deal with local or global disasters.
After the seven Vs were investigated, big data analytics and the pertinent techniques including text, audio, video, and social media mining were explored. Text mining can be used to extract useful data from news, email, blogs, and survey forms through NER and RE. Cassandra NoSQL, WordNet, ConceptNet, and SenticNet can be used for text mining. In the case of smart real estate, text mining can be used to explore hotel guest experience and satisfaction and real estate investor psychology, whereas, in disaster risk management, it can be used to develop tools such as DisasterMapper that can synthesize multi-source data, as well as contribute spatial data mining, text mining, geological visualization, big data management, and distributed computing technologies in an integrated environment. Audio analytics can aid smart real estate through property auctioning, visual feeds using digital cameras, and associated audio analytics based on the conversation between the real estate agent and the prospective buyer to boost the real estate sales. In case of disaster risk management, audio analytics can help in event detection, collaborative answering, surveillance, threat detection, and telemonitoring. Video analytics can be used in disaster management for accident cases and investigations, as well as disaster area identification and damage estimation, whereas, in smart real estate, it can be used for threat detection, security enhancements, and surveillance. Similarly, social media analytics can help smart real estate through novel recommender systems for shortlisting places that interests users related to cultural heritage sites, museums, and general tourism using machine learning and artificial intelligence. Similarly, multimedia big data extracted from social media can enhance real-time detection, alert diffusion, and spreading alerts over social media for tackling disasters and their risks.
In the data analytics processes, steps including data collection, storage, filtering, cleaning, analysis, and visualization were explored along with the pertinent tools present for each step. The tools for data collection include Semantria, which is deployed through web, with the limitation of crashing on large datasets, web-deployable Opinion crawl, which cannot be used for advanced SEO audits, Open text deployed through Captiva, having rigorous requirements of configurations, and Trackur, which is costly. These tools can be used for sentiment and content analyses of the real estate stakeholders. Among the tools for data storage, NoSQL tools were explored considering four categories: column-oriented, document-oriented, graph, and key value. Apache Cassandra, HBase, MongoDB, CouchDB, Terrastore, Hive, Neo4j, AeroSpike, and Voldemort have applications in the areas of Facebook inbox search, online trading, asset tracking system, textbook management system, International Business Machines, and event processing that can be applied to both smart real estate and disaster management. Among the data filtering tools, Import.io, Parsehub, Mozenda, Content Grabber, and Octoparse were explored, which are web- and cloud-based software and are helpful for scheduling of data and visualizations using point-and-click approaches. The output data from these tools in the shape of data reports, google sheets, and CSV files can be used by both smart real estate managers and disaster risk management teams. Among the data cleaning tools, Data Cleaner, Map Reduce, Open Refine, Reifier, and Trifecta Wrangler use Hadoop frameworks and web services for duplicate value detection, missing value searches among the sheets at higher pace, and accuracy levels that can help smart real estate and disaster management detect ambiguities in the reports and address the issues accordingly. Lastly, for data visualization tools, Tableau, Microsoft Power BI, Plotly, Gephi, and Excel were explored that can help the real estate managers promote immersive visualizations and generation of user-specific charts. Other tools such as 360 cameras, VR and AR gadgets, and the associated 4D advertisements can help boost property sales, as well as prepare the users for disaster response.
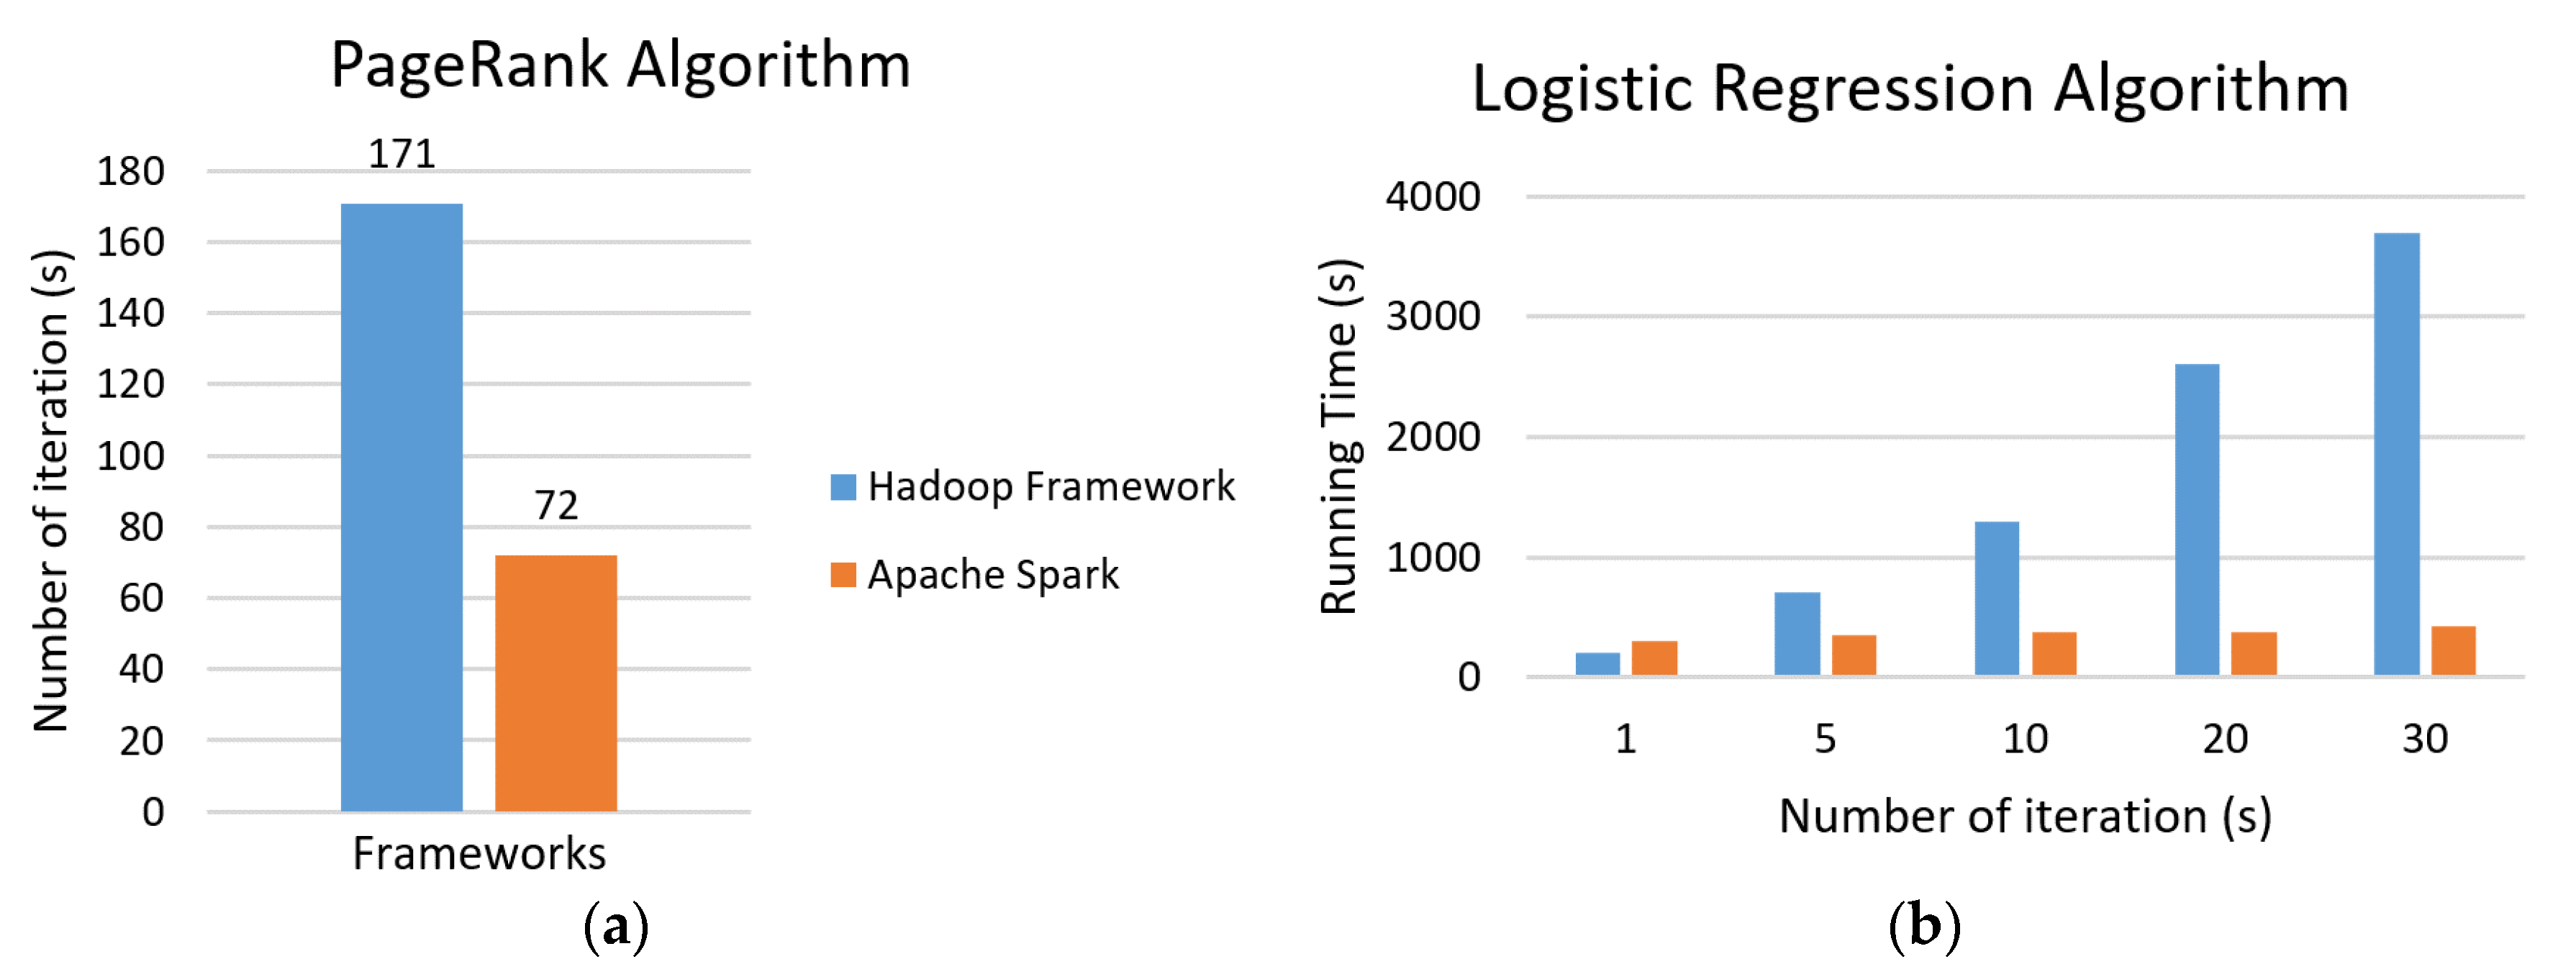
Two major frameworks for data analysis were identified which are Hadoop and Apache Spark. By conducting a critical analysis and comparison of these two frameworks, it was inferred that Apache Spark has several advantages over Hadoop which includes increased networking memory, the ability to perform real-time processing, faster speed, and increased storage capacity, which can help the real estate consumer make better and informed decisions. Similarly, disaster managers can prepare and respond in a better way to the upcoming or occurred disasters based on well-sorted and high-quality information. However, best results can be achieved by using a combination of these frameworks as discussed in Mavridis and Karatza [110] to incorporate the prominent features from both frameworks. In addition, applications of machine learning such as speech recognition, predictive algorithms, and stock market price fluctuation analyses can help real estate users and investors in making smart decisions. Furthermore, clustering, prediction and decision-making can help disaster managers cluster the events, predict upcoming disasters, and make better decisions for dealing with them.
Following the framework exploration, the four most dominant challenges encountered while dealing with big data were highlighted, including data security and privacy, heterogeneity and incompleteness, fault tolerance, and storage. To deal with the first challenges, solutions such as using authentication methods, like Kerberos, and encrypted files are suggested. Furthermore, logging of attacks or unusual behavior and secure communication through SSL and TLS can handle the privacy and security concerns. Such privacy concerns, if addressed properly, can motivate real estate users to use the smart features and technologies and incline them toward adopting more technologies, thus disrupting the traditional real estate market and moving toward a smart real estate. Similarly, privacy concerns, if addressed, can motivate people to help disaster risk management teams on a volunteer basis rather than sneakily analyzing social media stuff without approval. To deal with heterogeneity and incompleteness, data imputation for missing values, building learning models, and filling data with the most frequent values are some solutions. Similarly, to tackle fault tolerance, dividing computations into sub-tasks and checkpoint applications for recursive tasks are potential solutions. Lastly, to tackle the challenge of storage, SDD and PCM can be used.
Finally, in terms of the applications of big data, it is evident that, in almost all fields, ranging from technology to healthcare, education, agriculture, business, and even social life, big data plays an important role. Since data are generated every second, it is important to know how to use them well. In healthcare settings, patient information and medical outcomes are recorded on a regular basis, which add to the generation of data in the healthcare sector. Arranging and understanding these data can help in identifying key medical procedures, their outcomes, and possibly ways in which patient outcomes could be enhanced through certain medicines. Similarly, education, business, technology, and agriculture can all benefit from data gathered by these fields. Using existing data in a positive manner can pave a way forward for each field. Something that is already known and exists in databases in an organized manner can help people around the world and ensure that big data could be put to good use. For example, recently, big data analytics was successfully integrated for disaster prediction and response activities. Big data consisting of weather reports, past flood events, historic data, and social media posts can be gathered to analyze various trends and identify the conditioning factors leading to a disaster. These data can also be examined to determine the most disaster-prone regions by generating susceptibility maps. Furthermore, these data can be used to train a machine learning model, which could make predictions about the occurrence of disasters and detect the effected regions from a given test image. The use of social media is a huge source of generating data. These data are already being used for various marketing researches and the analysis of human psychology and behaviors. If these data are used with safety and put to sensible use, there is a chance that every field could benefit from the inexhaustible data sources that exist on the worldwide web. Similarly, for smart real estate management, big data has huge potential in the areas of technology integration, technology adoption, smart homes and smart building integration, customer management, facilities management, and others. As such, the customers or users can enjoy the personalization, cross-matching, property information, and buyer demand analysis with the help of big data resources such as customer data surveys, feedback analyses, data warehouses, buyer click patterns, predictive analytics tools, access to government information, and social media analytics. The owners, agents, or sellers can benefit from building performance databases, property value analysis, resident, strata, and enterprise management, online transactions, and potential clients/business identification using big data resources of building maintenance data, occupant data, government reports, local contracts, property insights, analytics tools, customer surveys, and demand analysis. Similarly, the government and regulatory authorities can provide more public services, detect frauds, and address user and citizen privacy and security issues through linkages of the central databases to ensure provision of services in the smart real estate set-up.
For disaster risk management, the four stages of prevention, preparedness, response, and recovery can be aided through big data utilizations. As such, big data can help in risk assessment and mitigation, disaster prediction, tracking and detection, establishing warning systems, damage assessment, damage estimation, landmark (roads, bridges, buildings) detection, post-disaster communications establishment, digital humanitarian relief missions, and sentiment analysis in the disaster recovery process to help mitigate or respond to natural disasters such as earthquakes, hurricanes, bushfires, volcanic eruptions, tsunamis, floods, and others. Tools and technologies such as GPS, LiDAR, IoT, stepped frequency microwave radiometer (SFMR), satellite imagery, and drone-based data collection can aid the disaster risk management processes. In addition, the fields of smart real estate and disaster management can be integrated where smart big data from real estate can help the disaster risk management team prepare and respond to the disasters. As such, the data received from building occupants, building integration, maintenance, and facility management can be shared with the disaster management teams who can integrate with the central systems to better respond to disasters or emergencies.
This paper provides a detailed analysis of big data concepts, its tools, and techniques, data analytics processes, and tools, along with their applications in smart real estate and disaster management, which can help in defining the research agenda in the two main domains of smart real estate and disaster management and move toward an integrated management system. It has implications for creating a win–win situation in the smart real estate. Specifically, it can help smart real estate managers, agents, and sellers attract more customers toward the properties through immersive visualizations, thus boosting the business and sales. The customers, on the other hand, can make better and regret-free decisions based on high-quality, transparent, and immersive information, thus raising their satisfaction levels. Similarly, the government and regulatory authorities can provide better citizen services, ensure safety and privacy of citizens, and detect frauds. Similarly, the proposed framework for disaster risk management can help the disaster risk managers plan for, prepare for, and respond to upcoming disasters through refined, integrated, and well-presented big data. In addition, the current study has implications for research where the integration of the two fields, i.e., smart real estate and disaster management, can be explored from a new integrated perspective, while conceptual and field-specific frameworks can be developed for realizing an integrated, holistic, and all-inclusive smart city dream.
The limitation of the paper is its focus on two domains; however, future studies can also focus on the application of big data in construction management and other disciplines. This paper reviewed 139 articles published between 2010 and 2020, but further articles from before 2010, as well as articles focusing on smart cities, can be reviewed in the future to develop a holistic city management plan. Among the other limitations, a focus on only two types of frameworks (Hadoop and Apache Spark) and non-focus on other digital disruptive technologies such as the Big9 technologies discussed by Ullah et al. [18] are worth mentioning. Furthermore, the current study based its review on the articles retrieved through a specific sampling method, which may not be all-inclusive and exhaustive; thus, future studies repeated with the same keywords at different times may yield different results.

5. Conclusions

Big data became the center of research in the last two decades due to the significant rise in the generation of data from various sources such as mobile phones, computers, and GPS sensors. Various tools and techniques such as web scraping, data cleaning, and filtering are applied to big databases to extract useful information which is then used to visualize and draw results from unstructured data. This paper reviewed the existing concept of big data and the tools available for big data analytics, along with discussing the challenges that exist in managing big data and their possible solutions. Furthermore, the applications of big data in two novel and integrated fields of smart real estate and disaster management were explored. The detailed literature search showed that big data papers are following an increasing trend, growing tremendously from fewer than 100 in 2010 to more than 1200 in 2019. Furthermore, in terms of the most repeated keywords in the big data papers in the last decade, data analytics, data solutions, datasets, frameworks, visualization, algorithms, problems, decision-making, and machine learning were the most common ones. In the systematic review, distinctive features of big data including the seven Vs of big data were highlighted, including variety, volume, velocity, value, veracity, variability, and visualization, along with their uses in the smart real estate and disaster sectors. Similarly, in terms of data analytics, the most common sub-classes include text analytics, audio analytics, video analytics, and social media analytics. The methods for analyzing data from these classes include the process of data collection, storage, filtering, cleaning, analysis, and visualizations. Similarly, security and privacy, heterogeneity and incompleteness, fault tolerance, and storage are the top challenges faced by big data managers, which can be tackled using authentication methods, like Kerberos, and encrypted files, logging of attacks or unusual behavior and secure communication through SSL and TLS, data imputation for missing values, building learning models and filling the data with most frequent values, dividing computations into sub-tasks, and checkpoint applications for recursive tasks, and using SDD and PCM, respectively.
In terms of the frameworks for data analysis, Hadoop and Apache Spark are the two most used frameworks. However, for better results, it is ideal and recommended to use both simultaneously to capture the holistic essence. Furthermore, the use of machine learning in big data analytics sounds really promising, especially due to its applications in disaster risk management and rescue services. Using its modules of supervised, unsupervised, and reinforced learning, machine learning holds the key to linking big data to other fields. With the continuous rise in technology, it is quite possible that machine learning approaches will take centerstage in big data management and analysis. The way forward is, therefore, to explore newer algorithms and software systems which can be employed for sorting, managing, analyzing, and storing big data in a manner that could be useful.
For specific applications in smart real estate and disaster management, big data can help in disrupting the traditional real estate industry and pave the way toward smart real estate. This can help reduce real estate consumer regrets, as well as improve the relationships between the three main stakeholders: buyers, sellers, and government agencies. The customers can benefit from big data applications such as personalization, cross-matching, and property information. Similarly, the sellers can benefit from building performance database management, property value analysis, resident, strata, and enterprise management, online transaction, and potential clients/business identification. Furthermore, the government and regulatory agencies can provide more security, ensure privacy concerns are addressed, detect fraud, and provide more public services to promote smart real estate. A positive step in this direction is the adoption of big data by real estate organizations such as Airbnb, BuildZoom, ArchiBus, CoreLogic, Accenture, Truss, SmartList, and others around the world. Big data tools and resources such as customer data surveys, feedback analyses, data warehouses, buyer click patterns, predictive analytics, social media analytics, building maintenance data, occupant data, government reports, local contracts, property insights, drones, artificial intelligence-powered systems, and smart processing systems can help transform the real estate sector into smart real estate. Similarly, for disaster management, the application of big data in the four stages of disaster risk management, i.e., prevention, preparedness, response, and recover, can help in risk assessment and mitigation, disaster prediction, tracking and detection of damages, warning system implementation, damage assessment, damage estimation, landmark (roads, bridges, buildings) detection, post-disaster communications, digital humanitarian relief missions, and sentiment analyses. Several tools with the potential of generating and/or processing big data such as real-time locating systems [195,196], sensor web data, satellite imagery, simulations, IoT, LiDAR [75,76,191,197,198], 3D modeling [75,199], UAV Imagery, social media analytics, and crowdsourced text data can help to plan for disasters and mitigate them in the case of occurrence.
This study can be extended in the future to include research questions about integrations of various big data technologies and analytics tools in field-specific contexts such as data lakes and fast data. Furthermore, this paper investigated the four big data analytics processes which can be extended to explore data ingestion in the future. The scope of the paper can be enhanced to answer questions such as the most significant challenges posed by big data in specific fields such as real estate and property management or disaster management, and how technological advancements are being used to tackle these challenges. Further applications of big data in smart real estate in the context of technology readiness by the businesses, industry preparedness for big data disruptions, and adoption and implementation barriers and benefits can be explored in future studies. Similarly, in disaster risk management contexts, applications of big data using drones, UAVs, and satellites for addressing bushfires, floods, and emergency response systems can also be explored in detail. Apart from automated tools, some programming languages like python and R can also be identified, and their use for big data analytics can be investigated in the light of recent research. Furthermore, this paper discussed widely used and popular tools like Tableau and Excel for big data analytics; thus, future studies can explore some less conventional tools to assess their performance outcomes.

Author Contributions

Conceptualization, H.S.M., F.U. and S.Q.; methodology, H.S.M., F.U., S.Q. and S.S.; software, F.U. and S.Q.; validation, H.S.M., S.Q. and F.U.; formal analysis, H.S.M., F.U., and S.Q.; investigation, H.S.M., S.Q., F.U. and S.S.; resources, S.S.; data curation, F.U.; writing—original draft preparation, H.S.M., F.U., and S.Q.; writing—review and editing, F.U. and S.S.; visualization, F.U. and S.Q.; supervision, S.S. and F.U.; project administration, H.S.M., S.Q., F.U. and S.S.; funding acquisition, S.S. All authors have read and agree to the published version of the manuscript.

Funding

This research received no external funding.

Conflicts of Interest

The authors declare no conflicts of interest.

References

  1. Shirowzhan, S.; Sepasgozar, S.M.; Li, H.; Trinder, J.; Tang, P. Comparative analysis of machine learning and point-based algorithms for detecting 3D changes in buildings over time using bi-temporal lidar data. Autom. Constr. 2019, 105, 102841. [Google Scholar] [CrossRef]
  2. Ahmad, I. How Much Data Is Generated Every Minute? Available online: https://www.socialmediatoday.com/news/how-much-data-is-generated-every-minute-infographic-1/525692/ (accessed on 3 February 2020).
  3. Padhi, B.K.; Nayak, S.; Biswal, B. Machine learning for big data processing: A literature review. Int. J. Innov. Res. Technol. 2018, 5, 359–368. [Google Scholar]
  4. Lynkova, D. 39+ Big Data Statistics for 2020; LEFTRONIC: San Francisco, CA, USA, 2019. [Google Scholar]
  5. Fang, H. Managing data lakes in big data era: What’s a data lake and why has it became popular in data management ecosystem. In Proceedings of the 2015 IEEE International Conference on Cyber Technology in Automation, Control, and Intelligent Systems (CYBER), Shenyang, China, 8–12 June 2015. [Google Scholar]
  6. Sagiroglu, S.; Sinanc, D. Big data: A review. In Proceedings of the 2013 International Conference on Collaboration Technologies and Systems (CTS), San Diego, CA, USA, 20–24 May 2013. [Google Scholar]
  7. Chen, C.P.; Zhang, C.-Y. Data-intensive applications, challenges, techniques and technologies: A survey on big data. Inf. Sci. 2014, 275, 314–347. [Google Scholar] [CrossRef]
  8. Agrawal, R.; Kadadi, A.; Dai, X.; Andres, F. Challenges and opportunities with big data visualization. In Proceedings of the 7th International Conference on Management of Computational and Collective IntElligence in Digital EcoSystems, Caraguatatuba, Brazil, 25–29 October 2015. [Google Scholar]
  9. Procopio, M.; Scheidegger, C.; Wu, E.; Chang, R. Selective wander join: Fast progressive visualizations for data joins. Informatics 2019, 6, 14. [Google Scholar] [CrossRef] [Green Version]
  10. Roy, R.; Paul, A.; Bhimjyani, P.; Dey, N.; Ganguly, D.; Das, A.K.; Saha, S. A short review on applications of big data analytics. In Emerging Technology in Modelling and Graphics; Springer: Berlin, Germany, 2020; pp. 265–278. [Google Scholar]
  11. Baseman, J.G.; Revere, D.; Painter, I. Big data in the era of health information exchanges: Challenges and opportunities for public health. Informatics 2017, 4, 39. [Google Scholar] [CrossRef] [Green Version]
  12. Alshboul, Y.; Nepali, R.; Wang, Y. Big data lifecycle: Threats and security model. In Proceedings of the 21st Americas Conference on Information Systems, Fajardo, Puerto Rico, 13–15 August 2015. [Google Scholar]
  13. Stefanova, S.; Draganov, I. Big Data Life Cycle in Modern Web Systems. Available online: http://conf.uni-ruse.bg/bg/docs/cp18/3.2/3.2-15.pdf (accessed on 21 March 2020).
  14. Wielki, J. Implementation of the big data concept in organizations-possibilities, impediments and challenges. In Proceedings of the 2013 Federated Conference on Computer Science and Information Systems, Kraków, Poland, 8–11 September 2013. [Google Scholar]
  15. Acharjya, D.P.; Ahmed, K. A survey on big data analytics: Challenges, open research issues and tools. Int. J. Adv. Comput. Sci. Appl. 2016, 7, 511–518. [Google Scholar]
  16. Dey, N.; Hassanien, A.E.; Bhatt, C.; Ashour, A.; Satapathy, S.C. Internet of Things and Big Data Analytics toward Next-Generation Intelligence; Springer: Berlin, Germany, 2018. [Google Scholar]
  17. Ruiz, Z.; Salvador, J.; Garcia-Rodriguez, J. A survey of machine learning methods for big data. In Biomedical Applications Based on Natural and Artificial Computing; Springer: Berlin, Germany, 2017. [Google Scholar]
  18. Ullah, F.; Sepasgozar, S.M.; Wang, C. A systematic review of smart real estate technology: Drivers of, and barriers to, the use of digital disruptive technologies and online platforms. Sustainability 2018, 10, 3142. [Google Scholar] [CrossRef] [Green Version]
  19. Munawar, H.S.; Hammad, A.; Ullah, F.; Ali, T.H. After the flood: A novel application of image processing and machine learning for post-flood disaster management. In Proceedings of the International Conference on Sustainable Development in Civil Engineering, MUET, Jamshoro, Pakistan, 5–7 December 2019. [Google Scholar]
  20. Ullah, F.; Sepasgozar, P.S.; Ali, T.H. Real estate stakeholders technology acceptance model (RESTAM): User-focused Big9 disruptive technologies for smart real estate management. In Proceedings of the 2nd International Conference on Sustainable Development in Civil Engineering (ICSDC 2019), Jamshoro, Pakistan, 5–7 December 2019. [Google Scholar]
  21. Pan, Y.; Tian, Y.; Liu, X.; Gu, D.; Hua, G. Urban big data and the development of city intelligence. Engineering 2016, 2, 171–178. [Google Scholar] [CrossRef] [Green Version]
  22. Kelman, I. Lost for words amongst disaster risk science vocabulary? Int. J. Disaster Risk Sci. 2018, 9, 281–291. [Google Scholar] [CrossRef] [Green Version]
  23. Aitsi-Selmi, A.; Murray, V.; Wannous, C.; Dickinson, C.; Johnston, D.; Kawasaki, A.; Stevance, A.-S.; Yeung, T. Reflections on a science and technology agenda for 21st century disaster risk reduction. Int. J. Disaster Risk Sci. 2016, 7, 1–29. [Google Scholar] [CrossRef] [Green Version]
  24. Tanner, T.; Surminski, S.; Wilkinson, E.; Reid, R.; Rentschler, J.; Rajput, S. The Triple Dividend of Resilience: Realising Development Goals through the Multiple Benefits of Disaster Risk Management. Available online: https://eprints.soas.ac.uk/31372/1/The_Triple_Dividend_of_Resilience.pdf (accessed on 21 March 2020).
  25. Yang, C.; Su, G.; Chen, J. Using big data to enhance crisis response and disaster resilience for a smart city. In Proceedings of the 2017 IEEE 2nd International Conference on Big Data Analysis (ICBDA), Beijing, China, 10–12 March 2017. [Google Scholar]
  26. Cheng, M.-Y.; Chiu, K.-C.; Hsieh, Y.-M.; Yang, I.-T.; Chou, J.-S.; Wu, Y.-W. BIM integrated smart monitoring technique for building fire prevention and disaster relief. Autom. Constr. 2017, 84, 14–30. [Google Scholar] [CrossRef]
  27. Yang, T.; Xie, J.; Li, G.; Mou, N.; Li, Z.; Tian, C.; Zhao, J. Social Media Big Data Mining and Spatio-Temporal Analysis on Public Emotions for Disaster Mitigation. ISPRS Int. J. Geo Inf. 2019, 8, 29. [Google Scholar] [CrossRef] [Green Version]
  28. Ofli, F.; Meier, P.; Imran, M.; Castillo, C.; Tuia, D.; Rey, N.; Briant, J.; Millet, P.; Reinhard, F.; Parkan, M. Combining human computing and machine learning to make sense of big (aerial) data for disaster response. Big Data 2016, 4, 47–59. [Google Scholar] [CrossRef] [PubMed] [Green Version]
  29. Ragini, J.R.; Anand, P.R.; Bhaskar, V. Big data analytics for disaster response and recovery through sentiment analysis. Int. J. Inf. Manag. 2018, 42, 13–24. [Google Scholar] [CrossRef]
  30. Shah, S.A.; Seker, D.Z.; Rathore, M.M.; Hameed, S.; Yahia, S.B.; Draheim, D. Towards disaster resilient smart cities: Can Internet of Things and big data analytics be the game changers? IEEE Access 2019, 7, 91885–91903. [Google Scholar] [CrossRef]
  31. Akter, S.; Wamba, S.F. Big data and disaster management: A systematic review and agenda for future research. Ann. Oper. Res. 2019, 283, 939–959. [Google Scholar] [CrossRef] [Green Version]
  32. Sepasgozar, S.M.; Karimi, R.; Shirowzhan, S.; Mojtahedi, M.; Ebrahimzadeh, S.; McCarthy, D. Delay causes and emerging digital tools: A novel model of delay analysis, including integrated project delivery and PMBOK. Buildings 2019, 9, 191. [Google Scholar] [CrossRef] [Green Version]
  33. Zhong, B.; Wu, H.; Li, H.; Sepasgozar, S.; Luo, H.; He, L. A scientometric analysis and critical review of construction related ontology research. Autom. Constr. 2019, 101, 17–31. [Google Scholar] [CrossRef]
  34. Sepasgozar, S.M.; Li, H.; Shirowzhan, S.; Tam, V.W. Methods for monitoring construction off-road vehicle emissions: A critical review for identifying deficiencies and directions. Environ. Sci. Pollut. Res. 2019, 26, 15779–15794. [Google Scholar] [CrossRef]
  35. Sepasgozar, S.M.; Blair, J. Measuring non-road diesel emissions in the construction industry: A synopsis of the literature. Int. J. Constr. Manag. 2019, 1–16. [Google Scholar] [CrossRef]
  36. Felli, F.; Liu, C.; Ullah, F.; Sepasgozar, S. Implementation of 360 videos and mobile laser measurement technologies for immersive visualisation of real estate & properties. In Proceedings of the 42nd AUBEA Conference, Curtin, Australia, 26–28 December 2018. [Google Scholar]
  37. Martinez-Mosquera, D.; Navarrete, R.; Lujan-Mora, S. Modeling and management big data in databases—A systematic literature review. Sustainability 2020, 12, 634. [Google Scholar] [CrossRef] [Green Version]
  38. Zikopoulos, P.; Eaton, C. Understanding Big Data: Analytics for Enterprise Class Hadoop and Streaming Data; McGraw-Hill Osborne Media: New York, NY, USA, 2011. [Google Scholar]
  39. Beakta, R. Big data and hadoop: A review paper. Int. J. Comput. Sci. Inf. Technol. 2015, 2, 13–15. [Google Scholar]
  40. Hashem, I.A.T.; Yaqoob, I.; Anuar, N.B.; Mokhtar, S.; Gani, A.; Khan, S.U. The rise of “big data” on cloud computing: Review and open research issues. Inf. Syst. 2015, 47, 98–115. [Google Scholar] [CrossRef]
  41. Seddon, J.J.; Currie, W.L. A model for unpacking big data analytics in high-frequency trading. J. Bus. Res. 2017, 70, 300–307. [Google Scholar] [CrossRef]
  42. Gandomi, A.; Haider, M. Beyond the hype: Big data concepts, methods, and analytics. Int. J. Inf. Manag. 2015, 35, 137–144. [Google Scholar] [CrossRef] [Green Version]
  43. Elgendy, N.; Elragal, A. Big data analytics: A literature review paper. In Proceedings of the Industrial Conference on Data Mining, Hamburg, Germany, 15–19 July 2014. [Google Scholar]
  44. Uddin, M.F.; Gupta, N. Seven V’s of big data understanding big data to extract value. In Proceedings of the 2014 Zone 1 Conference of the American Society for Engineering Education, Bridgeport, CT, USA, 3–5 April 2014. [Google Scholar]
  45. Hai, R.; Geisler, S.; Quix, C. Constance: An intelligent data lake system. In Proceedings of the 2016 International Conference on Management of Data, San Francisco, CA, USA, June 26–July 1 2016. [Google Scholar]
  46. Yu, M.; Yang, C.; Li, Y. Big data in natural disaster management: A review. Geosciences 2018, 8, 165. [Google Scholar] [CrossRef] [Green Version]
  47. Wang, J.; Zelenyuk, A.; Imre, D.; Mueller, K. Big data management with incremental K-means trees–GPU-accelerated construction and visualization. Informatics 2017, 4, 24. [Google Scholar] [CrossRef] [Green Version]
  48. Du, D.; Li, A.; Zhang, L. Survey on the applications of big data in Chinese real estate enterprise. Procedia Comput. Sci. 2014, 30, 24–33. [Google Scholar] [CrossRef] [Green Version]
  49. Huang, Q.; Cervone, G.; Jing, D.; Chang, C. DisasterMapper: A CyberGIS framework for disaster management using social media data. In Proceedings of the 4th International ACM SIGSPATIAL Workshop on Analytics for Big Geospatial Data, Seattle, WA, USA, 3 November 2015. [Google Scholar]
  50. Cheng, X.; Yuan, M.; Xu, L.; Zhang, T.; Jia, Y.; Cheng, C.; Chen, W. Big data assisted customer analysis and advertising architecture for real estate. In Proceedings of the 2016 16th International Symposium on Communications and Information Technologies (ISCIT), Qingdao, China, 26–28 September 2016. [Google Scholar]
  51. Barkham, R.; Bokhari, S.; Saiz, A. Urban Big Data: City Management and Real Estate Markets; GovLab Digest: New York, NY, USA, 2018. [Google Scholar]
  52. Winson-Geideman, K.; Krause, A. Transformations in real estate research: The big data revolution. In Proceedings of the 22nd Annual Pacific-Rim Real Estate Society Conference, Queensland, Australia, 17–20 January 2016. [Google Scholar]
  53. Lacuesta, R.; Garcia, L.; García-Magariño, I.; Lloret, J. System to recommend the best place to live based on wellness state of the user employing the heart rate variability. IEEE Access 2017, 5, 10594–10604. [Google Scholar] [CrossRef]
  54. Lee, S.; Byrne, P. The impact of portfolio size on the variability of the terminal wealth of real estate funds. Brief. Real Estate Financ. Int. J. 2002, 1, 319–330. [Google Scholar] [CrossRef]
  55. Papadopoulos, T.; Gunasekaran, A.; Dubey, R.; Altay, N.; Childe, S.J.; Fosso-Wamba, S. The role of Big Data in explaining disaster resilience in supply chains for sustainability. J. Clean. Prod. 2017, 142, 1108–1118. [Google Scholar] [CrossRef] [Green Version]
  56. Ready, M.; Dwyer, T.; Haga, J.H. Immersive Visualisation of Big Data for River Disaster Management. Available online: https://groups.inf.ed.ac.uk/vishub/immersiveanalytics/papers/IA_1538-paper.pdf (accessed on 21 March 2020).
  57. Ji-fan Ren, S.; Wamba, S.F.; Akter, S.; Dubey, R.; Childe, S.J. Modelling quality dynamics, business value and firm performance in a big data analytics environment. Int. J. Prod. Res. 2017, 55, 5011–5026. [Google Scholar] [CrossRef] [Green Version]
  58. Maroufkhani, P.; Wagner, R.; Ismail, W.K.W.; Baroto, M.B.; Nourani, M. Big data analytics and firm performance: A systematic review. Information 2019, 10, 226. [Google Scholar] [CrossRef] [Green Version]
  59. Pouyanfar, S.; Yang, Y.; Chen, S.-C.; Shyu, M.-L.; Iyengar, S. Multimedia big data analytics: A survey. ACM Comput. Surv. CSUR 2018, 51, 1–34. [Google Scholar] [CrossRef]
  60. Constantiou, I.D.; Kallinikos, J. New games, new rules: Big data and the changing context of strategy. J. Inf. Technol. 2015, 30, 44–57. [Google Scholar] [CrossRef] [Green Version]
  61. Gillon, K.; Aral, S.; Lin, C.-Y.; Mithas, S.; Zozulia, M. Business analytics: Radical shift or incremental change? Commun. Assoc. Inf. Syst. 2014, 34, 13. [Google Scholar] [CrossRef]
  62. Ge, M.; Dohnal, V. Quality management in big data. Informatics 2018, 5, 19. [Google Scholar] [CrossRef] [Green Version]
  63. Chen, H.; Chiang, R.H.; Storey, V.C. Business intelligence and analytics: From big data to big impact. MIS Q. 2012, 36, 1165–1188. [Google Scholar] [CrossRef]
  64. Liu, Y. Big data and predictive business analytics. J. Bus. Forecast. 2014, 33, 40. [Google Scholar]
  65. Khan, Z.; Vorley, T. Big data text analytics: An enabler of knowledge management. J. Knowl. Manag. 2017, 21. [Google Scholar] [CrossRef]
  66. Jiang, J. Information extraction from text. In Mining Text Data; Springer: Berlin, Germany, 2012; pp. 11–41. [Google Scholar]
  67. Piskorski, J.; Yangarber, R. Information extraction: Past, present and future. In Multi-Source, Multilingual Information Extraction and Summarization; Springer: Berlin, Germany, 2013; pp. 23–49. [Google Scholar]
  68. Gambhir, M.; Gupta, V. Recent automatic text summarization techniques: A survey. Artif. Intell. Rev. 2017, 47, 1–66. [Google Scholar] [CrossRef]
  69. Alguliev, R.M.; Aliguliyev, R.M.; Isazade, N.R. Multiple documents summarization based on evolutionary optimization algorithm. Expert Syst. Appl. 2013, 40, 1675–1689. [Google Scholar] [CrossRef]
  70. Ouyang, Y.; Li, W.; Zhang, R.; Li, S.; Lu, Q. A progressive sentence selection strategy for document summarization. Inf. Process. Manag. 2013, 49, 213–221. [Google Scholar] [CrossRef]
  71. Dragoni, M.; Tettamanzi, A.G.; da Costa Pereira, C. A fuzzy system for concept-level sentiment analysis. In Semantic Web Evaluation Challenge; Springer: Berlin, Germany, 2014. [Google Scholar]
  72. Xiang, Z.; Schwartz, Z.; Gerdes, J.H., Jr.; Uysal, M. What can big data and text analytics tell us about hotel guest experience and satisfaction? Int. J. Hosp. Manag. 2015, 44, 120–130. [Google Scholar] [CrossRef]
  73. Jandl, J.-O. Information Processing and Stock Market Volatility-Evidence from Real Estate Investment Trusts. Available online: https://aisel.aisnet.org/amcis2015/BizAnalytics/GeneralPresentations/42/ (accessed on 21 March 2020).
  74. Shirowzhan, S.; Sepasgozar, S.; Liu, C. Monitoring physical progress of indoor buildings using mobile and terrestrial point clouds. In Proceedings of the Construction Research Congress 2018, New Orleans, LA, USA, 2–4 April 2018. [Google Scholar]
  75. Shirowzhan, S.; Sepasgozar, S.M.E.; Li, H.; Trinder, J. Spatial compactness metrics and Constrained Voxel Automata development for analyzing 3D densification and applying to point clouds: A synthetic review. Autom. Constr. 2018, 96, 236–249. [Google Scholar] [CrossRef]
  76. Shirowzhan, S.; Sepasgozar, S.M. Spatial analysis using temporal point clouds in advanced GIS: Methods for ground elevation extraction in slant areas and building classifications. ISPRS Int. J. Geo Inf. 2019, 8, 120. [Google Scholar] [CrossRef] [Green Version]
  77. Verma, J.P.; Agrawal, S.; Patel, B.; Patel, A. Big data analytics: Challenges and applications for text, audio, video, and social media data. Int. J. Soft Comput. Artif. Intell. Appl. IJSCAI 2016, 5, 41–51. [Google Scholar] [CrossRef]
  78. Flake, G.W.; Gounares, A.G.; Gates, W.H.; Moss, K.A.; Dumais, S.T.; Naam, R.; Horvitz, E.J.; Goodman, J.T. Auctioning for Video and Audio Advertising. U.S. Patent Application 11/427,316, 3 January 2008. [Google Scholar]
  79. Pratt, W. Method of Conducting Interactive Real Estate Property Viewing. U.S. Patent Application 10/898,661, 26 January 2006. [Google Scholar]
  80. Emmanouil, D.; Nikolaos, D. Big Data Analytics in Prevention, Preparedness, Response and Recovery in Crisis and Disaster Management. Available online: https://pdfs.semanticscholar.org/c1f1/5011a85428ceeca788053a2e9daccc868ca2.pdf (accessed on 21 January 2020).
  81. Hampapur, A.; Bobbitt, R.; Brown, L.; Desimone, M.; Feris, R.; Kjeldsen, R.; Lu, M.; Mercier, C.; Milite, C.; Russo, S. Video analytics in urban environments. In Proceedings of the 2009 Sixth IEEE International Conference on Advanced Video and Signal Based Surveillance, Genova, Italy, 2–4 September 2009. [Google Scholar]
  82. Lipton, A.J.; Clark, J.I.; Thompson, B.; Myers, G.; Titus, S.R.; Zhang, Z.; Venetianer, P.L. The intelligent vision sensor: Turning video into information. In Proceedings of the 2007 IEEE Conference on Advanced Video and Signal Based Surveillance, London, UK, 5–7 September 2007. [Google Scholar]
  83. Stieglitz, S.; Dang-Xuan, L.; Bruns, A.; Neuberger, C. Social media analytics. Bus. Inf. Syst. Eng. 2014, 6, 89–96. [Google Scholar] [CrossRef]
  84. Su, X.; Sperlì, G.; Moscato, V.; Picariello, A.; Esposito, C.; Choi, C. An edge intelligence empowered recommender system enabling cultural heritage applications. IEEE Trans. Ind. Inform. 2019, 15, 4266–4275. [Google Scholar] [CrossRef]
  85. Amato, F.; Moscato, V.; Picariello, A.; Sperli’ì, G. Extreme events management using multimedia social networks. Future Gener. Comput. Syst. 2019, 94, 444–452. [Google Scholar] [CrossRef]
  86. Peisenieks, J.; Skadins, R. Uses of Machine Translation in the Sentiment Analysis of Tweets. Available online: https://www.researchgate.net/profile/Raivis_Skadis/publication/266220793_Uses_of_Machine_Translation_in_the_Sentiment_Analysis_of_Tweets/links/542ab7eb0cf29bbc1268a7bb.pdf (accessed on 21 March 2020).
  87. Romanyshyn, M. Rule-based sentiment analysis of ukrainian reviews. Int. J. Artif. Intell. Appl. 2013, 4, 103. [Google Scholar] [CrossRef]
  88. Pidduck, P.T.S.; Dent, M.J. System and Method for Searching Based on Text Blocks and Associated Search Operators. U.S. Patent Application 15/911,412, 5 September 2019. [Google Scholar]
  89. ArunaSafali, M.; Prasad, R.S.; Sastry, K.A. amalgamative sentiment analysis framework on social networking site. J. Phys. Conf. Ser. 2019, 1228, 012010. [Google Scholar] [CrossRef]
  90. Zhang, C.; Mao, B. Distributed processing practice of the 3D city model based on HBase. In Proceedings of the 2017 Fifth International Conference on Advanced Cloud and Big Data (CBD), Shanghai, China, 13–16 August 2017. [Google Scholar]
  91. Wei-Ping, Z.; Ming-Xin, L.; Huan, C. Using MongoDB to implement textbook management system instead of MySQL. In Proceedings of the 2011 IEEE 3rd International Conference on Communication Software and Networks, Xi’an, China, 27–29 May 2011. [Google Scholar]
  92. Chandrasekaran, K.; Marimuthu, C. Developing Software for Cloud: Opportunities and Challenges for Developers. Available online: https://0-onlinelibrary-wiley-com.brum.beds.ac.uk/doi/10.1002/9781118821930.ch13 (accessed on 21 March 2020).
  93. Jayagopal, V.; Basser, K. Data management and big data analytics: Data management in digital economy. In Optimizing Big Data Management and Industrial Systems with Intelligent Techniques; IGI Global: Hershey, PA, USA, 2019; pp. 1–23. [Google Scholar]
  94. Gul, I. Exploring the Application Security Measures in Hive to SecureData in Column. PhD Thesis, Colorado Technical University, Colorado Springs, CO, USA, 2019. [Google Scholar]
  95. Lavanya, K.; Kashyap, R.; Anjana, S.; Thasneen, S. An Enhanced K-Means MSOINN based clustering over Neo4j with an application to weather analysis. In Algorithms for Intelligent Systems; Springer: Berlin, Germany, 2020. [Google Scholar]
  96. Nargundkar, A.; Kulkarni, A.J. Big data in supply chain management and medicinal domain. In Big Data Analytics in Healthcare; Springer: Berlin, Germany, 2020; pp. 45–54. [Google Scholar]
  97. Kaya, T. Big data analytics for organizations: Challenges and opportunities and its effect on international business education. Kurd. J. Appl. Res. 2019, 4, 137–150. [Google Scholar]
  98. Venner, J. Pro Hadoop; Apress: New York, NY, USA, 2009. [Google Scholar]
  99. Octoparse. Yes, There Is Such Thing as a Free Web Scraper! Available online: https://www.octoparse.com/blog/yes-there-is-such-thing-as-a-free-web-scraper (accessed on 3 February 2020).
  100. DEORAS, S. 10 Best Data Cleaning Tools to Get the Most Out Of Your Data. Available online: https://analyticsindiamag.com/10-best-data-cleaning-tools-get-data (accessed on 3 February 2020).
  101. Ullah, F.; Sepasgozar, S.M. A Study of Information Technology Adoption for Real-Estate Management: A System Dynamic Model. Available online: https://www.worldscientific.com/doi/abs/10.1142/9789813272491_0027 (accessed on 21 March 2020).
  102. Amadio, W.J.; Haywood, M.E. Data Analytics and the Cash Collections Process: An Adaptable Case Employing Excel and Tableau’. Advances in Accounting Education: Teaching and Curriculum Innovations (Advances in Accounting Education, Volume 22); Emerald Publishing Limited: Bingley, UK, 2019; pp. 45–70. [Google Scholar]
  103. Budiu, M.; Gopalan, P.; Suresh, L.; Wieder, U.; Kruiger, H.; Aguilera, M.K. Hillview: A trillion-cell spreadsheet for big data. Proc. VLDB Endow. 2019, 12, 1442–1457. [Google Scholar] [CrossRef]
  104. Stančin, I.; Jović, A. An overview and comparison of free Python libraries for data mining and big data analysis. In Proceedings of the 2019 42nd International Convention on Information and Communication Technology, Electronics and Microelectronics (MIPRO), Opatija, Croatia, 20–24 May 2019. [Google Scholar]
  105. Wieringa, M.; van Geenen, D.; van Es, K.; van Nuss, J. The Fieldnotes Plugin: Making Network Visualization in Gephi Accountable (Chapter 16). Available online: https://eprints.qut.edu.au/125605/1/Good_Data_book.pdf (accessed on 21 March 2020).
  106. Anderson, D.R.; Sweeney, D.J.; Williams, T.A.; Camm, J.D.; Cochran, J.J. Modern Business Statistics with Microsoft Excel; Cengage Learning: Boston, MA, USA, 2020. [Google Scholar]
  107. Bhosale, H.S.; Gadekar, D.P. A review paper on big data and hadoop. Int. J. Sci. Res. Publ. 2014, 4, 1–7. [Google Scholar]
  108. DataFlair. Hadoop HDFS Architecture Explanation and Assumptions. Available online: https://data-flair.training/blogs/hadoop-hdfs-architecture/ (accessed on 3 February 2020).
  109. Zaharia, M.; Xin, R.S.; Wendell, P.; Das, T.; Armbrust, M.; Dave, A.; Meng, X.; Rosen, J.; Venkataraman, S.; Franklin, M.J. Apache spark: A unified engine for big data processing. Commun. ACM 2016, 59, 56–65. [Google Scholar] [CrossRef]
  110. Mavridis, I.; Karatza, H. Performance evaluation of cloud-based log file analysis with Apache Hadoop and Apache Spark. J. Syst. Softw. 2017, 125, 133–151. [Google Scholar] [CrossRef]
  111. Al-Jarrah, O.Y.; Yoo, P.D.; Muhaidat, S.; Karagiannidis, G.K.; Taha, K. Efficient machine learning for big data: A review. Big Data Res. 2015, 2, 87–93. [Google Scholar] [CrossRef] [Green Version]
  112. Saidulu, D.; Sasikala, R. Machine learning and statistical approaches for Big Data: Issues, challenges and research directions. Int. J. Appl. Eng. Res. 2017, 12, 11691–11699. [Google Scholar]
  113. Qiu, J.; Wu, Q.; Ding, G.; Xu, Y.; Feng, S. A survey of machine learning for big data processing. EURASIP J. Adv. Signal Process. 2016, 2016, 67. [Google Scholar] [CrossRef] [Green Version]
  114. Bengio, Y.; Courville, A.; Vincent, P. Representation learning: A review and new perspectives. IEEE Trans. Pattern Anal. Mach. Intell. 2013, 35, 1798–1828. [Google Scholar] [CrossRef] [PubMed]
  115. Hinton, G.; Deng, L.; Yu, D.; Dahl, G.E.; Mohamed, A.-r.; Jaitly, N.; Senior, A.; Vanhoucke, V.; Nguyen, P.; Sainath, T.N. Deep neural networks for acoustic modeling in speech recognition: The shared views of four research groups. IEEE Signal Process. Mag. 2012, 29, 82–97. [Google Scholar] [CrossRef]
  116. Parhami, B. Parallel Processing with Big Data. Available online: https://web.ece.ucsb.edu/~parhami/pubs_folder/parh19b-ebdt-parallel-proc-big-data.pdf (accessed on 21 March 2020).
  117. Chen, X.-W.; Lin, X. Big data deep learning: Challenges and perspectives. IEEE Access 2014, 2, 514–525. [Google Scholar] [CrossRef]
  118. Ding, S.; Xu, X.; Nie, R. Extreme learning machine and its applications. Neural Comput. Appl. 2014, 25, 549–556. [Google Scholar] [CrossRef]
  119. Wang, J.; Zhao, P.; Hoi, S.C.; Jin, R. Online feature selection and its applications. IEEE Trans. Knowl. Data Eng. 2013, 26, 698–710. [Google Scholar] [CrossRef] [Green Version]
  120. Wu, X.; Zhu, X.; Wu, G.-Q.; Ding, W. Data mining with big data. IEEE Trans. Knowl. Data Eng. 2013, 26, 97–107. [Google Scholar]
  121. Nie, F.; Wang, H.; Cai, X.; Huang, H.; Ding, C. Robust matrix completion via joint schatten p-norm and lp-norm minimization. In Proceedings of the 2012 IEEE 12th International Conference on Data Mining, Brussels, Belgium, 10–13 December 2012. [Google Scholar]
  122. Meier, P. Human computation for disaster response. In Handbook of Human Computation; Springer: Berlin, Germany, 2013; pp. 95–104. [Google Scholar]
  123. Fan, J.; Han, F.; Liu, H. Challenges of big data analysis. Natl. Sci. Rev. 2014, 1, 293–314. [Google Scholar] [CrossRef] [Green Version]
  124. Katal, A.; Wazid, M.; Goudar, R. Big data: Issues, challenges, tools and good practices. In Proceedings of the 2013 Sixth International Conference on Contemporary Computing (IC3), Noida, India, 8–10 August 2013. [Google Scholar]
  125. Jaseena, K.; David, J.M. Issues, challenges, and solutions: Big data mining. CS & IT-CSCP 2014, 4, 131–140. [Google Scholar]
  126. Kasavajhala, V. Solid State Drive vs. Hard Disk Drive Price and Performance Study. Available online: https://www.dell.com/downloads/global/products/pvaul/en/ssd_vs_hdd_price_and_performance_study.pdf (accessed on 21 March 2020).
  127. Munawar, H.S.; Awan, A.A.A.; Khalid, U.; Munawar, S.; Maqsood, A. Revolutionizing telemedicine by Instilling H. 265. Int. J. Image Graphics Signal Process. 2017, 9, 20–27. [Google Scholar] [CrossRef] [Green Version]
  128. Raghupathi, W.; Raghupathi, V. Big data analytics in healthcare: Promise and potential. Health Inf. Sci. Syst. 2014, 2, 3. [Google Scholar] [CrossRef]
  129. He, K.Y.; Ge, D.; He, M.M. Big data analytics for genomic medicine. Int. J. Mol. Sci. 2017, 18, 412. [Google Scholar] [CrossRef] [Green Version]
  130. Chen, M.; Hao, Y.; Hwang, K.; Wang, L.; Wang, L. Disease prediction by machine learning over big data from healthcare communities. IEEE Access 2017, 5, 8869–8879. [Google Scholar] [CrossRef]
  131. Iniesta, R.; Stahl, D.; McGuffin, P. Machine learning, statistical learning and the future of biological research in psychiatry. Psychol. Med. 2016, 46, 2455–2465. [Google Scholar] [CrossRef] [Green Version]
  132. Obermeyer, Z.; Emanuel, E.J. Predicting the future—Big data, machine learning, and clinical medicine. N. Engl. J. Med. 2016, 375, 1216. [Google Scholar] [CrossRef] [Green Version]
  133. Wolfert, S.; Ge, L.; Verdouw, C.; Bogaardt, M.-J. Big data in smart farming–a review. Agric. Syst. 2017, 153, 69–80. [Google Scholar] [CrossRef]
  134. Singh, S.; Kaur, S.; Kumar, P. Forecasting soil moisture based on evaluation of time series analysis. In Advances in Power and Control Engineering; Springer: Berlin, Germany, 2020; pp. 145–156. [Google Scholar]
  135. Faulkner, A.; Cebul, K.; McHenry, G. Agriculture Gets Smart: The Rise of Data and Robotics. Available online: https://www.cleantech.com/wp-content/uploads/2014/07/Agriculture-Gets-Smart-Report.pdf (accessed on 21 March 2020).
  136. Chandramohan, A.M.; Mylaraswamy, D.; Xu, B.; Dietrich, P. Big data infrastructure for aviation data analytics. In Proceedings of the 2014 IEEE International Conference on Cloud Computing in Emerging Markets (CCEM), Bangalore, India, 15–17 October 2014. [Google Scholar]
  137. Shaikh, F.; Rangrez, F.; Khan, A.; Shaikh, U. Social media analytics based on big data. In Proceedings of the 2017 International Conference on Intelligent Computing and Control (I2C2), Coimbatore, India, 23–24 June 2017. [Google Scholar]
  138. Sharmin, S.; Zaman, Z. Spam detection in social media employing machine learning tool for text mining. In Proceedings of the 2017 13th International Conference on Signal-Image Technology & Internet-Based Systems (SITIS), Jaipur, India, 4–7 December 2017. [Google Scholar]
  139. Yadav, S.; Thakur, S. Bank loan analysis using customer usage data: A big data approach using Hadoop. In Proceedings of the 2017 2nd International Conference on Telecommunication and Networks (TEL-NET), Noida, India, 10–11 August 2017. [Google Scholar]
  140. Shirowzhan, S.; Sepasgozar, S.M.E.; Edwards, D.J.; Li, H.; Wang, C. BIM compatibility and its differentiation with interoperability challenges as an innovation factor. Autom. Constr. 2020, 112, 103086. [Google Scholar] [CrossRef]
  141. Sepasgozar, S.M.; Hawken, S.; Sargolzaei, S.; Foroozanfa, M. Implementing citizen centric technology in developing smart cities: A model for predicting the acceptance of urban technologies. Technol. Forecast. Social Chang. 2019, 142, 105–116. [Google Scholar] [CrossRef]
  142. Sepasgozar, S.M.; Davis, S.R.; Li, H.; Luo, X. Modeling the implementation process for new construction technologies: Thematic analysis based on Australian and US practices. J. Manag. Eng. 2018, 34, 05018005. [Google Scholar] [CrossRef]
  143. Sepasgozar, S.M.; Davis, S. Digital construction technology and job-site equipment demonstration: Modelling relationship strategies for technology adoption. Buildings 2019, 9, 158. [Google Scholar] [CrossRef] [Green Version]
  144. Sepasgozar, S.; Shirowzhan, S.; Wang, C.C. A Scanner technology acceptance model for construction projects. Procedia Eng. 2017, 180, 1237–1246. [Google Scholar] [CrossRef]
  145. Suthaharan, S. Big data classification: Problems and challenges in network intrusion prediction with machine learning. ACM SIGMETRICS Perform. Eval. Rev. 2014, 41, 70–73. [Google Scholar] [CrossRef]
  146. Srai, J.S.; Kumar, M.; Graham, G.; Phillips, W.; Tooze, J.; Ford, S.; Beecher, P.; Raj, B.; Gregory, M.; Tiwari, M.K. Distributed manufacturing: Scope, challenges and opportunities. Int. J. Prod. Res. 2016, 54, 6917–6935. [Google Scholar] [CrossRef]
  147. Wang, J.; Zhang, J. Big data analytics for forecasting cycle time in semiconductor wafer fabrication system. Int. J. Prod. Res. 2016, 54, 7231–7244. [Google Scholar] [CrossRef]
  148. Chen, D.Q.; Preston, D.S.; Swink, M. How the use of big data analytics affects value creation in supply chain management. J. Manag. Inf. Syst. 2015, 32, 4–39. [Google Scholar] [CrossRef]
  149. Hazen, B.T.; Boone, C.A.; Ezell, J.D.; Jones-Farmer, L.A. Data quality for data science, predictive analytics, and big data in supply chain management: An introduction to the problem and suggestions for research and applications. Int. J. Prod. Econ. 2014, 154, 72–80. [Google Scholar] [CrossRef]
  150. Zhou, Z.; Dou, W.; Jia, G.; Hu, C.; Xu, X.; Wu, X.; Pan, J. A method for real-time trajectory monitoring to improve taxi service using GPS big data. Inf. Manag. 2016, 53, 964–977. [Google Scholar] [CrossRef] [Green Version]
  151. Matthias, O.; Fouweather, I.; Gregory, I.; Vernon, A. Making sense of big data–can it transform operations management? Int. J. Oper. Prod. Manag. 2017, 31, 37–55. [Google Scholar] [CrossRef] [Green Version]
  152. Moeyersoms, J.; Martens, D. Including high-cardinality attributes in predictive models: A case study in churn prediction in the energy sector. Decis. Support Syst. 2015, 72, 72–81. [Google Scholar] [CrossRef]
  153. Ullah, F.; Samad, M.S.; Siddiqui, S. An investigation of real estate technology utilization in technologically advanced marketplace. In Proceedings of the 9th International Civil Engineering Congress (ICEC-2017), “Striving Towards Resilient Built Environment”, Karachi, Pakistan, 22–23 December 2017. [Google Scholar]
  154. Ullah, F.; Shinetogtokh, T.; Sepasgozar, P.S.; Ali, T.H. Investigation of the users’ interaction with online real estate platforms in Australia. In Proceedings of the 2nd International Conference on Sustainable Development in Civil Engineering (ICSDC 2019), Jamshoro, Pakistan, 5–7 December 2019. [Google Scholar]
  155. Kolomvatsos, K.; Anagnostopoulos, C. Reinforcement learning for predictive analytics in smart cities. Informatics 2017, 4, 16. [Google Scholar] [CrossRef] [Green Version]
  156. NextGenLivingHomes. The Bitcoin House. Available online: https://nextgenlivinghomes.com/download-the-bitcoin-house-brochure-the-first-income-generating-home-in-the-world/ (accessed on 1 March 2020).
  157. Kok, N.; Koponen, E.-L.; Martínez-Barbosa, C.A. Big data in real estate? From manual appraisal to automated valuation. J. Portf. Manag. 2017, 43, 202–211. [Google Scholar] [CrossRef]
  158. Joseph, G.; Varghese, V. Analyzing Airbnb customer experience feedback using text mining. In Big Data and Innovation in Tourism, Travel, and Hospitality; Springer: Berlin, Germany, 2019; pp. 147–162. [Google Scholar]
  159. CoreLogic. Available online: https://www.corelogic.com.au/ (accessed on 1 March 2020).
  160. Archibus. Automate Preventive Upkeep|With Building Operations Tools. Available online: https://archibus.com/products/building-operations (accessed on 1 March 2020).
  161. Ju, J.; Liu, L.; Feng, Y. Citizen-centered big data analysis-driven governance intelligence framework for smart cities. Telecommun. Policy 2018, 42, 881–896. [Google Scholar] [CrossRef]
  162. Boakye, J.; Gardoni, P.; Murphy, C. Using opportunities in big data analytics to more accurately predict societal consequences of natural disasters. Civ. Eng. Environ. Syst. 2019, 36, 100–114. [Google Scholar] [CrossRef]
  163. Marr, B. How Much Data Do We Create Every Day? The Mind-Blowing Stats Everyone Should Read. Available online: https://www.forbes.com/sites/bernardmarr/2018/05/21/how-much-data-do-we-create-every-day-the-mind-blowing-stats-everyone-should-read/#40f31fec60ba (accessed on 3 March 2020).
  164. Gurman, T.A.; Ellenberger, N. Reaching the global community during disasters: Findings from a content analysis of the organizational use of Twitter after the 2010 Haiti earthquake. J. Health Commun. 2015, 20, 687–696. [Google Scholar] [CrossRef] [PubMed]
  165. Tapia, A.H.; Moore, K.A.; Johnson, N.J. Beyond the trustworthy tweet: A deeper understanding of microblogged data use by disaster response and humanitarian relief organizations. In Proceedings of the ISCRAM, Baden-Baden, Germany, 12–15 May 2013. [Google Scholar]
  166. Arslan, M.; Roxin, A.-M.; Cruz, C.; Ginhac, D. A review on applications of big data for disaster management. In Proceedings of the 2017 13th International Conference on Signal-Image Technology & Internet-Based Systems (SITIS), Jaipur, India, 4–7 December 2017. [Google Scholar]
  167. Liu, C.; Shirowzhan, S.; Sepasgozar, S.M.; Kaboli, A. Evaluation of classical operators and fuzzy logic algorithms for edge detection of panels at exterior cladding of buildings. Buildings 2019, 9, 40. [Google Scholar] [CrossRef] [Green Version]
  168. Munawar, H.S.; Zhang, J.; Li, H.; Mo, D.; Chang, L. Mining multispectral aerial images for automatic detection of strategic bridge locations for disaster relief missions. In Pacific-Asia Conference on Knowledge Discovery and Data Mining; Springer: Berlin, Germany, 2019. [Google Scholar]
  169. Munawar, H.S.; Maqsood, A.; Mustansar, Z. Isotropic surround suppression and Hough transform based target recognition from aerial images. Int. J. Adv. Appl. Sci. 2017, 4, 37–42. [Google Scholar] [CrossRef]
  170. Ghurye, J.; Krings, G.; Frias-Martinez, V. A framework to model human behavior at large scale during natural disasters. In Proceedings of the 2016 17th IEEE International Conference on Mobile Data Management (MDM), Porto, Portugal, 13–16 June 2016. [Google Scholar]
  171. Zhang, J.A.; Nolan, D.S.; Rogers, R.F.; Tallapragada, V. Evaluating the impact of improvements in the boundary layer parameterization on hurricane intensity and structure forecasts in HWRF. Mon. Weather Rev. 2015, 143, 3136–3155. [Google Scholar] [CrossRef]
  172. Yablonsky, R.M.; Ginis, I.; Thomas, B. Ocean modeling with flexible initialization for improved coupled tropical cyclone-ocean model prediction. Environ. Model. Softw. 2015, 67, 26–30. [Google Scholar] [CrossRef]
  173. Zhang, J.A.; Marks, F.D.; Montgomery, M.T.; Lorsolo, S. An estimation of turbulent characteristics in the low-level region of intense Hurricanes Allen (1980) and Hugo (1989). Mon. Weather Rev. 2010, 139, 1447–1462. [Google Scholar] [CrossRef] [Green Version]
  174. Bisson, M.; Spinetti, C.; Neri, M.; Bonforte, A. Mt. Etna volcano high-resolution topography: Airborne LiDAR modelling validated by GPS data. Int. J. Digit. Earth 2016, 9, 710–732. [Google Scholar] [CrossRef]
  175. Nomikou, P.; Parks, M.; Papanikolaou, D.; Pyle, D.; Mather, T.; Carey, S.; Watts, A.; Paulatto, M.; Kalnins, M.; Livanos, I. The emergence and growth of a submarine volcano: The Kameni islands, Santorini (Greece). GeoResJ 2014, 1, 8–18. [Google Scholar] [CrossRef] [Green Version]
  176. Nonnecke, B.M.; Mohanty, S.; Lee, A.; Lee, J.; Beckman, S.; Mi, J.; Krishnan, S.; Roxas, R.E.; Oco, N.; Crittenden, C. Malasakit 1.0: A participatory online platform for crowdsourcing disaster risk reduction strategies in the philippines. In Proceedings of the 2017 IEEE Global Humanitarian Technology Conference (GHTC), San Jose, CA, USA, 19–22 October 2017. [Google Scholar]
  177. Poslad, S.; Middleton, S.E.; Chaves, F.; Tao, R.; Necmioglu, O.; Bügel, U. A semantic IoT early warning system for natural environment crisis management. IEEE Trans. Emerg. Top. Comput. 2015, 3, 246–257. [Google Scholar] [CrossRef]
  178. Di Felice, M.; Trotta, A.; Bedogni, L.; Chowdhury, K.R.; Bononi, L. Self-organizing aerial mesh networks for emergency communication. In Proceedings of the 2014 IEEE 25th Annual International Symposium on Personal, Indoor, and Mobile Radio Communication (PIMRC), Washington, DC, USA, 2–5 September 2014. [Google Scholar]
  179. Mosterman, P.J.; Sanabria, D.E.; Bilgin, E.; Zhang, K.; Zander, J. A heterogeneous fleet of vehicles for automated humanitarian missions. Comput. Sci. Eng. 2014, 16, 90–95. [Google Scholar] [CrossRef]
  180. Lu, Z.; Cao, G.; La Porta, T. Networking smartphones for disaster recovery. In Proceedings of the 2016 IEEE International Conference on Pervasive Computing and Communications (PerCom), Sydney, Australia, 14–19 March 2016. [Google Scholar]
  181. de Alwis Pitts, D.A.; So, E. Enhanced change detection index for disaster response, recovery assessment and monitoring of accessibility and open spaces (camp sites). Int. J. Appl. Earth Obs. Geoinf. 2017, 57, 49–60. [Google Scholar] [CrossRef] [Green Version]
  182. Contreras, D.; Forino, G.; Blaschke, T. Measuring the progress of a recovery process after an earthquake: The case of L’aquila, Italy. Int. J. Disaster Risk Reduct. 2018, 28, 450–464. [Google Scholar] [CrossRef]
  183. Kahn, M.E. The death toll from natural disasters: The role of income, geography, and institutions. Rev. Econ. Stat. 2005, 87, 271–284. [Google Scholar] [CrossRef]
  184. Goh, T.T.; Sun, P.-C. Eaching social media analytics: An assessment based on natural disaster postings. J. Inf. Syst. Educ. 2015, 26, 27. [Google Scholar]
  185. Grinberger, A.Y.; Lichter, M.; Felsenstein, D. Dynamic agent based simulation of an urban disaster using synthetic big data. In Seeing Cities Through Big Data; Springer: Berlin, Germany, 2017; pp. 349–382. [Google Scholar]
  186. Lv, Z.; Li, X.; Choo, K.-K.R. E-government multimedia big data platform for disaster management. Multimed. Tools Appl. 2018, 77, 10077–10089. [Google Scholar] [CrossRef]
  187. Hashem, I.A.T.; Chang, V.; Anuar, N.B.; Adewole, K.; Yaqoob, I.; Gani, A.; Ahmed, E.; Chiroma, H. The role of big data in smart city. Int. J. Inf. Manag. 2016, 36, 748–758. [Google Scholar] [CrossRef] [Green Version]
  188. Deal, B.; Pan, H.; Pallathucheril, V.; Fulton, G. Urban resilience and planning support systems: The need for sentience. J. Urban Technol. 2017, 24, 29–45. [Google Scholar] [CrossRef]
  189. Kontokosta, C.E.; Malik, A. The Resilience to Emergencies and Disasters Index: Applying big data to benchmark and validate neighborhood resilience capacity. Sustain. Cities Soc. 2018, 36, 272–285. [Google Scholar] [CrossRef]
  190. Klein, B.; Koenig, R.; Schmitt, G. Managing urban resilience. Informatik-Spektrum 2017, 40, 35–45. [Google Scholar] [CrossRef]
  191. Sepasgozar, S.M.; Forsythe, P.; Shirowzhan, S. Evaluation of terrestrial and mobile scanner technologies for part-built information modeling. J. Constr. Eng. Manag. 2018, 144, 04018110. [Google Scholar] [CrossRef]
  192. Sepasgozar, S.; Lim, S.; Shirowzhan, S.; Kim, Y.; Nadoushani, Z.M. Utilisation of a New Terrestrial Scanner for Reconstruction of As-built Models: A Comparative Study. In Proceedings of the ISARC, International Symposium on Automation and Robotics in Construction, Oulu, Finland, 15–18 June 2015. [Google Scholar]
  193. Sepasgozar, S.M.; Wang, C.; Shirowzhan, S. Challenges and opportunities for implementation of laser scanners in building construction. In Proceedings of the 33rd International Symposium on Automation and Robotics in Construction (ISARC 2016), Auburn, AL, USA, 18–21 July 2016. [Google Scholar]
  194. Sepasgozar, S.M.; Forsythe, P.; Shirowzhan, S.; Norzahari, F. Scanners and photography: A combined framework. In Proceedings of the 40th Australasian Universities Building Education Association (AUBEA) 2016 Conference, Cairns, Australia, 6–8 July 2016. [Google Scholar]
  195. Li, H.; Chan, G.; Wong, J.K.W.; Skitmore, M. Real-time locating systems applications in construction. Autom. Constr. 2016, 63, 37–47. [Google Scholar] [CrossRef] [Green Version]
  196. Shirowzhan, S.; Sepasgozar, S.M.E.; Zaini, I.; Wang, C. An integrated GIS and Wi-Fi based Locating system for improving construction labor communications. In Proceedings of the 34th International Symposium on Automation and Robotics in Construction and Mining, Taipei, Taiwan, 28 June–1 July 2017. [Google Scholar]
  197. Shirowzhan, S.; Lim, S.; Trinder, J.; Li, H.; Sepasgozar, S.M.E. Data mining for recognition of spatial distribution patterns of building heights using airborne lidar data. Adv. Eng. Inform. 2020, 43, 101033. [Google Scholar] [CrossRef]
  198. Shirowzhan, S.; Trinder, J.; Osmond, P. New metrics for spatial and temporal 3D Urban form sustainability assessment using time series lidar point clouds and advanced GIS techniques. In Urban Design; IntechOpen: London, UK, 2019. [Google Scholar]
  199. Shirowzhan, S.; Trinder, J. Building classification from lidar data for spatio-temporal assessment of 3D urban developments. Procedia Eng. 2017, 180, 1453–1461. [Google Scholar] [CrossRef]
Figure 1. Methodology for shortlisting research articles for the study.
Bdcc 04 00004 g001
Figure 2. Most frequent keywords in the big data articles from 2010 to 2020.
Bdcc 04 00004 g002
Figure 3. Most frequent keywords used in the big data articles on real estate and property from 2010 to 2020.
Bdcc 04 00004 g003
Figure 4. Most frequent keywords used in the big data articles on disaster management from 2010 to 2020.
Bdcc 04 00004 g004
Figure 5. Big data papers published per year as indexed on Scopus and Web of Science from 2010–2019.
Bdcc 04 00004 g005
Figure 6. Worldwide big data, disaster big data, and real estate big data search trends in last decade.
Bdcc 04 00004 g006
Figure 7. Article types reviewed in the study.
Bdcc 04 00004 g007
Figure 8. Authors’ names, as well as the number of documents and citations, of the 139 reviewed papers from 2010 to 2020.
Bdcc 04 00004 g008
Figure 9. Country-wise contributions to and citations of the 139 reviewed articles from 2010 to 2020.
Bdcc 04 00004 g009
Figure 10. The seven Vs of big data.
Bdcc 04 00004 g010
Figure 11. Comparison of performance for (a) PageRank and (b) logistic regression algorithm.
Bdcc 04 00004 g011
Figure 12. Conceptual model for big data utilization in real estate transactions with decentralized validation to ensure data integrity.
Bdcc 04 00004 g012
Figure 13. Proposed framework for utilizing social media big data for emergency and disaster relief.
Bdcc 04 00004 g013
Figure 14. Big data utilization for disaster risk management.
Bdcc 04 00004 g014
Figure 15. Smart real estate big data as an input to disaster management.
Bdcc 04 00004 g015
Table 1. Initial article retrieval—phase 1 (year 2010–2020).
Search EngineSearch PhrasesArticles RetrievedOut of ScopeSearch PhrasesArticles RetrievedOut of ScopeSearch PhrasesArticles RetrievedOut of Scope
Google Scholar, ACM, Science Direct, IEEE Xplore, Springer, MDPIS1202,89512,993------
Scopus, ElsevierS1*26,7397045S22386838S31963702
Total Articles200,00020,038 1548838 1261702
Final Retrieved1,799,620 1548 1261
Note: S1: “Big Data” OR “Technology for big data filtering” OR “Refining big data”, S1*: (TITLE-ABS-KEY(Tools for big data analysis) OR (big data analytics tools) OR (big data visualization technologies) AND PUBYEAR > 2009, S2: (TITLE-ABS-KEY(big data real estate ) OR (big data property management) OR (big data real estate management) OR (big data real estate development) OR (big data property development)) AND PUBYEAR > 2009, S3: (TITLE-ABS-KEY(big data disaster management) OR (big data disaster)) AND PUBYEAR > 2009.
Table 2. Articles retrieved after each phase, as well as those filtered and shortlisted for final content analyses.
Categories/PhaseArticles RetrievalFiltered ArticlesFinal Content Analyses
Big data concepts and definitions75,2435233
Big data analytic tools/technologies104,7198359
Applications of big data in smart real estate, property and disaster management28094747
Total articles182,771182139
Note: The filters applied were publications from 2010 and onward, the presence of keywords in the title or abstract, English language, and no duplications. Exclusions included short papers, editorial notes, calls for issues, errata, discussions, and closures.
Table 3. Most repeated keywords in the big data papers from 2010–2020.
TermOccurrencesRelevance Score
Analysis system370.26
Investigation270.20
Disaster risk management260.19
Big data230.16
Real estate technologies and urban area160.12
Implementation challenges100.07
Table 4. Top sources based on number of papers reviewed from 2010–2020.
SourceDocumentsCitations
Lecture notes in computer science2735
IOP conference series: earth and environmental science2127
ACM international conference proceeding series194
Advances in intelligent systems and computing174
IEEE international conference on big data, big data 20171627
Others39288
Table 5. List of affiliated organizations and the number of contributing documents included in the 139 reviewed articles from 2010 to 2020.
OrganizationDocumentsCitations
Center for Spatial Information Science, University of Tokyo, Japan680
School of Computing and Information Sciences, Florida International University, Miami, Fl 33199, United States647
International Research Institute of Disaster Science (Irides), Tohoku University, Aoba 468-1, Aramaki, Aoba-Ku, Sendai, 980-0845, Japan510
University of Tokyo, Japan434
Earthquake Research Institute, University of Tokyo, Tokyo, Japan414
Department of Geography, University of Wisconsin-Madison, Madison, Wi 53706, United States361
Department of Computing Science, University of Aberdeen, Aberdeen, United Kingdom335
Department of Geography, University of South Carolina, Columbia, Sc 29208, United States334
School of Remote Sensing and Information Engineering, Wuhan University, Wuhan, 430079, China313
National Institute of Informatics, Tokyo, Japan39
State Key Laboratory of Information Engineering in Surveying, Mapping and Remote Sensing, Wuhan University, Wuhan, 430079, China38
Institute of Remote Sensing and Digital Earth, Chinese Academy of Sciences, Beijing, 100094, China34
Department of Computer and Information Sciences, Fordham University, New York, Ny 10458, United States33
School of Computer Science and Technology, Guangzhou University, Guangzhou, 510006, China33
Research Institute of Electrical Communication, Tohoku University, Sendai, Japan30
University of Chinese Academy of Sciences, Beijing, 100049, China30
Table 6. The seven Vs, as well as their key aspects and context of usage.
The 7 Vs and DefinitionsTypes of Data and How to Tackle/Handle Them Context and Features
Variety refers to the structural heterogeneity in a dataset. [6,39,42,43]Structured
Semi-structured
Unstructured: use multi-model DBMS
Form: comprises different forms of data, text, images, audio, video and social media
Structure: structured and unstructured data
Volume refers to the scale of data or large amount of data generated every second [6,16,39,42]Machine generated data:
use: stream data or use progressive loading
Scale: scale of data coming from various sources
Size: large size (terabytes and petabytes)
Magnitude: large magnitude
Velocity refers to the ability to successfully process data at a high speed [6,39,42,43]Incremental and streaming processingSpeed: speed of data generation, speed of data processing
Rate: rate of data generation, rate of change of data
Value refers to the value found out of big data (i.e., customer wants, trends, needs) [39,42,43]Performance tools, analytics tools, personal experience and analysis. Patterns: hidden patterns and dependencies in data
Decision-making: ability of data to make accurate decision
Usefulness: ability of data to provide useful information and knowledge
Veracity refers to the extent to which the data are accurate, precise, and applicable without having any anomaly [39,42,43]Data cleaning tools (Trifacta Wrangler, Drake, TIBCO Clarity, Winpure, Data Ladder, Data Cleaner)
Uses: datasets are used for decision-making
Uncertainty: uncertainty or inaccuracy of data
Unreliability: unreliability inherent in big data
Ambiguity: incompleteness, ambiguity and incoherency of big data
Variability refers to inconsistencies in the data and the speed at which big data is loaded in your database [41,42,43]Statistical tools to measure range, interquartile range, variance, and standard deviationOpportunities: dynamic opportunities that are available by interpreting unstructured data
Variation: variation in the rate of flow of data
Irregularity: irregularity, periodicity and incoherence of big data
Interpretations: changing meaning of the data due to different interpretations
Visualization refers to the representation of data in different visual forms, such as data clustering, tree maps, circular network diagrams [9,39,43,47]Visualization tools, such as: Google Charts, Tableau, Grafana, Chartist.js, FusionCharts, Datawrapper, Infogram, ChartBlocks, and D3.
Uses: statistical models, graphics, and databases to plot data
Modeling: modeling and graphical analysis of big data to depict relationships and decisions
Interpretations: interpreting trends and patterns present in big data
Artistic display: display real-time changes and relationships within data in artistic ways
Table 7. Comparison of data collection tools.
ToolsDeploy AbilityAnalysisLimitation
SemantriaWeb, API, ExcelSentimentCrashes on large datasets [86]
Opinion crawlWebSentimentCannot be used for advanced SEO audits [87]
Open textCaptivaContentRequires lot of technical configuration for document sharing on servers [88]
TrackurTrackurSentimentRecurring cost of subscription [89]
Table 8. Comparison of NoSQL data storage tools.
NoSQL DatabasesNoSQL CategoryFeaturesApplicationsLimitation
Apache CassandraColumn-orientedFault-tolerant; scalable; decentralized; tunable consistencyFacebook for inbox search; online tradingIt will not work for ACID properties (atomicity, consistency, isolation, and durability) [80]
HBaseElastic; consistent; fault-tolerantFacebook messagesDoes not support SQl Structure and there is no query optimizer [90]
MongoDBDocument-orientedHorizontally scalable fast; load balancingAsset tracking system; textbook management systemMemory restrictions for both Linux- and Windows-based environments [91]
CouchDBSeamless flow of data; ease of use; developer-friendlyInternational Business Machines (IBM)Slower than in-memory DBMS; slow response in viewing large datasets in creating replica of databases, where it fails [92]
TerrastoreElastic; scalable; extensible; simple configurationEvent processingOnly document-oriented database; not mature enough yet [93]
HiveGraphUsed for structured dataset; ad hoc report generationNetwork traffic classification; FacebookUpdate/delete operations are not supported in hive; materialized view is not available [94]
Neo4jFast read and write; horizontally and vertically scalableTime-varying social network dataSearching for ranges is not possible in Neo4j [95]
AeroSpikeValuePowering real-time, extreme-scale data solutionsEcommerce and retail, Adobe SolutionsGeospatial precision is not accurate; incremental backup and restore operations are still not available [96]
VoldemortDistributed key-value storage systemLinkedInDoes not satisfy arbitrary relations while satisfying ACID properties (atomicity, consistency, isolation, and durability); it is not an object database that maps object reference graphs transparently [97]
Table 9. Comparison of data filtering tools.
ToolsInput DataSoftwareFeaturesOutput Data Form
Import.io [99]CSV or Excel (XLSX) fileWeb-basedAllows scheduling of data; supports combination of days, time weeks; web scrapingStructured data; data reports
Parsehub [99]Excel (XLSX) fileCloud-basedSearch through pop-ups, tabs and forms; graphics app interfaceComma-separated values (CSV); Google sheets
Mozenda [16]Input listWeb-basedAutomatic list identification; web scraping [36]JavaScript object notation (JSON); CSV
Content Grabber [16]Text or dropdown fieldWeb-based Point and click interface; scalable; error handling [36]Extensible markup language (XML); CSV
Octoparse [99]Keywords/textCloud-basedWeb scraping without coding; user-friendly; scheduled extractionCSV; API
Table 10. Comparison of data cleaning tools.
ToolsFeaturesSourceTechnologies
Data CleanerMissing values search; duplicate detectionHadoop database [16]Fishers discrimination criterion (FDC)
Map ReduceSorting; clusteringHadoop database [16]Functional programming
Open RefineTransformation; faster paceWeb services [16,100]Java
ReifierFast deployment; high accuracyVarious databases [100]All relational
Trifecta WranglerTransformation; fewer formatting times; suggests common aggregationsWeb services [100]NoSQL databases
Table 11. Comparison of data visualization tools.
ToolsFeaturesLimitationsAvailability
TableauFast and flexible; wide variety of charts; mapping longitude and latitudeLicense for server and desktop is needed; coding skills are required [102]Open source
Microsoft Power BIFlexible and persuasive; code-free data visualizationWork account is necessary for sign-in; 250 MB is the limited size of Workbook [103]Open source/cloud-based service
PlotlyWeb Plot Digitizer (WPD) is a tool of plotly which automatically extracts data from static imagesUpload size of file must be up to 50 MB; no offline client is available [104]Open source
GephiHandles large complex datasets; no programming skillsOnly works for graph visualization [105]Open source
ExcelCapable of managing semi-structured data; powerful visualization toolAvailable only with Office 365 subscription; not free [106]Open source
Table 12. Parameter comparison of Hadoop and Apache Spark. RDD—Resilient Distributed Datasets.
ParametersHadoop FrameworkApache Spark
LanguageJavaScala
Memory24 GB8 GB to hundreds of GBs
Network1 GB Ethernet all-to-all10 GB or more
SecurityAuthentication via LDAP (Lightweight Directory Access Protocol) Via shared secret
Fault ToleranceData replicationRDD
SpeedFast100× faster than Hadoop
ProcessingBatch processingReal-time processing
Table 13. Sub-domains of machine learning.
Learning TypesLearning AlgorithmsProcessing TasksApplications
Supervised learningSupport vector machine (SVM); naïve Bayes; hidden Markov modelClassificationSpeech recognition; medical imaging
RegressionAlgorithmic trading
Unsupervised learningK-means; Gaussian mixture modelClusteringGene sequence analysis; market research
Prediction
Reinforcement learningQ-learning; R-learningDecision-makingStock market price prediction
Table 14. Issues and possible solutions of machine learning for big data.
IssuesPossible Solutions
VolumeParallel computing [116]
Cloud computing [40]
VarietyData integration; deep learning methods; dimensionality reduction [117]
VelocityExtreme learning machine (ELM) [118]
Online learning [119]
ValueKnowledge discovery in databases (KDD); data mining technologies [120]
Uncertainty and incompletenessMatrix completion [121]
Table 15. Organizations using big data in smart real estate, focusing on stakeholders and required resources.
StakeholderFocusResources RequiredImplementing Organization with Examples/Uses
Customer
[48,51,158]
PersonalizationCustomer data surveys, feedback analysesAirbnb London: Creating collective intelligence databases from customers reviews and feedbacks
Cross-matchingData warehouse, buyer click patternsHaowu China: A bigdata warehouse was established where the buyer demand is matched with the house available;
BuildZoom USA: Matches commercial or residential owner projects with appropriate contractors in proximity who specialize in the job at hand and have high ratings
Property informationPredictive analytics tools, access to government informationData Science for Social Good Chicago USA: Leads contamination identification in houses before they occur using predictive analytics
Buyer demandBuyer survey, social media analyticsXinfeng China: Five bigdata application systems are created to recommend certain houses and evaluate the housing price
Owners, sellers, and agents [51,159,160]Building performance databasesBuilding maintenance data, occupant dataArchiBus USA: Benchmarking, preventive maintenance, predictive maintenance, and anticipation of budgetary needs
Property value analysisGovernment reports, local contracts, property insightsCoreLogic Australia: Prepares reports, generates value estimates, verifies information, and conducts highly targeted marketing
Resident, strata, and enterprise managementAnalytics toolsAccenture Ireland: Provides consultancy and system integration services to enterprises and building rapid learning models
Online transactionCustomer surveys, demand analysisTruss USA: Marketplace to help small- and medium-sized business owners find, tour, and lease space that uses three-dimensional (3D) virtual tours
Potential clients/businessProperty insights, government databasesSmartList Australia: Combines property, market, and consumer data to identify properties that are more likely to be listed and sold; helps agents get more opportunities from fewer conversations
Government and regulatory authorities [51,161]Fraud detectionDrones, processing systemsTax Agency Spain: Data analyzed using drones from 4000 municipalities and discovered 1.69 million properties paying insufficient taxes on new constructions, expansions, and pools
Privacy and securityGovernment dataMyNanjing App China: Connects citizens, public administrative departments, state-owned enterprises providing public services, and private companies across Nanjing, China with security ensured by the government
Public servicesCentral database linkagesHealth and Human Services Connect Initiative New York: This service allows clients to walk into different agencies without the need for duplicating the paperwork
Table 16. Big data sources, features, and phases specific to various disaster types.
PhaseFeaturesSource of Big Data and Tools/TechDisaster TypeCompany/Study Area and
Application
PreventionRisk assessment and mitigationCall detail records (CDR): GPS, n-th-order Markov chain modelsEarthquake [170]Rwanda: data mining, Markov chains, statistical analysis to automate the prediction of behavioral reaction of people to a disaster
Disaster predictionSensor web, satellite, simulations: stepped frequency microwave radiometer (SFMR)Hurricane [171,172,173]NOAA, Florida: model development, physics implementation to improve hurricane forecasts
PreparednessTracking and detectionCombined data types, Internet of things (IoT): LiDAR, GPSVolcano [174,175]Mt. Etna, Italy: distinguish ground objects from natural and anthropic features using digital terrain model (DTM) and digital surface model (DSM)
Warning systemsSocial media, IoT, simulation: SPARQL endpoints, and clientTsunami [176,177]Eastern Mediterranean: IoT-based early warning system using multi-semantic representation model
ResponseDamage assessmentUAV, satellite, IoT: 3D modelingTyphoon [178]Distributed mobility algorithm to guarantee quality of service (QoS)
Damage estimationCensus data: capability approach (CA), probabilistic frameworkEarthquake [162]Seaside, Oregon: dynamic Bayesian network to determine the state of well-being
Landmark (roads, bridges, buildings) detectionUAV imagery: unmanned aerial vehicleFlood [19]Pakistan: Hough transform, edge detection and isotropic surround suppression to identify significant landmark objects in post disaster conditions
Post-disaster communicationsSocial media, satellite, sensor web, GPS: GPSGeneral natural disaster [178,179,180]Network Science, CTA: team phone consisting of a self-rescue system and a messaging system
Digital humanitarianCrowdsourced text data, Twitter data: TwitterEarthquake [164]Haiti: chi-square method for content analysis
RecoveryRelief missionsEM-DAT database: statistical analysisEarthquake [181,182,183]Center for Research on the Epidemiology of Disasters (CFRED): big data analysis to analyze the role of various factors in increasing the death toll of natural disasters
Sentiment analysis in the disaster recovery processTwitter Data: Apache Spark big data framework, Python languageFlood [29]India, Pakistan: sentiment analysis to determine the needs of people during the disaster

