1. Introduction
Citrus limonoids (
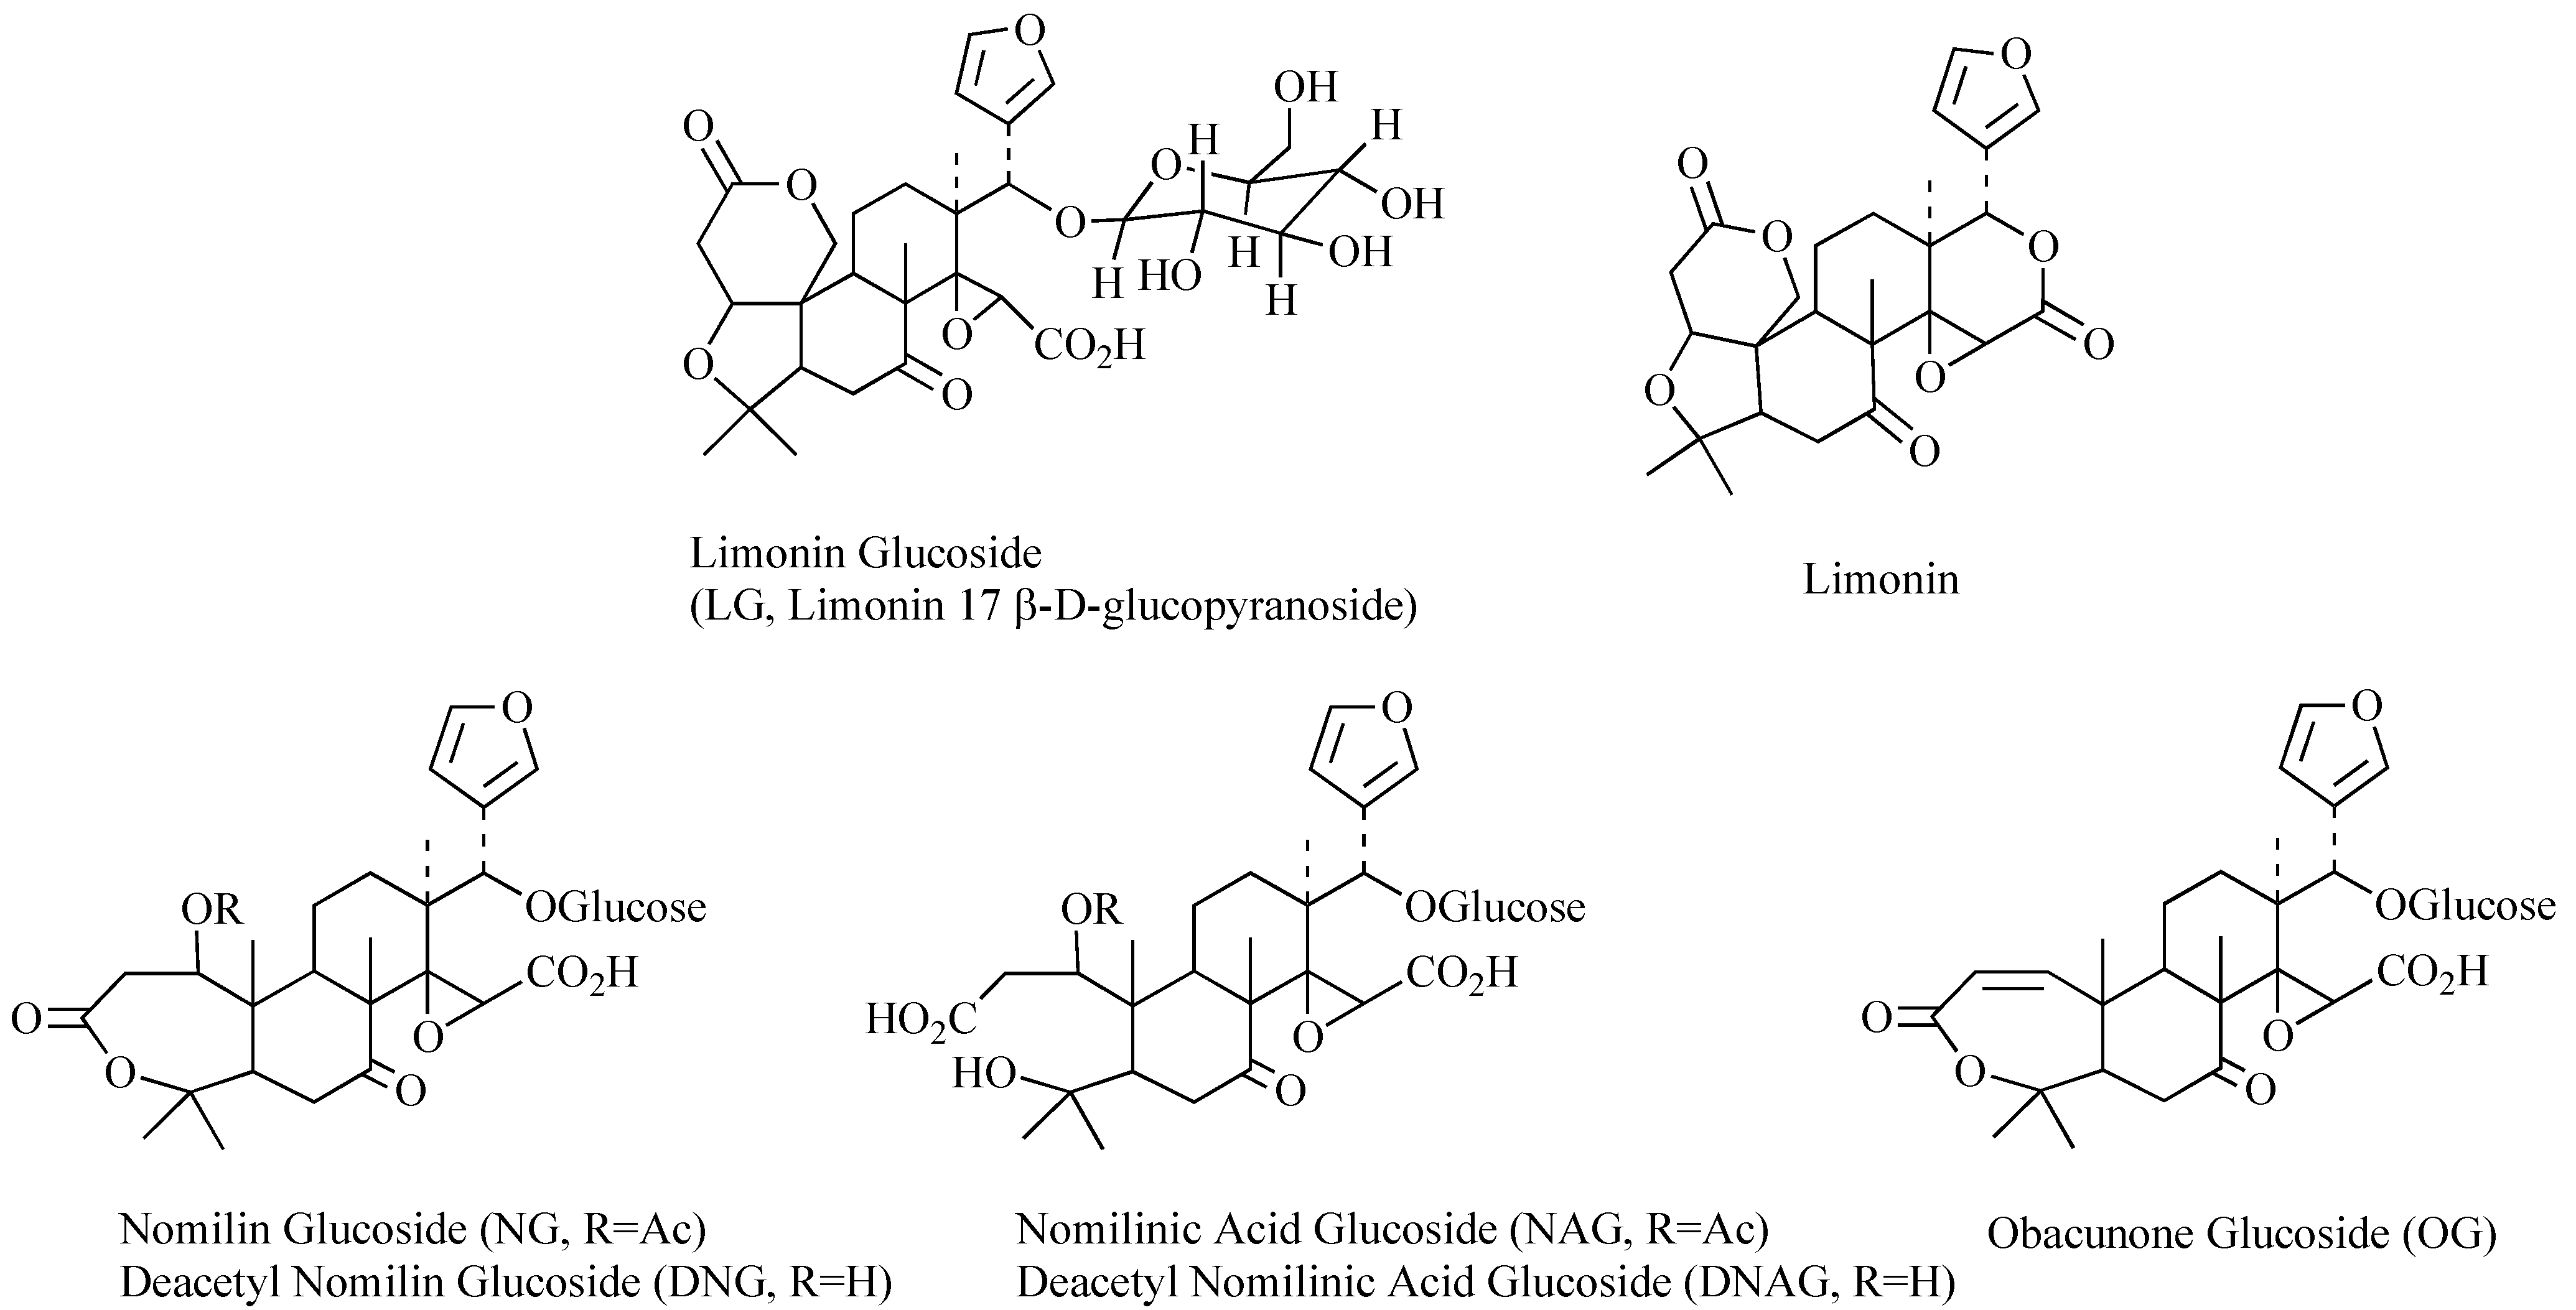
Figure 1) are complex triterpenoid compounds reported to possess a number of biological activities and contribute to the quality of citrus fruits and juices [
1]. These compounds are found in significant quantities in a variety of citrus tissues as aglycones, glucosides, or A-ring lactones [
2]. In juices prepared from mature fruits, limonoid glucosides are the most abundant limonoids and range in concentrations from 150 to 300 ppm [
3,
4]. Because of their abundance and relevance to citrus quality, capillary electrophoresis (CE) [
5,
6], high-pressure liquid chromatography (HPLC) [
4,
7,
8], liquid chromatography coupled to mass spectrometry (LC-MS) [
9,
10,
11,
12], and thin layer chromatography (TLC) [
4] methods have been developed to detect, identify and quantify these compounds. Each of these methods has its own inherent advantages and disadvantages. CE and HPLC methods require extensive sample preparation to eliminate interfering compounds because they rely on the inherently weak UV absorbance of limonoids at 200–210 nm. LC-MS methods have also been widely developed, including a rapid method developed by our lab based on a phenyl stationary phase [
12]. The drawback to LC-MS methods is that they require access to or the capital investment in an MS detector. TLC was one of the earliest methods applied to the analysis of limonoid glucosides, however it is labor intensive and requires trained analysts in order to be used as a quantitative method. One advantage of TLC analysis is that its reliance on colorimetric detection overcomes some of the limitations of UV-based detection.
Figure 1.
Chemical structures of citrus limonoid glucosides.
Figure 1.
Chemical structures of citrus limonoid glucosides.
In the presence of Ehrlich’s Reagent, citrus limonoid glucosides are known to form red-colored reaction products. Due to its specificity, this reaction is routinely used as a colorimetric method for the identification and quantification of citrus limonoid glucosides in extracts [
13] or in combination with TLC analysis [
4]. Although Ehrlich’s reagent and the active component in the reagent responsible for the formation of the chromophore, 4-dimethylaminobenzaldehyde (DMAB), have been adapted for use in post-column reaction systems [
14], there have been no reports describing the adaption of this reagent for use in the post-column detection and quantification of citrus limonoid glucosides. Described within this report is a method for the quantification of the most common limonoid glucosides found in citrus juices using phenyl based chromatography coupled with post-column reaction with Ehrlich’s Reagent.
2. Results and Discussion
This method’s development builds on previous off-line colorimetric determinations of limonoid glucosides using Ehrlich’s reagent, and chromatography developed for limonoid glucosides on a phenyl stationary phase. Limonoid glucosides were selected as our target compound class because, of the common citrus limonoid compounds, they are most abundant in ripe fruits and hardest to detect without using MS. While aglycones are appreciably more abundant in citrus, they are more readily extracted and thus free from interfering compounds for quantification by UV without chromophore addition.
Our initial concerns in combining Ehrlich’s reagent with HPLC were pumping the viscous reagent solution, and mixing the strong acid with an aqueous HPLC eluent. We needed the reagent to pump fast enough to match the HPLC flow, and for the two parts to mix readily. Using well plates, we revisited the absorbance spectra of DMAB/LG complexes formed using well plate conditions. We found 523 nm provided a reliable measurement of color intensity, and responded linearly to sample concentration. We then used this wavelength to measure trials of Ehrlich’s reagent prepared in less viscous solutions. With methanol and reduced acid content, DMAB no longer formed colored complexes with LG. We also tried increasing the concentration of DMAB in the reagent solution, so a lower volume could be delivered but still achieve the same ratio of substrate to reagent. At higher concentration, the reactivity of DMAB with LG plateaued with increasing concentration. Because increasing concentration and changing solvent to reduce viscosity were unsuccessful, we began testing the Ehrlich’s reagent in the post-column reactor (PCR) to find its flow limitations. The pressure safety features of the PCR system limited the Ehrlich’s reagent flow to 0.4 mL min
−1. To create a ratio similar to the 1:1.49 ratio found in the well plate, we reduced the HPLC method flow rate to match 0.4 mL min
−1. This increased the time on column and over-all analysis time (compared to the MS method) [
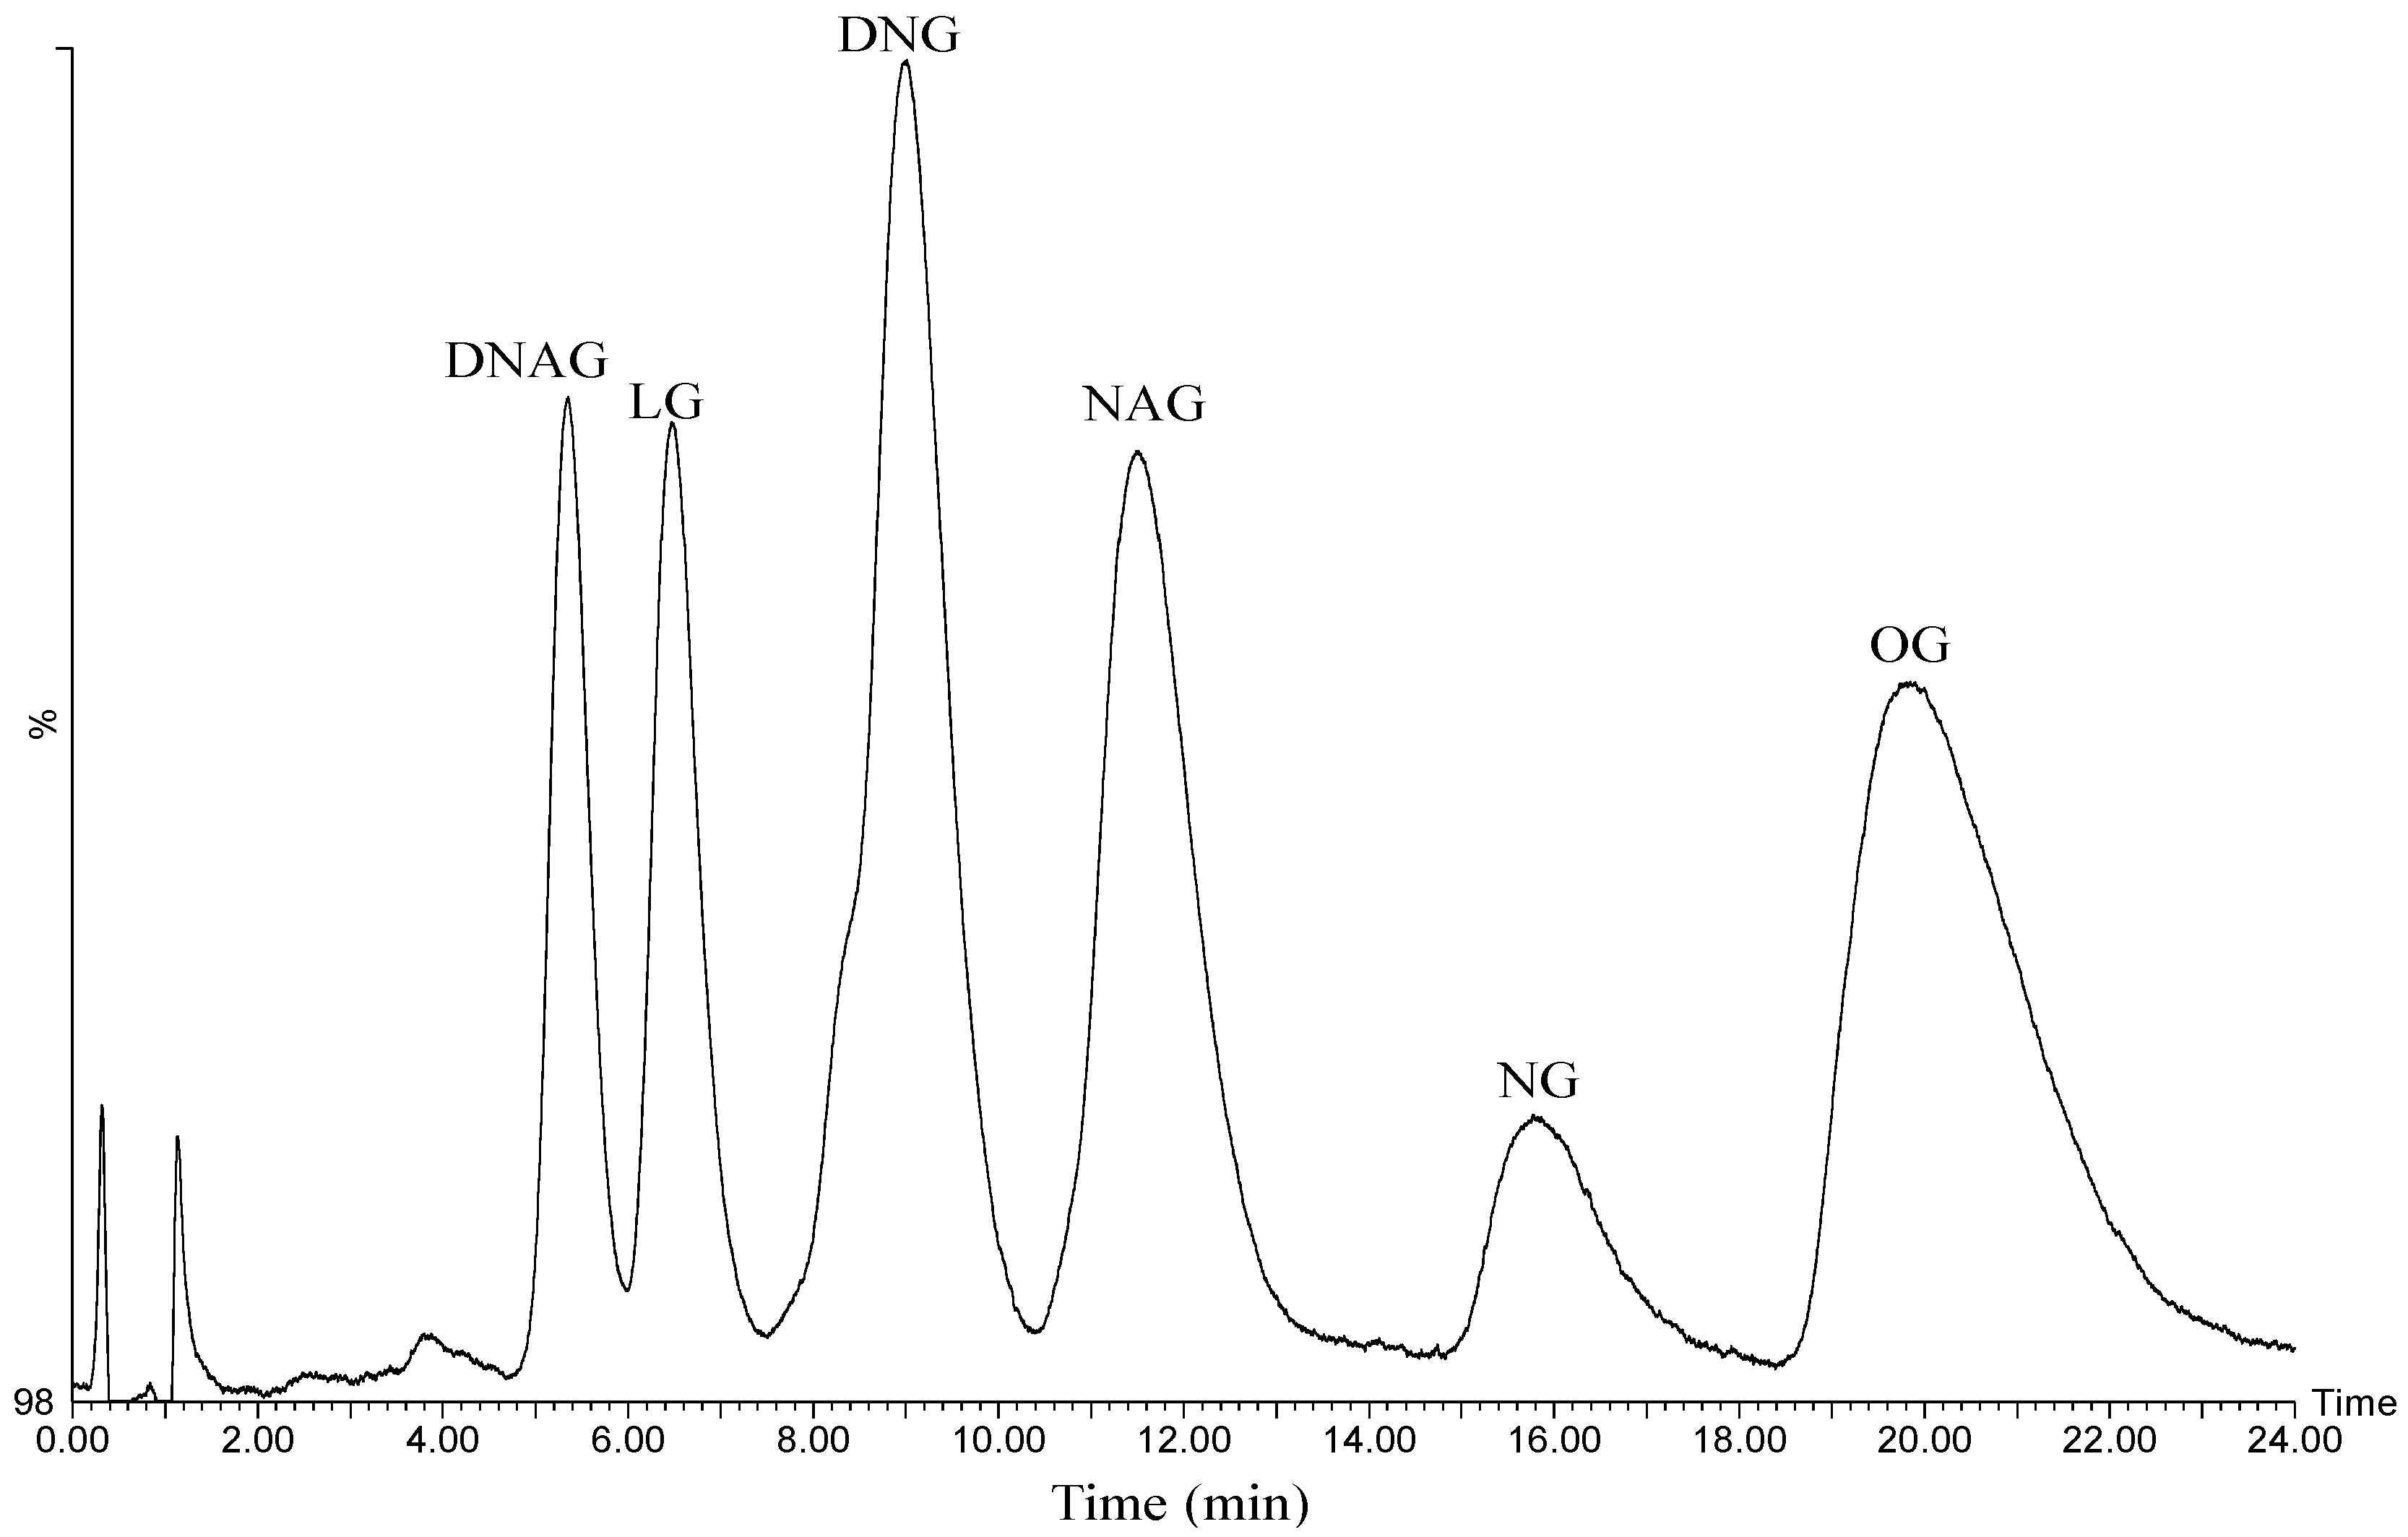
12], but as seen in
Figure 2, the six compounds of interest are still well resolved. These adjustments gave us a 1:1 ratio of HPLC eluent and PCR reagent that pump and mix reliably and produce a clean chromatograph.
Figure 2.
Chromatogram showing the detection (λ = 523 nm) of six limonoid glucosides following post-column reaction with Ehrlich’s reagent. The y-axis represents the percentage of signal on a 1volt scale of the Waters SAT/IN A/D Module.
Figure 2.
Chromatogram showing the detection (λ = 523 nm) of six limonoid glucosides following post-column reaction with Ehrlich’s reagent. The y-axis represents the percentage of signal on a 1volt scale of the Waters SAT/IN A/D Module.
To maximize the rate of reaction during the time the reagent/sample mix traveled from reactor to detector, we tested elevated reactor temperatures from 30 °C to 150 °C, selecting 80 °C which was the maximum temperature producing a linear increase in DMAB/LG complex formation. Using a reduced HPLC flow rate, elevated reactor temperature, and original reagent concentration, we obtained a linear response across the full range of the assay (
Table 1).
Table 1.
Summary of method characteristics.
Table 1.
Summary of method characteristics.
| Attribute | Value |
|---|
| Limit of detection (on column) | 50 ng |
| Limit of quantification (on column) | 250 ng |
| Linear range | 25 to 5000 mg/L |
| Recommended range | 25 to 2000 mg/L |
| Typical
R2 | 0.998 |
| Range of inter-run variability (%CV) | 0.8% to 6.9% |
| Range of inter-day variability (%CV) | 3.4% to 9.8% |
| Spike recovery (10 to 25 mg/L spiked) | 97.8% to 111.7% |
| Spike recovery (50 mg/L) | 95.0% to 106.5% |
| Spike recovery (100 mg/L) | 96.7% to 103.7% |
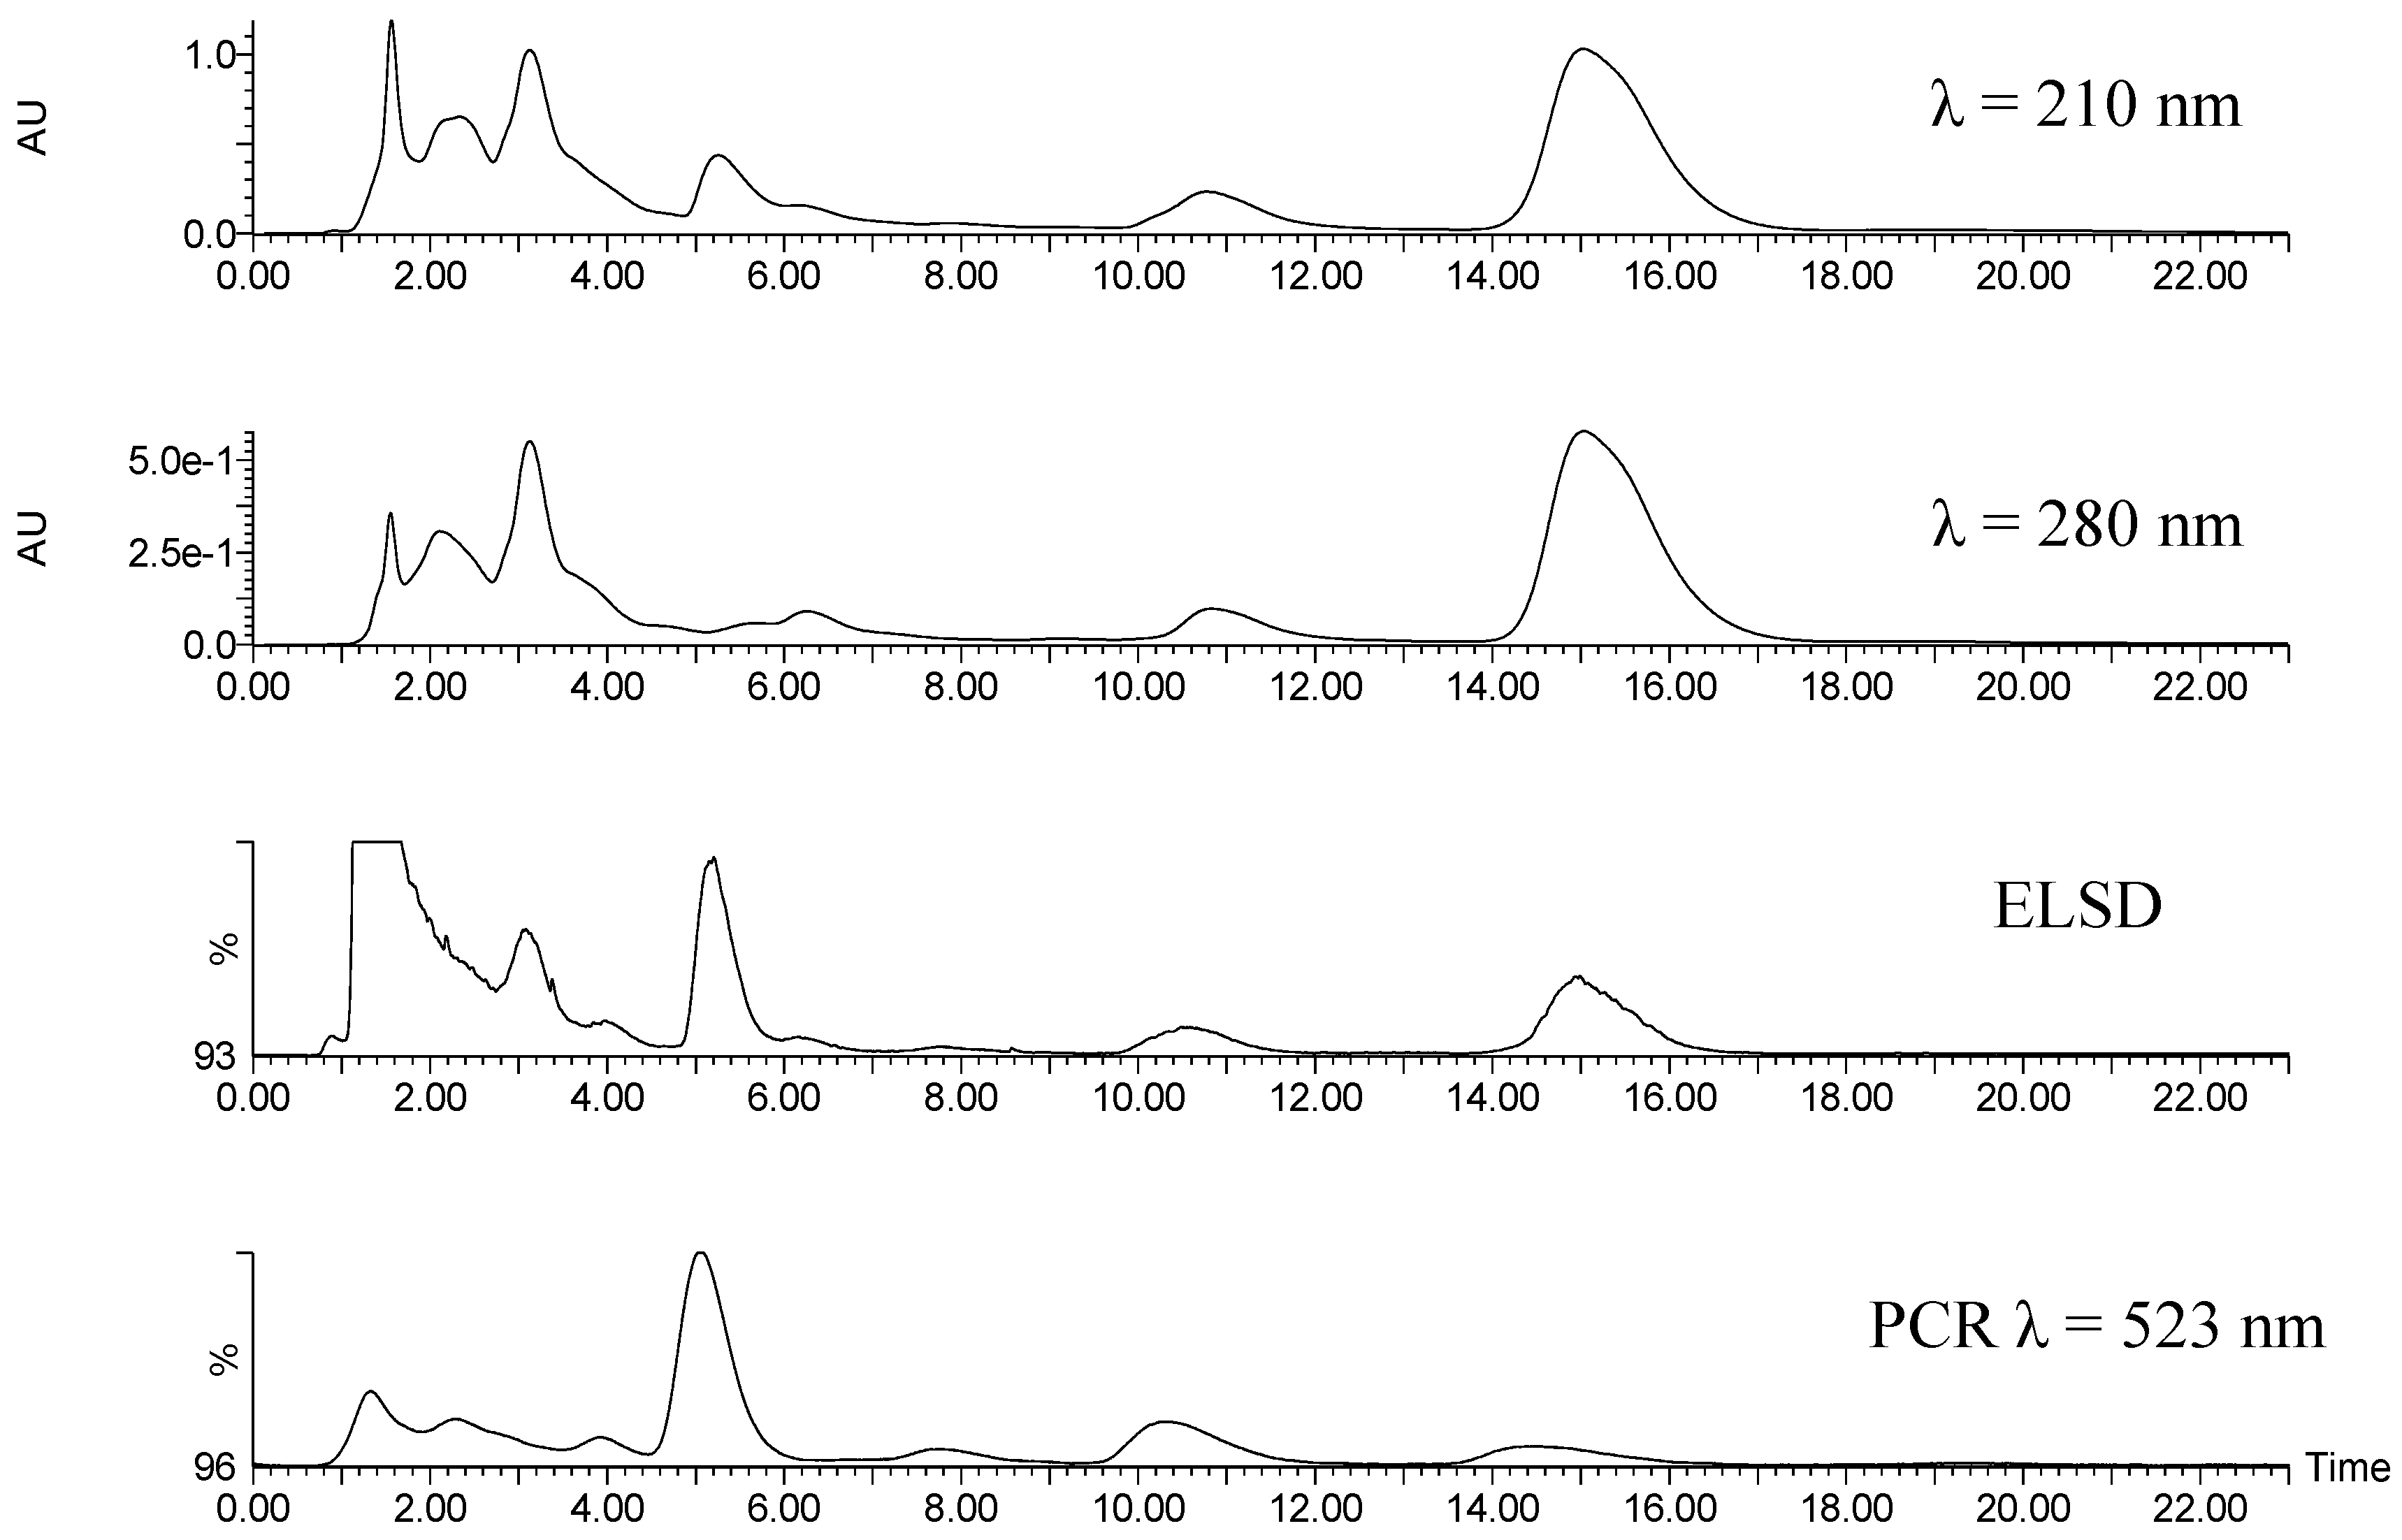
Figure 3 is a comparison of HPLC detection methods used in method development. The specificity of the Ehrlich’s reaction was shown to consistently provide differentiation between limonoid glucosides and other groups of co-eluting compounds. Comparing the peak areas at retention time =15 min for the three detectors in
Figure 3, more signal is seen in the evaporative light scattering detector (ELSD) and at 210 nm/280 nm in the diode array detector (DAD), than at 523 nm after reaction with Ehrlich’s reagent. This is due to other compounds coeluting with NG, but not reacting with the Ehrlich’s reagent. This (and other peak area differences between detectors) may be due to coeluting compounds such as the flavonoid glucosides rutin, narirutin and hesperidin—the latter is known to coelute with NG during reverse phase chromatography [
4]. Hesperidin can be enzymatically degraded to overcome this coelution, but no additional sample prep is required in our method because Ehrlich’s is selective for NG.
Figure 3.
UV (λ = 210 nm and 280 nm), evaporate light scattering, and post-column reaction (monitored at λ = 523 nm) chromatograms obtained for clarified and solid phase extraction (SPE) treated Valencia orange juice samples demonstrate the specificity of the post-column reaction detection method. The y-axis of the evaporative light scattering detector (ELSD) and post-column reactor (PCR) chromatograms represents the percentage of signal on a 1volt scale of the Waters SAT/IN A/D Module.
Spike recovery experiments yielded high recovery of LG in each citrus type tested (
Table 1). Spike concentrations varied to represent the various levels naturally present across the varieties tested. Low levels (10 mg L
−1) spiked into lime and lemon varieties were recovered equally as well as high levels (100 mg L
−1) spiked into orange varieties. This further supports the method’s performance for diverse citrus samples.
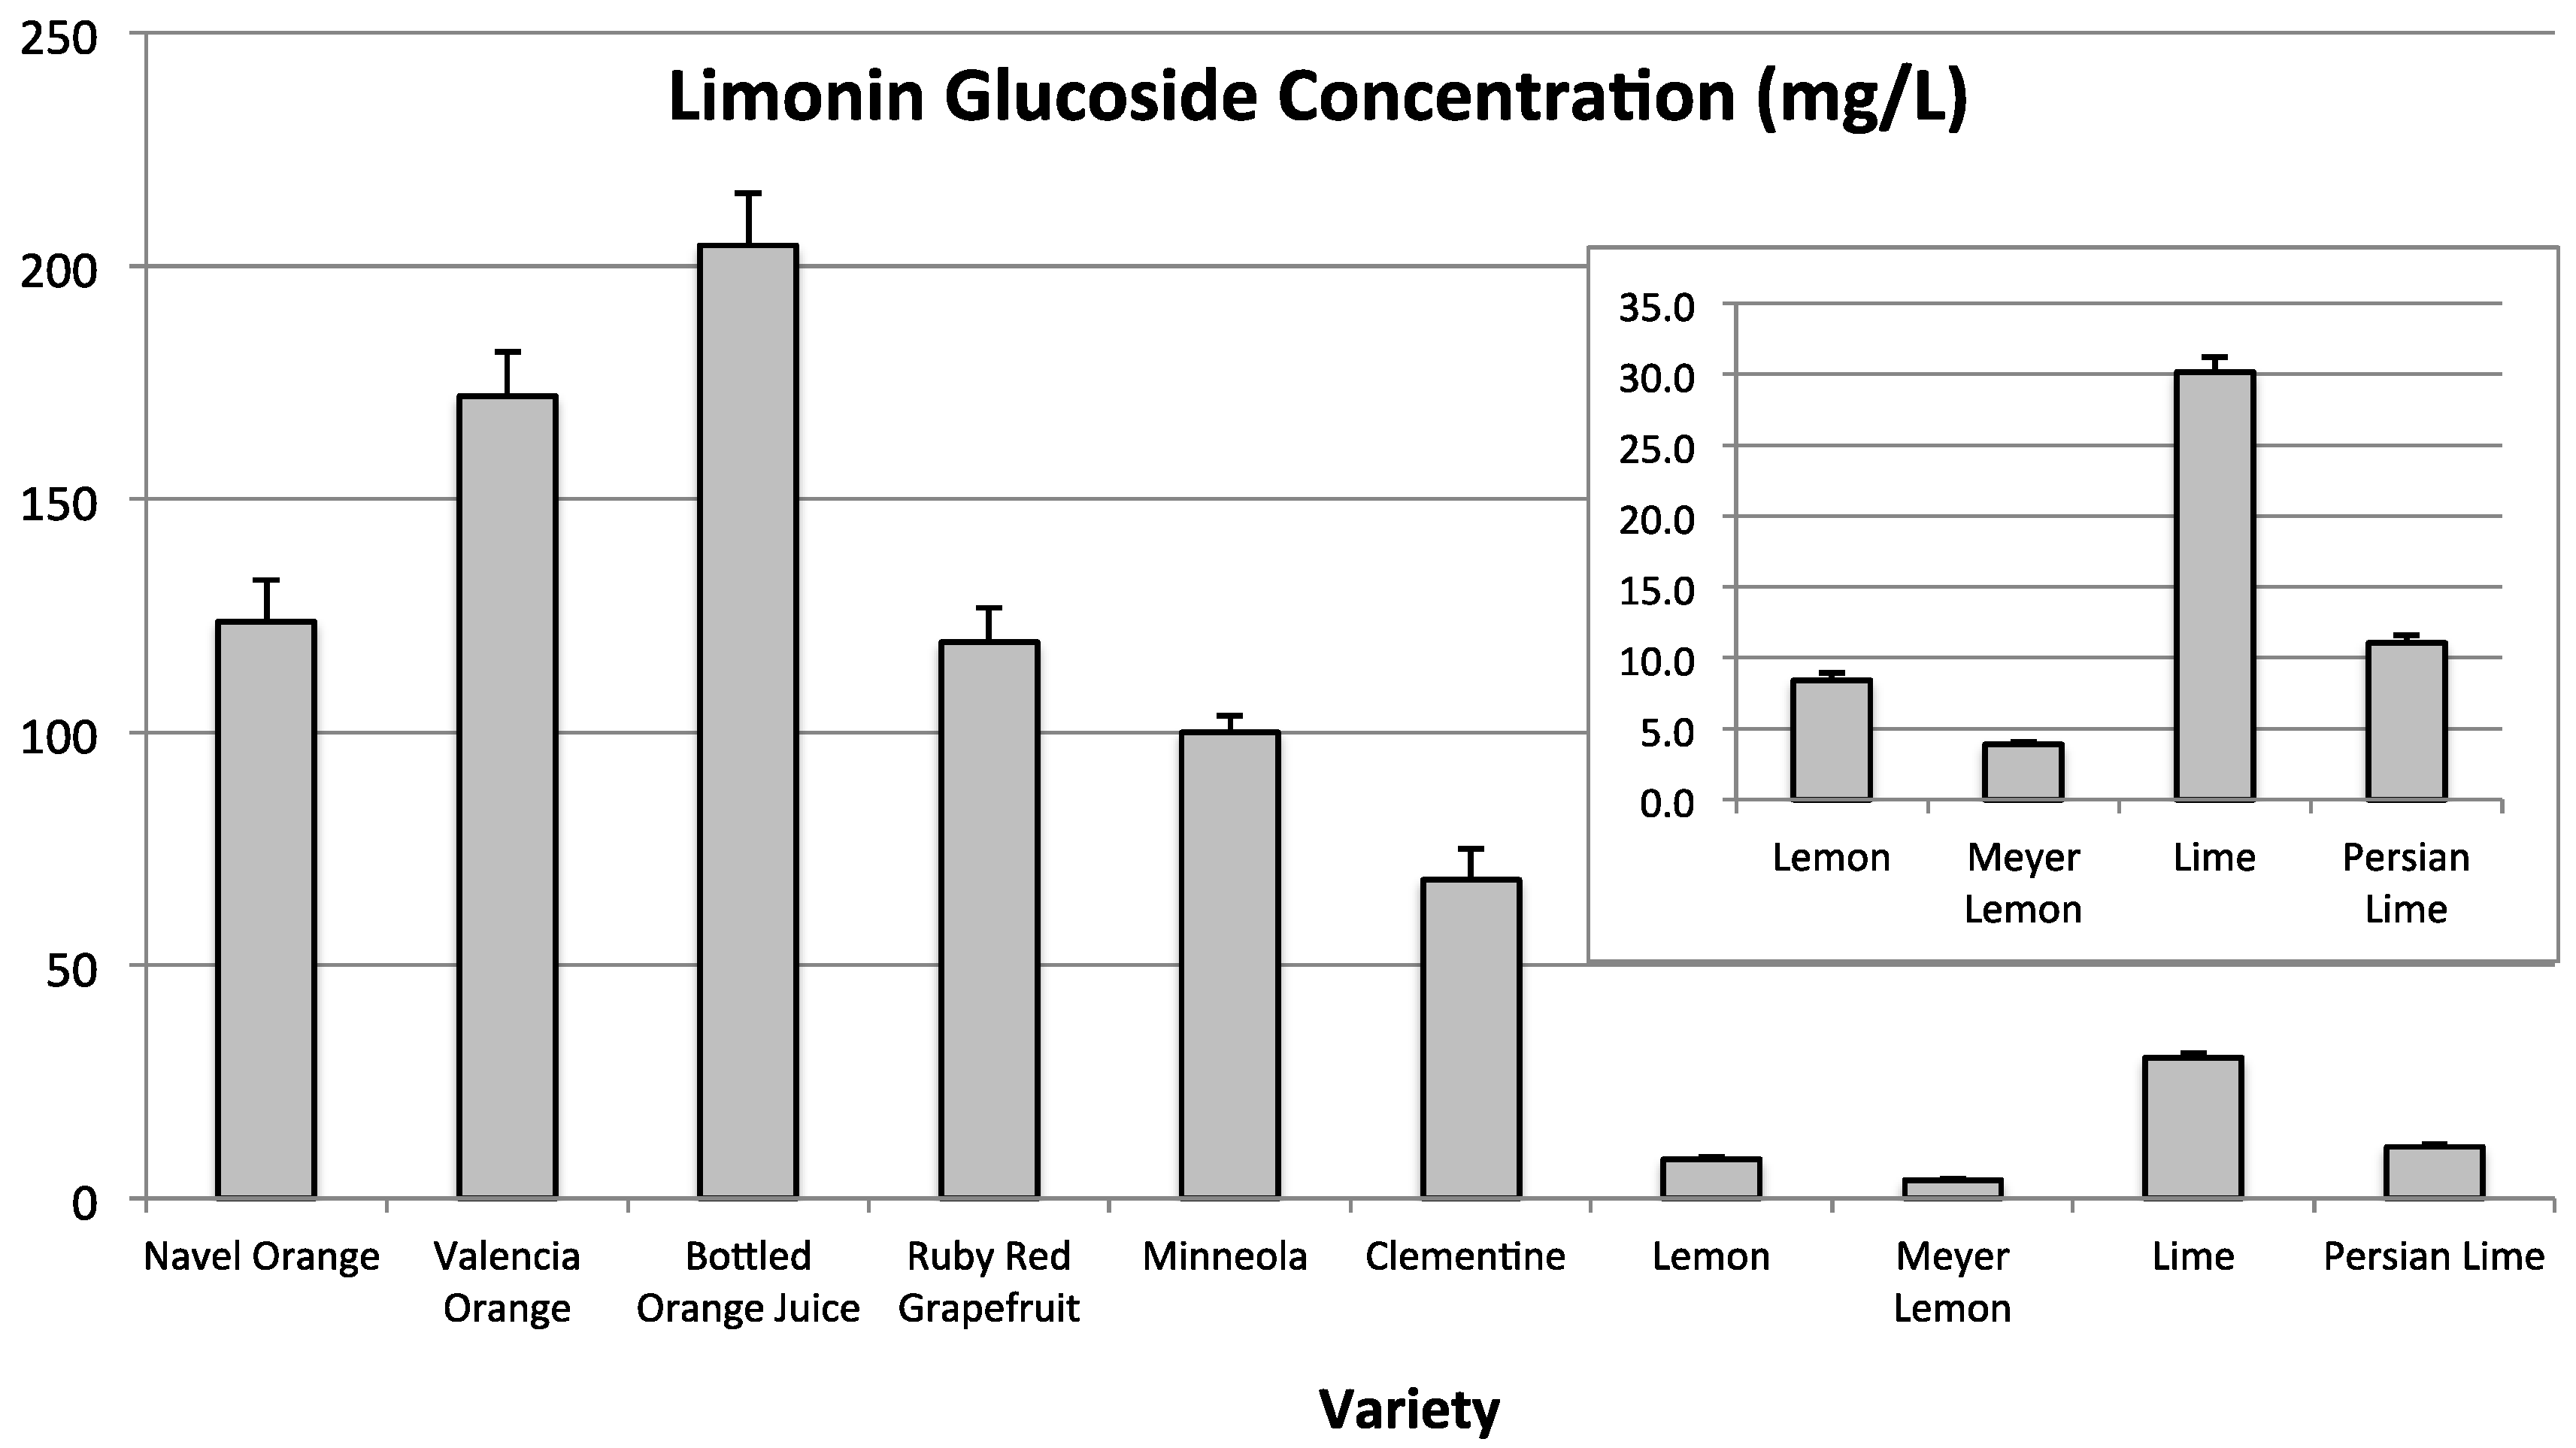
LG was not quantitated in blood orange. The anthocyanins present in blood oranges absorb in the 520 nm range and coeluted with LG, which the method was unable to differentiate. LG was quantitated in all other citrus varieties tested (
Figure 4). LG was highest in sweet orange juices (204.3 ± 11.1 mg L
−1 to 123.8 ± 9.0 mg L
−1), followed by Ruby Red grapefruit (119.2 ± 7.4 mg L
−1), and then tangerine juices (100.0 ± 3.6 mg L
−1 and 68.4 ± 6.7 mg L
−1). Concentrations of LG were lowest for lime and lemon varieties, with lime being the highest (30.2 ± 1.0 mg L
−1) and Meyer lemon the lowest (3.9 ± 0.2 mg L
−1) in LG among lime/lemon type citrus.
Figure 4.
Limonin glucoside concentrations (mg L−1) found in a number of Citrus varieties. Inset is a magnification of the same graph from 0 to 35 mg L−1 for samples with limonin glucoside concentrations less than 35 mg L−1.
Figure 4.
Limonin glucoside concentrations (mg L−1) found in a number of Citrus varieties. Inset is a magnification of the same graph from 0 to 35 mg L−1 for samples with limonin glucoside concentrations less than 35 mg L−1.
The detection and quantitation of the other common limonoid glucosides varied across varieties (
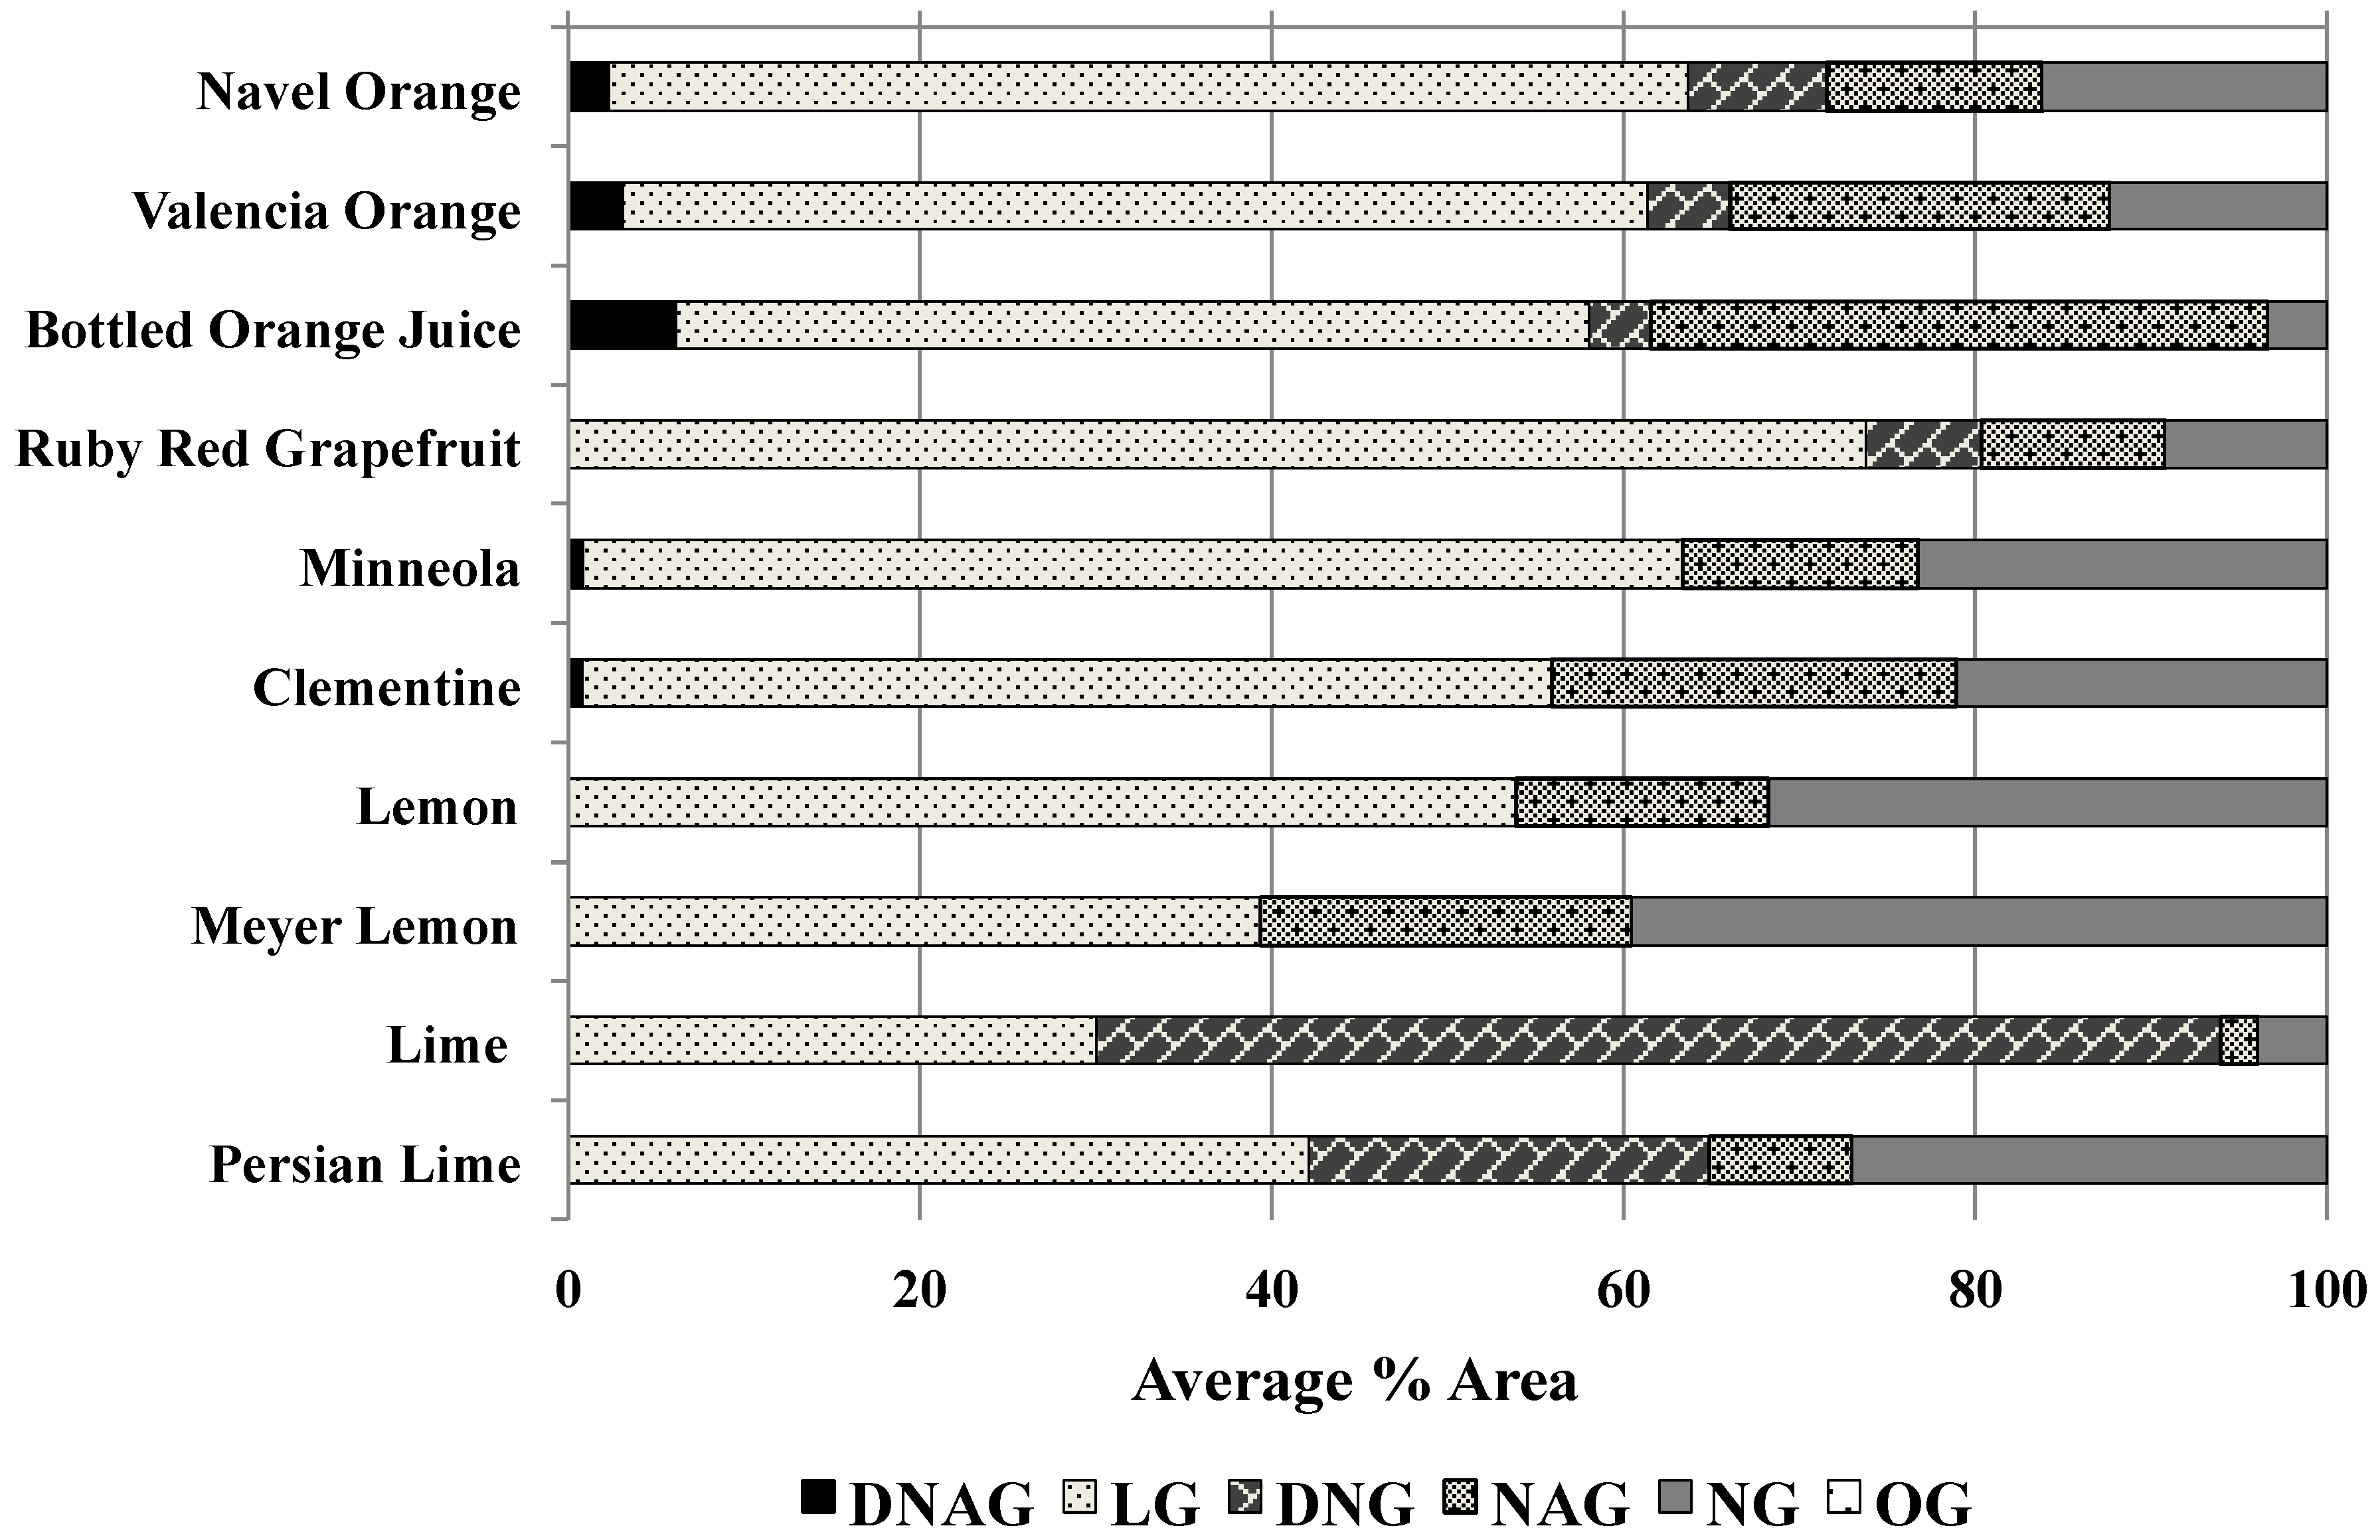
Figure 5). Spike recovery experiments with lime, lemon, and grapefruit samples using DNAG, DNG, and NAG revealed that these sample types required greater scrutiny than orange type samples. DNAG was undetected in Ruby Red grapefruit samples. Both lime and lemon varieties were also lacking DNAG, but contain an Ehrlich’s reactive compound that elutes immediately adjacent to the expected DNAG elution window (data not shown). Lime samples also had an unknown peak eluting between DNG and NAG (data not shown). Lemon samples only contained trace amounts of DNG. Lime, Persian lime, and Meyer lemon were also differentiated from orange varieties by the relative abundance of LG compared to other compounds. In lime, DNG is the most abundant (63.9% peak area), and in Meyer lemon LG (39.4% peak area) is matched by NG (39.6% peak area).
Our purpose was to develop a robust method for the detection and quantification of limonoid glucosides without the use of mass spectroscopy. Our method facilitates the inline reaction of Ehrlich’s reagent with limonoid glucosides, allowing detection to be carried out by UV absorbance at a fixed wavelength. The equipment required to facilitate the reaction and detection of the desired analytes under these conditions is generally less expensive than MS detectors and more commonly available. All six common limonoid glucosides reacted with Ehrlich’s reagent under the prescribed conditions (
Figure 2). The method is further strengthened by an equivalent reaction across all six compounds, allowing for quantitation based on LG, which is commercially available.
Future work could involve concentrating Ruby Red grapefruit similarly to lime and lemon samples, for better quantification of trace compounds. Additional sample preparation, or modification of the chromatography to separate anthocyanins from LG could potentially resolve the complication encountered in analyzing blood oranges.
Figure 5.
Relative percent limonoid glucoside contents found in juice samples as determined using the post-column reaction method. Results represent the average obtained from three independent experiments. Percent concentration values for individual limonoid glucosides were calculated by dividing the peak area measured for that glucoside by the total area measured for all the limonoid glucosides detected during the run.
3. Experimental Section
3.1. Materials
3.1.1. Plant Materials
Citrus fruits for this study were purchased from a local grocery store. Fruits were cut in halves vertically and squeezed by hand using a plain juicer. Minneola fruits were from Florida. Limes were from Mexico. Ruby Red Grapefruits were from Texas and all other varieties were from California. The juice from 3 or more fruits was collected in a beaker partially immersed in ice. The juice was homogenized by swirling, transferred to 15-mL conical tubes and then immediately flash-frozen using dry ice. The frozen juice samples were stored at −80 °C. The sample of commercially bottled orange juice was stored at 4 °C.
3.1.2. Reagents and Standards
HPLC grade acetonitrile and methanol, formic acid (88%, ACS reagent grade), acetic acid (glacial), perchloric acid (69%–72%, JT Baker, Phillipsburg, NJ, USA), hydrochloric acid (certified ACS Plus), and 4-dimethylaminobenzaldehyde (DMAB) (99+%, Acros Organics, Geel, Belgium) were purchased through Fisher Scientific Ltd. (Waltham, MA, USA). Water was deionized to ≥18.1 MΩ/cm resistance using a Barnstead NANOpure Deionization System (Dubuque, IA, USA) and filtered through a 0.45 µm type HA membrane filter (Millipore, Billerica, MA, USA) before use. Pure crystalline limonin glucoside (LG) was available in our laboratory from previous studies [
15]. Other limonoid glucosides used in this study were available as mixtures or obtained from extracts prepared from citrus juice, peels, or seeds.
3.2. Sample Preparation
Cryopreserved juice samples were thawed in a 20 °C water bath for 20 min and then clarified by centrifugation (2087× g, 5 min, at room temperature) using a Marathon 8K from Fisher Scientific (Fair Lawn, NJ, USA). For the direct analysis of clarified samples, 1 mL of the supernatant was filtered through a 0.2 µm Nalgene nylon membrane syringe filter (Fisher Scientific, Fair Lawn, NJ, USA) immediately before injection into the HPLC system.
3.3. Instruments
A Waters (Milford, MA, USA) model 2695 Separations Module was the HPLC system used in this study. HPLC detectors used in conjunction with the 2695 Separations Module included a Waters model 996 diode array detector, Waters model 2487 dual wavelength absorbance detector, a Linear UVIS-205 detector (San Jose, CA, USA) and Sedex 75 ELS detector (35 °C, 2.5 bar N2, S.E.D.E.R.E., Alfortville, France). Instrument control of the Waters 2695 and 996 detector, as well as data acquisition, were accomplished using Masslynx (Version 4.1). Secondary detectors (2487 dual wavelength, UVIS-205, or Sedex 75 ELS) were set manually. A Waters SAT/IN module was used to capture the analog signal from the secondary detector. The post-column reactor used in this study, a Scientific Systems Inc. model PCR2-R050-R015 (outfitted with Fluoroelastomer O-Ring Energizer seals), was purchased from GenTech Scientific (Arcade, NY, USA). A Molecular Devices Spectra Max Plus 384 detector (Sunnyvale, CA, USA) controlled using SoftMax Pro (version 5.4) was used for initial experiments to verify the absorbance maximums of the limonoid glucoside reaction products.
3.4. Method Development
Prior to initiating experiments with the post-column reactor system, the Ehrlich’s reagent was tested in two acid solutions (2:2 v/v hydrochloric acid: methanol and 4:5 v/v perchloric acid (70%): acetic acid (glacial)) and at various concentrations (31–626 mM DMAB). All method development experiments were carried out using LG. Test reactions were conducted in 96-well plates (96W microplate, PS, F-bottom. Greiner bio-one, Monroe, NC, USA) by combining 110 µL of blank or sample solution (125 and 5000 ppm) with 165 µL of Ehrlich’s reagent [
13]. Plates were read after five minutes at room temperature (21 °C) using a Molecular Devices Spectra Max Plus 384 detector. The optimal detection wavelength was also determined by collecting spectrum data using the plate reader.
In-line reaction of LG with Ehrlich’s reagent was facilitated by a Scientific Systems Inc. post-column reactor (model PCR2-R050-R015) coupled to a Waters 2695 HPLC. Injections of LG (125 ppm; injection vol. 10, 25, and 50 µL) were made without a column. Reagent flow rate was determined by the post-column reactor’s pressure limits. HPLC flow was adjusted to give a 1:1 mix of reagent and eluent. Temperature’s influence on formation of the limonin glucoside-DMAB reaction product was tested from 30 to 150 °C.
Isocratic mobile phase conditions and column temperature were used as previously described [
12]. Initial method development was carried out using a 50 × 2.0 mm Phenomenex Phenosphere-Next-5µ Phenyl column (Torrance, CA, USA) equipped with a guard column of the same stationary phase. After developing method parameters using only LG, the initial assay of orange juice showed the need for greater resolution between LG and other Ehrlich’s reactive components. In response the method was scaled to a 150 × 2.0 mm Phenomenex Phenosphere-Next-5µ Phenyl column (Torrance, CA, USA), which provided sufficient resolving power. The identities of the other Ehrlich’s-reactive limonoid glucosides in orange juice were confirmed by comparing retention times of the DMAB-reactive peaks found in orange juice to those obtained from the analysis of limonoid glucoside standards or mixtures of limonoid glucosides, and through spiking experiments.
The ability of the method to quantitate the six limonoid glucosides (DNAG, LG, DNG, NAG, NG, and OG) in clarified juice was tested using a diverse set of citrus juices. Relative DMAB reactivity of the several limonoids was compared to the reactivity of LG by comparing the pre-reaction area ratio at 210 nm with the post-reaction area ratio at 523 nm.
Three detectors were evaluated for their effectiveness as secondary detectors: a Waters 2487 dual wavelength detector (single wavelength mode, 523 nm), UVIS 205 (523nm), and Waters 996 diode array detector (520–525 nm). A Waters 996 detector was also used before the post-column reactor to monitor UV active matrix components. The 996 detector proved most effective monitoring pre-reaction absorbance, and both the Waters 2487 and UVIS 205 gave comparable post-reaction quantitation.
3.5. Finalized Method Conditions
The finalized method facilitates separation of DNAG, LG, DNG, NAG, NG, and OG in 24 min using a 150 × 2.0 mm Phenomenex Phenosphere-Next-5µ Phenyl column and guard column maintained at 30 °C (
Figure 2). The isocratic elution is carried out with 15% acetonitrile, 85% 4 mM formic acid in water, flowing at 0.40 mL min
−1. The injection volume is 10 µL. Flow from the column passes through the Waters 996 detector and then on to the first mixing tee of the post-column reactor, where it is combined with a 0.40 mL min
−1 flow of 248 mM Ehrlich’s reagent (4:5 perchloric acid (70%):acetic acid (glacial)). The combined flow enters the heated (80 ± 2 °C) 0.50 mL path volume reactor block and then flows out to the secondary detector (λ = 523 nm).
The low organic content of the isocratic mobile phase results in the gradual buildup of less polar compounds on the stationary phase. A gradual shift towards shorter retention times for the glucosides is an indication that the column needs to be washed. In order to avoid this situation, we washed the Phenosphere-Next-5µ Phenyl column with acetonitrile:water (65:35) after every thirty sample analyses. Washing the column with 17 column volumes was sufficient to remove less polar components and restore column performance.
3.6. Evaluation of LOD, LOQ, Inter-Run and Inter-Day Variability, and Spike Recovery of Limonin Glucoside
Limonin glucoside was used to empirically determine the limits of detection (LOD) and quantitation (LOQ) for the method. The LOD was set as the lowest on column quantity that could be detected consistently above the baseline. The LOQ was set as the lowest on column quantity that could be determined repeatedly with standard deviation values representing less than 10% CV. The LG content in ten samples was evaluated in triplicate on three consecutive days to evaluate inter-run and inter-day variability of the method. Spike recovery of LG was carried out in clarified Valencia orange samples and SPE concentrated Navel orange, lime, lemon, Ruby Red grapefruit, and Clementine samples. In spike experiments, samples were concentrated by SPE to meet detection limitations, and then spikes of limonin glucoside were added at concentrations of 10, 25, 50 and 100 mg L−1. To calculate the percent recovery, the observed concentration was divided by the expected concentration and resulting product multiplied by 100%.
3.7. Statistical Analysis
All the experiments and HPLC analysis were carried out in triplicates and the results were expressed as average and S.D. values. Regression analysis was conducted using the QuanLynx module of MassLynx (4.1).


