Fruit Spirit Production from Coffee Cherries—Process Analysis and Sensory Evaluation


1
Yeast Genetics and Fermentation Technology, Institute of Food Science and Biotechnology, University of Hohenheim, Garbenstraße 23, 70599 Stuttgart, Germany
2
Tropics and Subtropics Group, Institute of Agricultural Engineering, University of Hohenheim, Garbenstraße 9, 70599 Stuttgart, Germany
*
Author to whom correspondence should be addressed.
Beverages 2020, 6(3), 57; https://0-doi-org.brum.beds.ac.uk/10.3390/beverages6030057
Submission received: 7 August 2020
/
Revised: 3 September 2020
/
Accepted: 11 September 2020
/
Published: 16 September 2020
Abstract
:Coffee fruit production is an important agricultural sector in more than 70 tropical countries. However, the production of fruit spirits based on coffee fruits has not been investigated to date. This study evaluated, for the first time, its fermentation and distillation performance, ethanol yield and sensorial attributes. A selected yeast strain (Saccharomyces cerevisiae L.) fermented coffee cherry mash within five days and produced ethanol concentrations of 31.0 g/L. The mash was distilled and distillate fractions were categorized for heads/hearts/tails by sensory evaluation, resulting in an ethanol mass ratio of 1.0:4.2:0.8 with a total yield of 1.8% (w/w) ethanol based on coffee cherry mash. Analysis of fermentative volatiles indicated comparatively high methanol contents of 26 ± 4 g/L ethanol in the hearts fraction. Sensory evaluation of the hearts fraction resulted in 15 spirit specific descriptors, with vegetal and nutty indicating the most important terms to describe the perception of coffee cherry spirit. The results suggested that there is a high potential to introduce a fruit spirit based on coffee fruits.
1. Introduction
Fruit spirits are obtained by the fermentation and distillation of grain or fruit substrates. Traditional spirit drinks in the market are often based on regional traditions and substrates, such as Scottish whisky [1], Italian grappa [2], Cuban rum [3], Brazilian cachaça [4], French eau-de-vie [5], Spanish orujo [6] or Portuguese bagaceira [7]. Further, many traditional fruit spirit drinks are based on stone fruits, for instance Polish slivovitz [8], German Black Forest cherry spirit (Kirsch) [9], or Serbian fruit spirits based on apricots or peaches [10].
In recent decades, the industry of distillates showed a large interest in introducing new fruit spirits from unusual substrates that enable the acquisition of different flavors. The acquisition of new or different spirit flavors is important to establish new markets. Based on this interest, recent scientific studies focused on the qualitative production of fruit spirits based on novel commodities. For instance, [11] discussed the production of spirit from jabuticaba (Myrciaria cauliflora Mart.) and [12] reported on spirit production from orange juice (Citrus sinensis L.). A further agricultural raw material for this purpose could be present in coffee cherries. Coffee cherries have the morphology of stone fruits and contain two seeds within an outer fleshy part. Coffee is an important commodity to several tropical regions and of great economic importance. More than 70 tropical countries extensively produce coffee fruits with major impacts on the regional economy and global coffee trades [13]. The main objective of coffee fruit production is to meet the global demand for brewed coffee as a luxury beverage. Annual global coffee bean production is estimated at eight to ten million tons [14,15]. The processing of coffee cherries into coffee beans is rather complex and generates a variety of waste. During the processing of ripe coffee cherries, the outer fruit gets separated into different parts such as peel, fruit pulp and husk. All parts have already been investigated as a biomass sources for the production of value-added products [16]. Coffee pulp represents the most abundant waste obtained after fruit pulping, a process that separates the seeds from the rest of the fruit. Ripe coffee cherries contain >43% (w/w) pulp [17], resulting in huge amounts of pulp as a by-product during coffee bean processing. Due to the content of caffeine, polyphenols and tannins, the pulp biomass can cause environmental problems in coffee-producing countries and has limited application as a fertilizer, livestock feed or compost [17]. Therefore, the utilization of the entire fruit in food process chains could be of great interest.
Overall, this indicates great substrate resource volumes and possibilities to introduce a process chain for a novel spirit drink based on coffee fruits. To the best of our knowledge, the production of fruit spirits based on whole coffee fruits has not been investigated to date. Therefore, it is important to evaluate the potentials of coffee cherries for spirit drink production and to gain deeper insights into process performance, ethanol yields and sensory attributes.
Distilled fruit spirits consist of different volatile compounds that arise during fermentation, distillation and storage. The quality and quantity of these compounds are characteristic to specific fruit spirits. All compounds contribute positively or negatively to the total quality of the final product. Sensory descriptive analysis methods present a common feature to evaluate the sensory profiles of alcoholic beverages [18,19]. Spirit quality is commonly defined by the predominant presence and intensity of specific attributes. The Quantitative Descriptive Analysis (QDA) is the most frequently used method for product characterization in a sensory context [20]. It allows the identification and quantification of spirit-specific attributes by trained persons. The method includes a descriptive definition of qualitative components which define the sensory profile of a product [21], and the intensity of each descriptor by measuring attributes on a quantitative level. For the introduction of new products, this method presents options to identify spirit-specific descriptors, which predominantly define the products’ sensory attributes.
Given the trend towards new fruit spirits from unusual substrates, further research is needed to better inform producers and consumers about the processing and sensory attributes of coffee fruit (cherry) spirits. This study, therefore, investigated process parameters and quality aspects of a novel fruit spirit drink based on coffee cherries. This included the evaluation of fermentation and distillation process parameters of mashed coffee cherries. The product quality was assessed by analysis of fermentative volatiles in different distillate fractions and by sensory evaluation. The latter focused on establishing a spirit specific descriptor list and identifying the predominant sensory attributes of this novel product.
2. Materials and Methods
2.1. Raw Material
Ripe coffee (Coffea arabica L.) cherries were harvested on January 19th, 2019 in Doi Saket district in Chiang Mai, northern Thailand. Subsequently, coffee cherries were stored in a cooling facility at 2–8 °C for two weeks until February 3rd, 2019. The shelf life for fresh coffee cherries at ambient temperature is considered to be short, lasting one to two days. Therefore, transportation focused on a consistent cooling chain. A total of 30 kg of frozen coffee cherries were shipped in styrofoam boxes equipped with dry ice. After shipping, coffee cherries were stored at −24 °C at the Institute of Agricultural Engineering of the University of Hohenheim (Stuttgart, Germany).
For substrate characterization, samples were coffee-mill-ground (CM3260, Grundig Intermedia GmbH, Neu-Isenburg, Germany) and stored at −24 °C in plastic containers. The moisture content (MC) was analyzed according to standard method DIN EN 14774-3 [22]. The biomass ash content (AC) was determined as described in standard method DIN EN 14775 [23]. For physical weight and size measurements, 30 individual coffee cherries were selected and analyzed.
2.2. Mash Preparation
For mash preparation, 25.2 kg coffee cherries were defrosted (21 °C, 24 h), filled into a 25 L plastic drum (Mauser Packaging Solutions, Oak Brook, IL, USA) and thoroughly mixed with a mixing drill (product no. 6681, Schliessmann, Schwäbisch Hall, Germany). The mixing drill induced the separation of coffee pulp and beans (Figure 1). The pH was lowered to 3.1 by phosphoric and lactic acid addition (product no. 5862, Schliessmann, Schwäbisch Hall, Germany) to prevent microbial infection. Additionally, 1.5 mL pectinase Ultra-Fruit (product no 5055, Schliessmann, Schwäbisch Hall, Germany) was added to enhance substrate liquefaction. Selected yeast strains (product no 5828, Schliessmann, Schwäbisch Hall, Germany) were added to start mash fermentation. The drum was closed with an air-tight lid, metal snap-closure and a water-filled air-lock. After 24 h, the mash was again homogenized, and pH was adjusted to 3.0.
2.3. Fermentation Analysis
Fermentation analysis was performed by extracting a 15-mL liquid mash sample after the initial addition of yeast and then every 24 h for eleven days. Liquid samples were analyzed for sugar extract by a handheld refractometer (Carl Zeiss, Jena, Germany) with a range of 0–32° Brix. High-performance liquid chromatography with refractive index detection (HPLC-RI) was applied to quantify ethanol, fructose, glucose, sorbitol, glycerol and infection indicators lactic and acetic acid in the samples. The fermentation process was additionally analyzed for pH, mash temperature and respiratory weight loss.
2.4. Distillation Process
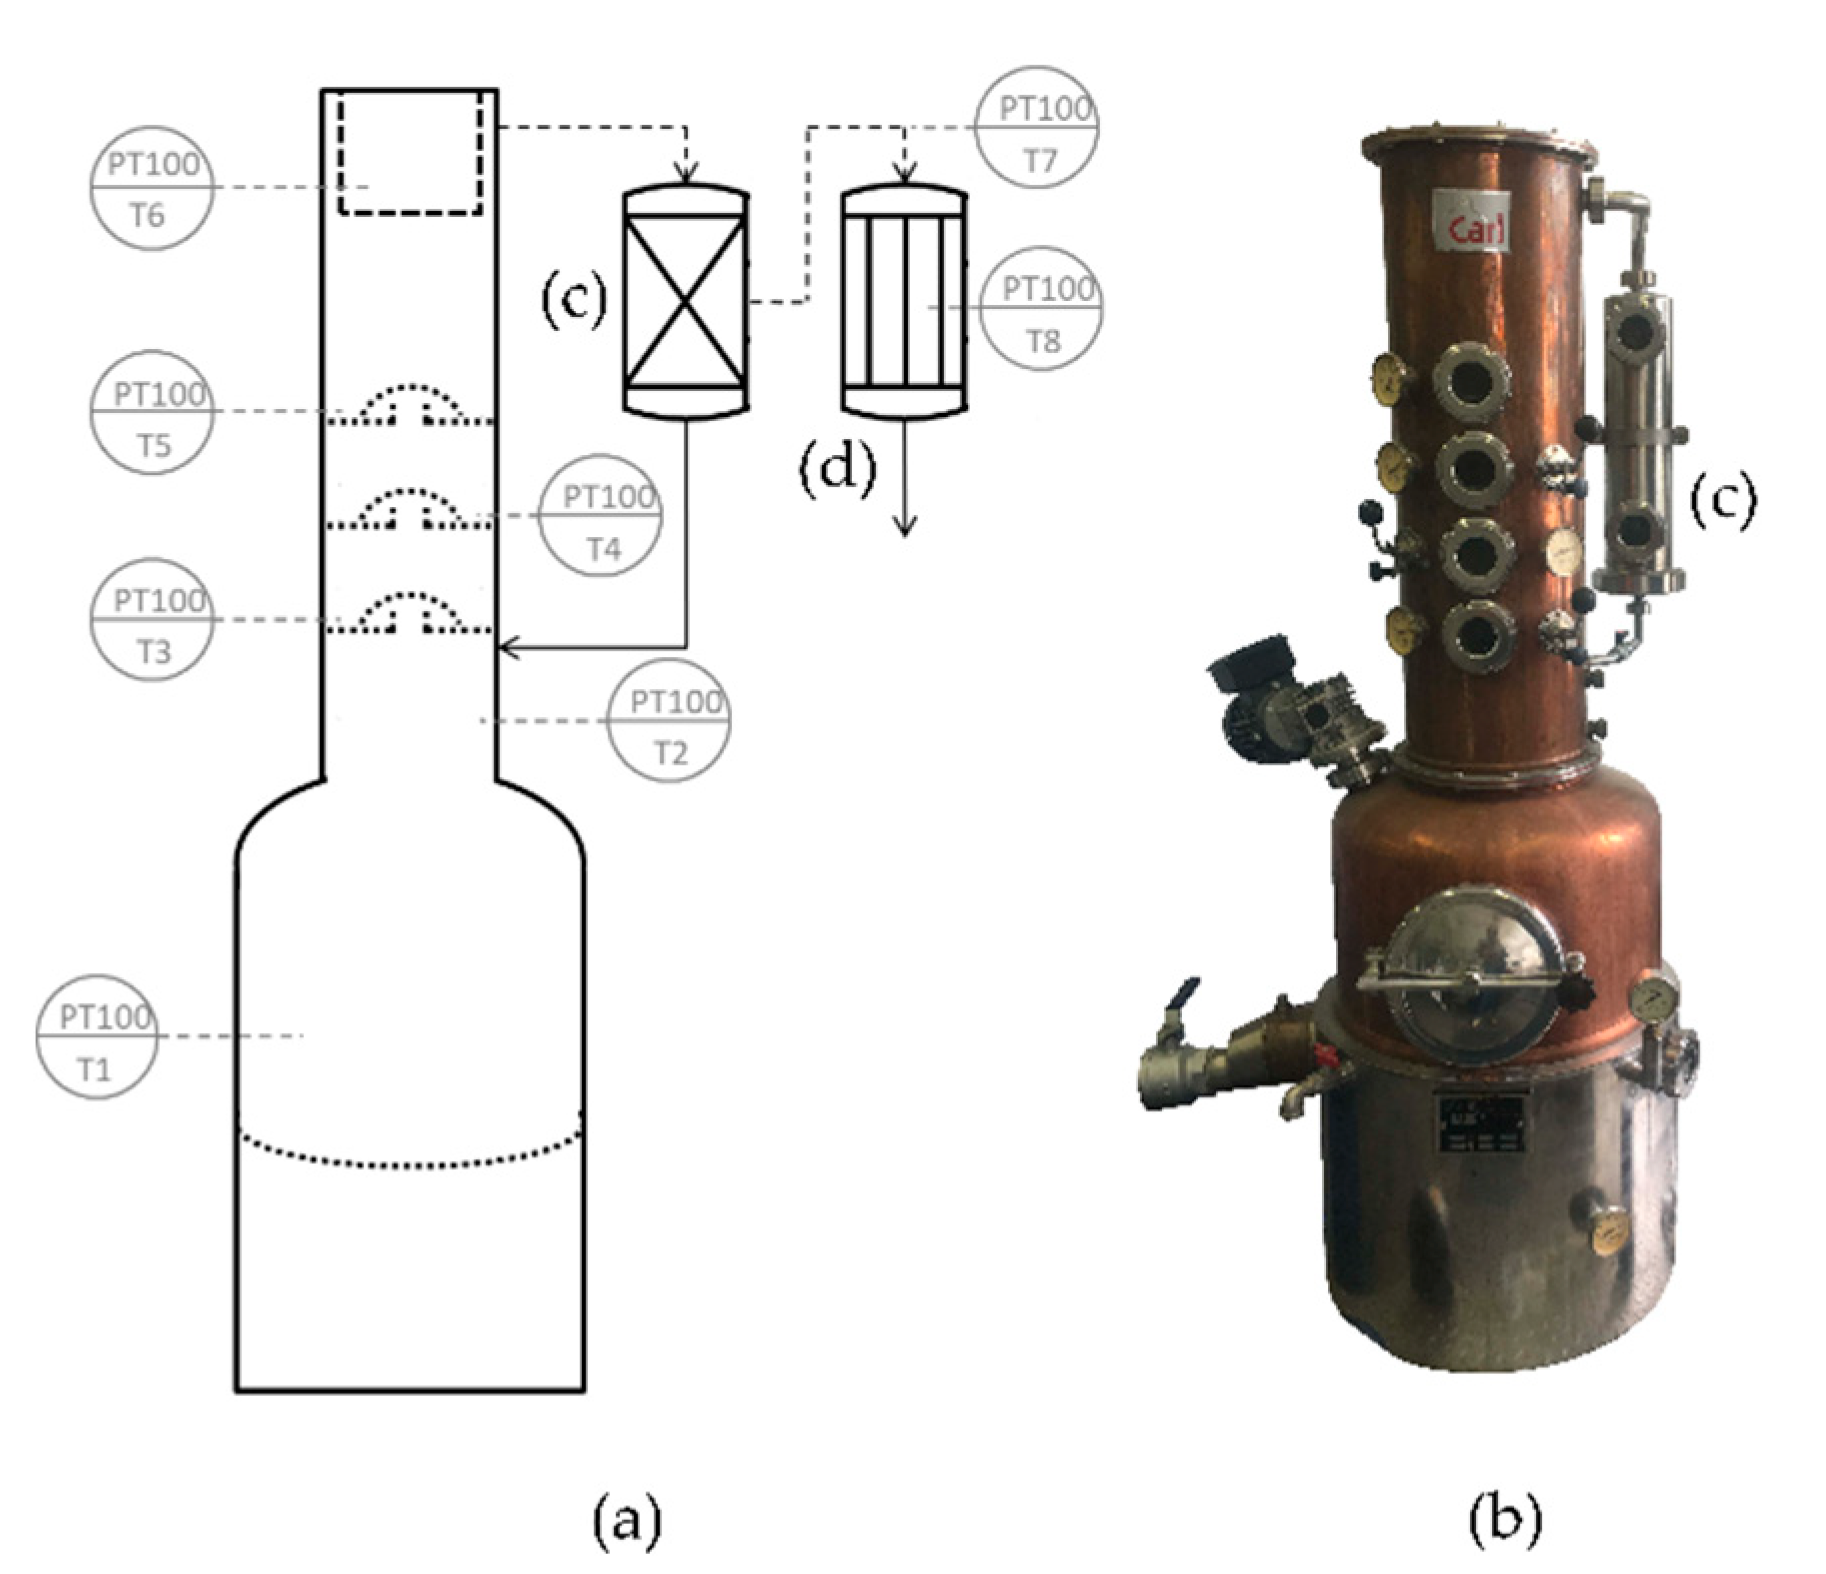
After 17 days of fermentation, 19.0 kg of homogenized coffee cherry mash was distilled in a steam-heated copper column still (Jacob Carl, Eislingen, Germany), equipped with 20 L reboiler, three bubble cap trays, dephlegmator (condenser), copper catalyzer and vapor cooler (Figure 2). The distillation process was analyzed in detail for process parameters and distillate fractions. Process parameters were logged every five minutes, beginning at the start of distillate production. This included vapor and liquid temperatures at different levels of the still and accumulated product volume. The temperature analysis included the mash in the reboiler, the vapor below the first tray, liquid at three trays, water in the dephlegmator, vapor in the vapor pipe and cooling water in the product cooler.
The produced distillate was fractioned in 15 samples of 41 ± 4 mL, and one final tails fraction of 250 mL. All fractions were categorized for heads, hearts and tails by sensory evaluation of two experienced distillers. The distillate fractions were analyzed by gas chromatography with flame ionization detection (GC-FID) for fermentative volatiles acetaldehyde (AH), ethyl acetate (EA), methanol (MT), 1-propanol (1P), 2-butanol (2B), isobutanol (IB), isoamyl alcohol (IA), 2-methyl-1-butanol (2M1B) and 1,1-diethoxyethane (1DE). The results are presented in g/L anhydrous alcohol (aa).
2.5. Analytical Methods
For the fermentation analysis, liquid samples were membrane-filtered (0.45 µm) and analyzed in triplicate by HPLC-RI, using a 7.8 × 300 mm Rezex RPM-Monosaccharide Pb + 2 Ion exclusion column (Phenomenex, Aschaffenburg, Germany) and a refractive index detector (Shodex RI-101, Thermo Fisher, Waltham, MA, USA) with sulphuric acid (0.005 N) as eluent with a flow rate of 0.6 mL/min.
A headspace gas chromatograph (GC-2010 Plus, Shimadzu Scientific Instruments, Kyoto, Japan) equipped with a flame ionization detector (FID) and a Rtx-Volatiles column (Restek Corp., Bellefonte, PA, USA) was used for volatile analysis in distillate fractions. All samples were adjusted to 40% (v/v) ethanol prior to volatile determination. Internal three-point standard calibrations were performed for HPLC-IR and GC-FID analysis (R² ≥ 0.99). Ethanol concentrations of distillate fractions were determined via density measurement (DMA 58, Anton Paar GmbH, Ostfildern, Germany). Bivariate correlations were analyzed by Pearson test (SPSS Statistics, version 25, IBM Corp., Armonk, NY, USA).
2.6. Sensory Evaluation
The sensory analysis was performed by a panel of three female and three male participants (24–48 years). All participants were trained in spirit tasting and had previously participated in similar studies. The spirit evaluation was based on QDA methodology [20]. The sensory evaluation was conducted in a two-step approach to identify qualitative attributes and quantitative terms.
Every panellist received a sample volume of 30 mL of the hearts fraction, adjusted to 40% (v/v) ethanol in spirit tasting glasses at 21 °C. In a first step, the panel established a qualitative spirit-specific descriptor list (SSDL). Therefore, every panellist noted potential subjective descriptors of the product by visualizing, smelling and tasting the sample. All potential descriptors were collected in a total list and presented to the whole sensory panel. Every panellist was thus asked to include or eliminate every potential descriptor as a characteristic term for coffee cherry spirits. Descriptors with ≥66% positive feedback as a characteristic term were included in the SSDL.
In a second step, the quantitative intensity of each SSDL descriptor was rated on a linear hedonic 6-point scale, where 0 indicated low and 5 indicated high perceptibility of a descriptor. Total fruit spirit performance was evaluated in terms of odor and taste by a linear hedonic 6-point scale, with 0 indicating low and 5 indicating high approval.
3. Results and Discussion
3.1. Substrate Characteristics
Coffee cherries, beans and pulps were physically analyzed before mashing. A sample of 30 selected coffee cherries revealed an individual weight of 2.0 ± 0.3 g, length of 16.75 ± 1.01 mm and diameter of 15.04 ± 1.02 mm. In [24], similar weights were stated. In this study, the MC of coffee cherries was 69.50 ± 2.74%, 59.83 ± 0.82% for coffee beans and 80.68 ± 1.15% for coffee pulps. Other studies showed MC of coffee beans in a similar range [24,25]. AC determination showed 5.64 ± 0.30% for coffee cherries, 4.57 ± 0.06% for coffee beans and 8.5 ± 0.32% for coffee pulps. Similar results were reported in [26].
3.2. Fermentation
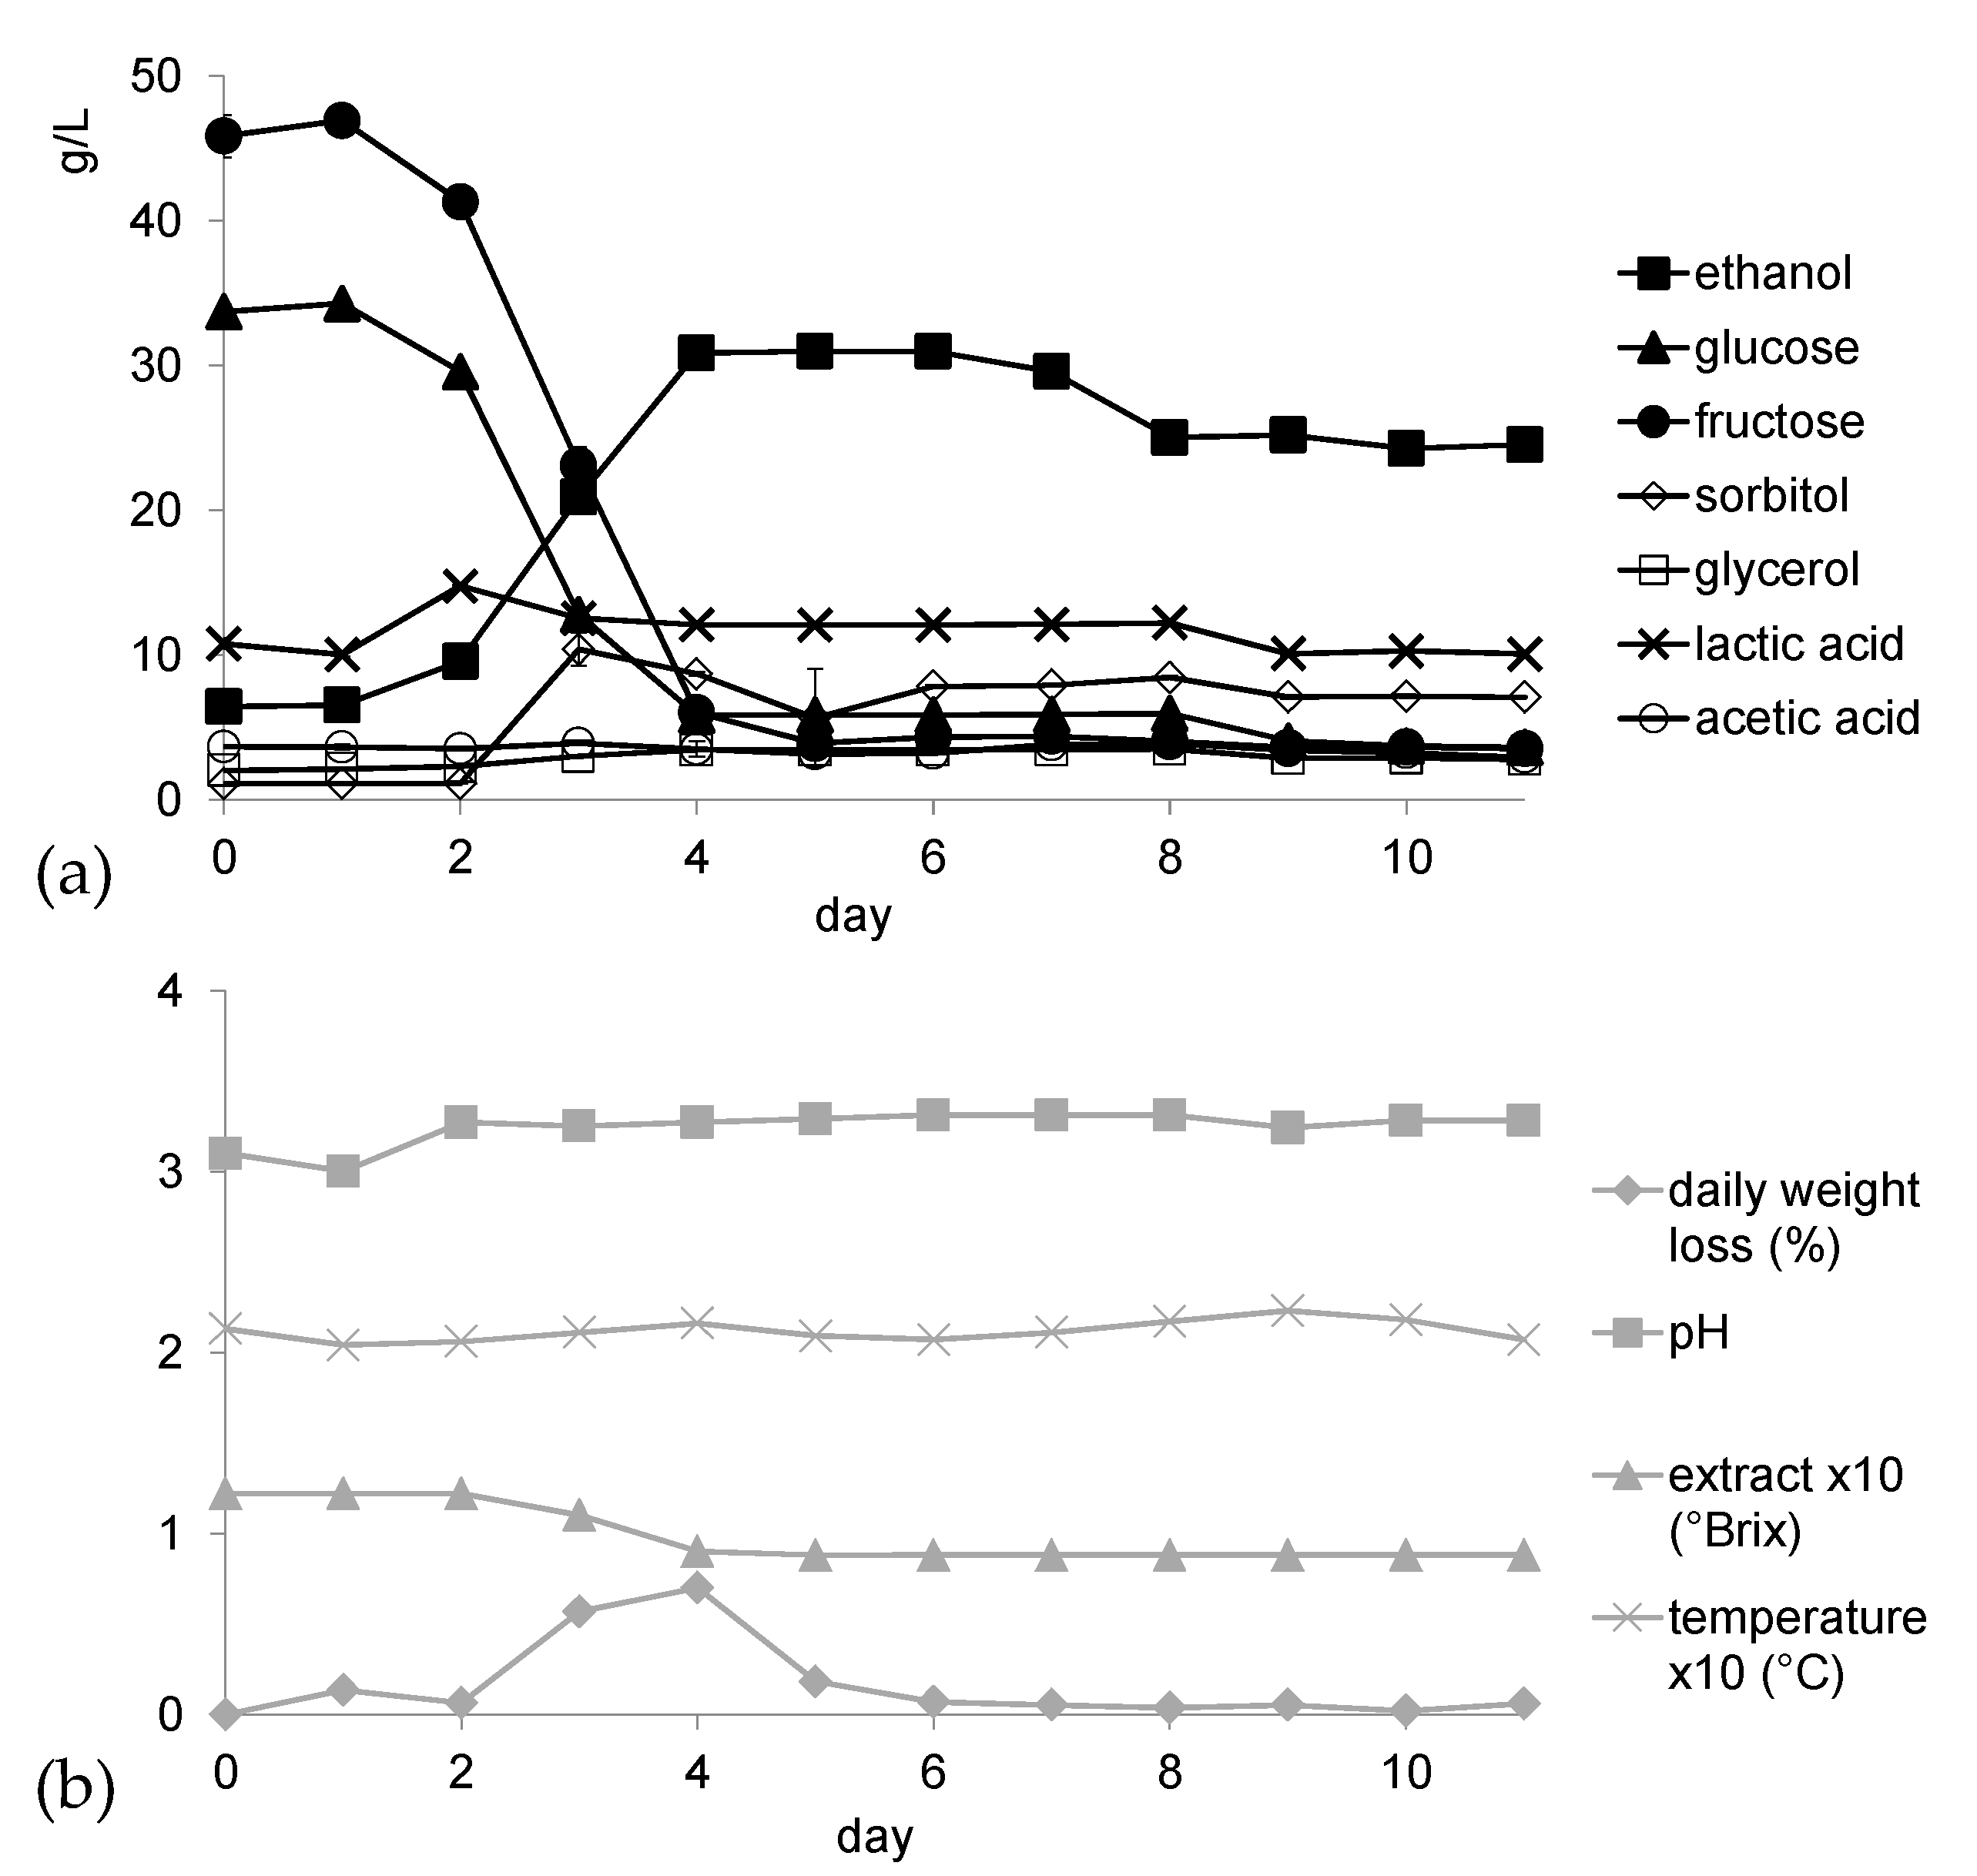
Fermentation showed steady process parameters over eleven days with 21.2 ± 0.6 °C and pH values of 3.0–3.3 (Figure 3). Initial fructose and glucose concentrations of 45.8 ± 1.5 g/L and 33.7 ± 0.5 g/L, respectively, were metabolized within five days. Simultaneously, ethanol concentrations increased to 31.0 ± 0.1 g/L. As expected, the ethanol increase correlated with decreasing fructose and glucose concentrations (r = −0.96, p < 0.001) and extract (r = −0.95, p < 0.001). During the fermentation, sorbitol and glycerol concentrations showed highest values of 10.4 ± 1.1 g/L and 3.5 ± 0.1 g/L, respectively. Both parameters correlated positively with ethanol concentrations (r = 0.83, p = 0.002; r = 0.96, p < 0.001), indicating their fermentative production by microbial activities or biochemical processes. Sorbitol is a non-metabolisable sugar alcohol, which is produced by glucose reduction. Sorbitol concentrations of >10 g/L also appear in different fruit mashes [27]. Glycerol is a well-known metabolite during anaerobe alcoholic fermentation [28]. High glycerol contents of ≥5.4 g/L in plum and cherry mashes were also indicated in [29]. Similar results were also presented by [12].
Coffee cherry mash showed the highest lactic and acetic acid concentrations of 14.8 ± 0.6 and 3.9 ± 0.1 g/L, respectively. As high lactic and acetic acid concentrations were already present at the start of fermentation, microbial growth during storage and transport were likely, despite consistent cooling chain. Lactic acid levels were additionally enhanced by acid application during mash preparation. Losses of potential ethanol formation due to lactic acid metabolism are, however, likely [28]. Based on the initial sugar concentration of 12.2 Brix, a theoretical ethanol content of approximately 4.7% (w/w) ethanol was expected. A sample distillation (Autodest 10, Leo Kübler GmbH, Germany) at the end of the fermentation indicated an ethanol concentration of 1.8% (w/w) in the mash. The discrepancy in the ethanol yield might be a result of ethanol losses due to fermentative by-product formation of sorbitol, glycerol and lactic acid. It is also known that density measurements by refractometer often overestimate the expected ethanol concentration, as physical properties are impaired by additional solvents in sugar solutions (e.g., sorbitol) [30]. Additionally, coffee cherry mash showed a generally high viscosity, which might have negatively affected yeast metabolism activities. Overall, the fermentation indicated process parameters similar to other fruit mashes [28,29], and could be optimized by reducing sorbitol, lactic acid and acetic acid concentrations. It is likely that reduced transportation time and the utilization of fresh coffee cherries could benefit the fermentation performance.
3.3. Distillation
The aim of the distillation was to separate the three main fractions (heads, hearts and tails) by common thermal rectification technique. The main objective was the production of a high-quality hearts fraction for subsequent sensory evaluation. The distillation of coffee cherry mash generated a total yield of 868 g distillate product. This yield is higher than the yield of 1.59% (w/w) proposed by German custom authority [31] for berries (e.g., bilberry, blackberry, raspberry, strawberry), but lower compared to stone fruit, with 2.78% (w/w) (e.g., Cornus mas, sour cherries, peach, sloe). The distillate main fractions contained 82 g heads, 312 g hearts and 474 g tails, with 72%, 78% and 10% (w/w) ethanol, respectively. This indicated an ethanol-based heads/hearts/tails mass ratio of 1.0:4.2:0.8. During distillation, the first eleven product fractions were subjected to GC-FID analysis, to determine fermentative volatiles concentrations. The last tails fraction was not considered for GC-FID analysis. The literature implies that the composition and concentration of fermentative volatiles significantly influence the quality of distillates [4,11,32].
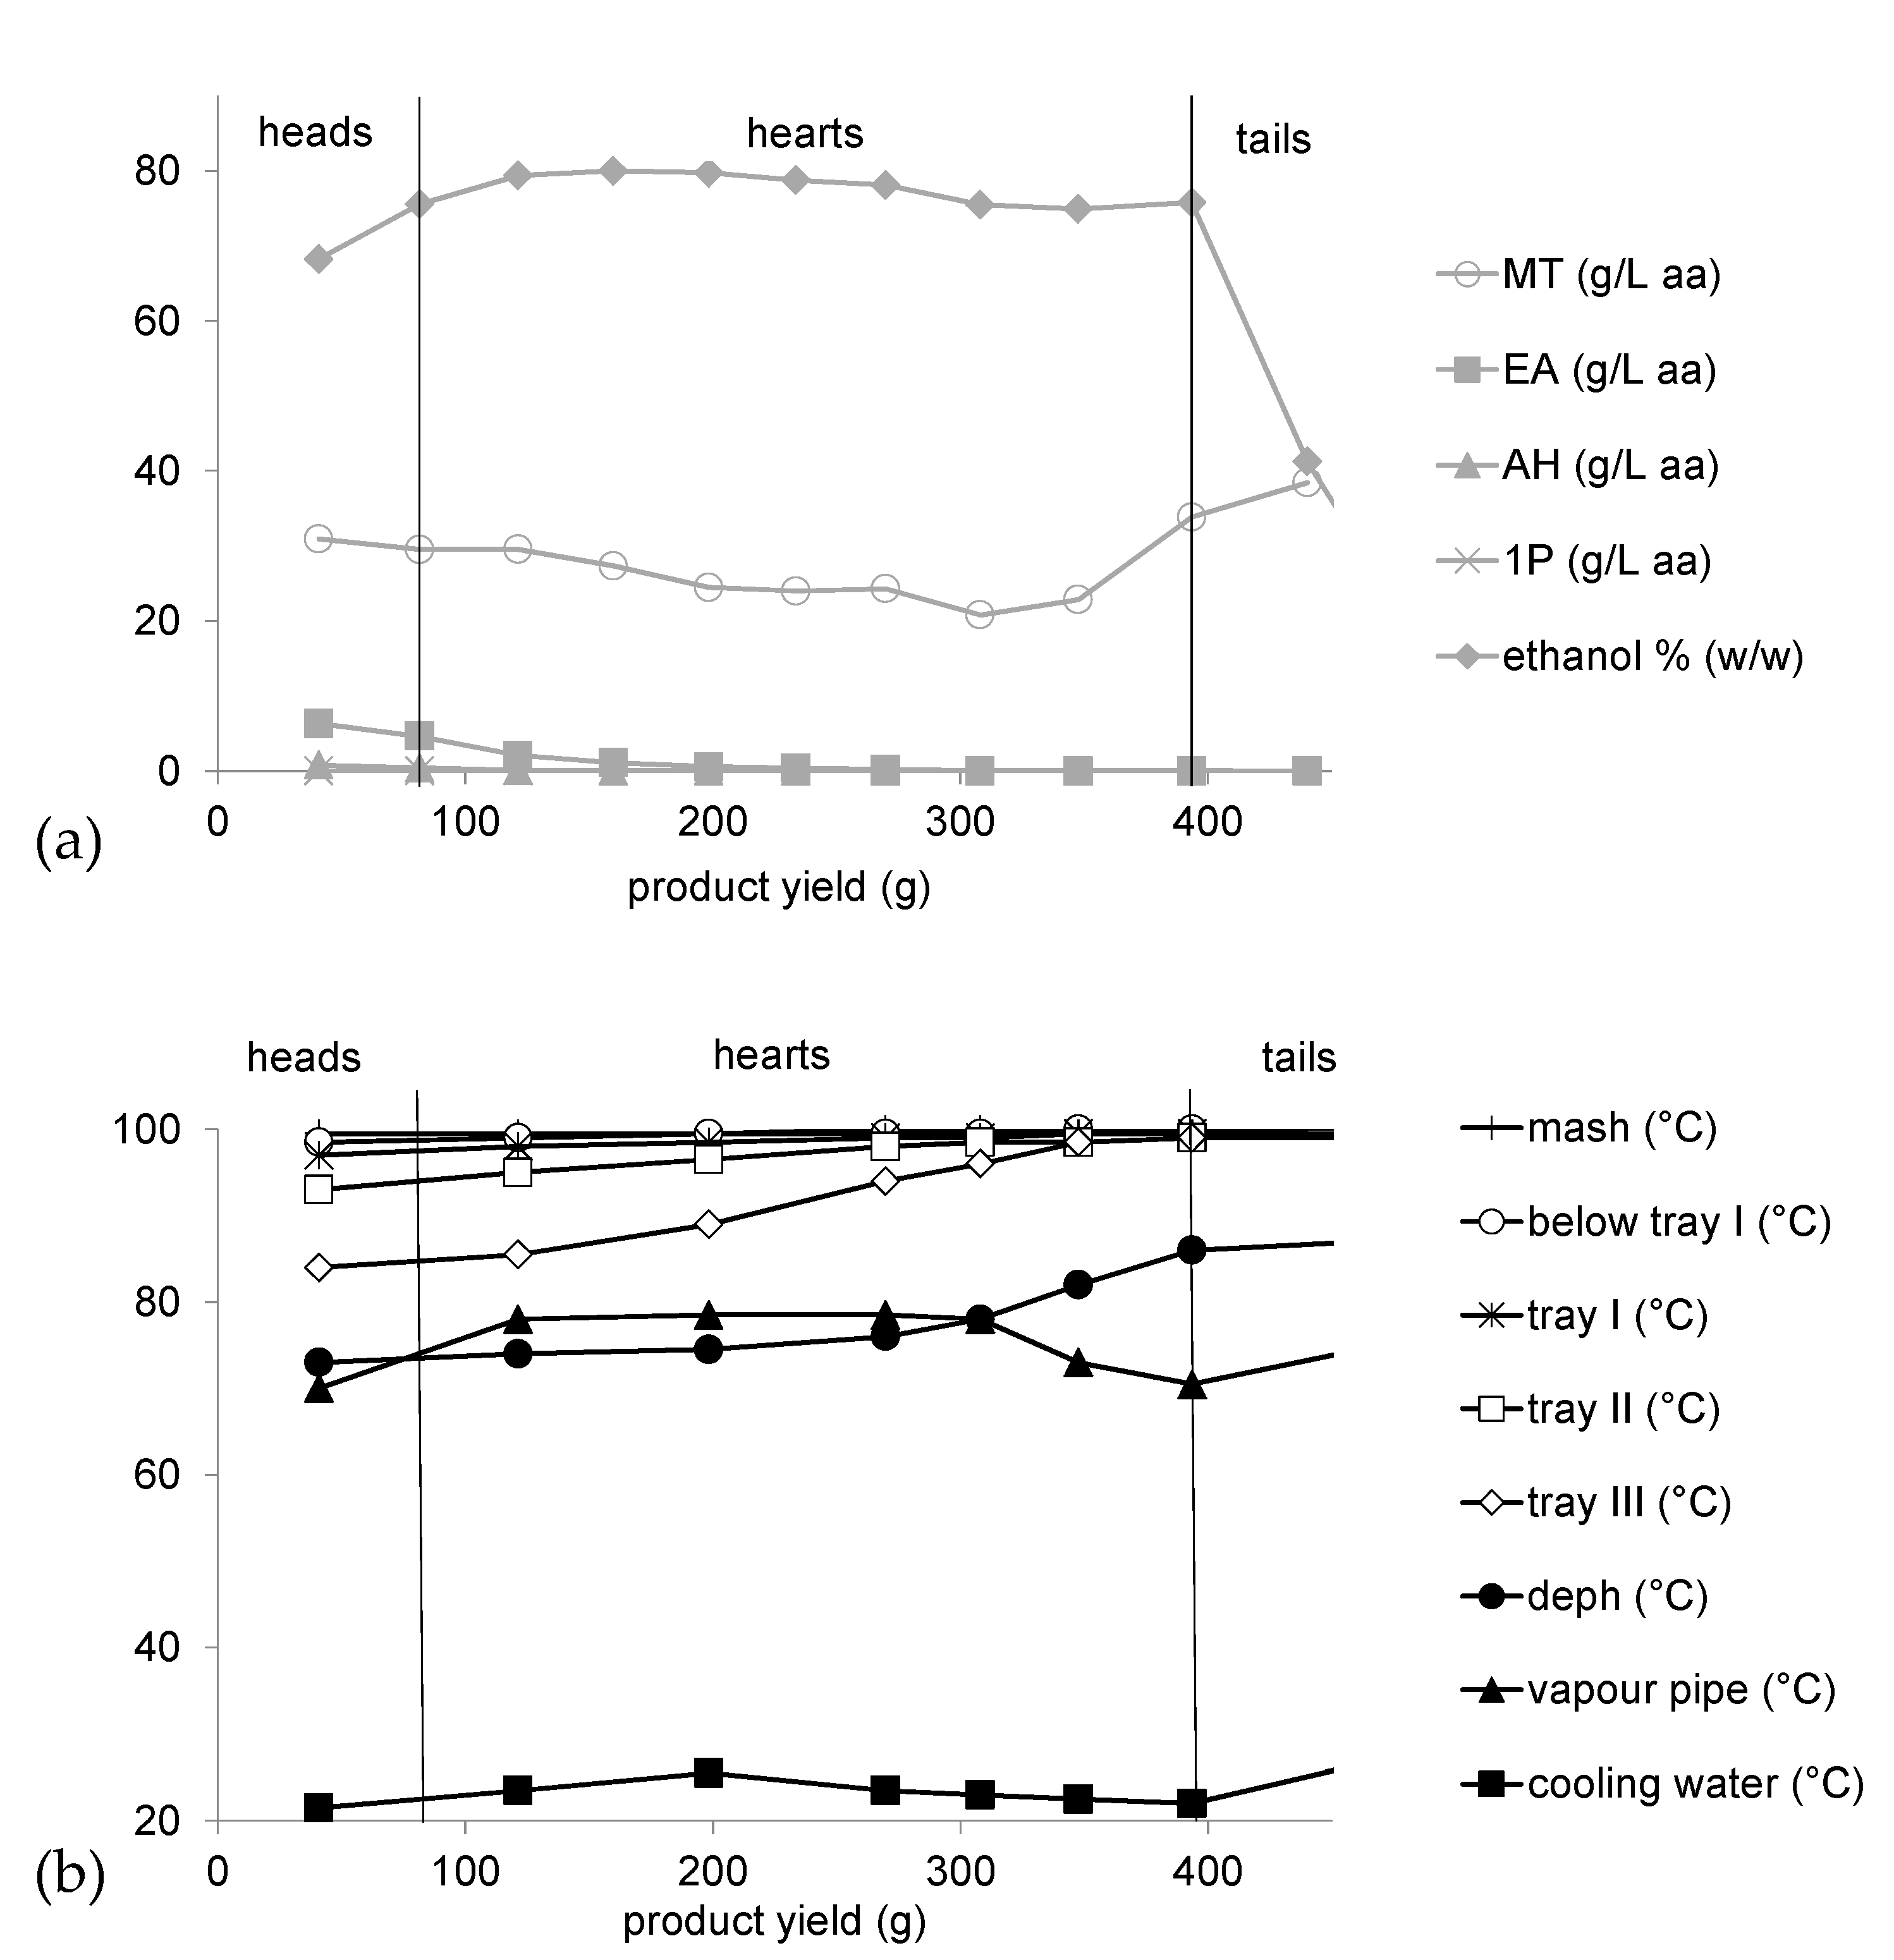
Figure 4 shows the fermentative volatile composition of the first eleven fractions found in coffee cherry distillate. As expected, a reduction in certain compounds was observed during the shift from heads to hearts. The first fraction showed EA and AH concentrations of 6.0 and 0.8 g/L, respectively. After the shift from heads to hearts, EA and AH concentrations reduced to 2.0 and 0.1 g/L, respectively, in the third fraction. This indicated an efficient separation process of both fermentative volatiles from heads to hearts fractions. High quantities of EA have negative effects on product quality, as it implements strong pungent characteristics. Therefore, reduced EA concentrations in the hearts fractions positively influenced product quality. Further positive quality effects were found in reduced AH concentrations, as AH is responsible for negative pungency in distillates [12]. Besides ethanol, methanol showed the highest quantities of all fermentative volatiles. The eight analyzed hearts fractions showed average methanol contents of 26 ± 4 g/L. According to European law, fruit spirits have to meet defined quality standards regarding maximum methanol contents [33]. The regulation sets a general methanol concentration limit of ≤10 g/L for fruit spirits, which is extended to 13.5 g/L in exceptional substrate-specific cases (e.g., Bartlett pear fruit spirit). Our results indicated that coffee cherry spirits showed methanol concentrations exceeding European legal tolerance by ≥93%. The origin of methanol formation derives from pectin degradation processes. High methanol concentrations might be a result of long storage conditions, as also indicated by increased lactic and acetic acid concentrations. The application of pectinase during mash preparation had an additional effect on methanol formation. Similar methanol concentrations were found by [34] after pectinase addition to apple pomace. This suggests that it is advisable to ferment coffee cherries in fresh condition without the addition of pectinase to gain fruit spirits with reduced methanol contents. Besides AH, EA, MT and 1P, further analyzed fermentative volatiles concentrations were below 0.1 g/L and therefore not included in Figure 4.
The distillation procedure details (Figure 4) indicated a constant increase in temperatures over a total of 50 min distillation time, starting at the point of first distillate production. The temperature differences between trays I–III are a result of lower boiling points induced by increasing ethanol concentrations on higher trays [35]. The described process parameters indicated a negative correlation of the ethanol concentration with the vapor pipe temperature (r = −0,862, n = 8, p = 0,006) and confirm its causal relation. Detailed information on temperature profiles in the column still renders important information on process flow within the still. Most scientific studies on spirit production lack a defined description of the distillation process parameters, mandatory for scientific reproducibility [36]. The shift from heads to hearts was linked with an increasing vapor pipe temperature from 70 to 78 °C. Eight analyzed hearts fractions showed ethanol concentrations of 78 ± 2% (w/w) and a rapid decrease to 41% (w/w) at the shifting point from hearts to tails. The hearts to tails shift was linked with a dephlegmator temperature of 86 °C.
3.4. Sensory Analysis
The distilled hearts fraction was water-diluted to 40% (v/v) ethanol and subjected to sensory analysis. The panellists assessed substrate specific descriptors, perceptibility and general performance. The evaluated SSDL contained two descriptors for color, five descriptors for odor and eight descriptors for taste (Table 1). Descriptors defined with the highest odor perception were vegetal, nutty and earthy. The taste descriptors with the highest perceptibility were vegetal, alcoholic and nutty. The repetition of descriptors vegetal and nutty in odor and taste indicated highly important terms to describe coffee cherry spirit in a sensory context. As expected, the descriptor coffee, defined as coffee-brewed drink, showed low perceptibility. This can be explained by the fact that the typical coffee aroma only develops during the roasting process of the coffee beans, not performed in this study [37]. Microbiological activities may cause an unpleasant off-flavor at certain levels. Thus, elevated concentrations of certain compounds (e.g., acetic acid, acrolein, allyl alcohol, 2-butanol) are markers for spoilage of the raw material, negative microbiological influences during or after the fermentation process, or a poor distillation technique [38]. Despite a possible microbial infection of the substrate, no predominant acidic characteristics were identified in terms of odor and taste. A certain impact on the sensory profile due to undefined microbial activities can, however, not be excluded. The total performance showed high approval in the trained panelist group. Further determination of liking or acceptance of the product requires an extended consumer testing. Overall, the sensory evaluation indicated high potential to introduce a valuable fruit spirit from coffee cherries.
4. Conclusions
The presented study focused on process analysis of coffee cherry spirit production, analytical and sensorial evaluation of distillate fractions. Fermentation and distillation of coffee cherry mash showed a typical process performance for fruit spirits. The presented substrate characteristics, detailed fermentation and distillation process parameters enable reproducibility of this survey. A yield rate of 1.8% (w/w) ethanol indicated higher potentials in coffee cherry mashes compared to other berries. Lactic and acetic acid concentrations suggested possible microbial infection due to transportation time and storage conditions prior to fermentation. To reduce quality risks in future, mashing and fermentation processes should be induced directly after the harvest. Therefore, establishing a mashing process on-site is advisable. Quality parameters showed high methanol concentrations, which need to be reduced considerably for a possible product introduction in Europe. Potential process improvements can be achieved by increasing mash viscosity and reducing methanol contents. Mashing fresh coffee cherries and the addition of alternative liquefying enzymes, e.g., pectinlyase with reduced methanol-hydrolysis properties on pectin, have the potential to address both issues simultaneously.
The SSDL introduced 15 descriptors for the color, odor and taste of coffee cherry spirits. This study identified vegetal and nutty as predominant spirit-describing terms. In regard to the non-existent brewed coffee aroma, coffee cherry distillates present great potential to introduce a fruit spirit drink with new or different spirit flavors.
The results suggested that the use of coffee cherries for spirit production is a viable alternative use of this fruit and provides potential as a value-adding process step in coffee production. Coffee cherry spirits might even generate a higher product value compared to market prices for roasted coffee beans.
Author Contributions
Conceptualization, D.E., K.M. and J.M.; project administration, J.M.; fermentation and distillation analysis, L.K.; substrate characterization, K.I.; writing—section substrate characteristics, K.M.; writing—section fermentation, distillation and sensory evaluation, D.E.; All authors have read and agreed to the published version of the manuscript.
Funding
This research received no external funding.
Acknowledgments
We gratefully thank Ute Waldeck, Olga Gotra, Zebin Cao, Gero Becker, Sabine Nugent of the Institute of Agricultural Engineering, Julia Pesl and Oliver Reber of the Department Yeast Genetics and Fermentation Technology, for their technical support.
Conflicts of Interest
The authors declare no conflict of interest.
References
- Jack, F.R.; Steele, M.G. Modelling the sensory characteristics of Scotch whisky using neural networks—A novel tool for generic protection. Food Qual. Prefer. 2002, 13, 163–172. [Google Scholar] [CrossRef]
- Bovo, B.; Andriguetto, C.; Carlot, M.; Corich, V.; Lombardi, A.; Giacomini, A. Yeast population dynamics during pilot-scale storage of grape marcs for the production of Grappa, a traditional Italian alcoholic beverage. Int. J. Food Microbiol. 2009, 129, 221–228. [Google Scholar] [CrossRef]
- Pino, J.A.; Tolle, S.; Gök, R.; Winterhalter, P. Characterisation of odouractive compounds in aged rum. Food Chem. 2012, 132, 1436–1441. [Google Scholar] [CrossRef]
- Campos, C.R.; Silva, C.F.; Dias, D.R.; Basso, L.C.; Amorim, H.; Schwan, R.F. Features of Saccharomyces cerevisiae as a culture starter for the production of the distilled sugar cane beverage cachaca in Brazil. J. Appl. Microbiol. 2009, 108, 1871–1879. [Google Scholar] [PubMed]
- Hang, Y.D.; Woodams, E.E. Influence of apple cultivar and juice pasteurization on hard cider and eau-de-vie methanol content. Bioresour. Technol. 2010, 101, 1396–1398. [Google Scholar] [CrossRef]
- Diéguez, S.C.; de la Peña, M.L.G.; Gómez, E.F. Volatile composition and sensory characters of commercial Galician orujo spirits. J. Agric. Food Chem. 2005, 53, 6759–6765. [Google Scholar] [CrossRef]
- Silva, M.L.; Malcata, F.X.; De Revel, G. Volatile contents of grape marcs in Portugal. J. Food Compos. Anal. 1996, 9, 72–80. [Google Scholar] [CrossRef]
- Satora, P.; Tuszynski, T. Chemical characteristics of Sliwowica Łacka and other plum brandies. J. Sci. Food Agric. 2008, 88, 167–174. [Google Scholar] [CrossRef]
- Lachenmeier, D.W.; Frank, W.; Kuballa, T. Application of tandem mass spectrometry combined with gas chromatography to the routine analysis of ethyl carbamate in stone-fruit spirits. Rapid. Commun. Mass. Spectrom. 2005, 19, 108–112. [Google Scholar] [CrossRef]
- Nikićević, N. Production of superior quality fruit brandies in small domestic distilleries in Serbia. In Proceedings of the Spirit of Rakia, 1st International Conference & Exhibition, Pula, Croatia, 27–30 March 2019. [Google Scholar]
- Duarte, W.F.; Amorim, J.C.; de Assis Lago, L.; Dias, D.R.; Schwan, R.F. Optimization of Fermentation Conditions for Production of the Jabuticaba (Myrciaria cauliflora) Spirit Using the Response Surface Methodology. J. Food Sci. 2011, 76, 782–790. [Google Scholar] [CrossRef]
- do Santos, C.C.A.A.; Duarte, W.F.; Carreiro, S.C.; Schwan, R.F. Inoculated fermentation of orange juice (Citrus sinensis L.) for production of a citric fruit spirit. J. Inst. Brew. 2013, 119, 280–287. [Google Scholar] [CrossRef]
- Moore, P.H.; Ming, R. Genomics of Tropical Crop Plants; Springer: New York, NY, USA, 2008. [Google Scholar]
- Bakker, R.R.C. Availability of Lignocellulosic Feedstocks for Lactic Acid Production; UR Food & Biobased Research: Wageningen, The Netherlands, 2013. [Google Scholar]
- Heeger, A.; Kosińska-Cagnazzo, A.; Cantergiani, E.; Andlauer, W. Bioactives of coffee cherry pulp and its utilisation for production of Cascara beverage. Food Chem. 2017, 221, 969–975. [Google Scholar] [CrossRef]
- Somashekar, K.L.; Anu Appaiah, K.A. Coffee cherry husk—A potential feed stock for alcohol production. Int. J. Environ. Waste Manag. 2013, 11, 410–419. [Google Scholar]
- Murthy, P.S.; Naidu, M.M. Sustainable management of coffee industry byproducts and value addition—A review. Resour. Conserv. Recy. 2012, 66, 45–58. [Google Scholar] [CrossRef]
- Dragone, G.; Mussatto, S.I.; Oliveira, J.M.; Teixeira, J.A. Characterisation of volatile compounds in an alcoholic beverage produced by whey fermentation. Food Chem. 2009, 112, 929–935. [Google Scholar] [CrossRef] [Green Version]
- Vilanova, M.; Zamuz, S.; Tardáguila, J.; Masa, A. Descriptive analysis of wines from Vitis vinifera cv. Albariño. J. Sci. Food Agric. 2008, 88, 819–823. [Google Scholar] [CrossRef] [Green Version]
- Lawless, H.T.; Heymann, H. Sensory Evaluation of food. Principle and Practices; Kluwer Academic/Plenum Publishers: Massachusetts, MA, USA, 1998. [Google Scholar]
- Carlucci, A.; Monteleone, E. Statistical validation of sensory data: A study on wine. J. Sci. Food Agric. 2001, 81, 751–758. [Google Scholar]
- Deutsches Institut für Normung DIN. DIN EN 14774-3 Solid Biofuels—Determination of Moisture Content—Oven Dry Method—Part 3: Moisture in General Analysis Sample; Beuth Verlag: Berlin, Germany, 2010. [Google Scholar]
- Deutsches Institut für Normung DIN. DIN EN 14775 Solid Biofuels—Determination of Ash Content; Beuth Verlag: Berlin, Germany, 2010. [Google Scholar]
- Clifford, M.N.; Willson, K.C. Coffee—Botany, Biochemistry and Production of Beans and Beverage; Springer: Boston, MA, USA, 1985. [Google Scholar]
- Samuelsson, R.S.; Burvall, J.; Jirjis, R. Comparison of different methods for the determination of moisture content in biomass. Biomass Bioenergy 2006, 30, 929–934. [Google Scholar] [CrossRef]
- Clifford, M.N. Chlorogenic acids and other cinnamates—Nature, occurrence and dietary burden. J. Sci. Food Agric. 1999, 79, 362–372. [Google Scholar]
- Dietrich, H.; Krüger-Steden, E.; Patz, C.D.; Will, F.; Rheinberg, A.; and Hopf, I. Increase of sorbitol in pear and apple juice by water stress, a consequence of climatic change? Fruit Process. 2007, 17, 348–355. [Google Scholar]
- Jacques, K.A.; Lyons, T.P.; Kelsall, D.R. The Alcohol Textbook, 4th ed.; Nottingham University Press: Nottingham, UK, 2003. [Google Scholar]
- Schehl, B.; Lachenmeier, D.; Senn, T.; Heinisch, J.J. Effect of the Stone Content on the Quality of Plum and Cherry Spirits Produced from Mash Fermentations with Commercial and Laboratory Yeast Strains. J. Agric. Food Chem. 2005, 53, 8230–8238. [Google Scholar] [CrossRef] [PubMed]
- Allen, L.V. Quality-Control Analytical Methods—Refractometry. Int. J. Pharm. Compd. 2003, 7, 383. [Google Scholar]
- German customs. Abfindungs- und Stoffbesitzerbrennen—Zugelassene Rohstoffe (§§ 9 und 11 Alkoholsteuergesetz) und Festgelegte Amtliche Ausbeutesätze; Generalzolldirektion: Bonn, Germany, 2018. [Google Scholar]
- Duarte, W.F.; Ferreira de Sousa, M.V.; Dias, D.R.; Schwan, R.F. Effect of Co-Inoculation of Saccharomyces cerevisiae and Lactobacillus fermentum on the Quality of the Distilled Sugar Cane Beverage Cachaca. J. Food Sci. 2011, 76, 1307–1318. [Google Scholar] [CrossRef] [PubMed]
- European Parliament and Council. Regulation (EC) no 110/2008 of the European Parliament and of the council of 15 January 2008 on the definition, description, presentation, labelling and the protection of geographical indications of fruit spirits and repealing council regulation (EEC) no 1576/89. Off. J. Eur. Union 2008, L39, 16–54. [Google Scholar]
- Zhang, H.; Woodams, E.E.; Hang, Y.D. Influence of pectinase treatment on fruit spirits from apple mash, juice and pomace. Process. Biochem. 2011, 46, 1909–1913. [Google Scholar]
- Riachi, L.G.; Santos, A.; Moreira, R.F.A.; De Maria, C.A.B. A review of ethyl carbamate and polycyclic aromatic hydrocarbon contamination risk in cachaça and other Brazilian sugarcane spirits. Food Chem. 2014, 149, 159–169. [Google Scholar]
- García-Llobodanin, L.; Roca, J.; López, J.R.; Pérez-Correa, J.R.; López, F. The lack of reproducibility of different distillation techniques and its impact on pear spirit composition. Int. J. Food Sci. Technol. 2011, 46, 1956–1963. [Google Scholar] [CrossRef]
- Belitz, H.D.; Grosch, W.; Schieberle, P. Coffee, Tea, Cocoa. In Food Chemistry; Belitz, H.D., Grosch, W., Schieberle, P., Eds.; Springer: Berlin, Germany, 2009. [Google Scholar]
- Christoph, N.; Bauer-Christoph, C. Flavour of Spirit Drinks: Raw Materials, Fermentation, Distillation, and Ageing. In Flavours and Fragrances; Berger, R.G., Ed.; Springer: Berlin, Germany, 2007. [Google Scholar]
Figure 1.
Defrosted coffee cherries (a), mashing of coffee cherries (b) and disintegrated beans and pulps after mashing (c).
Figure 1.
Defrosted coffee cherries (a), mashing of coffee cherries (b) and disintegrated beans and pulps after mashing (c).

Figure 2.
Instrumentation diagram (a) and front view (b) of distillation column with copper catalyzer (c) and vapor cooler (d), temperature sensors T1 = mash, T2 = below tray I, T3 = tray I, T4 = tray II, T5 = tray III, T6 = dephlegmator, T7 = vapor pipe, T8 = cooling water.
Figure 2.
Instrumentation diagram (a) and front view (b) of distillation column with copper catalyzer (c) and vapor cooler (d), temperature sensors T1 = mash, T2 = below tray I, T3 = tray I, T4 = tray II, T5 = tray III, T6 = dephlegmator, T7 = vapor pipe, T8 = cooling water.

Figure 3.
Fermentation analysis of chemical compounds (a) and process parameters (b).

Figure 4.
Fermentative volatiles (a) and process parameters (b) during distillation. deph = dephlegmator, MT = methanol, EA = ethyl acetate, AH = acetaldehyde, 1P = 1-propanol, concentrations based on anhydrous alcohol (aa). Last tailings fraction not shown. Note different y-axis scaling.
Figure 4.
Fermentative volatiles (a) and process parameters (b) during distillation. deph = dephlegmator, MT = methanol, EA = ethyl acetate, AH = acetaldehyde, 1P = 1-propanol, concentrations based on anhydrous alcohol (aa). Last tailings fraction not shown. Note different y-axis scaling.


Table 1.
Coffee Cherry Spirit-Specific Sensory Descriptor List (SSDL) with Hedonic Scale Evaluation. Means Given with Standard Deviation.
Table 1.
Coffee Cherry Spirit-Specific Sensory Descriptor List (SSDL) with Hedonic Scale Evaluation. Means Given with Standard Deviation.
| Domain | Descriptor | Mean |
|---|---|---|
| color | clarity | 5.0 ± 0 |
| colorlessness | 5.0 ± 0 | |
| odor | vegetal | 3.2 ± 1.0 |
| nutty | 3.0 ± 1.3 | |
| earthy | 2.8 ± 1.0 | |
| tart | 2.3 ± 1.5 | |
| herbs | 1.0 ± 0.9 | |
| taste | vegetal | 3.2 ± 1.6 |
| alcoholic | 2.8 ± 1.5 | |
| nutty | 2.5 ± 0.8 | |
| sweet | 2.3 ± 1.2 | |
| earthy | 2.3 ± 1.6 | |
| tart | 2.2 ± 1.2 | |
| bitter | 2.0 ± 0.9 | |
| coffee | 0.5 ± 0.5 | |
| total performance | odor | 2.8 ± 1.2 |
| taste | 3.2 ± 1.2 |
© 2020 by the authors. Licensee MDPI, Basel, Switzerland. This article is an open access article distributed under the terms and conditions of the Creative Commons Attribution (CC BY) license (http://creativecommons.org/licenses/by/4.0/).
Share and Cite
MDPI and ACS Style
Einfalt, D.; Meissner, K.; Kurz, L.; Intani, K.; Müller, J. Fruit Spirit Production from Coffee Cherries—Process Analysis and Sensory Evaluation. Beverages 2020, 6, 57. https://0-doi-org.brum.beds.ac.uk/10.3390/beverages6030057
AMA Style
Einfalt D, Meissner K, Kurz L, Intani K, Müller J. Fruit Spirit Production from Coffee Cherries—Process Analysis and Sensory Evaluation. Beverages. 2020; 6(3):57. https://0-doi-org.brum.beds.ac.uk/10.3390/beverages6030057
Chicago/Turabian StyleEinfalt, Daniel, Klaus Meissner, Lena Kurz, Kiatkamjon Intani, and Joachim Müller. 2020. "Fruit Spirit Production from Coffee Cherries—Process Analysis and Sensory Evaluation" Beverages 6, no. 3: 57. https://0-doi-org.brum.beds.ac.uk/10.3390/beverages6030057
Note that from the first issue of 2016, this journal uses article numbers instead of page numbers. See further details here.