Article

Modelling of Malt Mixture for the Production of Wort with Increased Biological Value

1
Department of Wine and Beer Technology, University of Food Technologies—Plovdiv, 26 Maritsa Boulevard, 4002 Plovdiv, Bulgaria
2
Laboratory of Biologically Active Substances, Institute of Organic Chemistry with Centre of Phytochemistry, Bulgarian Academy of Sciences, 139 Ruski Boulevard, 4000 Plovdiv, Bulgaria
3
Department of Biochemistry and Molecular Biology, University of Food Technologies—Plovdiv, 26 Maritza Boulevard, 4002 Plovdiv, Bulgaria
4
Institute of Food Canning and Quality—Plovdiv, 154 Vasil Aprilov Boulevard, 4000 Plovdiv, Bulgaria
*
Author to whom correspondence should be addressed.
Submission received: 29 June 2022 / Revised: 19 July 2022 / Accepted: 25 July 2022 / Published: 28 July 2022
(This article belongs to the Special Issue Early-Career Researchers in Processing Technology of Beverages)

Abstract

:
Wort can be used as a basis for functional beverages production because of its content of fibres, antioxidants and vitamins. The biological value of wort depends on the malt used and the mashing regime. Therefore, we investigated the main brewing characteristics (extract, pH, and colour), phenolic compounds content, and antioxidant activity (measured by DPPH, FRAP, CUPRAC, ABTS, and ORAC) of wort, produced by Vienna, Melanoidin, Caramel pils and Special X malt or mixture of them. The results obtained were used for the modelling and optimisation of malt mixture that can be used for the production of functional beverages. Optimisation was made on the basis of wort extract, total phenolic compounds (measured by Folin–Ciocalteu method), and antioxidant activity, measured by DPPH, FRAP, and ORAC methods. Although optimised variants with high content of Special X malt showed highest antioxidant activity, they had an unpleasant taste and slow mash filtration rate. Therefore, the variant with 24.2% Vienna, 51.8% Melanoidin, 20% Caramel pils, and 4% Special X malts was chosen for the production of functional wort-based beverages.

1. Introduction

Beer is one of the oldest and most consumed beverages in the world. It is produced by 4 main ingredients: malt, hop, water, and yeast. Malt is made with germinated and subsequently kilned cereal such as barley, wheat, rye, etc. [1,2]. Barley malt is the main ingredient that contributes to the antioxidant properties of beers—95% for dark beers and 86% for pale beers [3]. The antioxidant potential of barley malt is associated with the phenolic compound content and Maillard reaction products, such as melanoidins [4]. Malt antioxidants play an important role in maintaining the beer oxidative stability, but are also important for the prevention of oxidative stress-associated conditions such as coronary health diseases [5,6].
Wort is produced after a mixture of ground malt is mashed with a carefully controlled amount of water and the mash is subsequently lautered. Wort can be used not only for beer production but also for the production of different functional beverages [7,8,9]. The biological value of wort depends on malt used and mashing regime. Therefore, the selection of malts or mixture of malts with increased biological value is a main task in the production of new types of healthy wort-based beverages.
The best approach for the selection of malt mixture is mixture design (MD). In MDs, two or more components are mixed in different proportions, and the characteristics of the resulting products are recorded. The responses are independent of physical states, depending only on the proportions of the ingredients present in the mixtures [10]. Different methods can be used as MD, the most common of which are: simplex–lattice designs, simplex-centroid designs, and constrained mixture designs [11,12,13]. The characteristics of each of these methods and the areas of their application are described in detail in Shopska et al. [11]. As a result, linear, quadratic or cubic equations were generated, which gave the relationship between the mixture composition and the desired target functions [12,13].
In our previous study [11], the general approaches for modelling malt mixtures for the production of wort with desired properties were presented. These approaches required the division of malts into three main groups—basic, special and functional and the imposition of certain restrictions on the amount of special and functional malts to produce wort with desired characteristics. The target functions of MD in this case were the extract yield, wort colour, the diastatic power, the biological characteristics of wort obtained, etc.
The aim of this study is to model and optimize malt mixture for the production of wort with increased biological value. The wort produced was analyzed in terms of basic brewing parameters, phenolic compounds and antioxidant activity and the optimization was made on the basis of combination of these factors. The optimized mixture will be used for the production of different types of wort-based beverages.

2. Materials and Methods

2.1. Malt

We used Vienna malt, Melanoidin malt, Caramel pils malt, and Special X malt, produced by BestMalz, Germany.

2.2. Mixture Design

Randomized and enlarged special cubic simplex–lattice design with 2 repetitions in the centre of the plan was used to model the malt mixtures (augment design). The plan was a lattice, which consisted of 27 different mixtures (Table 1). The main parameters of the wort, as well as the parameters characterizing its biological value, were used as target functions.

2.3. Wort Characteristics

2.3.1. Mashing Method

Mashing was conducted according to the Congress mash method of the European Brewery Convention [14]. A total of 50 g of milled malt or malt mixture, according Table 1, were mixed with 200 mL of water, pre-heated to 45 °C. The mash was placed in the mashing bath and continually stirred. The temperature was set at 45 °C for 30 min. Afterwards, it was raised at the rate of 1 °C/min for 25 min. When the temperature reached 70 °C, 100 mL of water at the same temperature was added and the mash stayed at 70 °C for 1 h. The mash was then cooled to 20 °C, stirred and rinsed, the rinsings going into the mash. The mash volume was adjusted to 450 g by the addition of water at 20 °C. The mash was filtered through Macherey–Nagel 614 1/4 filter paper. During filtration, the first 100 mL of the filtrate were re-filtrated. Wort obtained was used for the further analysis.

2.3.2. Wort Analysis

Wort extract, pH and colour were determined according to the methods of the European Brewery Convention (Methods 8.3, 8.5, and 8.17, respectively) [14]. Wort extract was measured by the means of Anton Paar DMA 35 density meter (Anton Paar, Graz, Austria). pH was determined by pH meter Sartorius PB–11 (Sartorius, Gottingen, Germany). Wort colour was measured on a Shimadzu UV–VIS1800 spectrophotometer (Shimadzu, Kyoto, Japan) at wavelength 430 nm against distilled water.

2.4. Extraction and Determination of Phenolic Compounds

2.4.1. Extraction of Phenolic Compounds from Malt and Wort

The wort obtained according to method 2.3.1 was diluted with methanol in a proper ratio. After 30 min it was filtered using Whattman No.1 filter paper. The methanolic extracts were used for analysing phenolic compounds concentration and antioxidant activity of wort.

2.4.2. Determination of Phenolic Compounds Content

Content of Total Phenolic Compounds (TPC) with Folin–Ciocalteu (FC) Reagent

The total phenolic compounds content was determined according to Dvorakova et al. [15]. Briefly, a mixture of 1 cm3 of methanol extract of wort, 4 cm3 of FC reagent (10 times diluted with distilled water), and 5 cm3 of sodium carbonate (7.5%, w/v) was homogenized and left for 1 h. The absorbance (A) was recorded at 765 nm against a blank prepared with distilled water using Shimadzu UV–VIS1800 spectrophotometer (Kyoto, Japan). The results were calculated by a calibration curve and were presented as mg Gallic acid equivalent (GAE)/L wort:
T P C = ( A 765 + 0.0083 ) K P 0.0098 ,   mg   GAE / L
where: A765—absorbance of the sample of 765 nm, Kp—dilution coefficient.

Content of Phenolic Compounds by the Glories Method

The content of total phenols, phenolic acids and flavonoids was determined by a modified Glories method [16]. A mixture of 1 cm3 of 0.1% HCl in 95% ethanol (v/v), 18.2 cm3 of 2% HCl (v/v) and 1 cm3 of methanol extract was allowed to stand for 15 min. Afterwards, the absorbance was measured against a blank prepared with distilled water at three wavelengths—280, 320 and 360 nm. The A were used for evaluation of the contents of TPC, phenolic acids content (PA), and flavonoids (F). The results were calculated by calibration curves and were presented as GAE/L for TPC, caffeic acid equivalent/L (CAE/L) for PA, and Quercetin equivalent (QE/L) for F, respectively:
T P C = 391.88 A 280 K P ,   mg   GAE / L
P A = 210.83 A 320 K P ,   mg   CAE / L
F = 321.94 A 360 K P ,   mg   QE / L
where: A280—absorbance of the sample of 280 nm; A320—absorbance of the sample of 320 nm; A360—absorbance of the sample of 360 nm; Kp—dilution coefficient.

2.5. Antioxidant Activity (AOA) of Wort

2.5.1. AOA against the DPPH (2,2′-Diphenyl-1-picrylhydrazyl) Radical

The wort AOA was measured by the DPPH method [17], and 0.25 mL of methanol extract (working sample) or methanol (control) was added to 2.25 mL of 6 × 10⁻⁵ M DPPH solution in methanol. The mixture was left in dark for 15 min and then the absorbance at 517 nm against a blank prepared with distilled water was recorded. The percentage inhibition activity was determined by:
I = 100 A 1 A 2 A 1 ,   %  
where: I—percentage inhibition; A1—the absorbance of the control at 517 nm; A2—the absorption of the working sample at 517 nm.
A standard curve, measuring AOA of Trolox (6-hydroxy-2,5,7,8-tetramethylchroman-2-carboxylic acid) against DDPH radical was obtained, and the results were expressed as μM Trolox equivalents (TE)/L wort:
A O A = ( I + 0.6711 ) K P 0.341 ,   μ M   TE / L
where: I—percentage inhibition; Kp—dilution coefficient.

2.5.2. AOA by the FRAP (Ferric Reducing Ability of Plasma) Method

The FRAP analysis was performed according to the method, described by Benzie and Strain [18] with the following modifications. FRAP solution was prepared by mixing of 300 mM acetate buffer (3.1 g of C2H3NaO2 × 3H2O and 16 cm3 of C2H4O2) with a pH of 3.6, 10 mM TPTZ (2,3,5-Triphenyltetrazolium chloride) solution in 40 mM HCl and 20 mM FeCl3 × 6H2O solution in a ratio of 10:1:1. Then, 0.15 mL of the methanol extract was mixed with 2.85 mL of FRAP solution and left for 4 min in the dark. The A was read at 593 nm against a blank prepared with methanol. The standard curve, measuring AOA of Trolox was used, and the results were expressed as μM TE/L wort:
A O A = ( A 593 + 0.0235 ) K P 0.0024 ,   μ M   TE / L
where: A593—absorbance of the sample of 593 nm; Kp—dilution coefficient.

2.5.3. AOA by the ABTS (2,2′-Azinobis- (3-ethylbenzothiazoline-6-sulfonate)) Method

The ABTS analysis was performed as described in Iqbel et al. [19] with the following modifications. Equal amounts of 7 × 10⁻³ M ABTS solution and 2.45 × 10⁻³ M potassium persulfate solution was mixed and allowed to react in dark for 12–16 h. The resulting solution was diluted with methanol in a ratio of 1:30 until an absorbance of 1.1 ± 0.1 at 734 nm against methanol was reached. Then, 0.15 mL of methanol extract (working sample) or methanol (control) was added to 2.85 mL of ABTS solution. The mixture was left in dark for 30 min and then the absorbance at 734 nm against methanol was recorded. The percentage inhibition activity was determined by:
I = 100 A 1 A 2 A 1 ,   %  
where: I—percentage inhibition; A1—the absorbance of the control at 734 nm; A2—the absorption of the working sample at 734 nm.
A standard curve, measuring AOA of Trolox against ABTS radical was obtained, and the results were expressed as μM TE/L wort:
A O A = ( I + 0.8376 ) K P 0.1536 ,   μ M   TE / L
where: I—percentage inhibition; Kp—dilution coefficient.

2.5.4. AOA by the CUPRAC (Cupric Reducing Antioxidant Capacity) Method

The CUPRAC analysis was performed as described in Apak et al. [20]. The working samples were prepared by mixing 1 mL of 0.01 M CuCl2·2H2O, 1 mL of ammonium acetate buffer (pH 7), 1 mL of 7.5 × 10⁻³ M ethanol solution of neocuproine, 0.5 mL of methanol extract, and 0.6 mL of distilled water. After 30 min A at 450 nm was recorded against the blank sample prepared with distilled water. AOA was calculated by the means of calibration curve and the results were expressed as μM TE/L wort:
A O A = ( A 450 0.0161 ) K P 0.0018 ,   μ M   TE / L
where: A450—absorbance of the sample of 450 nm; Kp—dilution coefficient.

2.5.5. AOA by the ORAC (Oxygen Radical Absorbance Capacity) Method

The ORAC analysis were made according to Denev et al. [21] with some modifications. A total of 170 µL of 70 nM fluorescein (in phosphate buffer (75 mM, pH = 7.4)) and 10 µL of the sample were incubated for 20 min at 37 °C directly in the FLUOstar OPTIMA fluorimeter (BMG LABTECH, Germany). Then, 20 μL of 51.5 mM AAPH (2,2-azobis- (2-amidino-propane) dihydrochloride) (in phosphate buffer (75 mM, pH = 7.4)) was added to the reaction mixture. The mixture was automatically shaken and fluorescence was read every minute until reaching zero value. To express the antioxidant activity, a standard curve with Trolox solutions (6.25 µM, 12.5 µM, 25 µM, 50 µM and 100 µM) was used. The antioxidant concentration in the sample was directly proportional to the area under the decaying fluorescence curve. The area under the attenuation fluorescence curve of a 1μM Trolox solution was assumed as one ORAC unit. The results were expressed in µmol TE/L. An excitation wavelength of 485 nm and an emission wavelength of 520 nm were used.

2.6. Statistical Analysis

The statistical data processing was performed with the help of Statgraphics Centurion XV, Trial version with the help of algorithms set in the program itself. The multiple response optimization procedure helps to determine the combination of experimental factors which simultaneously optimize several responses—DPPH, Extract, FRAP, ORAC and TPCFC by maximizing a desirability function.

3. Results and Discussion

Four malt types were selected for the development of malt mixtures on the basis of previous research [5]—Vienna, Melanoidin, Caramel pils, and Special X. Vienna malt is a basic malt type with slightly darker colour than the most common malt used in brewing–Pilsen malt but with the same enzymatic activity. Melanoidin malt is another basic malt types that can be used in the production in dark to chestnut–red beers because contributes to their colour and aroma. Caramel pils is a specialty malt type. Its colour is comparable to Pilsen malt and it is used for providing caramel and honey taste to beers. Special X is a roast malt type that is used in dark beer production for adding different flavours such as dried fruits and chocolate [22]. The main brewing characteristics, phenolic compounds content and antioxidant activity of wort obtained after mashing of all the mixtures according to Table 1 were evaluated.

3.1. Main Brewing Characteristics

The results for main brewing characteristics—extract, pH and colour of wort are presented in Table 2.
The main purpose of mashing is to produce wort with highest extract and desirable pH because pH is crucial for quality of beverage produced. The highest extract showed wort produced with 100% Vienna (Variant 11) and 100% Melanoidin malts (Variant 23), respectively, and the lowest—the wort, produced with 100% Special X malt (Variant 8). As expected, the combination of Vienna and Melanoidin malts resulted in high wort extract (Variant 13). Interestingly, the combination of Caramel pils and Special X malt also led to high extract of wort produced. The highest extract for the three–component mixture was observed when Vienna, Melanoidin and Special X were used. The combination between four malts led to the highest wort extract when the ratio between malts was 5:1:1:1 for Vienna, Melanoidin, Caramel pils, and Special X, respectively (Variant 15).
According to O’Rourke [23] pH of wort has to be 5.6 ± 0.2. Therefore, on the basis of the results, only the combination of Vienna and Melanoidin malts in ratio 2:1 can be used for the extract and pH of wort.
Wort colour was measured because our previous study showed that there was a relationship between wort colour and antioxidant activity [5]. The darkest colour showed wort produced with 100% Special X malt (Variant 8) and the lightest colour showed the wort produced with 100% Caramel pils malt (Variant 12). Therefore, it can be hypothesized that the highest antioxidant activity will be present in wort from 100% Special X malt.

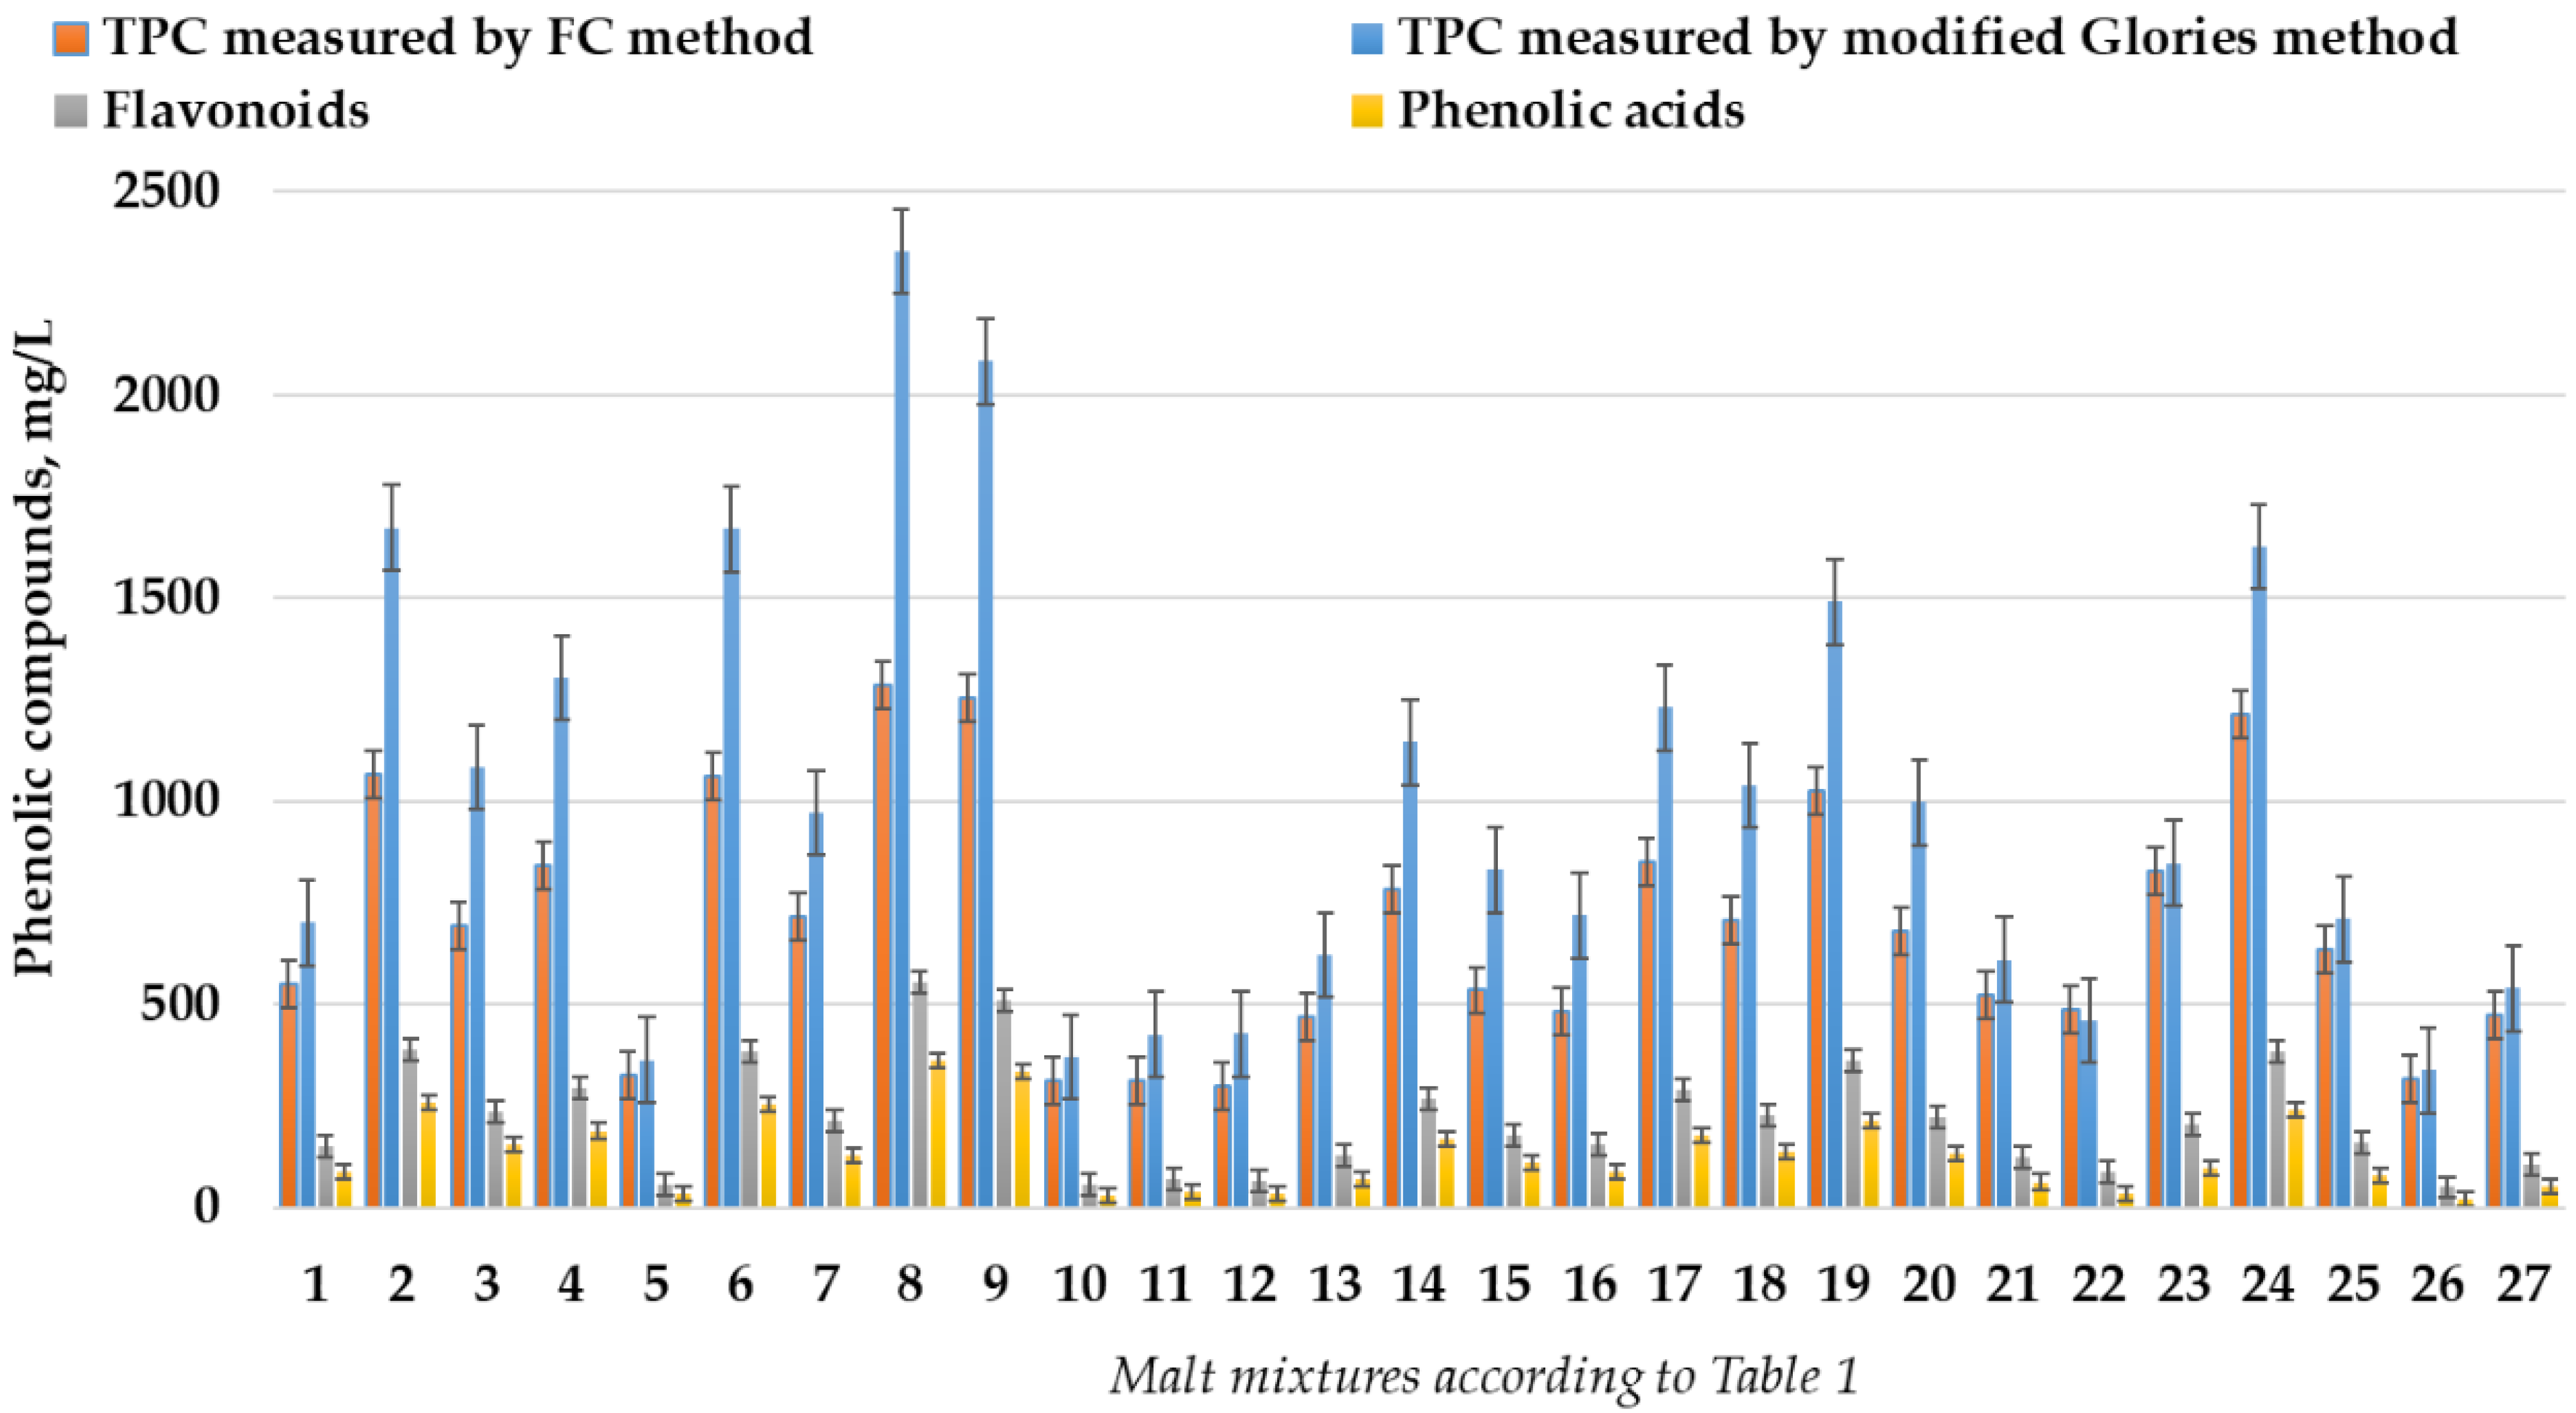
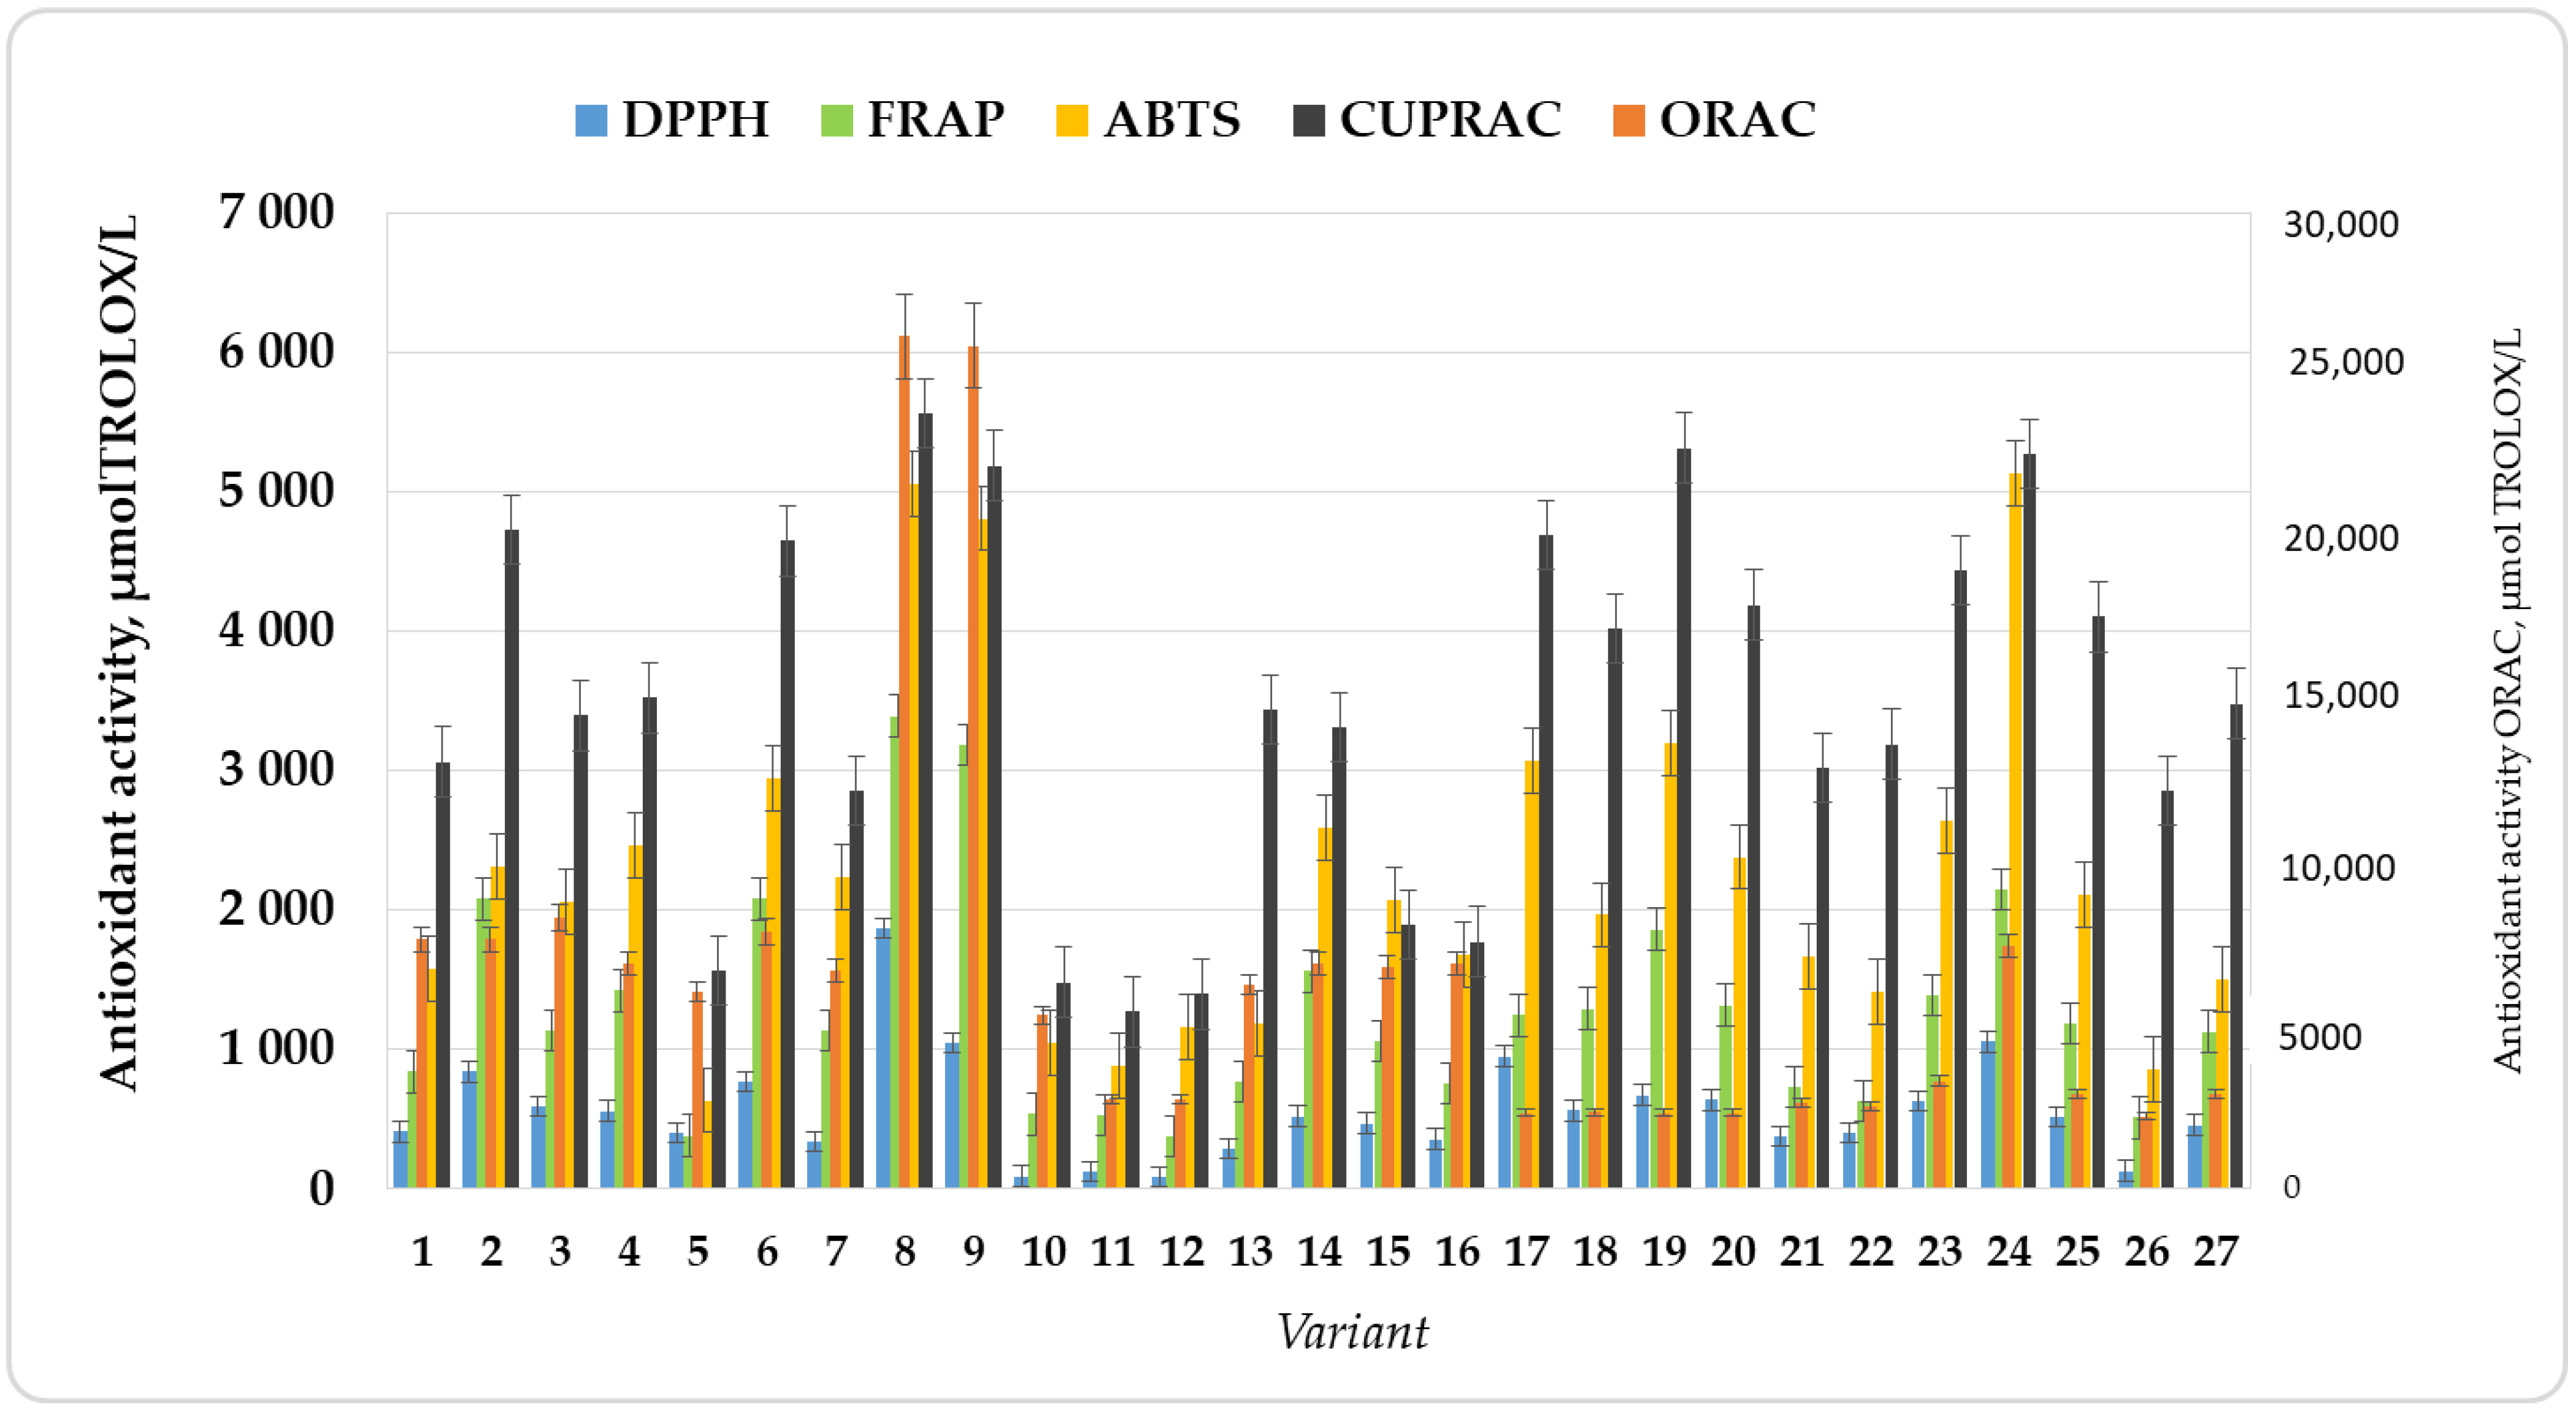
3.2. Phenolic Content and AOA of Malt Mixtures

Phenolic compounds in malts plays two major roles—as antioxidants and controlling colloidal and flavour stability of beverages produced [24]. Phenolic compounds were determined by FC method and modified Glories method and the results are presented in Figure 1. The TPC measured by FC method varied between 300 and 1300 mg/L and TPC measured by modified Glories method varied between 340 and 2350 mg/L. The results of TPC are different because the results obtained by FC are influenced by the oxidative status of the sample [25]. The highest TPC content measured by both methods as from wort produced by 100% Special X malt (Variant 8). The lowest TPC measured by FC method and Modified Glories method was from wort produced by 100% Caramel pils (Variant 12) and 100% Vienna malt (Variant 26), respectively. Phenolic acids varied between 60 and 390 mg/L. The lowest concentration of PA was from wort produced by 100% Vienna malt (Variant 26), and the highest amount was from wort produced by 100% Special X malt (Variant 8). Flavonoids varied between 20 and 362 mg/L for wort produced by 100% Vienna and 100% Special X malt, respectively. The results showed that almost 1/3 of TPC in wort were PA and F.
The antioxidant potential of wort is crucial for the production of beverages with high biological value. The AOA of wort should be determined by more than one method to obtain reliable results. The results for AOA evaluated by DPPH, FRAP, ABTS, CUPRAC and ORAC are shown in Figure 2. The lowest AOA was measured by the DPPH method, and the highest by the CUPRAC and ORAC methods. The most significant of them is ORAC because it uses a relevant biological source [26]. The highest AOA measured by DPPH, FRAP, CUPRAC and ORAC methods was from the wort produced by 100% Special X malt (Variant 8). Although its results for antioxidant activity, measured by ABTS method were close to the results of Variant 24 (mixture of Caramel pils and Special X in ratio 1:2), they marginally lower. The lowest antioxidant activity measured by DPPH was from Variant 10 (mixture of Vienna and Caramel pils malt in ratio 2:1). The lowest results of antioxidant activity measured by FRAP and ABTS were for Variant 5 (mixture of Vienna and Caramel pils malt in ratio 1:2). Wort produced by 100% Vienna malt displayed the lowest antioxidant activity, measured by CUPRAC and ORAC. The results for the highest antioxidant activity of wort produced by the 100% Special X malt were expected because of the highest TPC content of this wort. Moreover, they confirmed the hypothesis that the increase in AOA corresponded to the increase in wort color. The lowest TPC in Vienna and Caramel pils wort was a prerequisite for the lowest antioxidant activity in their wort or wort produced by mixture of these malt types.

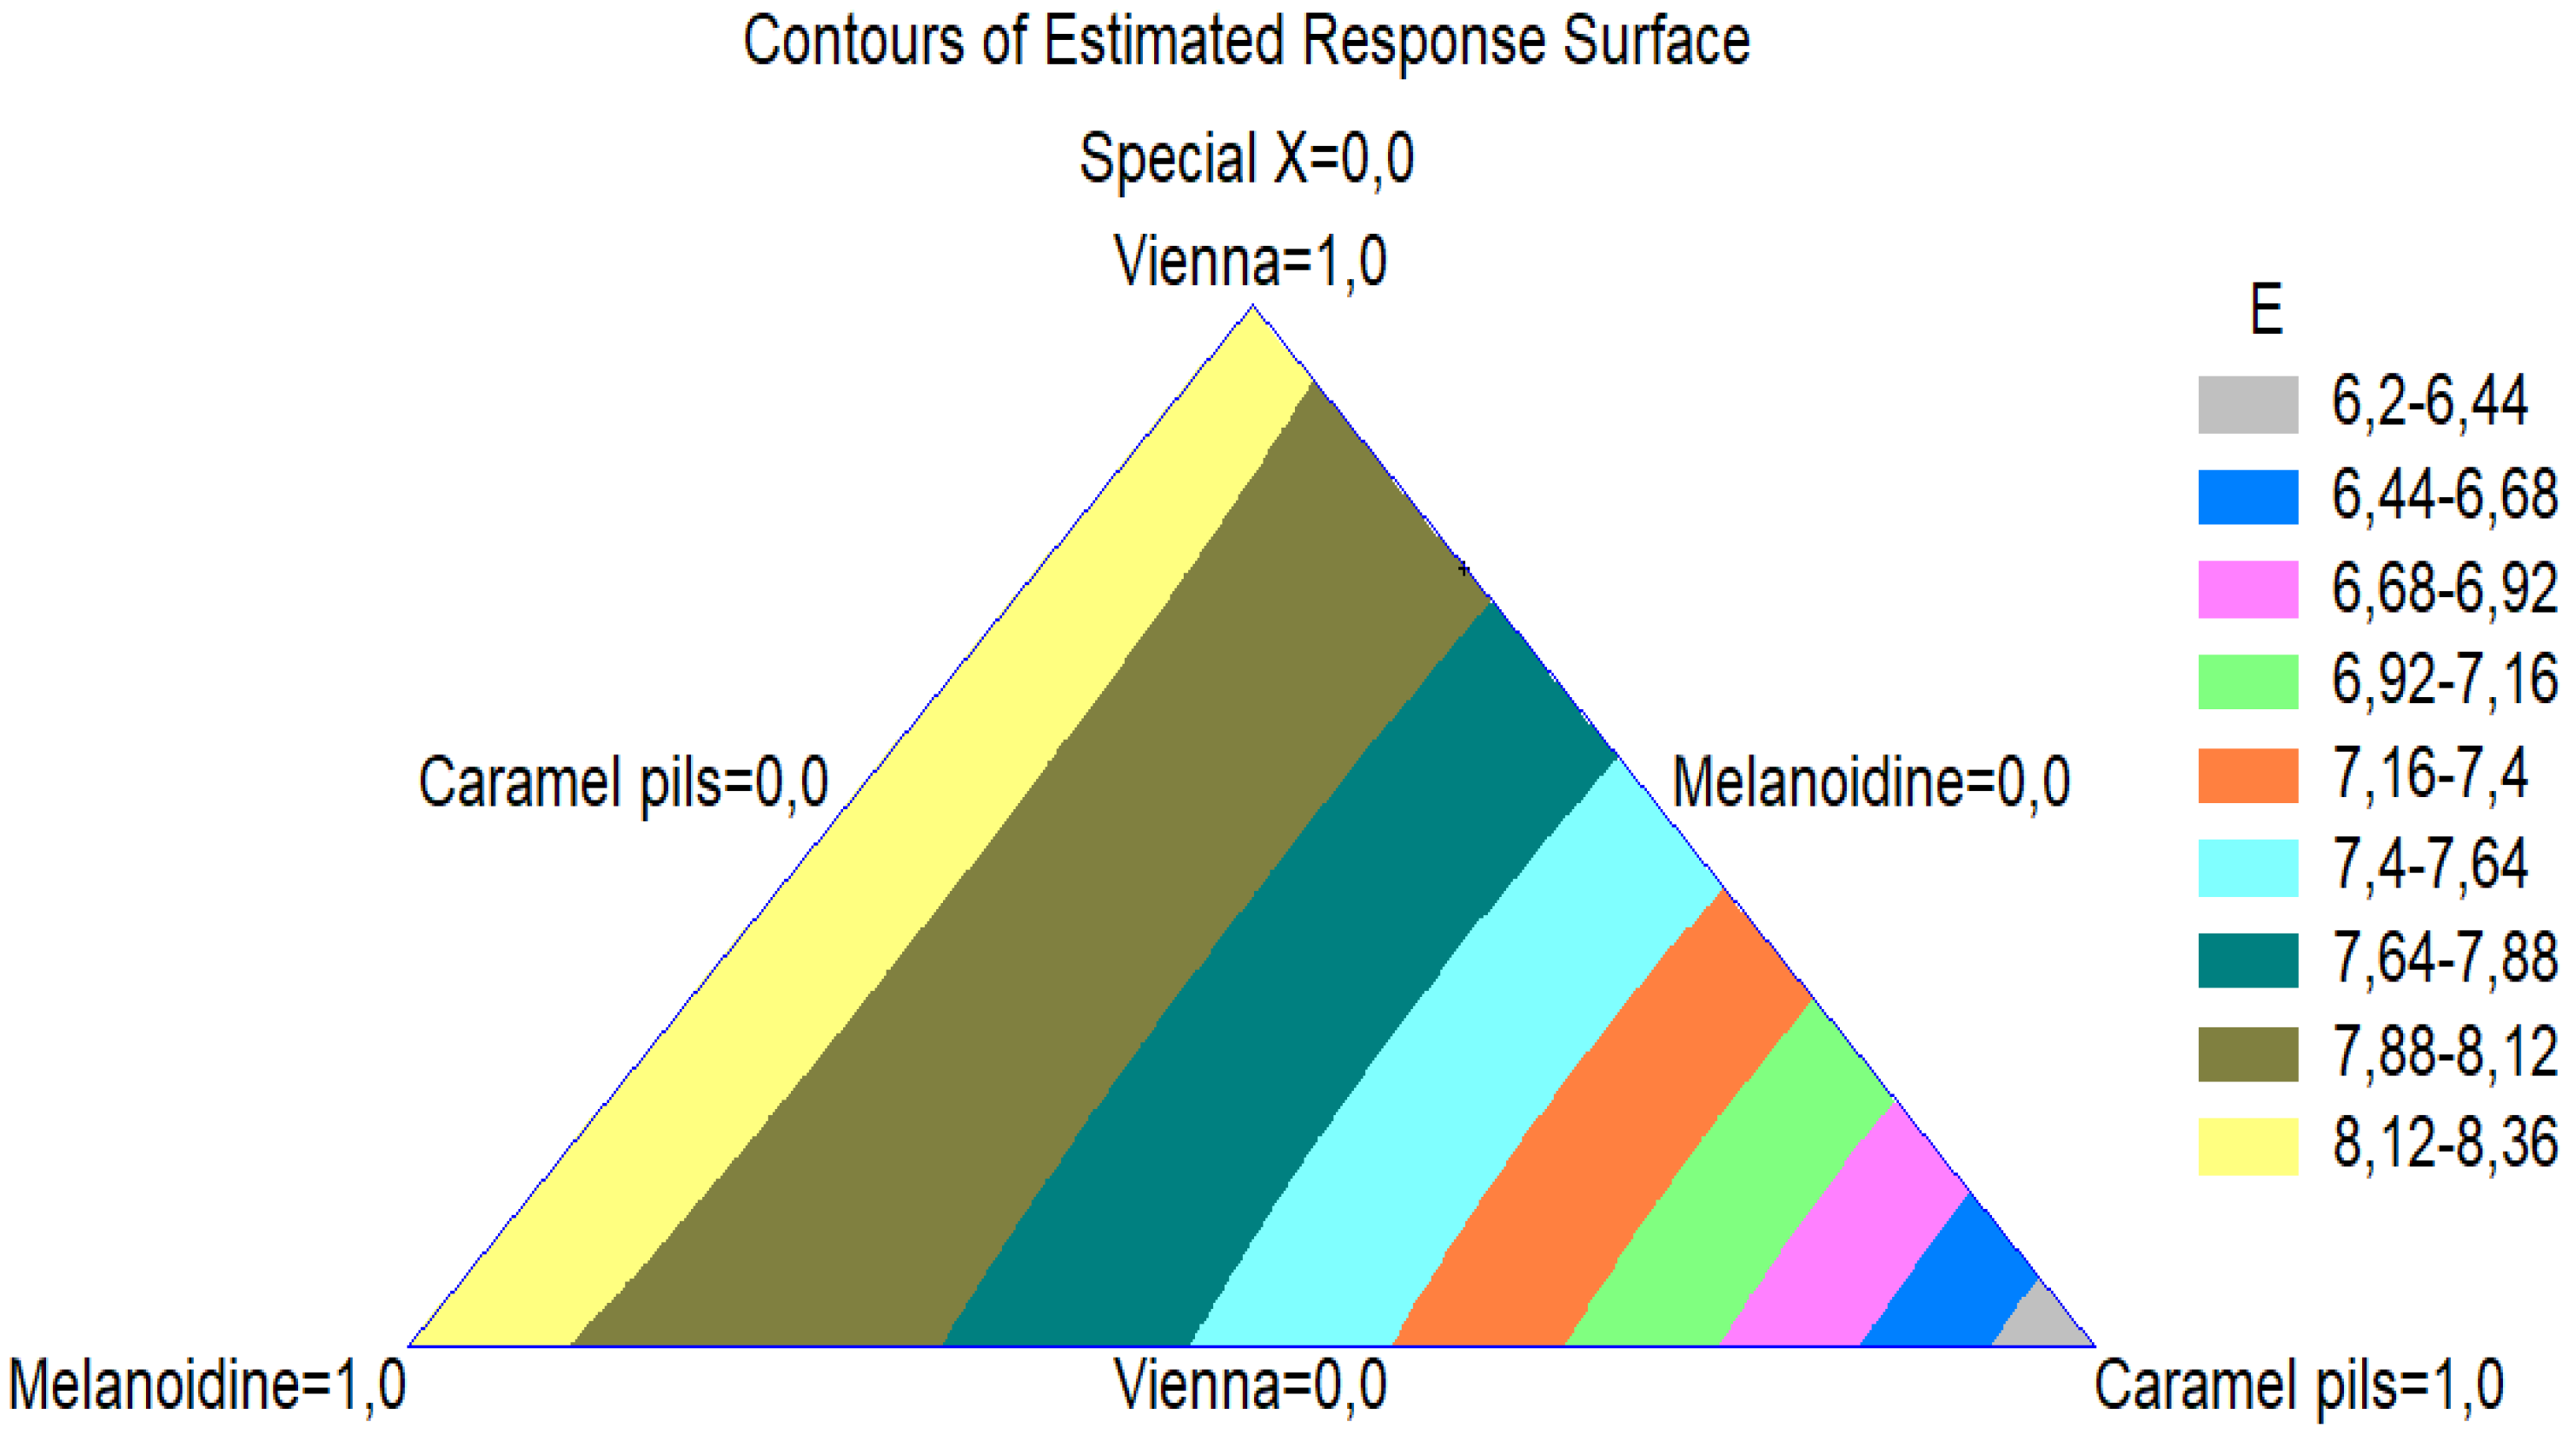
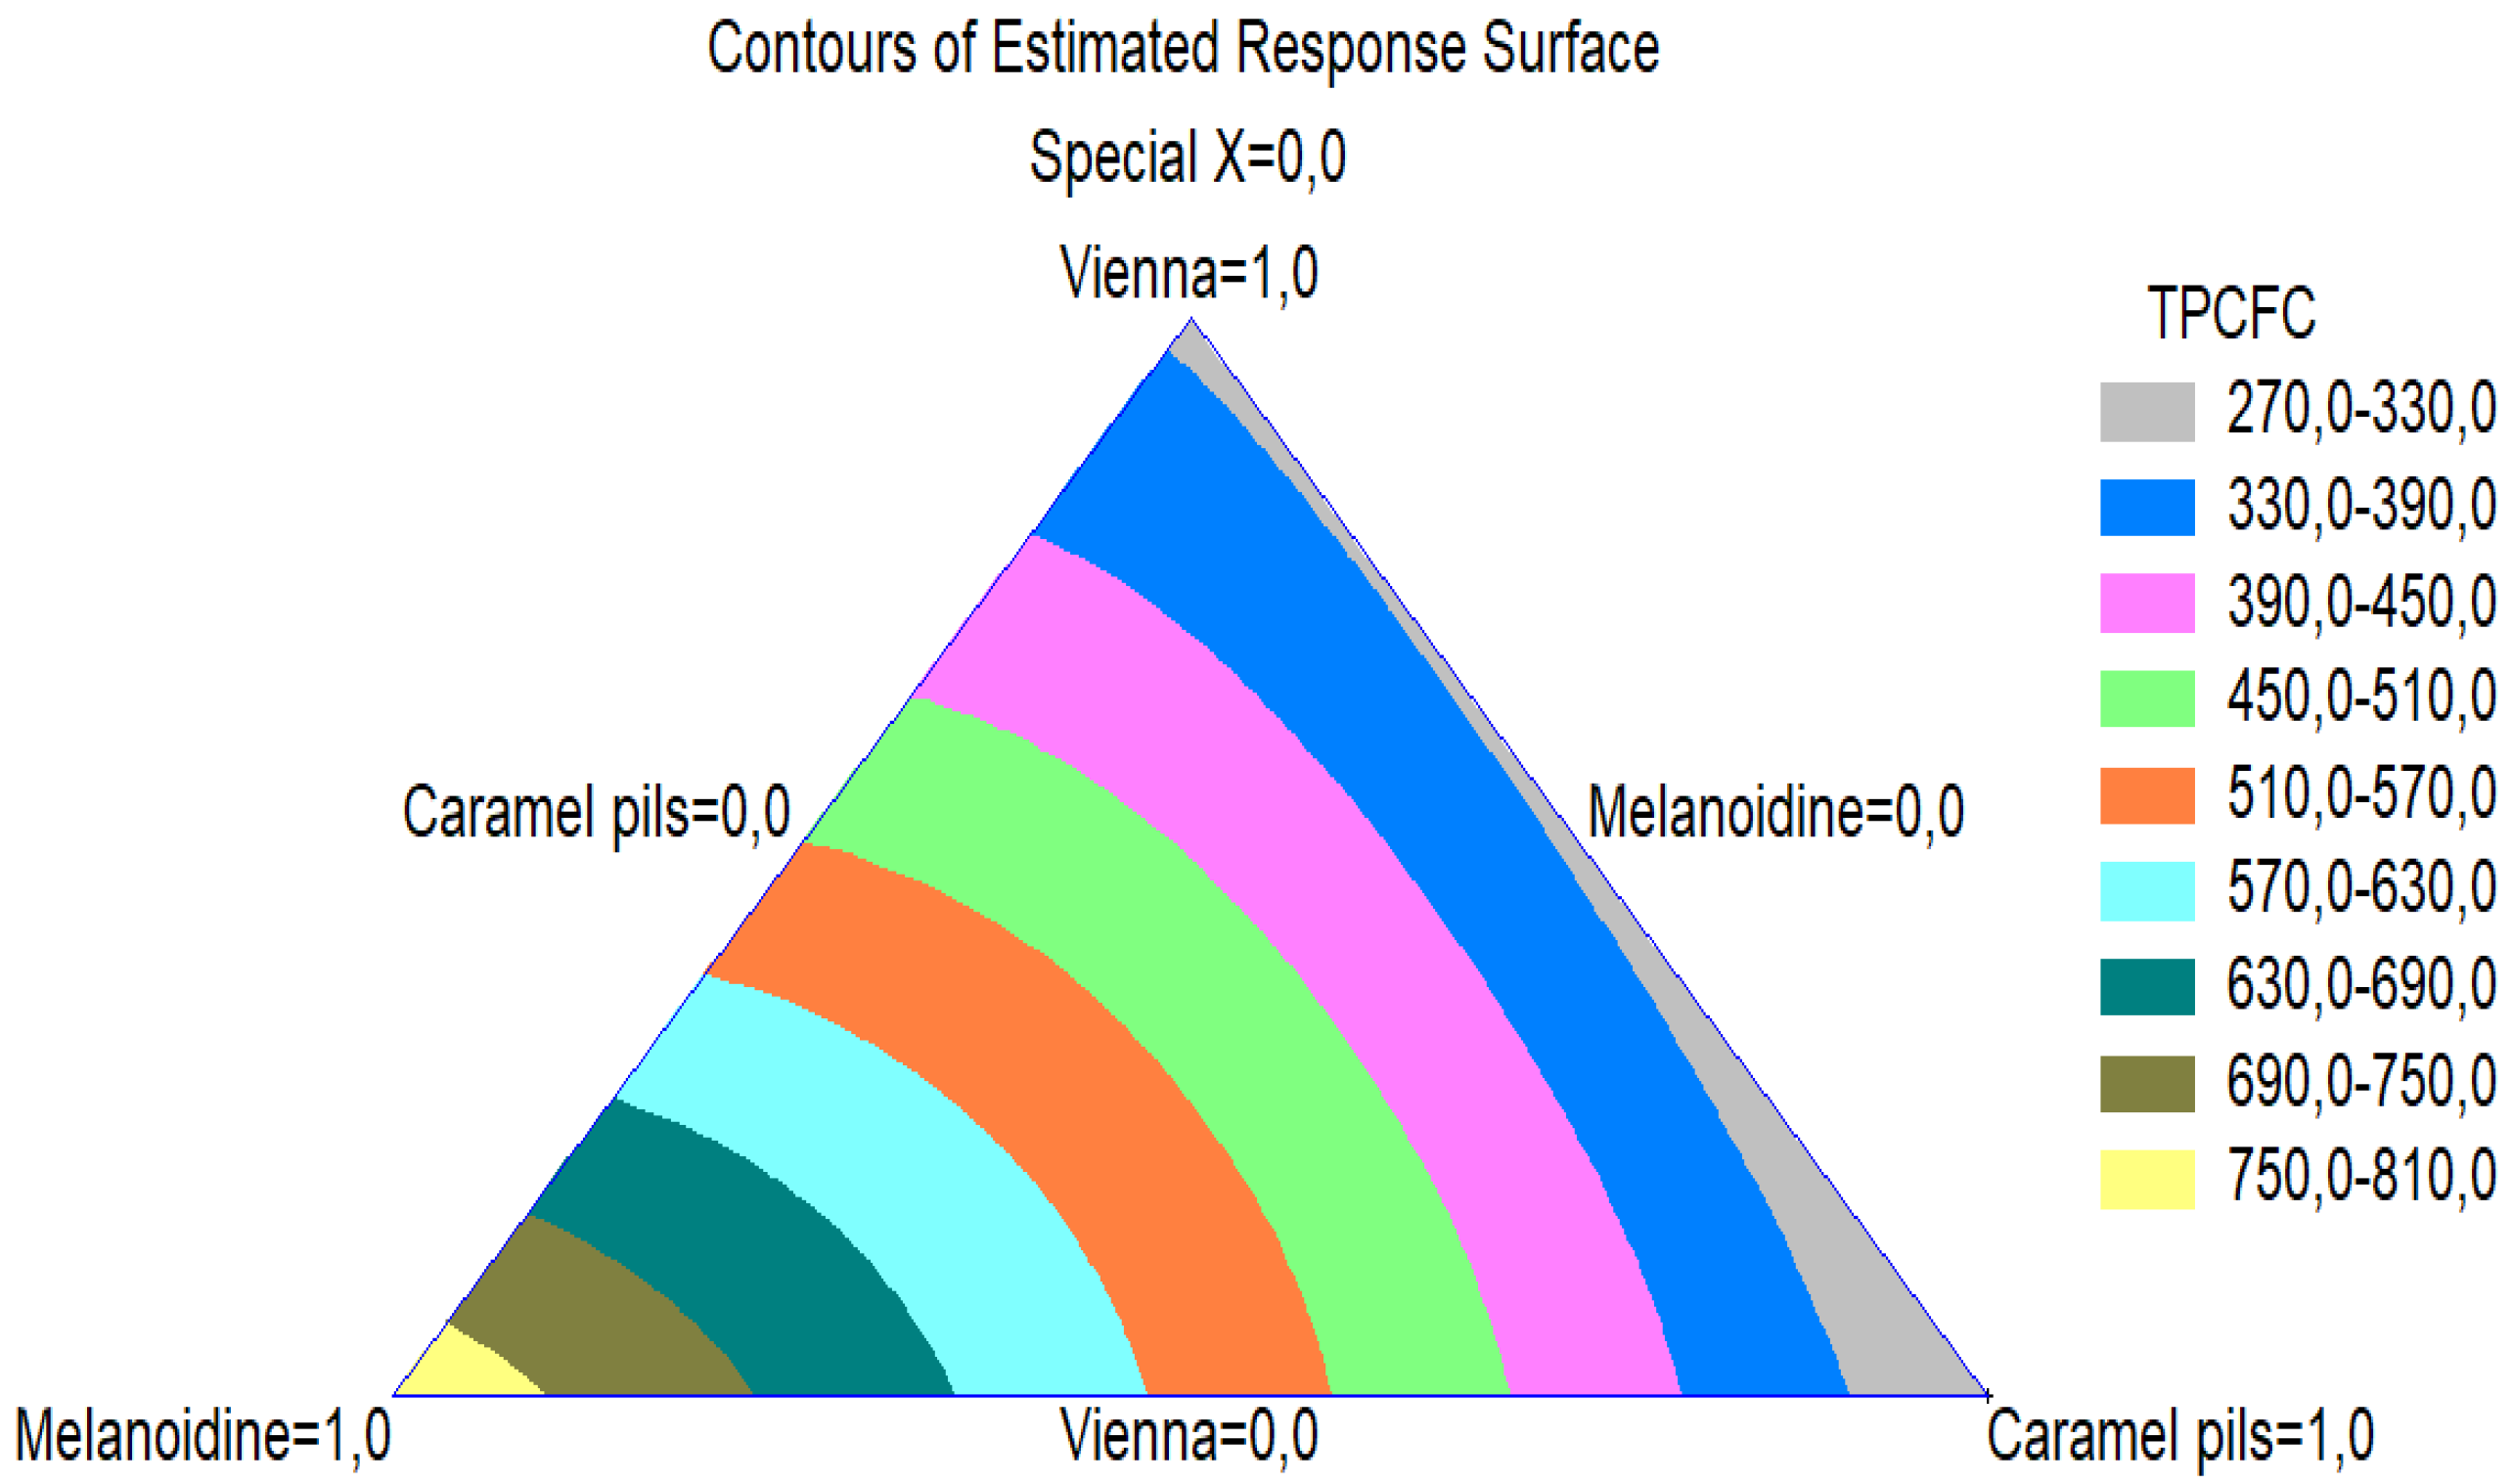
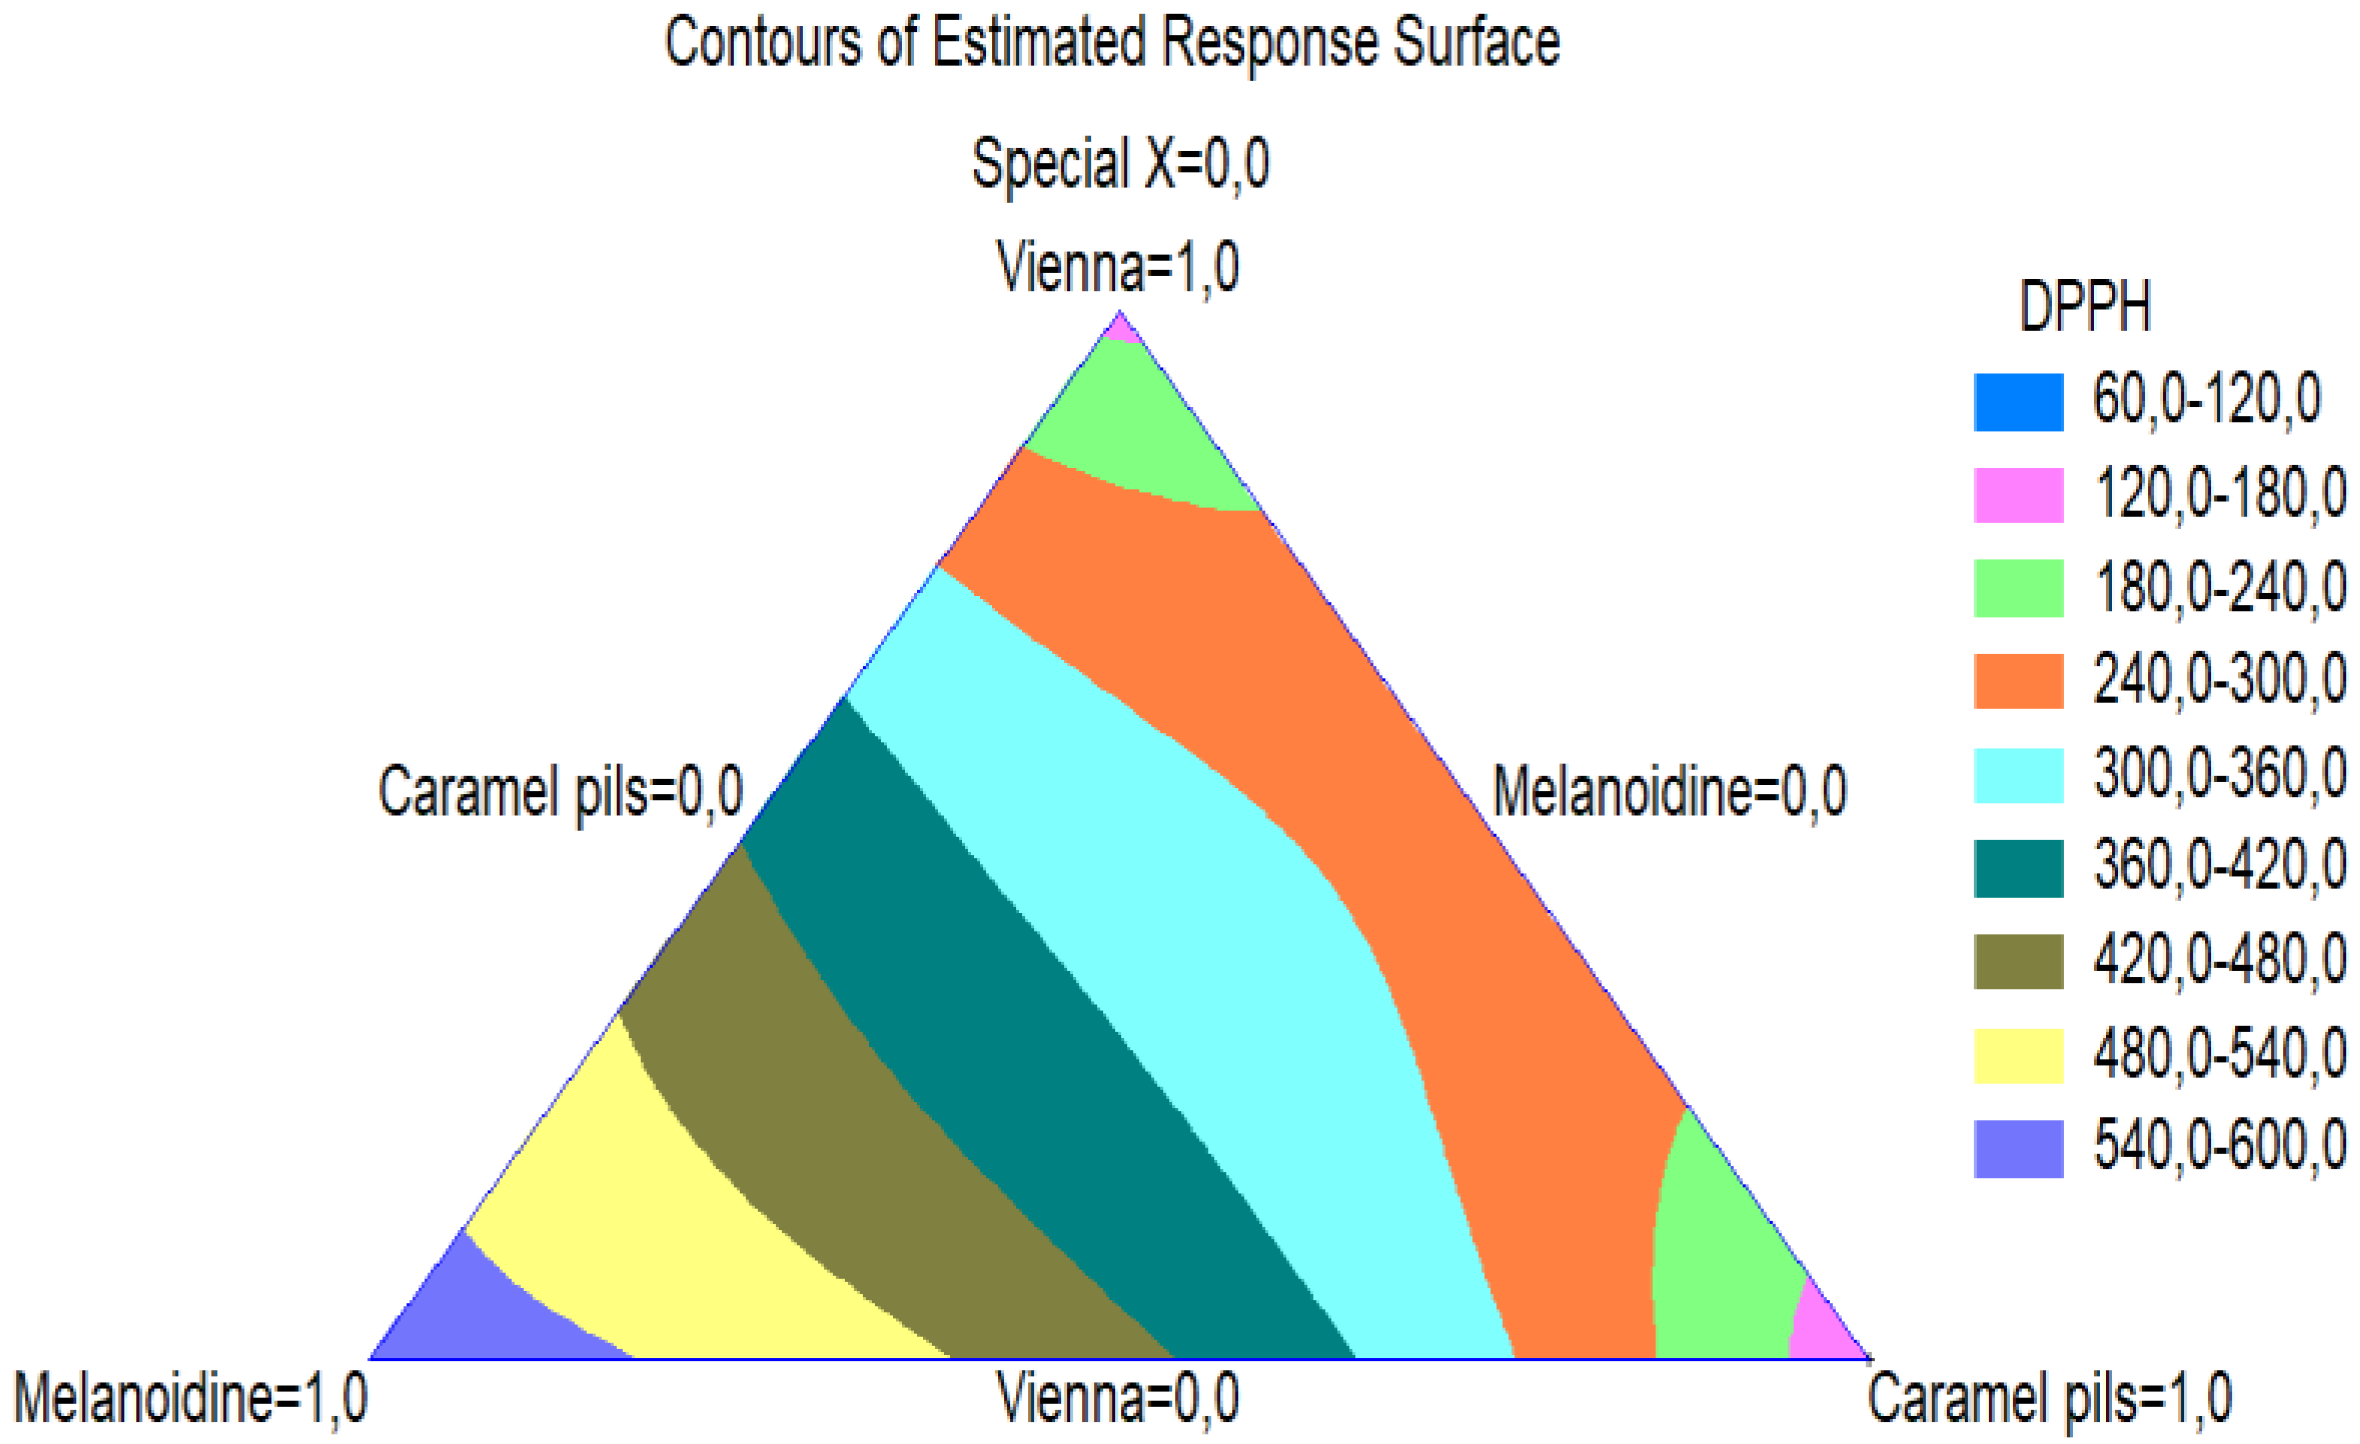
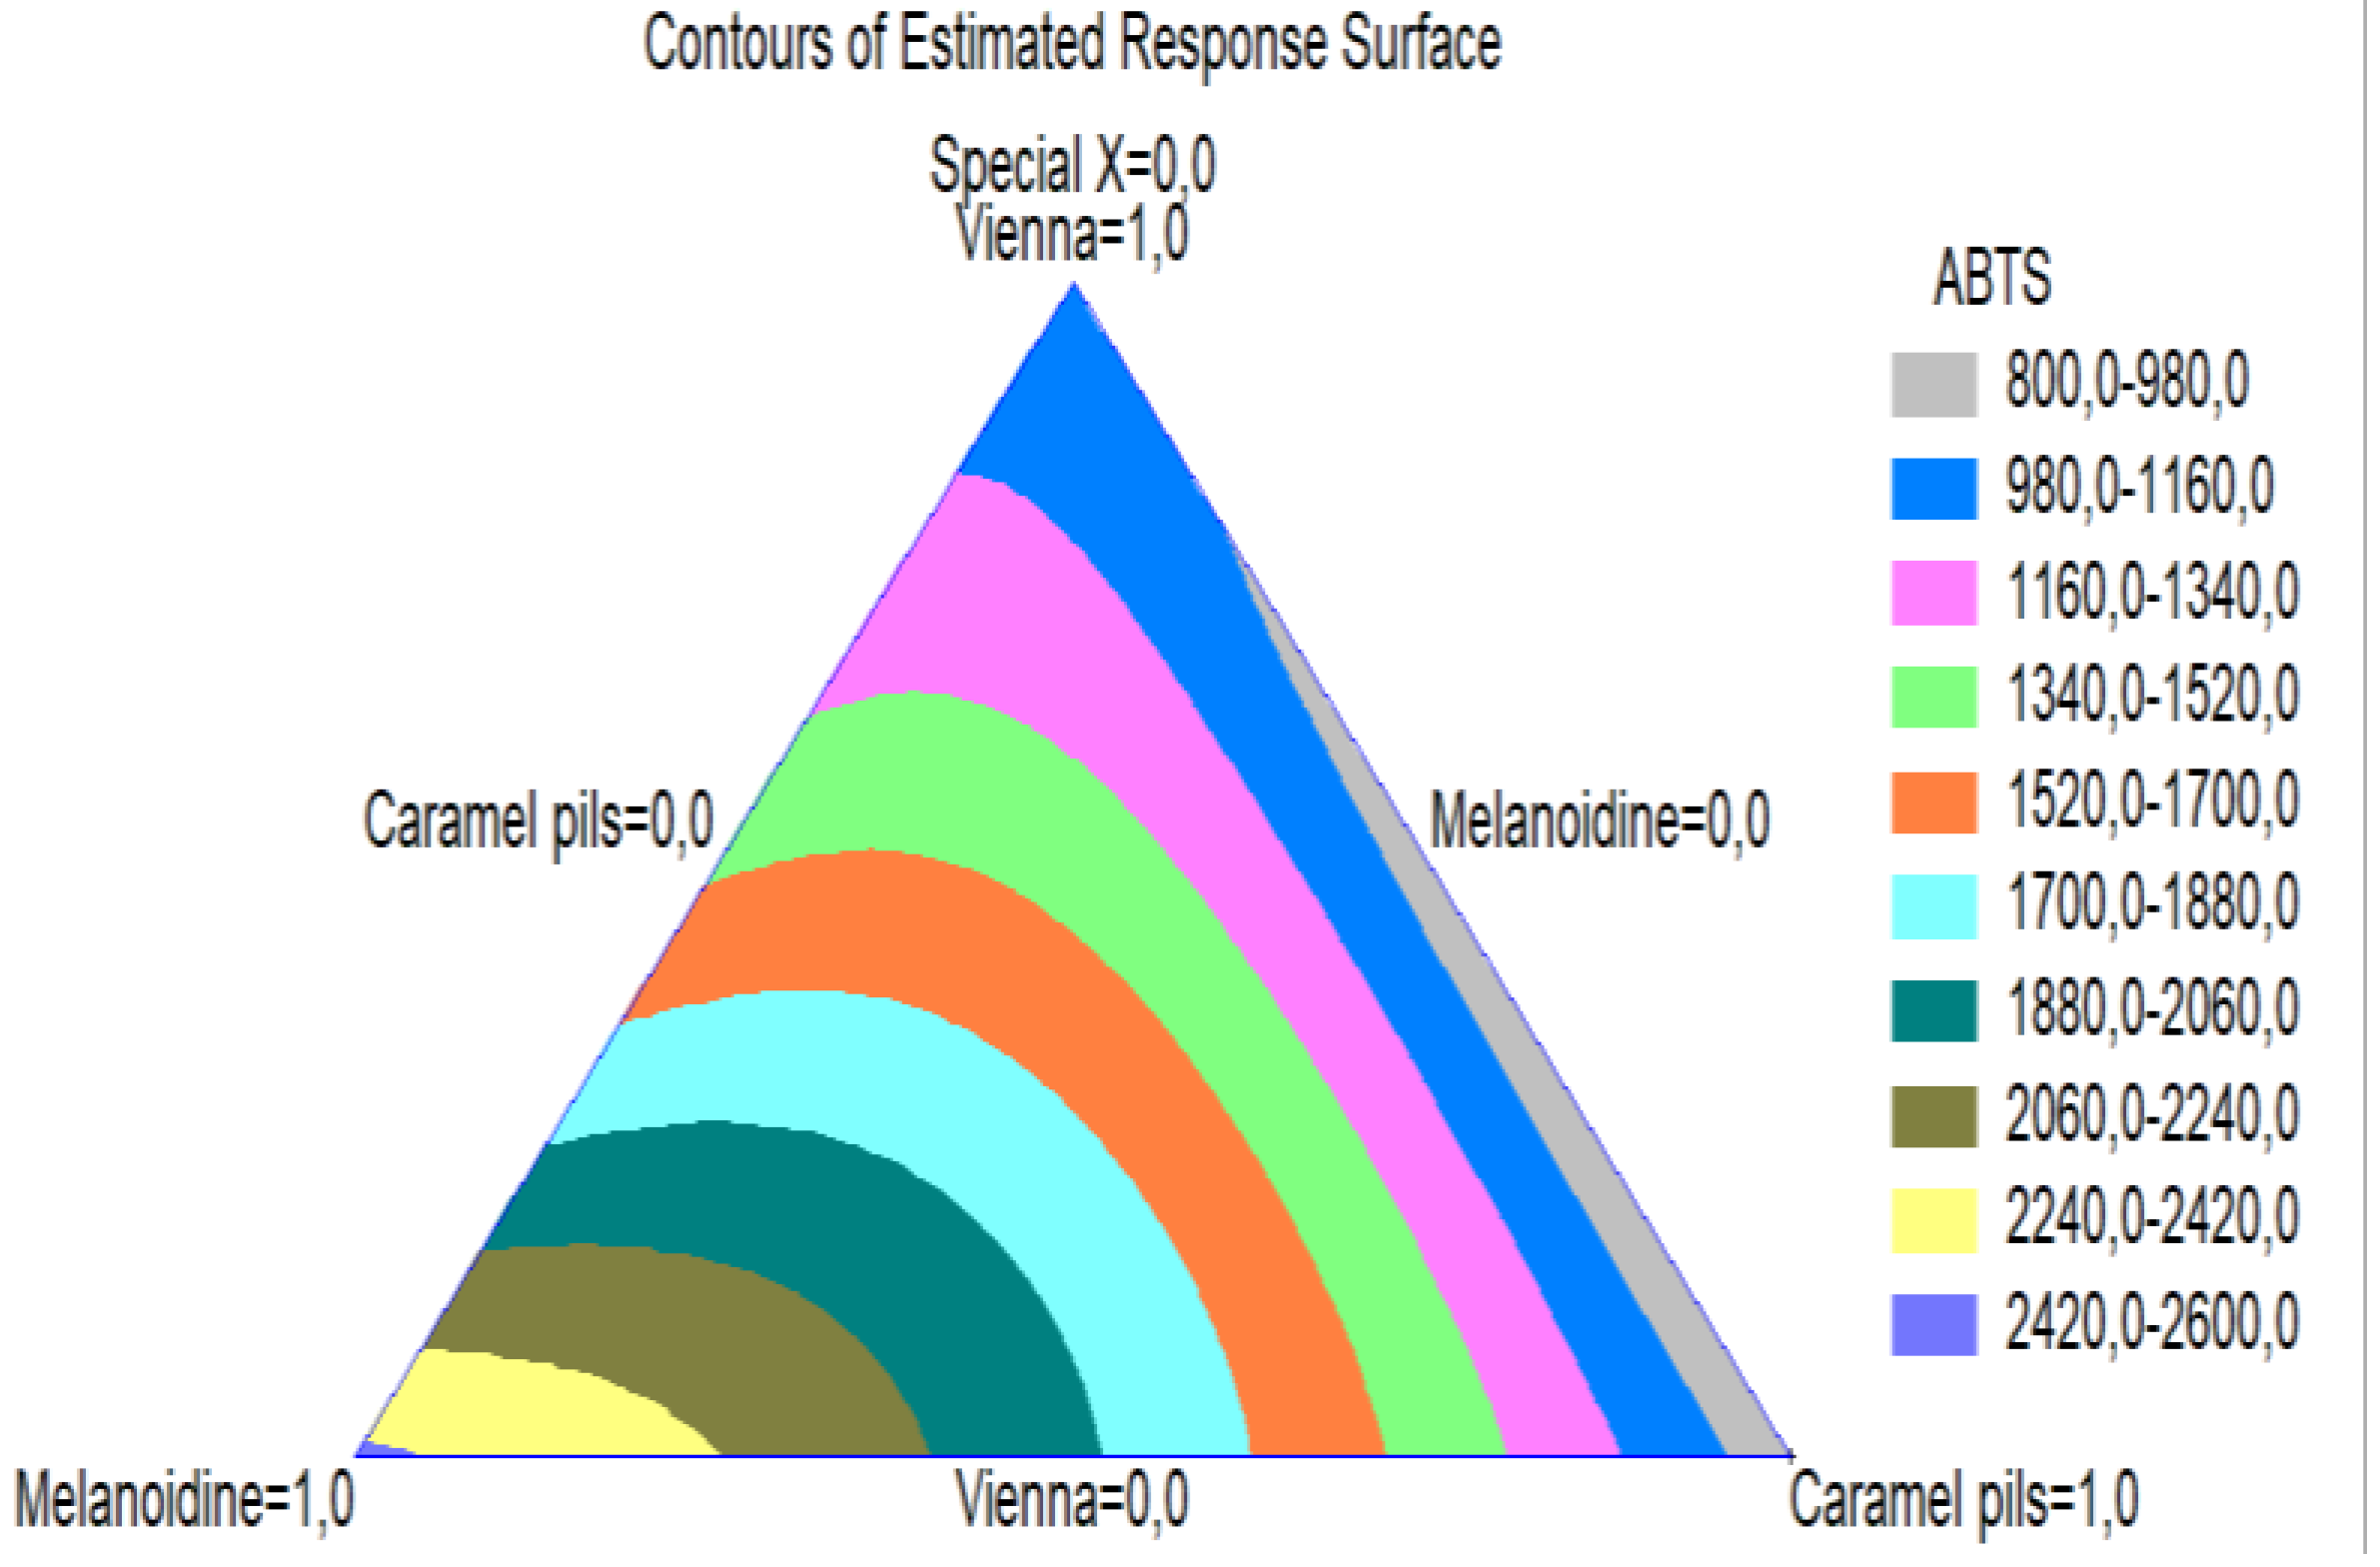
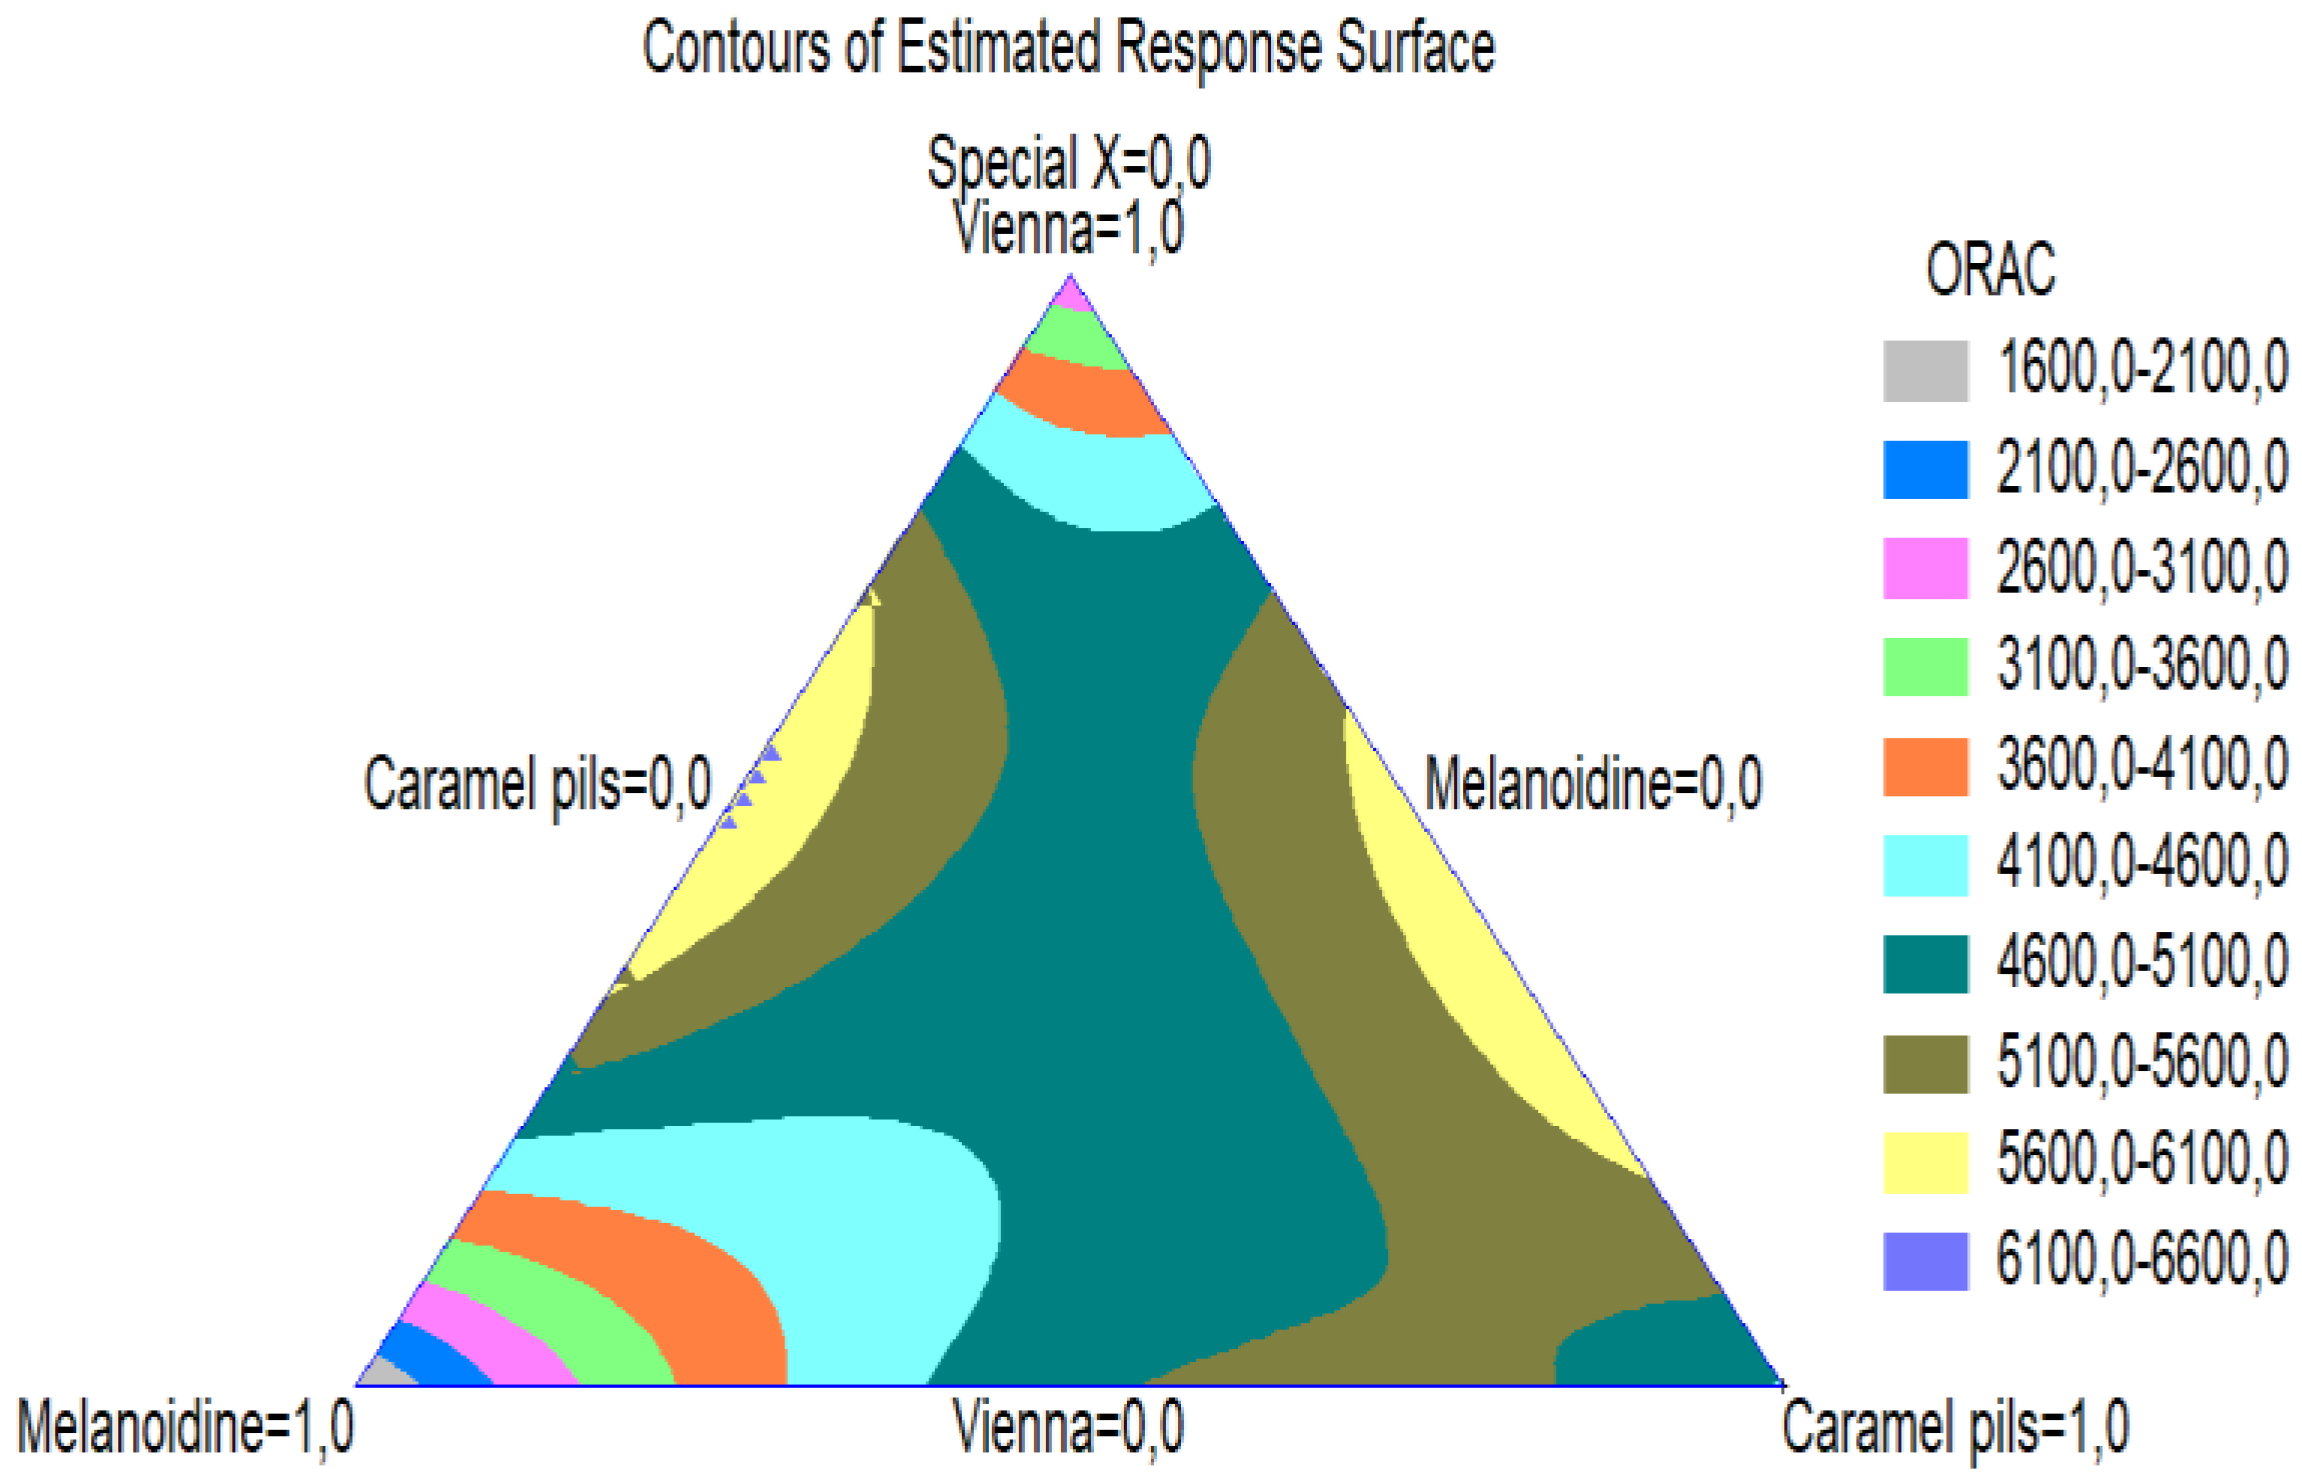
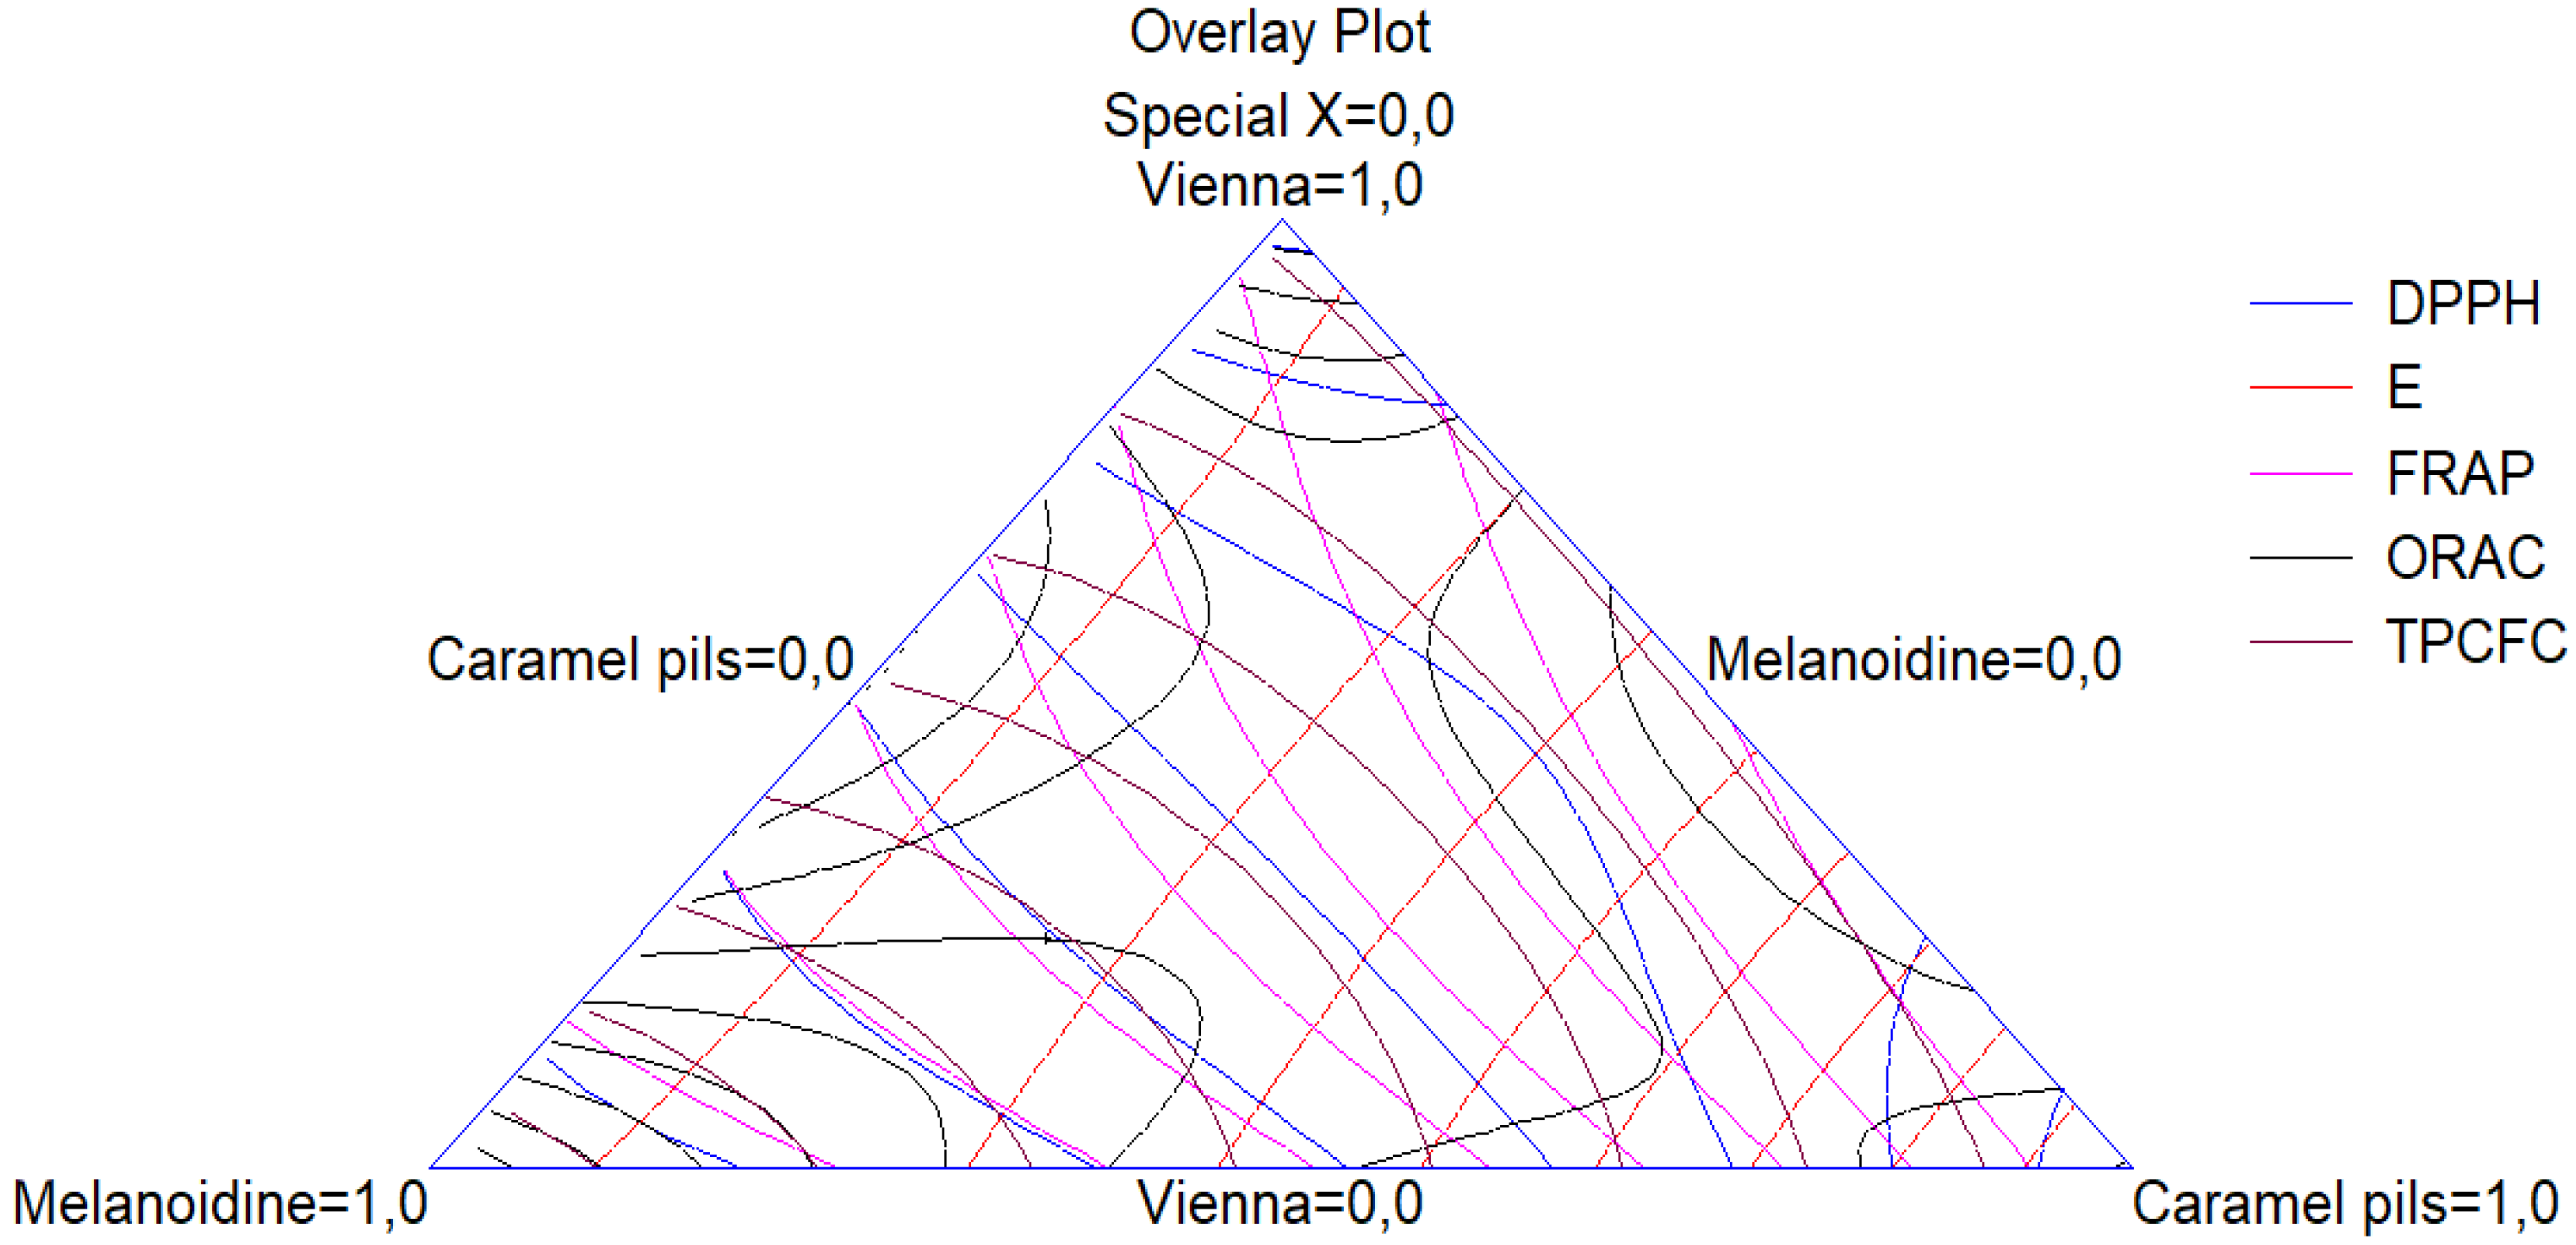
3.3. Mixture Optimization

The conducted experiments were used a basis for the development of adequate regression equations for each of the wort parameters:
E = 8.18 × V + 8.18 × M + 6.23 × CP +3.98 × SX + 0.21 × V × M + 1.26 × V × CP + 8.46 × V × SX + 1.46 × M × CP + 7.11 × M × SX + 11.36 × CP × SX − 1.21 × V × M × CP − 11.24 × V × M × SX − 16.78 × V × CP × SX − 19.32 × M × CP × SX
R2 = 80.03%
TPCFC = 321.05 × V + 93.17 × M + 279.01 × CP + 1330.78 × SX − 160.54 × V × M + 76.51 × V × CP + 199.80 × V × SX + 80.72 × M × CP + 321.11 × M × SX + 647.11 × CP × SX + 850.08 × V × M × CP − 131.46 × V × M × SX − 572.28 × V × CP × SX − 1626.82 × M × CP × SX
R2 = 98.74%
TPCFG = 400.08 × V + 809.73 × M + 441.36 × CP + 2345.75 × SX + 185.63 × V × M − 257.38 × V × CP − 174.68 × V × SX + 332.92 × M × CP + 889.55 × M × SX − 256.3 × CP × SX − 2106.6 × V × M × CP + 1818.73 × V × M × SX + 2287.81 × V × CP × SX − 1941.95 × M × CP × SX
R2 = 99.09%
PA = 29.75 × V + 87.83 × M + 40.21 × CP + 363.63 × SX + 67.38 × V × M − 19.09 × V × CP − 12.13 × V × SX + 68.64 × M × CP + 207.77 × M × SX − 39.1561 × CP × SX − 578.06 × V × M × CP + 340.73 × V × M × SX + 260.67 × V × CP × SX − 282.43 × M × CP × SX
R2 = 98.33%
F = 66.25 × V + 187.95 × M + 66.96 × CP + 553.93 × SX + 41.06 × V × M − 48.34 × V × CP 37.92 × V × SX + 117.12 × M × CP + 272.23 × M × SX − 28.26 × CP × SX − 534.53 × V × M × CP + 210.74 × V × M × SX + 597.74 × V × CP × SX − 568.07 × M × CP × SX
R2 = 98.90%
DPPH = 164.28 × V + 568.47 × M + 139.17 × CP + 1750.44 × SX + 206.04 × V × M + 516.31 × V × CP − 1092.63 × V × SX + 333.14 × M × CP − 1436.61 × M × SX − 572.55 × CP × SX − 1407.2 × V × M × CP − 2209.96 × V × M × SX − 841,61 × V × CP × SX + 5590.75 × M × CP × SX
R2 = 92.00%
FRAP = 603.97 × V + 1226.08 × M + 349.78 × CP + 3438.03 × SX + 91.30 × V × M − 118.24 × V × CP − 1527.89 × V × SX + 678,04 × M × CP + 672.30 × M × SX − 1291.21 × CP × SX − 914.70 × V × M × CP − 3528.86 × V × M × SX + 7861.51 × V × CP × SX − 9675.29 × M × CP × SX
R2 = 95.96%
ABTS = 1082.93 × V + 2454.83 × M + 870.10 × CP + 5047.0 × SX − 1080.37 × V × M − 349.50 × V × CP − 2043.33 × V × SX + 1001.63 × M × CP + 591.17 × M × SX + 2370.59 × CP × SX + 6336.12 × V × M × CP − 3595.25 × V × M × SX − 9676.3 × V × CP × SX − 8544.31 × M × CP × SX
R2 = 87.63%
CUPRAC = 2128.31 × V + 4285.35 × M + 1268.66 × CP + 5474.66 × SX + 821.077 × V × M − 693.96 × V × CP + 2746.75 × V × SX + 781.55 × M × CP + 1597.26 × M × SX + 4749.59 × CP × SX + 3281.92 × V × M × CP − 40,170.8 × V × M × SX + 2620.5 × V × CP × SX − 435.47 × M × CP × SX
R2 = 87.04%
ORAC = 2706.69 × V + 1611.94 × M + 4552,48 × CP + 26,279.9 × SX + 15,875.1 × V × M + 9181.41 × V × CP − 43,442.4 × V × SX + 7584.71 × M × CP − 910.52 × M × SX − 36,588.0 × CP × SX − 48,040.8 × V × M × CP + 43,469.3 × V × M × SX + 5424.9 × V × CP × SX − 11,4615. × M × CP × SX
R2 = 76.67%
where: E—wort extract; TPCFC—TPC, measured by FC method; TPCFG—TPC, measured by modified Glories method; PA—phenolic acids; F—flavonoids; DPPH, FRAP, ABTS, CUPRAC, ORAC—methods for measuring antioxidant activity; V—Vienna malt; M— Melanoidin malt; CP—Caramel pils malt; SX—Special × malt.
Data from the ANOVA analysis are presented as Supplementary Material (S1). All the models described the experimental data with a high degree of accuracy, as the correlation coefficient varied in the range of 76.67% to 99.09%.
Some of the iso–lines obtained on the basis of the respective models are presented in Figure 3, Figure 4, Figure 5, Figure 6, Figure 7 and Figure 8. The data from the models and figures show the different influence of the malt types on the wort parameters. Regarding the extract, the most significant influence was from the Vienna and Melanoidin malts. The increase in the amounts of Caramel pils and Special × malt led to a decrease in the extract and their negative effect was proven by the coefficients before the triple combinations (−16.78 × V × CP × SX − 19.32 × M × CP × SX) in the Equation (11) (Figure 3). The biological value of wort is determined by the content of phenolic compounds. The data show that the Special X and Melanoidin malt had the highest influence on the content of phenolic compounds (TPC, measured by FC and modified Glories method, PA and F). In all the models for phenolic compounds (Equations (12)–(15)), the coefficients before Special × and Melanoidin malt are between two- and five-times higher than the coefficients before Vienna and Caramel pils malt. This tendency was also observed in the antioxidant potential of the wort obtained (Equations (16)–(20)). Again, the Special X and Melanoidin malt showed a decisive influence on antioxidant activity of wort obtained. The observed trends are due to the malting processes which were analysed in detail in another study [5]. Interestingly, in some equations the coefficient before the double and triple combinations involving Special X and Melanoidin malts had a negative value. This could be attributed to the low enzymatic activity of darker coloured malts, which hindered the enzymatic hydrolysis and the release of bonded phenolic compounds into wort.
In systems with several responses, it is not realistic to expect the maximum values for all the responses studied. Therefore, we should be satisfied if we have the maximum values for the most important or desired responses. Multiple response optimization was carried out to find the malt mixture with the optimum combination of wort extract, TPC (determined by FC method,) and antioxidant potential (determined by DPPH, FRAP and ORAC methods). The parameters optimisation can be made as they have a minimum (Min), maximum (Max) or target value (Hit, Target); additionally, restrictions can be introduced for the minimum or maximum content of individual components in the mixture. Table 3 shows that the optimization was performed with the following parameters: the extract and the antioxidant capacity (measured by DPPH, FRAP and ORAC) need to be maximum or to have defined target value, and the content of phenolic compounds (TPCFC) needs to be minimal, because TPC affected the colloidal stability of beverage obtained. As the selected functions have different tendencies, the optimization was carried out by placing restrictions in each of the target functions or in the content of a given type of malt in malt mixtures (Table 3).
The results for malt mixture content, obtained from the optimization procedures for each variant are summarized in Table 4. Table 4 also presents the data for the optimized parameters, determined experimentally.
The choice of the best experimental variant should be made on the basis of a compromise between the brewing characteristics and biological value of wort. The data from Table 4 show that all the malt mixtures have similar wort extracts but different biological values. The increase in content of Special X malt in the mixtures led to an increase in biological value of wort obtained. Therefore, Variant 1 had the highest biological value and Variant 5 had the lowest. Special X malt is a roasted malt, and contains more melanoidins and phenolic compounds compared to the other malt types, which results in higher antioxidant potential [5]. Therefore, Variants 1 and 2 can be used for following experiments on the basis of their high biological value. Unfortunately, these variants, together with Variant 3, showed problems with mash filtration and the wort produced presented was atypical with sharp bitterness, which was result of the high content of Special X malt.
Variants 4 and 5 were characterized by better sensory profile, because no sharp and unpleasant bitterness was tasted. Despite their lower biological value compared to previous variants, they showed a higher mash filtration rate. Variant 5 was chosen for further experiments because of its lower phenolic compounds rate which was a prerequisite for high colloidal stability.
ANOVA for the performed optimization of the individual variants is presented in Table 5. Table 5 shows the combination of factor levels which maximize the desirability function over the indicated region. It also shows the combination of the factors at which that optimum is achieved. Figure 9 shows the graphical optimization of variant 5 (according to Table 4), which was determined to be the most suitable for wort production.

4. Conclusions

The aim of this study was to identify the most suitable malt mixture of Vienna, Melanoidin, Caramel pils, and Special × malt for the production wort with increased biological value. The choice was made on the compromise between the brewing characteristics and biological value of wort. The increased in the amount of Special × malt in the mixture resulted in the increase in biological value but led to astringency in the flavour of wort produced and problems with lautering. Therefore, its content was restricted to 15%. The optimised mixture with 24.2% Vienna, 51.8% Melanoidin, 20% Caramel pils, and 4% Special X malts showed higher results for antioxidant activity but lower TPC and extract than predicted by the model. The lower TPC was desired characteristic of wort produced because phenolic compounds are responsible for wort bitterness and low colloidal stability of beverages produced. The optimised malt mixture will be used for the production of functional wort-based beverages as subsequent optimisations will be made on mashing and fermentation.

Supplementary Materials

The following supporting information can be downloaded at: https://0-www-mdpi-com.brum.beds.ac.uk/article/10.3390/beverages8030044/s1, Supplementary Materials S1: ANOVA for equations 11 to 20.

Author Contributions

Conceptualization, G.K. and V.S.; methodology, G.K., V.S. and P.D.; software, G.K.; validation, G.K. and P.D.; formal analysis, V.S., D.T., R.D.-K. and K.I.; investigation, V.S., D.T., R.D.-K. and K.I.; resources, G.K.; data curation, G.K. and V.S.; writing—original draft preparation, V.S., R.D.-K. and D.T.; writing—review and editing, G.K. and P.D.; visualization, G.K. and V.S.; supervision, G.K.; project administration, G.K.; funding acquisition, G.K. All authors have read and agreed to the published version of the manuscript.

Funding

This work were supported by the Bulgarian Ministry of Education and Science under the National Research Programme “Healthy Foods for a Strong Bio-Economy and Quality of Life” approved by DCM № 577/17.08.2018 and by the project “Strengthening the research excellence and innovation capacity of University of Food Technologies—Plovdiv, through the sustainable development of tailor-made food systems with programmable properties“, part of the European Scientific Networks National Programme funded by the Ministry of Education and Science of the Republic of Bulgaria (agreement № Д01-288/07.10.2020).

Institutional Review Board Statement

Not applicable.

Informed Consent Statement

Not applicable.

Data Availability Statement

Not applicable.

Conflicts of Interest

The authors declare no conflict of interest.

References

  1. Martinez-Gomez, A.; Caballero, I.; Blanco, C.A. Phenols and melanoidins as natural antioxidants in beer. Structure, reactivity and antioxidant activity. Biomolecules 2020, 10, 400. [Google Scholar] [CrossRef] [PubMed] [Green Version]
  2. Palmer, G.H. Barley and malt. In Handbook of Brewing, 3rd ed.; Stewart, G.G., Russell, I., Anstruther, A., Eds.; CRC Press: Boca Raton, FL, USA, 2018; pp. 107–129. [Google Scholar]
  3. Čechovská, L.; Konečný, M.; Velíšek, J.; Cejpek, K. Effect of Maillard reaction on reducing power of malts and beers. Czech J. Food Sci. 2012, 30, 548–556. [Google Scholar] [CrossRef] [Green Version]
  4. Koren, D.; Kun, S.; Hegyesné Vecseri, B.; Kun-Farkas, G. Study of antioxidant activity during the malting and brewing process. J. Food Sci. Technol. 2019, 56, 3801–3809. [Google Scholar] [CrossRef] [PubMed] [Green Version]
  5. Shopska, V.; Denkova-Kostova, R.; Dzhivoderova-Zarcheva, M.; Teneva, D.; Denev, P.; Kostov, G. Comparative study on phenolic content and antioxidant activity of different malt types. Antioxidants 2021, 10, 1124. [Google Scholar] [CrossRef] [PubMed]
  6. Ambra, R.; Pastore, G.; Lucchetti, S. The role of bioactive phenolic compounds on the impact of beer on health. Molecules 2021, 26, 486. [Google Scholar] [CrossRef] [PubMed]
  7. Nsogning Dongmo, S.; Sacher, B.; Kollmannsberger, H.; Becker, T. Key volatile aroma compounds of lactic acid fermented malt based beverages—Impact of lactic acid bacteria strains. Food Chem. 2017, 229, 565–573. [Google Scholar] [CrossRef]
  8. Tomova, T.; Petelkov, I.; Shopska, V.; Denkova-Kostova, R.; Kostov, G.; Denkova, Z. Production of probiotic wort-based beverages with grapefruit (Citrus paradisi L.) or tangerine (Citrus reticulata L.) zest essential oil addition. Acta Sci. Pol. Technol. Aliment. 2021, 20, 237–245. [Google Scholar] [CrossRef] [PubMed]
  9. Delgerzaya, P.; Shin, J.; Kim, K.; Park, J. Wort fermentation by Leuconostoc citreum originated from Kimchi and sensory properties of fermented wort. Food Sci. Biotechnol. 2009, 18, 1083–1090. [Google Scholar]
  10. Galvan, D.; Effting, L.; Cremasco, H.; Conte-Junior, C.A. Recent applications of mixture designs in beverages, foods, and pharmaceutical health: A systematic review and meta-analysis. Foods 2021, 10, 1941. [Google Scholar] [CrossRef] [PubMed]
  11. Shopska, V.; Denkova-Kostova, R.; Kostov, G. Modeling in brewing—A review. Processes 2022, 10, 267. [Google Scholar] [CrossRef]
  12. Myers, R.H.; Montgomery, D.C.; Anderson-Cook, C.M. Response Surface Methodology: Process and Product Optimization Using Designed Experiments, 4th ed.; John Wiley & Sons: New York, NY, USA, 2016; p. 856. [Google Scholar]
  13. Cornell, J.A. Experiments with Mixtures: Designs, Models, and the Analysis of Mixture Data, 3rd ed.; John Wiley & Sons: New York, NY, USA, 2020; p. 680. [Google Scholar]
  14. Analytica (Version 2019)—European Brewing Convention. Available online: https://brewup.eu/ebcanalytica (accessed on 20 April 2021).
  15. Dvoráková, M.; Guido, L.F.; Dostalek, P.; Skulilová, Z.; Moreira, M.M.; Barros, A.A. Antioxidant properties of free, soluble ester and insoluble-bound phenolic compounds in different barley varieties and corresponding malts. J. Inst. Brew. 2008, 114, 27–33. [Google Scholar] [CrossRef]
  16. Mazza, G.; Fukumoto, L.; Delaquis, P.; Girard, B.; Ewert, B. Anthocyanins, phenolics, and olor of Cabernet Franc, Merlot, and Pinot Noir wines from British Columbia. J. Agric. Food Chem. 1999, 47, 4009–4017. [Google Scholar] [CrossRef] [PubMed]
  17. Dinkova, R.; Heffels, P.; Shikov, V.; Weber, F.; Schieber, A.; Mihalev, K. Effect of enzyme-assisted extraction on the chilled storage stability of bilberry (Vaccinium myrtillus L.) anthocyanins in skin extracts and freshly pressed juices. Food Res. Int. 2014, 65, 35–41. [Google Scholar] [CrossRef]
  18. Benzie, I.F.F.; Strain, J.J. The ferric reducing ability of plasma (FRAP) as a measure of “antioxidant power”: The FRAP assay. Anal. Biochem. 1996, 239, 70–76. [Google Scholar] [CrossRef] [PubMed] [Green Version]
  19. Iqbal, E.; Abu Salim, K.; Lim, L.B. Phytochemical screening, total phenolics and antioxidant activities of bark and leaf extracts of Goniothalamus velutinus (Airy Shaw) from Brunei Darussalam. J. King Saud Univ. Sci. 2015, 27, 224–232. [Google Scholar] [CrossRef] [Green Version]
  20. Apak, R.; Güçlü, K.; Özyürek, M.; Karademir, S.E.; Erçağ, E. The cupric ion reducing antioxidant capacity and polyphenolic content of some herbal teas. Int. J. Food Sci. Nutr. 2006, 57, 292–304. [Google Scholar] [CrossRef] [PubMed]
  21. Denev, P.; Ciz, M.; Ambrozova, G.; Lojek, A.; Yanakieva, I.; Kratchanova, M. Solid-phase extraction of berries’ anthocyanins and evaluation of their antioxidative properties. Food Chem. 2010, 123, 1055–1061. [Google Scholar] [CrossRef]
  22. Available online: https://bestmalz.de (accessed on 15 July 2022).
  23. O’Rourke, T. The role of pH in brewing. Brew. Int. 2002, 2, 21–23. [Google Scholar]
  24. Aron, P.M.; Shellhammer, T.H. A discussion of polyphenols in beer physical and flavour stability. J. Inst. Brew. 2010, 116, 369–380. [Google Scholar] [CrossRef]
  25. Amendola, D.; De Faveri, D.M.; Spigno, G. Grape marc phenolics: Extraction kinetics, quality and stability of extracts. J. Food Eng. 2010, 97, 384–392. [Google Scholar] [CrossRef]
  26. Dudonné, S.; Vitrac, X.; Coutiere, P.; Woillez, M.; Mérillon, J.-M. Comparative study of antioxidant properties and total phenolic content of 30 plant extracts of industrial interest using DPPH, ABTS, FRAP, SOD, and ORAC assays. J. Agric. Food Chem. 2009, 57, 1768–1774. [Google Scholar] [CrossRef] [PubMed]
Figure 1. Phenolic compounds content in malt mixtures according to Table 1.
Beverages 08 00044 g001
Figure 2. Antioxidant activity of different malt mixtures according to Table 1.
Beverages 08 00044 g002
Figure 3. Effect of mixture composition on the wort extract. (the “,” character represents a decimal point).
Beverages 08 00044 g003
Figure 4. Effect of mixture composition on the TPC, measured by FC method. (the “,” character represents a decimal point).
Beverages 08 00044 g004
Figure 5. Effect of mixture composition on the antioxidant activity, measured by DPPH method. (the “,” character represents a decimal point).
Beverages 08 00044 g005
Figure 6. Effect of mixture composition on the antio×idant activity, measured by FRAP method. (the “,” character represents a decimal point).
Beverages 08 00044 g006
Figure 7. Effect of mixture composition on the antioxidant activity, measured by ABTS method. (the “,” character represents a decimal point).
Beverages 08 00044 g007
Figure 8. Effect of mixture composition on the antioxidant activity, measured by ORAC method. (the “,” character represents a decimal point).
Beverages 08 00044 g008
Figure 9. Graphical optimization of Variant 5 according to Table 4. (the “,” character represents a decimal point).
Beverages 08 00044 g009
Table 1. The content of Vienna, Melanoidin, Caramel pils, and Special X malts in different malt mixtures in codded and real levels.
No.Vienna (V)Melanoidin (M)Caramel Pils (CP)Special X (SX)Vienna (V)Melanoidin (M)Caramel Pils (CP)Special X (SX)
˗g
10.3330.6670016.6733.330.000.00
20.1250.1250.1250.6256.256.256.2531.25
3000.6670.3330.000.0033.3316.67
40.3330.33300.33316.6716.670.0016.67
50.33300.667016.670.0033.330.00
60.333000.66716.670.000.0033.33
70.1250.6250.1250.1256.2531.256.256.25
800010.000.000.0050.00
900.33300.6670.0016.670.0033.33
100.66700.333033.330.0016.670.00
11100050.000.000.000.00
1200100.000.0050.000.00
130.6670.3330033.3316.670.000.00
140.250.250.250.2512.5012.5012.5012.50
150.6250.1250.1250.12531.256.256.256.25
1600.3330.66700.0016.6733.330.00
1700.3330.3330.3330.0016.6716.6716.67
180.33300.3330.33316.670.0016.6716.67
1900.66700.3330.0033.330.0016.67
200.667000.33333.330.000.0016.67
210.1250.1250.6250.1256.256.2531.256.25
220.3330.3330.333016.6716.6716.670.00
2301000.0050.000.000.00
24000.3330.6670.000.0016.6733.33
2500.6670.33300.0033.3316.670.00
26100050.000.000.000.00
270.6670.3330033.3316.670.000.00
Table 2. Main brewing characteristics of wort produced from malt mixtures.
No. *Wort Extract, °PpHColour, EBC Units
18.13 ± 0.165.19 ± 0.1242.03 ± 0.43
27.64 ± 0.114.82 ± 0.09205.00 ± 2.21
36.80 ± 0.135.11 ± 0.14101.03 ± 1.13
47.99 ± 0.125.07 ± 0.08130.63 ± 1.43
57.25 ± 0.095.59 ± 0.1311.50 ± 0.21
67.86 ± 0.114.87 ± 0.08206.38 ± 21.42
77.96 ± 0.105.04 ± 0.1282.00 ± 7.95
83.11 ± 0.084.58 ± 0.03450.00 ± 43.44
97.29 ± 0.114.86 ± 0.05233.20 ± 22.23
107.77 ± 0.125.99 ± 0.0911.73 ± 0.25
118.38 ± 0.175.94 ± 0.1312.35 ± 0.54
126.62 ± 0.115.79 ± 0.088.38 ± 0.82
138.39 ± 0.175.81 ± 0.0230.70 ± 3.13
147.75 ± 0.095.60 ± 0.0497.88 ± 10.12
158.15 ± 0.145.86 ± 0.0157.25 ± 6.23
167.26 ± 0.105.72 ± 0.0526.90 ± 2.44
177.51 ± 0.094.95 ± 0.03130.13 ± 10.34
187.71 ± 0.125.27 ± 0.05116.00 ± 12.01
197.98 ± 0.125.13 ± 0.08151.13 ± 16.21
207.99 ± 0.115.38 ± 0.06110.13 ± 9.87
217.34 ± 0.095.51 ± 0.0548.45 ± 5.98
227.83 ± 0.105.57 ± 0.0628.10 ± 3.45
238.39 ± 0.125.29 ± 0.0376.50 ± 6.32
248.40 ± 0.134.97 ± 0.02213.75 ± 19.95
257.87 ± 0.115.39 ± 0.1147.53 ± 5.33
268.18 ± 0.165.85 ± 0.0714.13 ± 0.98
278.22 ± 0.115.65 ± 0.0529.90 ± 3.07
* Numbers of the mixtures are according to Table 1.
Table 3. Restriction in the different malt content and target functions for carrying out multiple response optimization of four–component mixtures.
Target FunctionMinMaxHitTarget
Variant 1
DPPH974
TPCFC300
FRAP1882
ORAC
Variant 2
E8
DPPH974
FRAP1500
ORAC10,000
TPCFC
Variant 3
E
DPPH
FRAP
ORAC
TPCFC
Variant 4
E
DPPH
FRAP
ORAC
TPCFC
Variant 5
E
DPPH
FRAP
ORAC
TPCFC
For Variant 3, the content of Special X malt in malt mixture has to be up to 25% (12.5 g); For Variant 4, the content of Vienna, Melanoidin, and Caramel pils malt in the malt mixtures has to be minimum 20% (10 g), but the content of Special X malt has to be up to 25% (12.5 g); For Variant 5, the content of Vienna, Melanoidin, and Caramel pils malt in the malt mixtures has to be minimum 20% (10 g), but the content of Special X malt has to be up to 15% (7.5 g).
Table 4. Results of multiple response optimization of four–component malt mixture.
MaltContentContentOptimum Values of Target Functions(Determined Experimentally)
ExtractTPCFCDPPHFRAPORAC
%g°Pmg/LμM TE/L
Variant 1
Vienna2713.57.71 ± 0.09943.16 ± 331005.46 ± 232335.42 ± 17912,283.5 ± 147
Melanoidin2613.0
Caramel pils10.50
Special X4623.0
Variant 2
Vienna2713.57.68 ± 0.10888.06 ± 24966.24 ± 182222.92 ± 15112,543.0 ± 94
Melanoidin3417.0
Caramel pils10.50
Special X3819.0
Variant 3
Vienna3115.57.66 ± 0.09707.45 ± 13770.13 ± 111697.92 ± 1277735.5 ± 347
Melanoidin3417.0
Caramel pils105.00
Special X2512.5
Variant 4
Vienna22.611.37.71 ± 0.11686.06 ± 12770.13 ± 111731.25 ± 1547611.0 ± 135
Melanoidin31.215.6
Caramel pils2110.6
Special X24.912.5
Variant 5
Vienna24.212.17.80 ± 0.10598.27 ± 9631.35 ± 151277.08 ± 1117523 ± 23
Melanoidin51.825.9
Caramel pils2010.0
Special X42.0
Table 5. Optimum desired values for Variant 5.
Optimum Value = 0.305878ResponseOptimum
FactorLowHighOptimumDPPH448.509
Vienna0.21.00.241239E7.97982
Melanoidine0.21.00.517119FRAP990.009
Caramel pils0.21.00.2ORAC4482.95
Special X0.00.150.0416422TPCFC617.527
Publisher’s Note: MDPI stays neutral with regard to jurisdictional claims in published maps and institutional affiliations.

