Article

Possible Utilization of Two-Phase Olive Pomace (TPOP) to Formulate Potential Functional Beverages: A Preliminary Study

by
Antonella De Leonardis
*,
Ayesha Iftikhar
and
Vincenzo Macciola
Department of Agricultural, Environmental and Food Sciences (DiAAA), University of Molise, Via De Sanctis, 86100 Campobasso, Italy
*
Author to whom correspondence should be addressed.
Submission received: 4 August 2022 / Revised: 19 August 2022 / Accepted: 5 September 2022 / Published: 19 September 2022

Abstract

:
The demand for functional beverages is expanding over the world. In this work, a rapid, easy and low-cost procedure was followed to prepare a functional beverage (FB) by directly using two-phase olive pomace (TPOP). Liquid ingredients (water and 6% citric acid), extraction systems (heat and ultrasonic treatment), treatment time (30, 60, 90 min) and drying techniques (freeze and air-dried) were studied. Experimented TPOP had a total phenol content of 7.5 mg/g CAE (caffeic acid equivalent), composed majorly of o-diphenols. Air drying of TPOP caused a 50% depletion of total phenols compared to freeze drying. Conversely, no substantial differences were found in the FB, neither for liquid ingredients nor treatment/time adopted. Both 6% citric acid and water were revealed to be profitable liquid ingredients. A 30-min heating treatment was enough to produce a satisfactory beverage, whereas ultrasound treatment caused a loss of total phenols, especially in the water FB. All FBs appeared just limpid after a simple filtration; the citric acid beverage showed reddish color, while water ones were brownish. Finally, the prepared FBs had an average total phenol of about 600 mg/L CAE (by using 300 g/L fresh pomace), with hydroxytyrosol and related compounds being well represented, which confirmed their potential functionality.

Graphical Abstract

1. Introduction

In the entire world, the consumption of beverages is mainly associated with pleasure and being thirst-quenching, refreshing, soothing or stimulating. Moreover, beverages are also consumed for health reasons, being formulated as a natural or supplemented source of vitamins, proteins and amino acids, minerals and other bioactive components. The term ‘functional food’ was first time introduced in Japan in the mid-1980s, and the Academy of Nutrition and Dietetics in the USA defines it as “food (or part of a food) that provides medical or health benefits, including the prevention and/or treatment of a disease” [1]. According to stakeholders, the most important part of the public health improvement strategies gives a high economic potential to functional foods. In addition, it has been estimated that consumption of functional foods could reduce up to 20% of annual costs of healthcare expenses [2].
The most important role of functional foods lies in beverages for several reasons, such as for the ability to deliver and incorporate nutraceutical compounds in shelf-stable and refrigerated products. Effectively, very abundant literature proves the health benefits of both traditional and innovative beverages [3,4,5,6]. Other important reasons are in terms of container appearance, size, contents and shape-convenience for meeting the consumer’s demands [7].
In recent years, the demand for functional beverages (FB) has been increasing globally due to growing consumer interest in pursuing physical and mental well-being through food and drinks. However, estimating the real market growth of FBs is difficult due to the lack of an internationally accepted definition regarding these products. Recent reports have indicated that the global annual growth rate of FB might be near 9% by 2025, and it is expected that FB could represent 40% of overall beverage demand [7].
Recently, interest to valorize agro-industrial waste has also been increasing as an inexpensive and environmental-friendly source of natural food additives or innovative products [8]. It is obvious that the olive oil industry generates a large amount of liquid (olive mill wastewater) and solid (pomace) waste that represents a very important environmental issue due to their high content of organic matter and phenolic compounds [9]. It is a realistic approach in that the olive oil industries produce 8–12 million tons of waste every year, including wastewater and solid, majorly in Spain, Italy, Greece and Portugal, the biggest producers of olive oil [10]. Moreover, in these countries, the majority of these effluents are seasonally produced from September to March.
It is well known that olive fruit is rich in phenolic compounds, composed mostly from secoiridoids (oleuropein with hydroxytyrosol and ligstroside with tyrosol), flavonoids in free or glucosidic form, verbascoside, cinnamic-derived phenolic acids and others. It is estimated that only 1–2% of them are found in the oil phase, while the main fraction is lost in the water (about 53%) and solid (about 45%) phases [11]. Therefore, olive pomace may contain around 2–8 g/kg of total phenols, depending on the technology used in olive-oil processing [12]. One of the more focused bioactive compounds is hydroxytyrosol (2-(3,4-dihydroxyphenyl) ethanol) (HY), that can be found in the olives and its derivatives (oil and waste) in monomer or bound form, such as oleuropein and its related compounds, verbascoside, glucosides and others [13]. HY and its related compounds have been proven to have antioxidant, antimicrobial, anti-inflammatory and anticancer activities, as well as to show a positive role in preventing and constraining cardiovascular diseases, metabolic syndromes and neurodegenerative diseases [14,15,16]. Moreover, a high bioavailability of HY (up to 100%) has been repeatedly demonstrated in literature [17,18,19].
Therefore, the liquid and solid olive-oil mill waste are considered a topic of interest due to demonstrated remarkable value of their phenolic compounds. In this regard, different techniques, such as filtration through membranes, solvent extractions, emerging non-thermal technologies and others, have been developed for the recovery of these phenolic bioactive compounds [20].
Olive-oil mill pomace is composed of pieces of olive skins, flesh, seed fragments, oil residue, different organic and inorganic compounds and variable amounts of water. Its composition may strongly change with both the characteristics of the processed olives and the oil extraction process [21]. Specifically, the pomace obtained by the two-phase olive-oil mill, also known as ‘alperujo’, is characterized by a high content of humidity, with up to 60–70% vegetable water. The two-phase is an expanding olive oil extraction system based on the use of a horizontal decanter, which allows the direct separation of the oil from olive fruits and produce only a single effluent composed of solid and liquid phases [20,21]. Generally, the two-phase olive pomace (TPOP) is composed of water (60–70%), lignin (13–15%), cellulose and hemicellulose (18–20%), oil (2–3%) and ash mineral (2.5%), along with other organic compounds (3–4%), such as sugars, poly-alcohols, volatile fatty acids, part of the olive polyphenols above-mentioned and proteins [22,23].
In the beverage sector, antioxidants-rich extracts produced from olive-oil by-products and their application in fortified or functional products have been largely investigated [24,25,26,27,28]. In alternative, fermented beverage, like wine or vinegar, have been obtained by direct fermentation of olive-oil mill wastewater or diluted pomace solution [29,30,31,32]. Conversely, the direct production of beverages from olive waste and the effects of some process factors on their quality, such as phenolic extract formulation and concentration, enzymatic browning, pH, temperature, oxygen and light exposition, have been less investigated [24].
In this work, the direct use of two-phase olive pomace (TPOP) to produce a potential functional beverage (FB) was investigated. Different liquid ingredients (water and 6% citric acid), extraction systems (heat and ultrasonic treatment), treatment times (30, 60, 90 min) and drying techniques (freeze- and air-dried) were tested by evaluating several physicochemical parameters of the produced FB. Emphasis was on the color characteristics, phenolic composition and antioxidant activity.

2. Materials and Methods

2.1. Materials, Chemicals and Instruments

Two-phase olive pomace (TPOP) was kindly supplied by the Mottillo’s oil mill situated in Larino, Molise Region, Italy. TPOP was collected in November 2021, just after its production. In the laboratory, part of the fresh TPOP was soon characterized, while the remaining part was rapidly packaged in a capped plastic vessel (taking great care to avoid contact with air) and stored at −18 °C until further investigation.
Solvents and other chemicals (analytical grade or superior) and the standard compounds were all purchased from Sigma Aldrich Chemicals Co. (Milan, Italy).
The analytical instruments used in this study were a UV–Vis Spectrophotometer Evolution™ 201/220 (Thermo Fisher Scientific SpA, Rodano, MI, Italy) and an HPLC model Varian ProStar 230 pump and 330 PDA detector (Varian Analytical Instruments, Palo Alto, CA, USA), equipped with a Kinetex 5u C18 100 Å column (150 × 4.6 mm) (Phenomenex, Torrance, CA, USA).

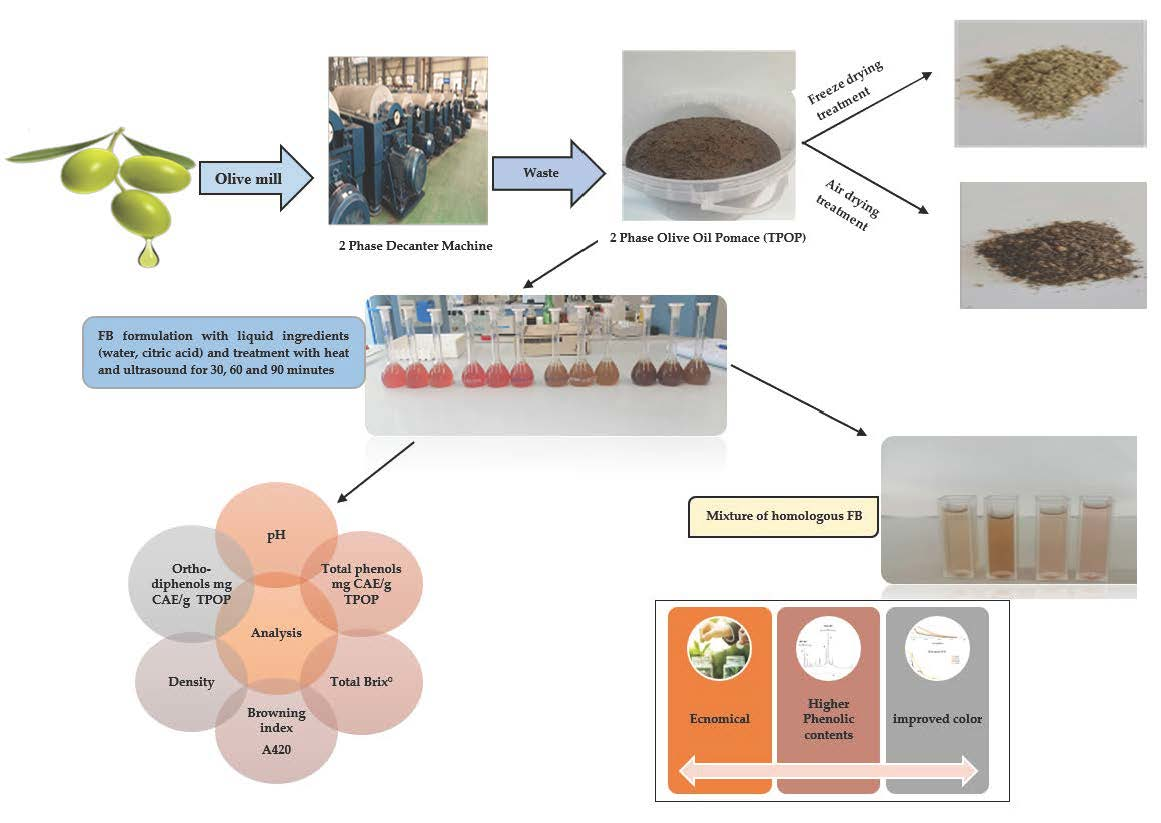
2.2. TPOP Treatment and Functional Beverages (FB) Preparation

TPOP was spontaneously defrosted, at room temperature, in the dark, for one day. For the preparation of FB, 30 g fresh TPOP, exactly weighted, was mixed with 50 mL of each liquid ingredient (6% citric acid or distilled water) in a closed jar with a capacity of 50 mL. Ultrasonic treatment (UT) was carried out in a bath at 80% amplitude, inducing a heating of water up to 57 °C. Heat treatment (HT) was performed in a thermostatic bath settled at 80 °C, under slight shaking. Both the UT and HT were stopped afterwards for 30, 60 and 90 min by rapidly cooling the jars under running water. Thus, the solutions were centrifuged (4000 rpm/20 min) and filtered through filter paper by completing the recovered liquid up to 100 mL final volume with the respective liquid ingredients. FBs were stored at 4 °C until further analysis. Finally, the homologous FB samples were combined according to the scheme reported in Table 1, in which all studied samples are described.
Finally, 30 g of the defrosted TPOP was dried by a freeze-dryer (FD-TPOP) and spontaneously at air (AD-TPOP), respectively (Table 1). Successively, 1 g of both the dried TPOP samples was treated four-times with 5 mL methanol at 80% (methanol: water 80:20, v/v) in an ultrasound bath for 15 min, followed by filtration thorough paper of the remaining liquid, which was finally taken to 25 mL volume with the same 80% methanol solution.

2.3. Physicochemical Analysis

The pH was measured on direct immersion of the glass electrode in the liquid samples. Moisture was determined by drying fresh TPOP (about 15 g) or FB (30 mL) in oven at 105 °C until constant weight; successively, the same dried TPOP and FB samples were used to determine the ash by incineration in a muffle furnace at 550 °C. Oil content of TPOP was determined by the Soxhlet method using petroleum ether as solvent, whereas the oil content of FB was obtained by four repeated direct extractions with hexane in a ratio of 2:1, v/v. Protein was determined by the Kjeldahl method using the N × 6.25 conversion factor. The total soluble solid (TSS) of FB, expressed as °Brix (20 °C), was measured with a portable refractometer, while the density was measured gravimetrically.

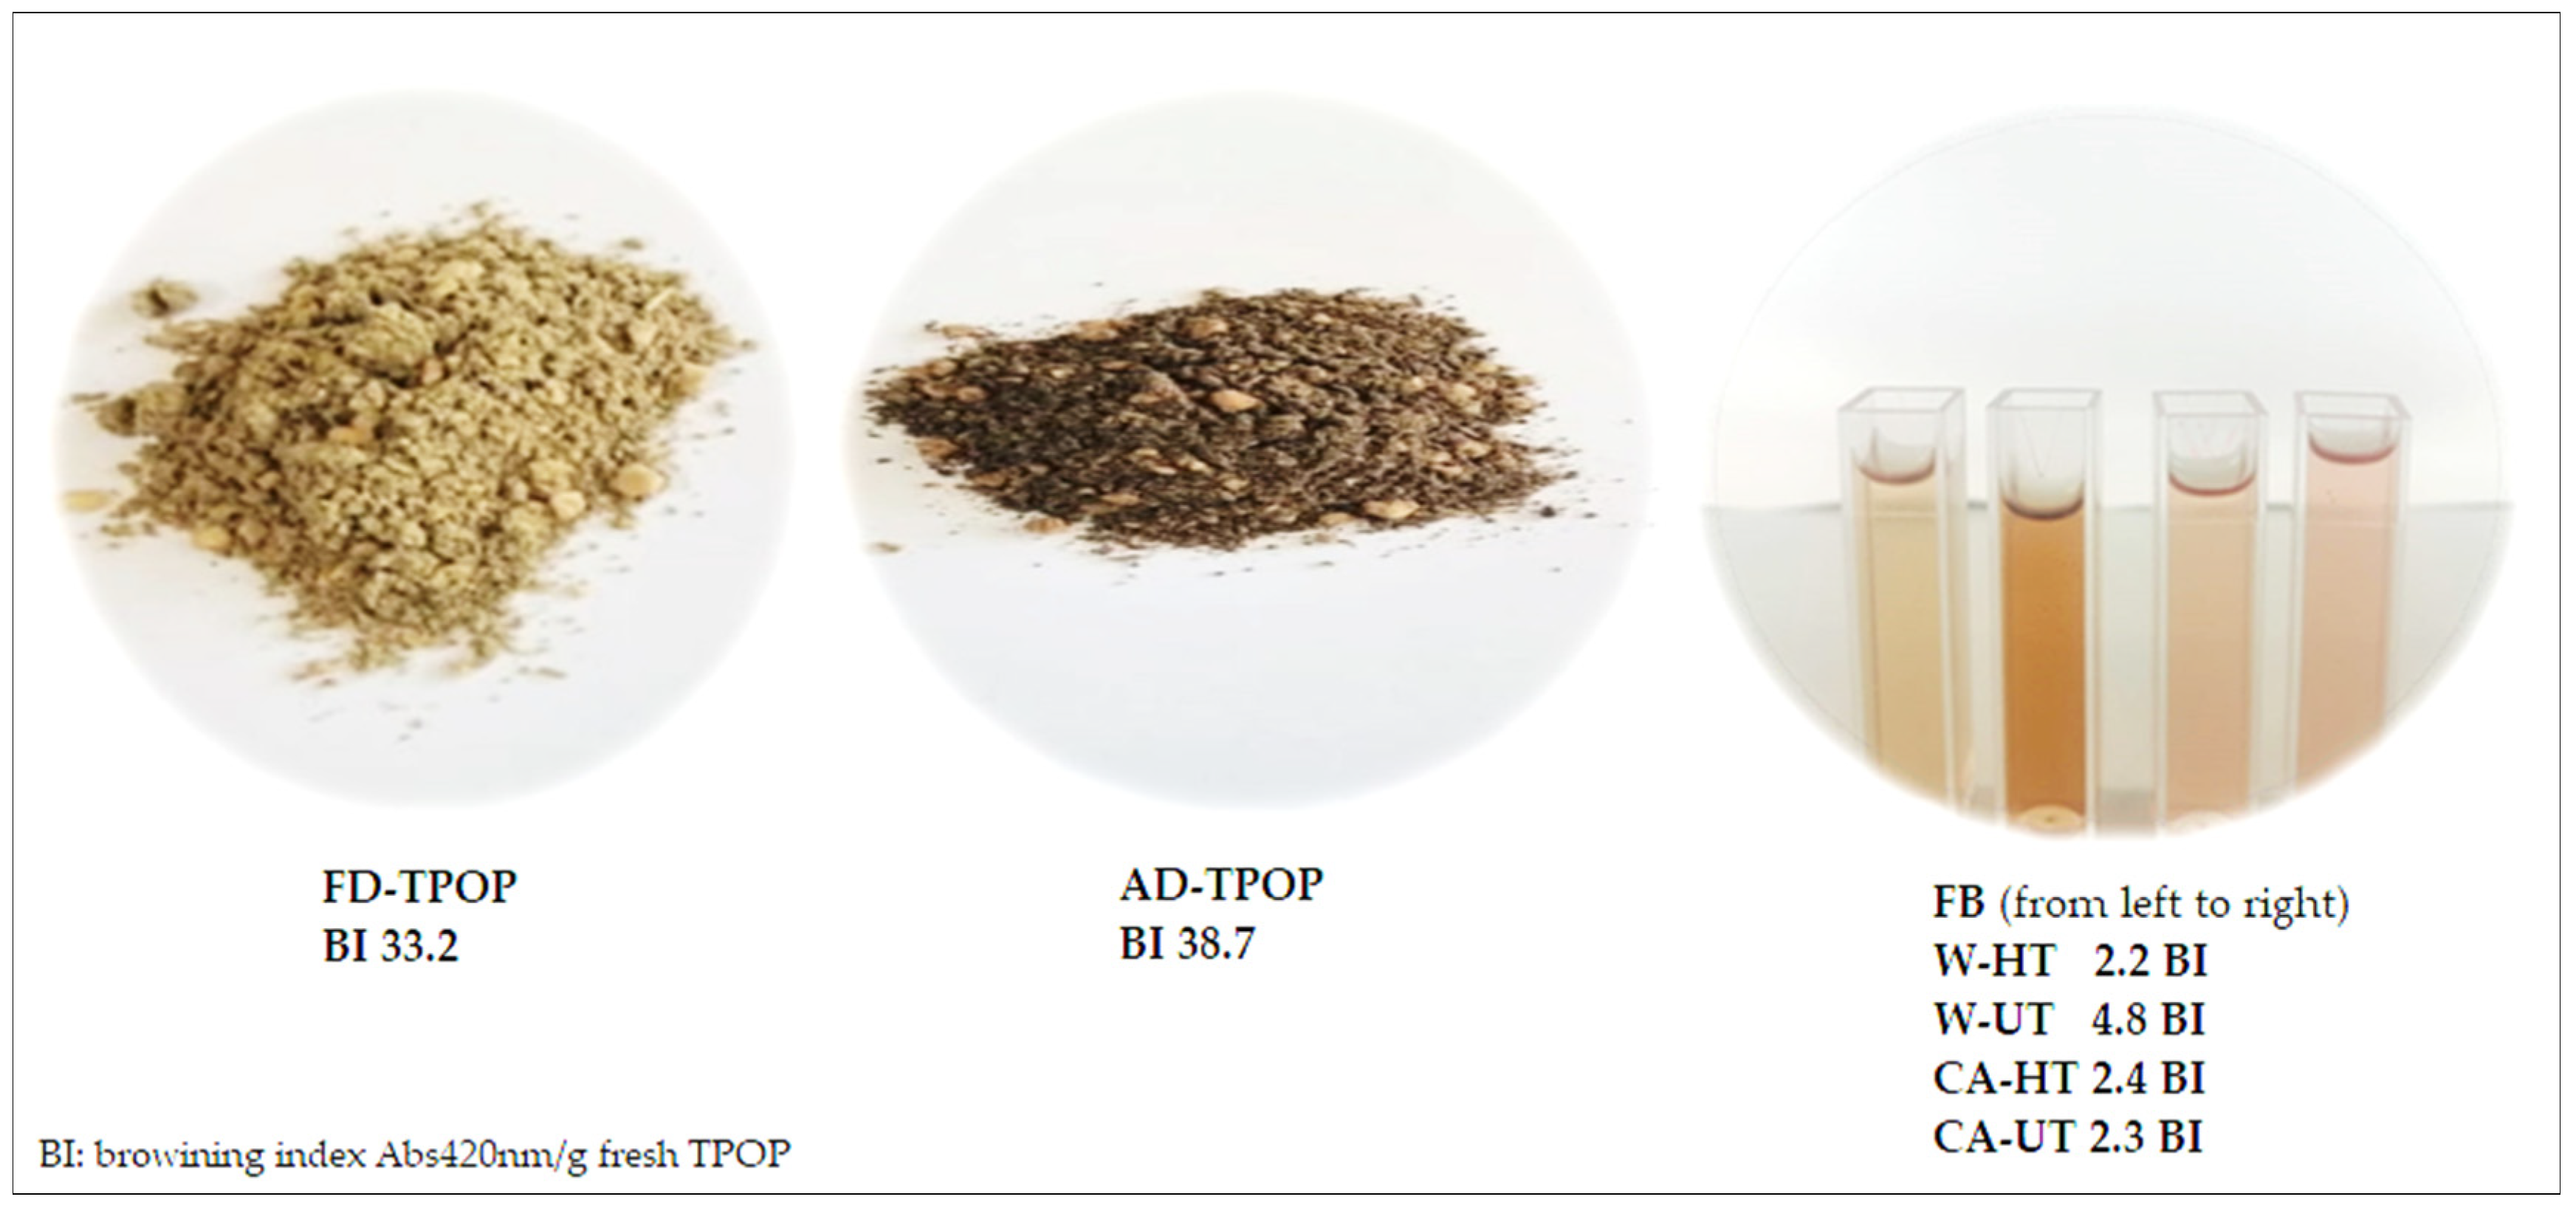
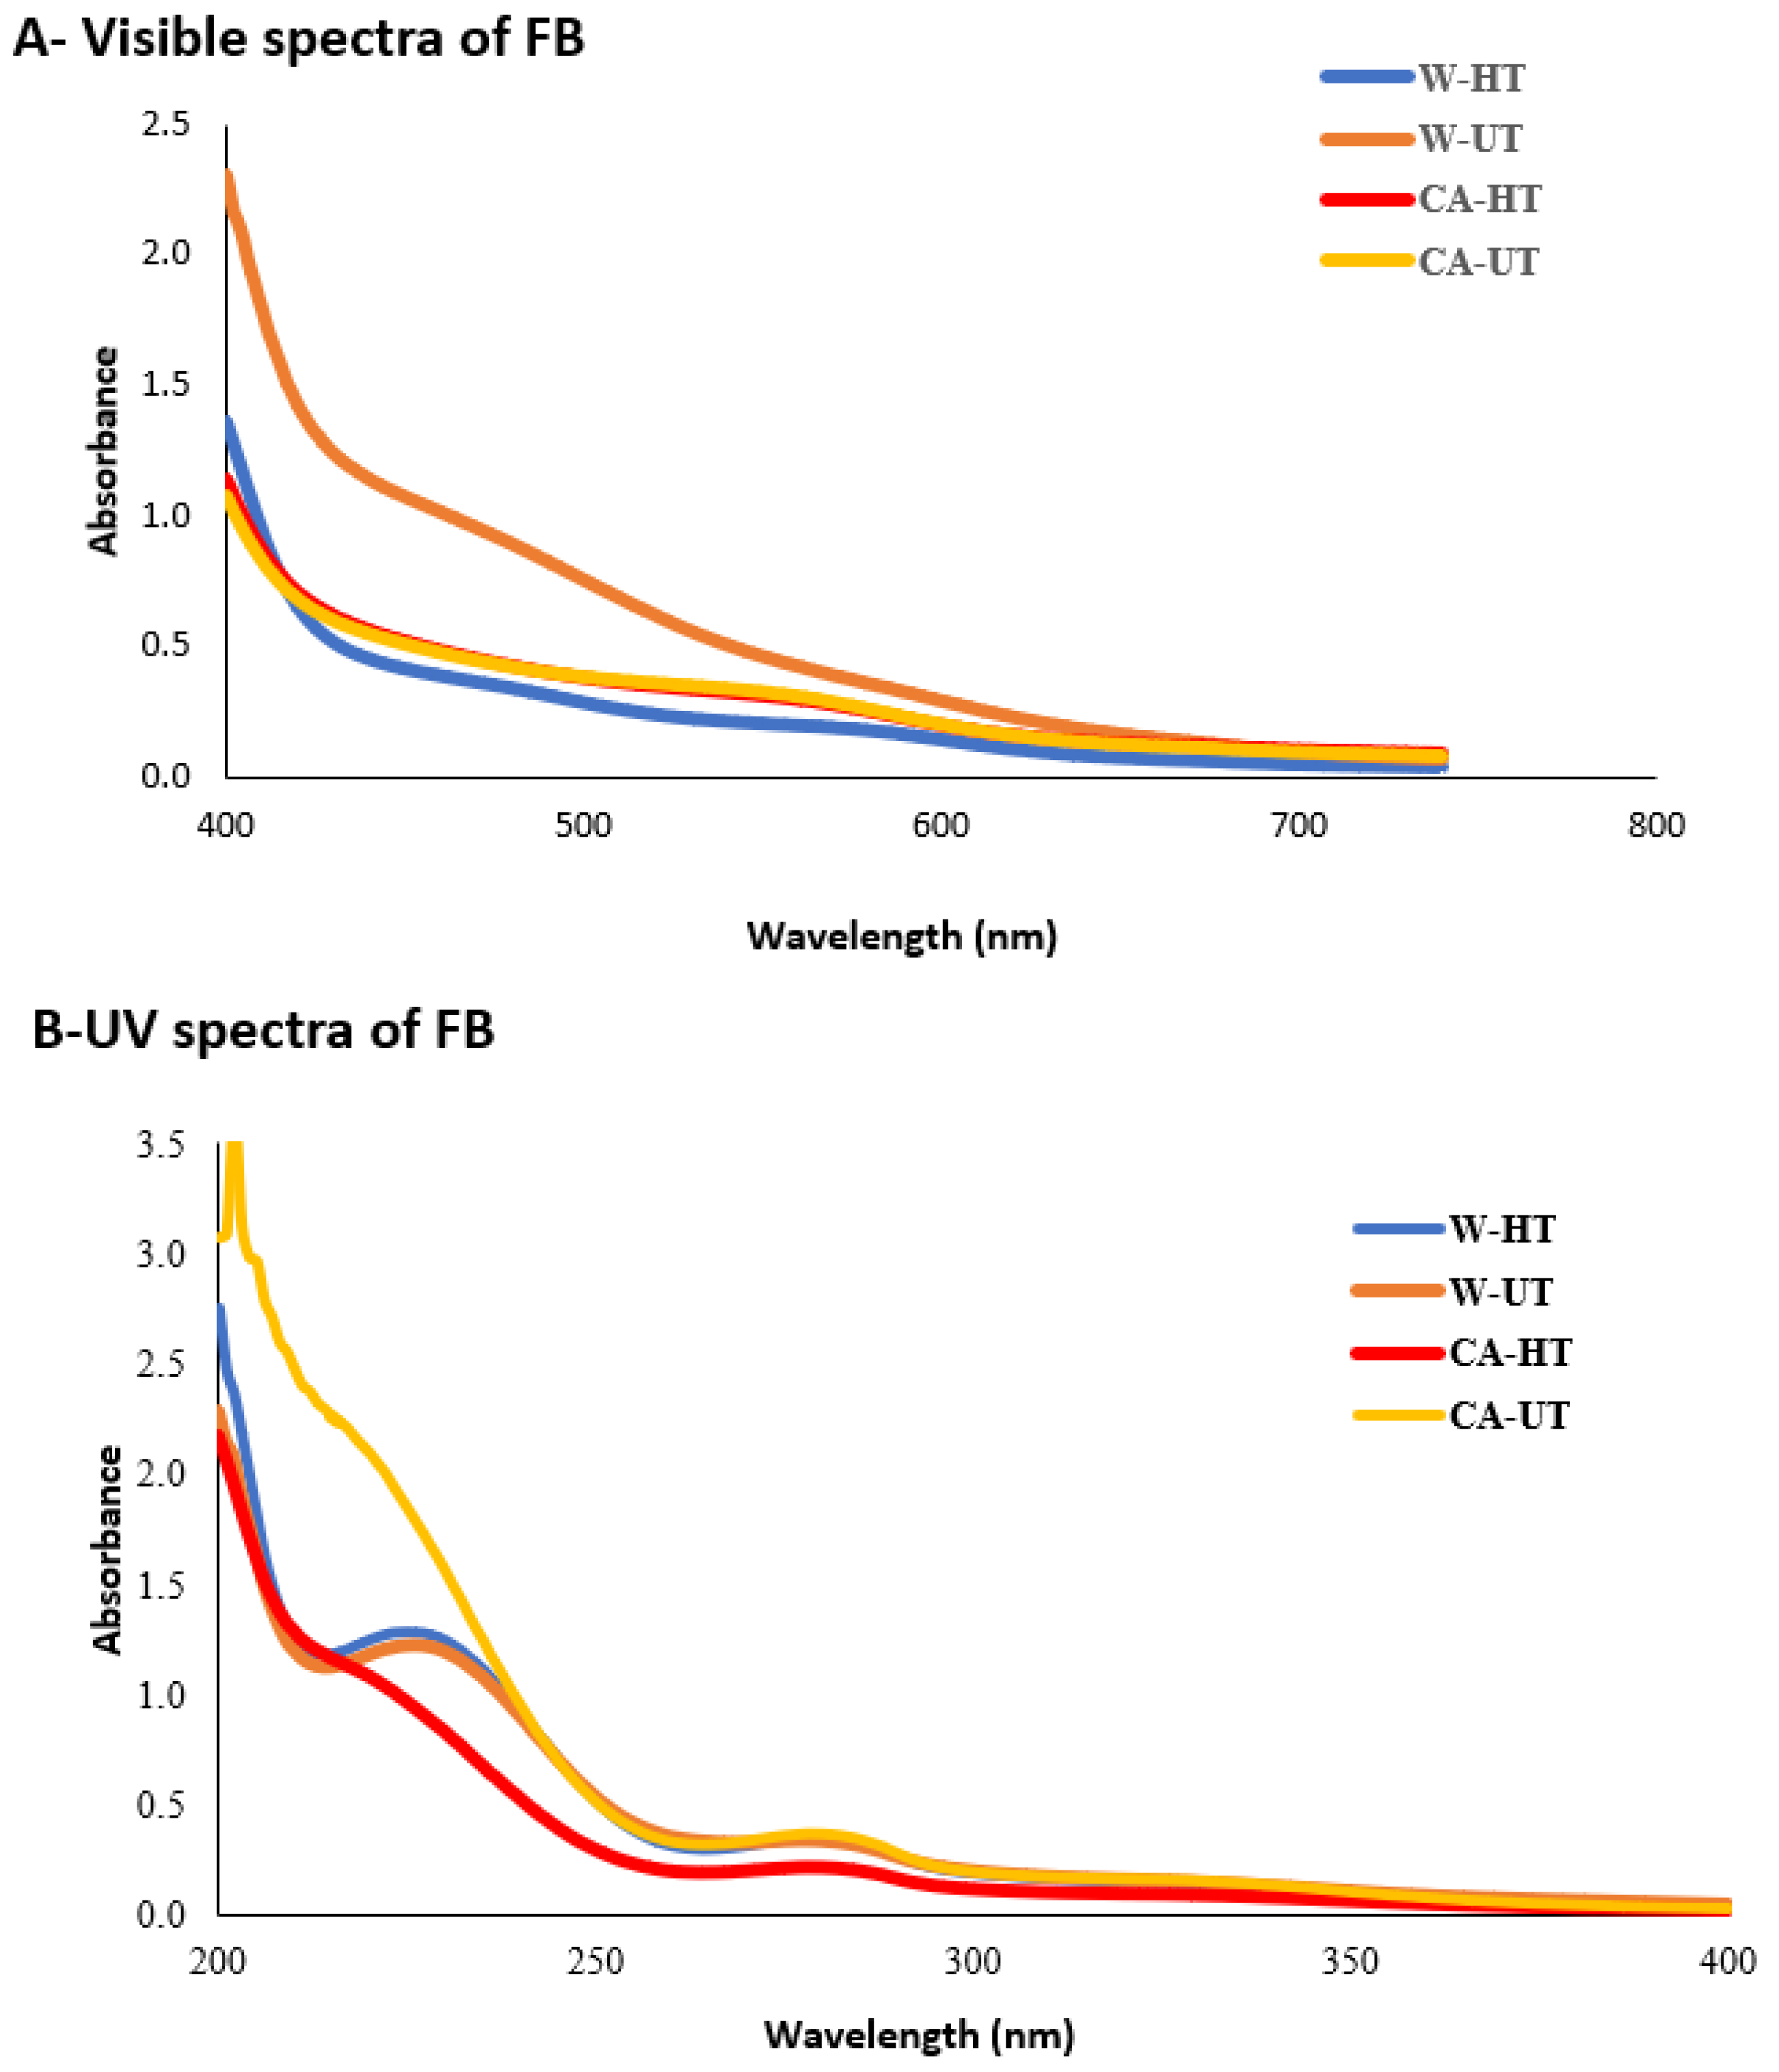
2.4. Browning Index and Spectra Determination

The browning index (BI) was measured according to [33] by spectrophotometric reading of absorbance at 420 nm of the samples normalized per g of fresh TPOP. Non-diluted and 1:50 water-diluted FB were used for plotting the Visible (400–700 nm) and UV (200–400 nm) spectra, respectively, reading against water as a blank.

2.5. Phenolic Component

Total phenols (Folin-Ciocalteau’s method) and o-diphenols (molybdate method) were determined by the spectrophotometer at 760 and 505 nm, respectively [27,34], directly on the samples listed in Table 1, and quantified through independent caffeic acid calibration curves (CAE: caffeic acid equivalent). The HPLC analysis was performed for FB liquid-liquid extract with ethyl acetate. Hydrolyses of combined phenols was performed by a heat treatment with 2N HCl acid, 1:1 v/v, in thermostatic water bath at 80 °C for 1 h. In a separation funnel, 10 mL of fresh or acid-heat hydrolyzed FB were added with 0.5 mL of gallic acid standard (1 mg/mL) as recovery factor; after three-time extraction with 10 mL of ethyl acetate, the collected ethyl acetate clear phase was dried by rotavapor recovering the dry residue in 2 mL of water. All samples were filtered through a 0.45-µm syringe filter before HPLC analysis. The HPLC instrument operative conditions were the same as described in a previous paper [28]; by recording the chromatogram at 280 nm with the difference, the calibration curve of the caffeic acid standard was used for the quantification analysis in this work. The hydroxytyrosol peak was identified by comparing the retention time and UV absorption characteristics with those of a commercial standard, whereas 3,4-dihydroxyphenylglycol and hydroxytyrosol 4-β-D-glucoside peaks were deducted by comparing the chromatogram reported in Rodríguez et al. [35].

2.6. Antioxidant Activity

The ability of samples to scavenge the DPPH free radicals was measured following the method described in a previous study [36] with modification. In plastic cuvettes, a variable aliquot of (i) methanol (DPPH blank solution) or standard compound (0.01 mg/mL) or (iii) a sample was alternatively mixed with methanol (solvent) to make a 2.5-mL volume; thus, the reaction solution was completed by adding 0.5 mL of DPPH solution (0.5 mM in absolute methanol). After 40 min incubation at room temperature (25 °C), in darkness, absorbance at 517 nm was read. The percentage inhibition was calculated with the following equation: %I = [(Abs blank − Abs sample)/Abs blank] ×100. IC50 (concentration giving 50% inhibition) was calculated by using the linear regression of %I vs. total phenol concentration (mg/mL CAE) of samples or standards curves.

2.7. Statistical Analyses

All analyses were carried out in triplicate, and the data are expressed as mean ± standard deviations. Differences among means were evaluated by a Tukey–HSO test at p ≤ 0.05 (ANOVA) with SPSS software version 26.0 (IBM Corp., Armonk, NY, USA).

3. Results

3.1. General Characteristics of Two-Phase Olive Pomace (TPOP) and Functional Beverages (FB)

Essential basic characteristics of TPOP are given in Table 2.
The water content of TPOP (humidity) was 63.4%. In the mill, TPOP was treated with specific machinery to remove the seed (de-stoning), but the pomace still contained a significant amount of stone fragments, estimated at around 20% of the dried weight. TPOP was characterized by a content of oil (2.6%), protein (1.9%) and ash (1.5%) and a sub-acid pH value of 5.86, in line with the literature data [22,23].
In Table 3, analytical determinations conducted on the samples are given.
The 6% citric acid (CA) solution affected the values of some parameters, such as pH, density and total soluble solid (TSS). Effectively, the 6% citric acid solution was characterized by these values: pH 1.81; TSS 5.0 °Brix; density 1.019.
Regarding the pH, the samples treated with water and 80% methanol (FD-TPOP and AD-TPOP) had similar values, estimated at around 5.10 on average, while a pH less than 2.00 was found in CA-FB. Certainly, a low pH was a favorable feature due to it possibly having a positive influence on the chemical and microbiological stability of the FB. Furthermore, although a sensory analysis was not done in this preliminary study, a first empiric taste of FB revealed that acidity reduced the bitter sensation in the CA-FB in comparison with W-FB.
Generally, the density was slightly lower than 1000 in W-FB and slightly higher in CA-FB, due to the presence of citric acid. In the same way, citric acid influenced the values of the total soluble solids (TSS) determined by the refractometer. In detail, the net of the citric acid content and TSS were very low, at around 0.6 °Brix. Similarly, the total dried solids, determined by sample evaporation in an oven at 105 °C, was found to be around 0.7 g/100 mL FB, of which 14% was counted as ash (data not shown). Ash (about 0.1 g/100 mL) had a reasonable content of K, Ca, P, Mg, Na and Fe [28,31]. The oil content determined in the final beverages (W-HT, W-UT, CA-HT and CA-UT) resulted in being negligible (data not shown). The absence of oil in the FB, surely due to the non-miscibility with the liquid ingredient used, was a quality outcome because oil could cause unsightly clouding, due to emulsions and phase separation.
The functional properties of the proposed FB are closely related to their phenol content. To have comparable results among samples, the value of total phenols (TP) and o-diphenols (OP) were expressed as mg CAE (caffeic acid equivalent) on the g fresh TPOP. Nevertheless, the TP value of FD-TPOP was taken as indicative of the original TP pomace content. In detail, TP and OP were 7.5 and 6.7 mg/g in FD-TPOP, respectively, in line with the phenol content of the alperujo reported in the literature [22,23,37]. Exposure to air, heating, ultrasound and phenol-oxidative enzymes can cause the oxidation of phenolic substances and their consequent loss. Seeing the data of Table 3, it emerged that air drying caused a significant phenol depletion in AD-TPOP, in which TP and OP values were found to be 3.9 and 1.3 mg/g, respectively. Conversely, by examining TP and OP values in FB, no substantial differences were found in relation to the liquid ingredient or treatment/time adopted. Indeed, the TP value was about 2.0 mg/g on average in all FB samples. However, the high heat-resistance of olive-oil mill phenols was according to the studies of Fernández-Bolaños et al. [38,39]. This could be a profitable advantage, especially during pasteurization treatment, that usually is performed in the beverage industry.
TP recovered in the FB was estimated to be 26.6% with regards to fresh pomace (2.0 mg/g in FB versus 7.5 mg/g in FD-TPOP). This could be considered a satisfactory yield by considering that only one extraction treatment had been done. Moreover, by referring to the FB volume, TP corresponds to about 600 mg/L CAE, confirming the functional potential of the proposed FB. As a comparison, the European Food Safety Authority (EFSA) recognized that polyphenols naturally present in virgin olive oils contribute to the protection of blood lipids from oxidative stress [40]. EFSA permitted the use of this health claim on the label exclusively for virgin olive oils containing at least 5 mg of hydroxytyrosol and its derivatives per 20 g of oil. Therefore, the intake of nutraceutical compounds in FB may be considered significantly high. This statement was consolidated also by the data of the OD, which are known to be the phenol compounds with higher antioxidant activity. In fact, not considering the slight upward differences due to the analytical method (Folin-Ciocalteau’s and Molybdate method for TP and OP, respectively), the OD content (about 2.1 mg/g, on average) was found to be substantially like the TP.
Finally, as bold in Table 3, homologous-treatment FB was mixed, as described in Table 1, because no substantial differences emerged as an effect of duration (30–90 min) of both the heating and ultrasound treatments.

3.2. Color Evaluation and UV-VIS Spectra

Color is an important property for a beverage due to its influences on consumer acceptance [41]. Human eyes can see the complementary color that is absorbed by the matter. As the photos of Figure 1 show, samples presented different colors depend on the liquid ingredient, preparation treatment and phenol oxidation.
Furthermore, the browning index (BI) is given in Figure 1.
Air-drying treatment caused an evident change of the TPOP color to dark brown, due to enzymatic browning [33]. As for drying purposes, a very thin layer of pomace was allowed to dry for a very long time (7 days); a large surface area along with time plays key factors in the interaction of atmospheric oxygen with the endogenous polyphenoloxidase (PPO), resulting in a significantly darkening AD-TPOP. Conversely, PPO resulted in being inhibited under freeze drying, as evidenced by the yellow–green color and lower BI of FD-TPOP (Figure 1).
No significant effect of water and citric acid in terms of BI was observed in the FB (Figure 1), with the exception of W-UT, in which a doubled BI value (4.8 ABS420nm/g fresh TPOP) was found. According Adiamo et al. [42], the combination of water/ultrasound treatment increases the BI due to the breakage of brown color pigments, that are absorbed in this range. Instead, CA-FB visible spectra were highly comparable, independently on the heating or ultrasound treatment (Figure 2A); moreover, the presence of red-color compounds absorbing around 550 nm was confirmed for both CA-FB. Moreover, according Aliakbarian et al. [43], citric acid exhibited a protection on the color that remained typically reddish in the CA-FB (Figure 1).
Conversely, W-HT and W-UT showed almost similar spectral curves in the UV region (Figure 2B), plotting two peaks around 230 and 280 nm, corresponding to conjugated aromatic compounds. Conversely, in this case, CA-FB showed very different behavior among themselves and with the W-FB (Figure 2). Different spectral curves and intensities of CA-HT and CA-UT could partially be explained by the presence of citric acid, which typically absorbs at 230 and 260 nm, as mentioned in literature [44]; nevertheless, now, it is not fully understood if and how other compounds are involved.

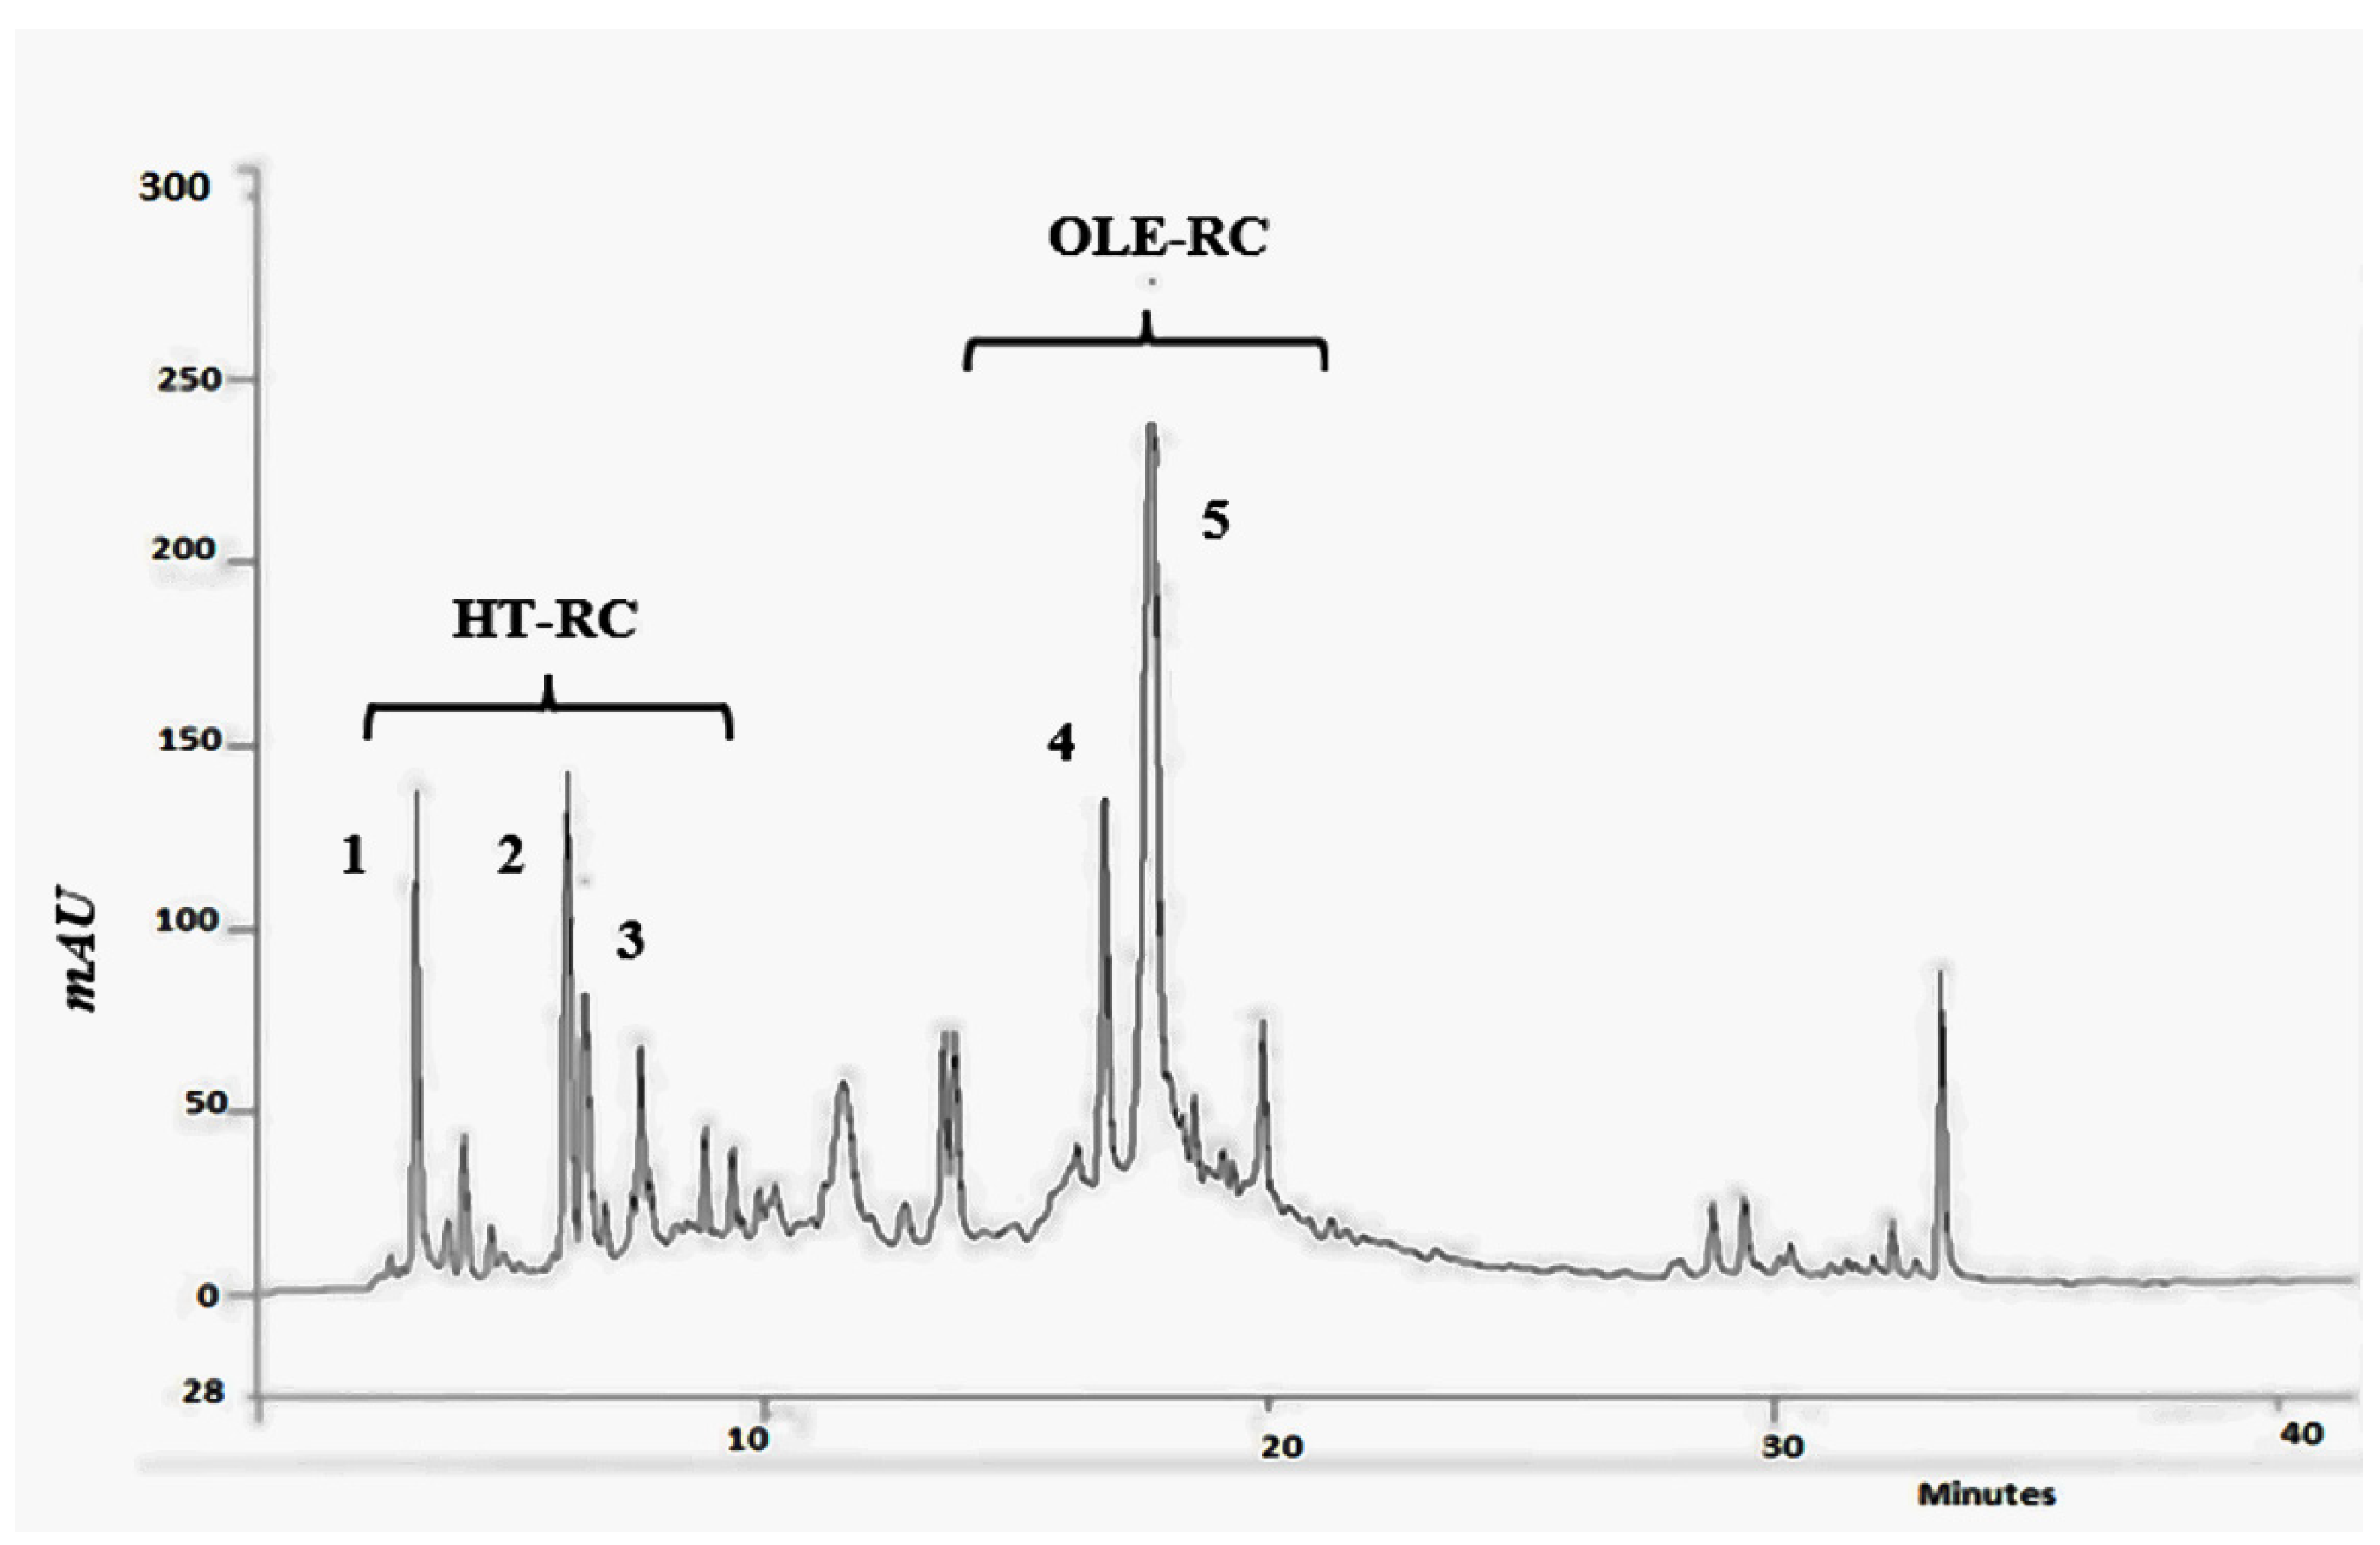
3.3. Phenolic Profile of FB

HPLC analyses evidenced that the proposed FB could be a good source of phenols, especially hydroxytyrosol (HY) in its free, bounded forms and related compounds. As an example for all, the HPLC chromatogram of the FD-TPOP extract is shown in the Figure 3. As above said, FD-TPOP could be taken as being indicative of the original phenolic pomace content having been little handled compared to other samples.
According to the literature [35,42,45,46], the phenolic profile of olive-oil by-products is found to be very different to that generally found in olives or virgin olive oil. In this study, despite numerous recorded peaks (Figure 3), only five compounds were selected and followed because of their abundance and constant presence in all samples. The first three initial peaks (n. 1–3, Figure 3) had retention times ranging between 2.5 and 6.0 min and were identified as (1) 3,4-dihydroxyphenylglycol, (2) hydroxytyrosol-(3)-D-glucoside and (3) free hydroxytyrosol. The 3,4-dihydroxyphenylglycol (DHPG) is structurally like HY but with an additional hydroxyl group, evidenced by antioxidant efficiency 2–3-times higher than ascorbic acid or hydroxytyrosol in water and comparable to that of vitamin E in lipidic medium [35].
It is well known that oleuropein (OLE) is one of the most representative secoiridoids of the olive tree parts (olive and leaf); however, OLE is rarely found in its native form in olive oil and by-products due to changes occurring during the oil production process. Oleacin (3,4-DHPEA-EDA or dialdehydic form of decarboxymethyl oleuropein aglycon) and oleocanthal (p-HPEA-EDA, dialdehydic form of decarboxymethyl ligstroside aglycon) are the major OLE derivatives of virgin olive oil [46,47]. Returning to the chromatogram of Figure 4, a negligible presence of OLE, oleacin and oleocanthal (eluting after 20 min in the adopted HPLC operative conditions) were found [46]. Conversely, two peaks, indicated as n. 4 and 5 in Figure 3, were well reordered with an average retention time of 16.3 and 17.4 min, respectively. Unfortunately, the compounds corresponding to n. 4 and 5 peaks were not identified, although it is reasonable to assume that they were secoiridoids related to OLE. This hypothesis is supported by at least two reasons. First, n. 4 and 5 peaks exhibited a UV spectrum very similar to OLE with two maxima absorbance points at 240 and 280 nm. Second, after acid hydrolysis, depletion of these peaks was accompanied by the formation of HY, as will be discussed later.
A quantitative analysis was performed on the FB phenols extracted with ethyl acetate, with this process being selective for small and medium molecular weight phenols, excluding the polymeric phenols [48]. With the aim to ease their analysis of the FB phenolic profiles, two new parameters were introduced, calculating the sum of the HY (HY-RC, by the sum of n. 1, 2, 3 peaks)- and OLE (OLE-RC by the sum of n. 4, 5 peaks)-related compounds, respectively. In Figure 4, the native-phenolic profile of each FB is compared with the correspondent hydrolyzed-phenolic profile. In all cases, selected compounds and their sum were quantified as mg/L CAF (caffeic acid equivalent).
OLE-RC was about thrree-times higher than HY-RC in all FBs. Conversely, the SUM of HY-RC and OLE-RC UM was higher in CA-FB than W-FB. The SUM on TP in percentages followed this order: CA-HY (82.2%) > CA-UT (67.6%) > W-HY (49.8%) > W-UT (20.5%). Therefore, the CA-FB phenolic profile was characterized by a higher content of HY-RC and OLE-RC than W-HY. It is reasonable to hypothesize that the difference between the TP and SUM was due to polymerized or oxidized phenols, which are not detectable by the HPLC analysis but by coloring the Folin–Ciocalteus’s reagent. Ultrasound treatment affected the FB phenolic profile, depending on the solvent. Specifically, the SUM in the W-UT (239 mg/L) was significantly lower than in the W-HT (105 mg/L). Conversely, CA-HT (419 mg/L) and CA-UT (426 mg/L) were substantially the same, evidencing a protective role of the citric acid in both the HT and UT process. Literature consultation [49] evidenced that organic acid combined with ultrasound could inhibit the PPO activity, limiting the phenol oxidation.
Heat-acid hydrolysis of FB showed a general decrease of SUM in all FB samples due to the drastic treatment performed (Figure 4). However, the acid hydrolysis performance result was solvent-depending. Specifically, a significant depletion of OLE-RC was observed in the hydrolyzed W-FB with a simultaneous increasing of HY-RC by about three-times. Conversely, one-hour heat-acid hydrolysis treatment resulted in being insufficient to produce the depletion of OLE-RC in CA-HT and CA-U, in which only a OLE-RC reduction by 46.9% and 24.9% was found, respectively. An unexpected decrease of HY-RC was also observed in the hydrolyzed CA-FB.

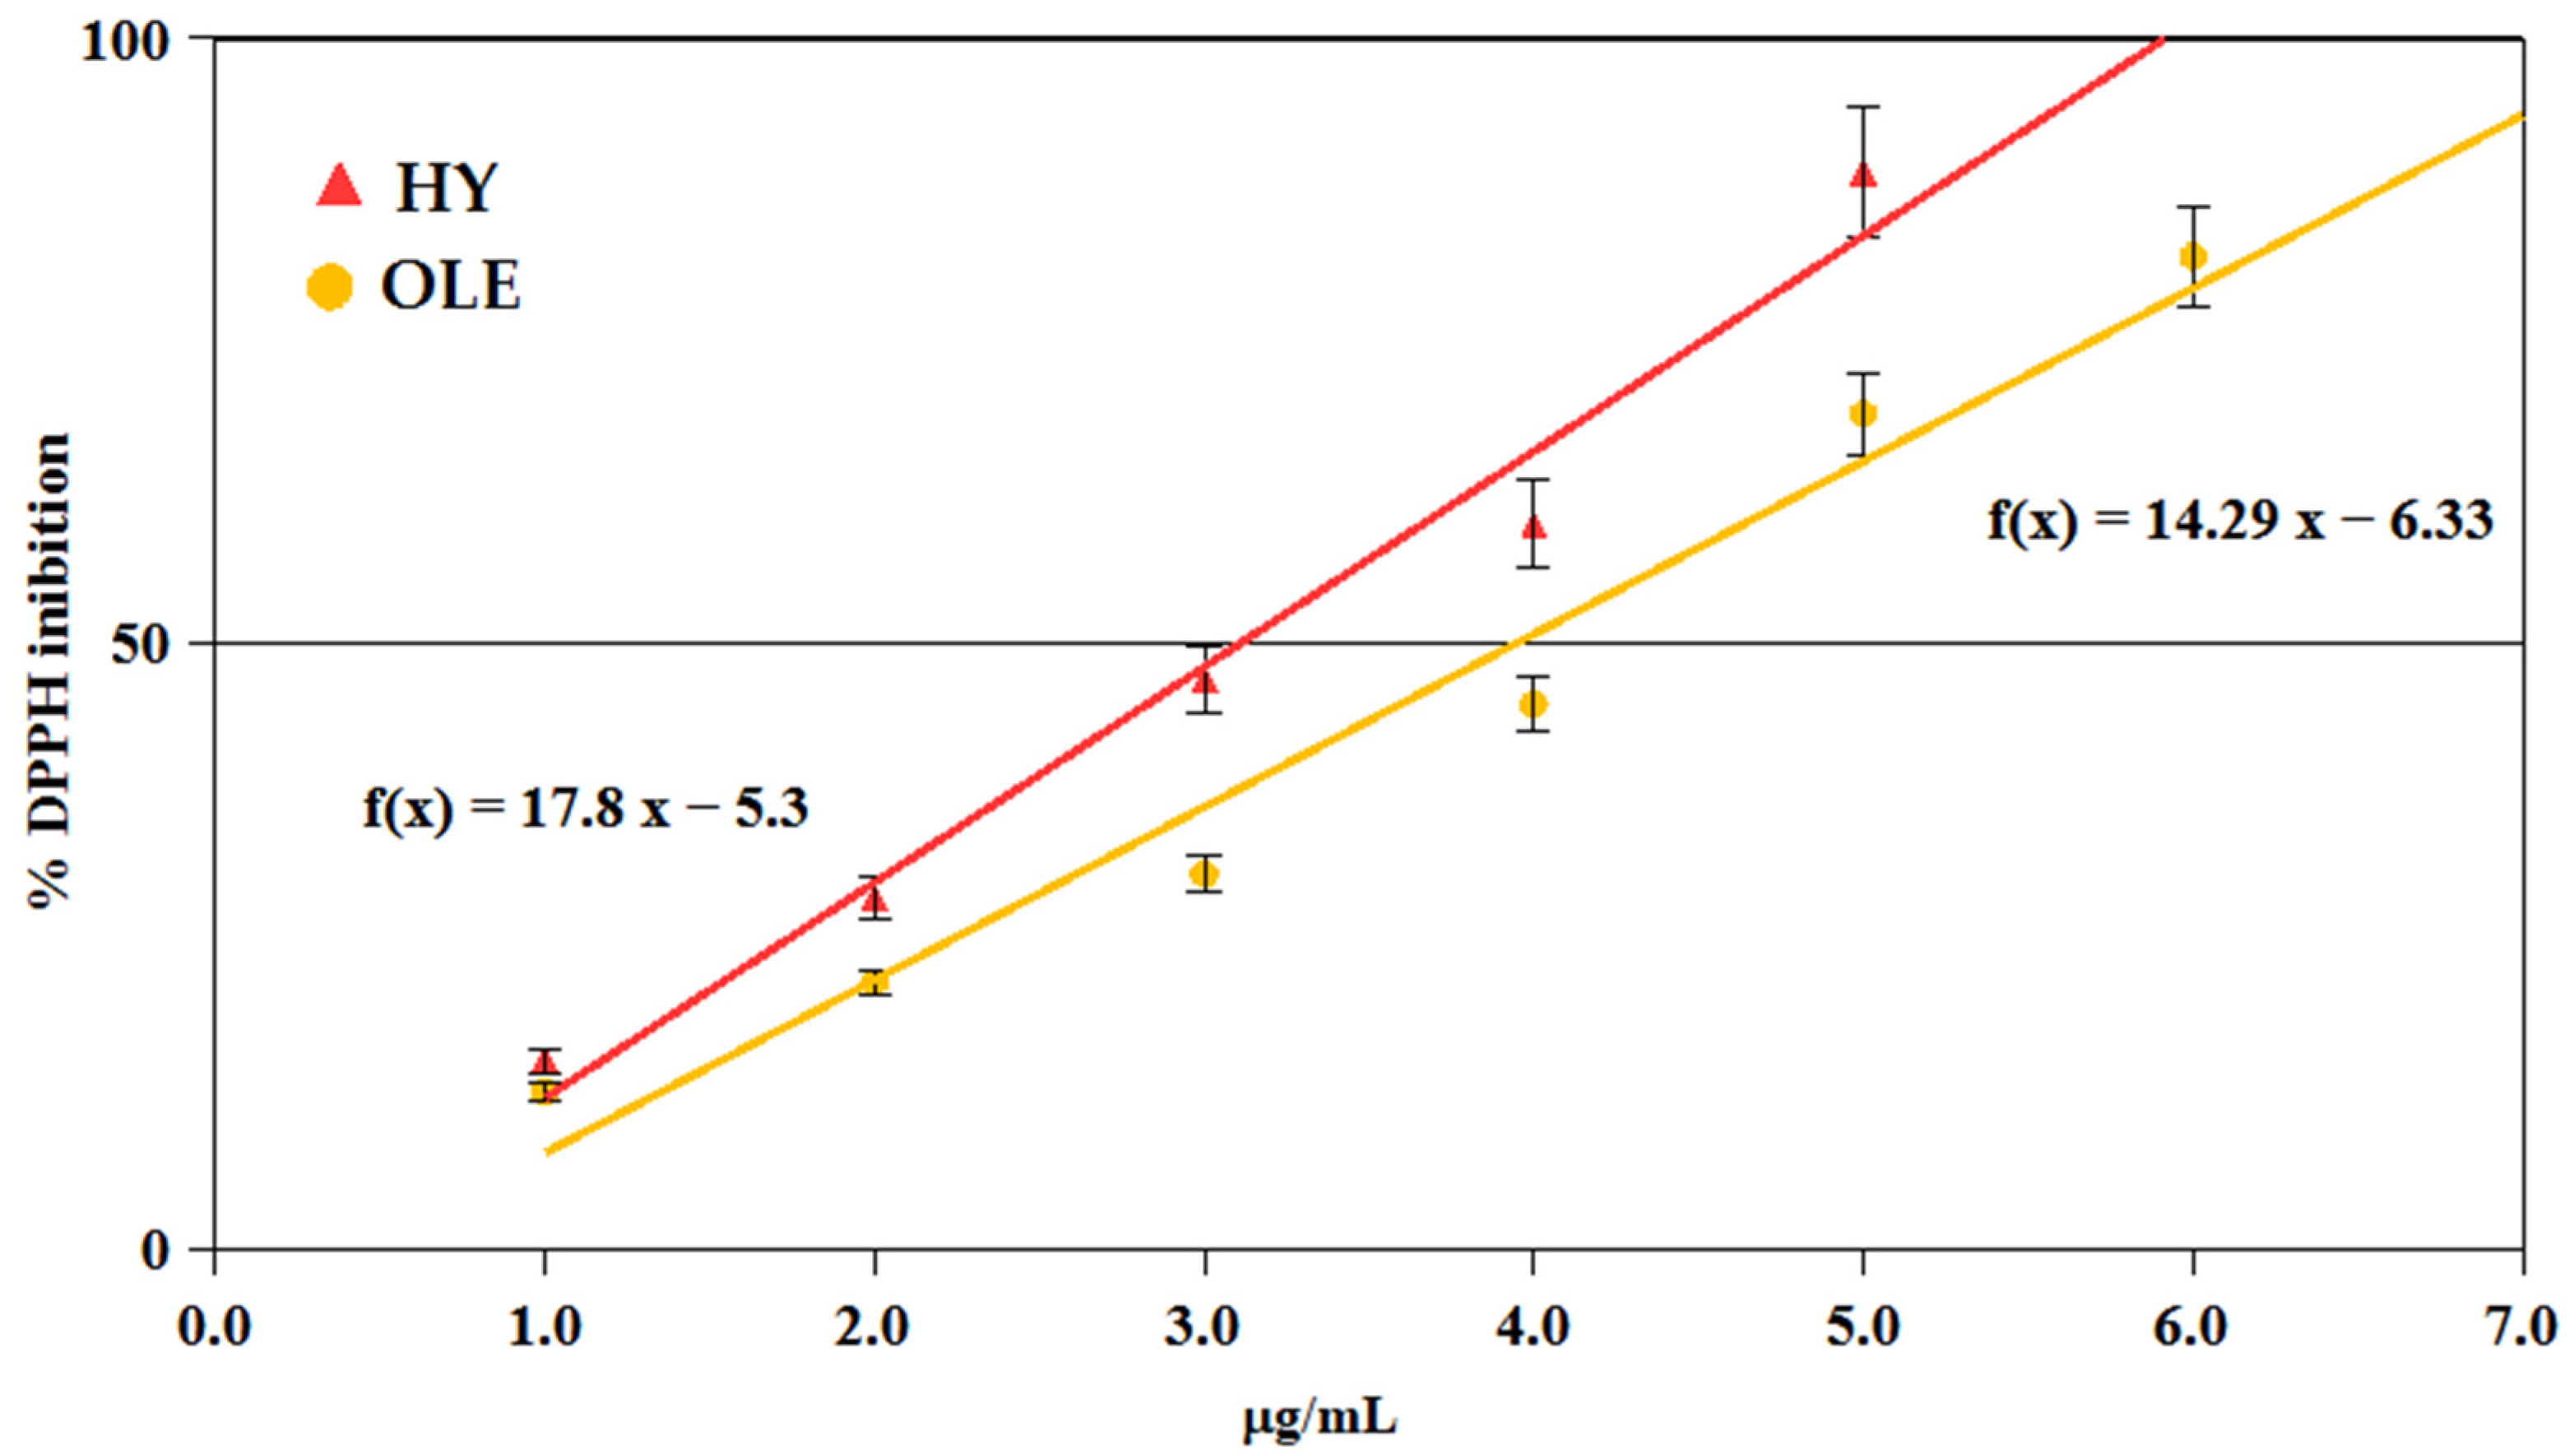
3.4. Antioxidant Activity

Numerous studies evidenced that antioxidant activity is highly linearly correlated with the total phenol concentration of plant extracts [50], although a single phenol exhibits different DPPH scavenging ability [36]. In this study, the antioxidant activity was evaluated as the total phenol concentration of FB and dried TPOP extract (mg/mL CAE) required to scavenge a 50% DPPH free-radical (IC50). A lower IC50 value indicates more high antioxidant activity.
The linear regression equation and IC50 are synthetically given in Table 4, using ascorbic acid as standard reference.
Different antioxidant activity emerged among the analyzed samples. The IC50 value of both the W-FB (7.7 and 8.9 mg/mL for W-HT and W-U, respectively) was comparable to that of ascorbic acid (6.7 mg/mL) but lower than that of the CA-FB. Specifically, IC50 of CA-HT and CA-UT were 24.4 and 13.5 mg/mL, respectively. This outcome seemed to be in contradiction with the phenolic profile of FB (Figure 4), suggesting that W-FB had higher antioxidant activity than CA-FB. One possible explanation could be the high OLE-RC content of CA-HT and CA-UT, just like the OLE standard that exhibited lower antioxidant capacity than HY (Figure 5). Finally, IC50 for FD-TPOP was 24.7 mg/mL, while that of AD-TPOP was significantly higher (61.1 mg/mL), evidencing a clear correlation with TP contents (Table 3). Thus, air-drying caused a significant loss of phenols and antioxidant activity of TPOP.

4. Conclusions

Two-phase olive processing generates a wet waste (alperujo) rich in phenol compounds, which makes their recycling very attractive. In this work, a possibility to directly use two-phase olive pomace in the production of functional beverages was investigated. Indeed, a rapid, easy and low-cost procedure was defined. Both 6% citric acid and water were revealed to be profitable liquid ingredients. Indeed, a similar total phenol content, of about 600 mg/L CAE, was found in the beverages, prepared by using 300 g/L of fresh pomace. All produced beverages appeared to be just limpid after a simple filtration, but they showed different colors. Specifically, the citric acid beverage was reddish, while water ones were brownish, apparently. Moreover, citric acid beverages were acidic in nature (pH 2.0), and this means more food safety, better taste and higher stability of antioxidant compounds.
A heating treatment of 30 min resulted in being enough to produce a satisfactory beverage in terms of functional properties; conversely, the assayed ultrasound treatment caused a loss of total phenols, especially in the water beverages. Similarly, also air drying caused enzymatic oxidation and a significant loss of phenols in the by-products compared with freeze-drying.
In conclusion, the possible valorization of olive-oil waste in the sector of functional beverages was demonstrated in this preliminary study. However, further investigations are needed to evaluate food grade, taste, shelf life and consumer acceptance of the proposed novel functional beverages.

Author Contributions

Conceptualization, A.D.L. and A.I.; methodology, A.D.L., A.I. and V.M.; formal analysis, A.I. and V.M. investigation; A.I. and V.M; resources, V.M.; data curation, A.D.L. and A.I.; writing—original draft preparation, A.D.L. and A.I.; writing—review and editing, A.D.L., A.I. and V.M; visualization, A.I.; supervision, A.D.L. All authors have read and agreed to the published version of the manuscript.

Funding

This research received no external funding.

Conflicts of Interest

The authors declare no conflict of interest.

References

  1. Santos, B.C.; González, P.A.M.; Oludemi, T.; Ayuda, D.B.; González, M.S. Plant phenolics as functional food ingredients. Adv. Food Nutr. Res. 2019, 90, 183–257. [Google Scholar] [CrossRef]
  2. Servili, M.; Rizzello, C.G.; Taticchi, A.; Esposto, S.; Urbani, S.; Mazzacane, F.; Di Maio, F.; Selvaggini, R.; Gobbetti, M.; Di Cagno, R. Functional milk beverage fortified with phenolic compounds extracted from olive vegetation water and fermented with functional lactic acid bacteria. Int. J. Food Microbiol. 2011, 147, 45–52. [Google Scholar] [CrossRef] [PubMed]
  3. Gruenwald, J. Novel botanical ingredients for beverages. Clin. Dermatol. 2009, 27, 210–216. [Google Scholar] [CrossRef] [PubMed]
  4. Schwan, R.F.; Ramos, C.L. Functional beverages from cereals. In Functional and Medicinal Beverages; Academic Press: Cambridge, MA, USA, 2019; pp. 351–379. [Google Scholar] [CrossRef]
  5. Cong, L.; Bremer, P.; Mirosa, M. Functional beverages in selected countries of Asia pacific region: A review. Beverages 2020, 6, 21. [Google Scholar] [CrossRef]
  6. Iftikhar, A.; Rehman, A.; Usman, M.; Ali, A.; Ahmad, M.M.; Shehzad, Q.; Siddeeg, A. Influence of guar gum and chitosan enriched with lemon peel essential oil coatings on the quality of pears. Food Sci. Nutr. 2022, 10, 2443–2445. [Google Scholar] [CrossRef]
  7. Nazir, M.; Arif, S.; Khan, R.S.; Nazir, W.; Khalid, N.; Maqsood, S. Opportunities and challenges for functional and medicinal beverages: Current and future trends. Trends Food Sci. Technol. 2019, 88, 513–526. [Google Scholar] [CrossRef]
  8. Faustino, M.; Veiga, M.; Sousa, P.; Costa, E.M.; Silva, S.; Pintado, M. Agro-food by-products as a new source of natural food additives. Molecules 2019, 24, 1056. [Google Scholar] [CrossRef]
  9. Banias, G.; Achillas, C.; Vlachokostas, C.; Moussiopoulos, N.; Stefanou, M. Environmental impacts in the life cycle of olive oil: A literature review. J. Sci. Food Agric. 2017, 97, 1686–1697. [Google Scholar] [CrossRef]
  10. Komnitsas, K.; Zaharaki, D. Pre-treatment of olive mill wastewaters at laboratory and mill scale and subsequent use in agriculture: Legislative framework and proposed soil quality indicators. Resour. Conserv. Recycl. 2012, 69, 82–89. [Google Scholar] [CrossRef]
  11. Rodis, P.S.; Karathanos, V.T.; Mantzavinou, A. Partitioning of olive oil antioxidants between oil and water phases. J. Agric. Food Chem. 2012, 50, 596–601. [Google Scholar] [CrossRef]
  12. Romero, C.; Medina, E.; Mateo, M.A.; Brenes, M. New by-products rich in bioactive sustances from the olive oil mill processing. J. Sci. Food Agric. 2018, 98, 225–230. [Google Scholar] [CrossRef] [PubMed]
  13. De Leonardis, A.; Macciola, V.; Iacovino, S. Delivery systems for hydroxytyrosol supplementation: State of the art. Colloids Interfaces 2020, 4, 25. [Google Scholar] [CrossRef]
  14. Ramassamy, C. Emerging role of polyphenolic compounds in the treatment of neurodegenerative diseases: A review of their intracellular targets. Eur. J. Pharmacol. 2006, 545, 51–64. [Google Scholar] [CrossRef] [PubMed]
  15. Schaffer, S.; Podstawa, M.; Visioli, F.; Bogani, P.; Müller, W.E.; Eckert, G.P. Hydroxytyrosol-rich olive mill wastewater extract protects brain cells in vitro and ex vivo. J. Agric. Food Chem. 2007, 55, 5043–5049. [Google Scholar] [CrossRef] [PubMed]
  16. Robles-Almazan, M.; Pulido-Moran, M.; Moreno-Fernandez, J.; Ramirez-Tortosa, C.; Rodriguez-Garcia, C.; Quiles, J.L.; Ramirez-Tortosa, M. Hydroxytyrosol: Bioavailability, toxicity, and clinical applications. Int. Food Res. J. 2018, 105, 654–667. [Google Scholar] [CrossRef]
  17. Caruso, D.; Visioli, F.; Patelli, R.; Galli, C.; Galli, G. Urinary excretion of olive oil phenols and their metabolites in humans. Metabolism 2001, 50, 1426–1428. [Google Scholar] [CrossRef]
  18. Vissers, M.N.; Zock, P.L.; Roodenburg, A.J.C.; Leenen, R.; Katan, M.B. Olive oil phenols are absorbed in humans. J. Nutr. 2002, 132, 409–417. [Google Scholar] [CrossRef]
  19. Cardinali, A.; Linsalata, V.; Lattanzio, V.; Ferruzzi, M.G. Verbascosides from olive mill wastewater: Assessment of their bioaccessibility and intestinal uptake using an in vitro digestion/caco-2 model system. J. Food Sci. 2011, 76, H48–H54. [Google Scholar] [CrossRef]
  20. Galanakis, C.M.; Yücetepe, A.; Kasapoglu, K.N.; Ozçelik, B. High-value compounds from olive oil processing waste. In Edible Oils, Extraction, Processing, and Applications; Chemat, S., Ed.; CRC Press: Boca Raton, FL, USA, 2017; pp. 179–204. [Google Scholar] [CrossRef]
  21. Clodoveo, M.L.; Camposeo, S.; Amirante, R.; Dugo, G.; Cicero, N.; Boskou, D. Research and innovative approaches to obtain virgin olive oils with a higher level of bioactive constituents. In Olive and Olive Oil Bioactive Constituents; Boskou, D., Ed.; Elsevier: Amsterdam, The Netherlands, 2015; pp. 179–215. [Google Scholar] [CrossRef]
  22. Alburquerque, J.A.; Gonzálvez, J.; Garcıa, D.; Cegarra, J. Agrochemical characterisation of “alperujo”, a solid by-product of the two-phase centrifugation method for olive oil extraction. Bioresour. Technol. 2004, 91, 195–200. [Google Scholar] [CrossRef]
  23. Moral, P.S.; Méndez, M.V.R. Production of pomace olive oil. Grasas Y Aceites 2006, 57, 47–55. [Google Scholar] [CrossRef]
  24. Zbakh, H.; El Abbassi, A. Potential use of olive mill wastewater in the preparation of functional beverages: A review. J. Funct. Foods. 2012, 4, 53–65. [Google Scholar] [CrossRef]
  25. Spizzirri, U.G.; Carullo, G.; Aiello, F.; Paolino, D.; Restuccia, D. Valorisation of olive oil pomace extracts for a functional pear beverage formulation. Int. J. Food Sci. Technol. 2021, 56, 5497–5505. [Google Scholar] [CrossRef]
  26. Foti, P.; Occhipinti, P.S.; Romeo, F.V.; Timpanaro, N.; Musumeci, T.; Randazzo, C.L.; Randazzo, C.; Caggia, C. Phenols recovered from olive mill wastewater as natural booster to fortify blood orange juice. Food Chem. 2022, 393, 133428. [Google Scholar] [CrossRef] [PubMed]
  27. De Leonardis, A.; Macciola, V.; Nag, A. Antioxidant activity of various phenol extracts of olive-oil mill wastewaters. Acta Aliment. 2009, 38, 77–86. [Google Scholar] [CrossRef]
  28. De Leonardis, A.; Macciola, V.; Iftikhar, A.; Lopez, F. Antioxidant effect of traditional and new vinegars on functional oil/vinegar dressing-based formulations. Eur. Food Res. Technol. 2022, 248, 1573–1582. [Google Scholar] [CrossRef]
  29. Song, J.; Chen, X.; Song, Y.; Tia, W.; Liu, J. The olive fruit wine research on the fermentation process and aromatic ingredients. In International Conference on Machinery, Materials Engineering, Chemical Engineering and Biotechnology, 2nd ed.; Atlantis Press: Zingzhau, China, 2015; pp. 603–608. [Google Scholar]
  30. Yao, Q.; He, G.; Guo, X.; Hu, Y.; Shen, Y.; Gou, X. Antioxidant activity of olive wine, a by-product of olive mill wastewater. Pharm. Biol. 2016, 54, 2276–2281. [Google Scholar] [CrossRef]
  31. De Leonardis, A.; Macciola, V.; Iorizzo, M.; Lombardi, S.J.; Lopez, F.; Marconi, E. Effective assay for olive vinegar production from olive oil mill wastewaters. Food Chem. 2018, 240, 437–440. [Google Scholar] [CrossRef] [PubMed]
  32. De Leonardis, A.; Masino, F.; Macciola, V.; MultiTech, G.; Antonelli, A.; Marconi, E. A study on acetification process to produce olive vinegar from oil mill wastewaters. Eur. Food Res. Technol. 2019, 245, 2123–2131. [Google Scholar] [CrossRef]
  33. Jeong, H.L.; Jin, W.J.; Kwang, D.M.; Kee, J.P. Effects of anti-browning agents on polyphenoloxidase activity and total phenolics as related to browning of fresh cut ‘Fuji’ apple. ASEAN Food J. 2008, 15, 79–87. [Google Scholar]
  34. Gutfinger, T. Polyphenols in olive oils. J. Am. Oil Chem. Soc. 1981, 58, 966–968. [Google Scholar] [CrossRef]
  35. Rodríguez, G.; Lama, A.; Trujillo, M.; Espartero, J.L.; Fernández-Bolaños, J. Isolation of a powerful antioxidant from Olea europaea fruit-mill waste: 3,4-Dihydroxyphenylglycol. LWT-Food Sci. Technol. 2009, 42, 483–490. [Google Scholar] [CrossRef]
  36. Abdallah, I.B.; Macciola, V.; Boukhchina, S.; de La Torre Fornell, R.; De Leonardis, A. The negligible role of ellagic acid in preventing fat oxidation of Tunisian walnuts (Juglans regia L.). J. Food Meas. Charact. 2017, 11, 1406–1411. [Google Scholar] [CrossRef]
  37. Fernández-Prior, M.Á.; Fatuarte, J.C.P.; Oria, A.B.; Viera-Alcaide, I.; Fernández-Bolaños, J.; Rodríguez-Gutiérrez, G. New liquid source of antioxidant phenolic compounds in the olive oil industry: Alperujo water. Foods 2020, 9, 962. [Google Scholar] [CrossRef] [PubMed]
  38. Fernández-Bolaños, J.; Rodríguez, G.; Rodríguez, R.; Heredia, A.; Guillén, R.; Jiménez, A. Production in large quantities of highly purified hydroxytyrosol from liquid—Solid waste of two-phase olive oil processing or “Alperujo”. J. Agric. Food Chem. 2002, 50, 6804–6811. [Google Scholar] [CrossRef]
  39. Fernández-Bolaños, J.; Rodríguez, G.; Gómez, E.; Guillén, R.; Jiménez, A.; Heredia, A.; Rodríguez, R. Total recovery of the waste of two-phase olive oil processing: Isolation of added-value compounds. J. Agric. Food Chem. 2004, 52, 5849–5855. [Google Scholar] [CrossRef]
  40. Regulation, E.C. No, 432, 2012. Establishing a List of Permitted Health Claims Made on Foods, Other Than Those Referring to the Reduction of Disease Risk and to Children’s Development and Health. Off. J. Eur. Union 2012, L136, 1–40. [Google Scholar]
  41. Hutchings, J.B. Evolution and human’s attraction and reaction to colour: Food and health. Color Res. Applic. 2021, 46, 140–145. [Google Scholar] [CrossRef]
  42. Adiamo, O.Q.; Ghafoor, K.; Al-Juhaimi, F.; Mohamed Ahmed, I.A.; Babiker, E.E. Effects of thermosonication and orange by-products extracts on quality attributes of carrot (Daucus carota) juice during storage. Int. J. Food Sci. Technol. 2017, 52, 2115–2125. [Google Scholar] [CrossRef]
  43. Aliakbarian, B.; Dehghani, F.; Perego, P. The effect of citric acid on the phenolic contents of olive oil. Food Chem. 2009, 116, 617–623. [Google Scholar] [CrossRef]
  44. Yusmaman, W.M.; Gunlazuardi, J. The role of citric acid modifiers addition in the preparation of TiO2 nanoparticles with the solvothermal method. AIP Conf. Proc. 2020, 2243, 020033. [Google Scholar] [CrossRef]
  45. Rodríguez, G.; Rodríguez, R.; Jiménez, A.; Guillén, R.; Fernandez-Bolanos, J. Effect of steam treatment of alperujo on the composition, enzymatic saccharification, and in vitro digestibility of alperujo. J. Agric. Food Chem. 2007, 55, 136–142. [Google Scholar] [CrossRef] [PubMed]
  46. Macciola, V.; Cuomo, F.; De Leonardis, A. Importance of oleacin and oleocanthal on the oxidative stability of extra virgin olive oil measured by Rancimat. Riv. It. Sost. Grasse. 2020, 97, 21–29. [Google Scholar]
  47. Michel, T.; Termentzi, A.; Gikas, E.; Halabalaki, M.; Smith, A.B.; Skaltsounis, A.L. Oleacin and oleocanthal: Two olive oil bioactives in multiple chemical forms. Planta Medica 2012, 78, 43. [Google Scholar] [CrossRef]
  48. Rubio-Senent, F.; Rodríguez-Gutiérrez, G.; Lama-Muñoz, A.; Fernández-Bolaños, J. Chemical characterization and properties of a polymeric phenolic fraction obtained from olive oil waste. Food Res. Int. 2013, 54, 2122–2129. [Google Scholar] [CrossRef]
  49. Jang, J.H.; Moon, K.D. Inhibition of polyphenol oxidase and peroxidase activities on fresh-cut apple by simultaneous treatment of ultrasound and ascorbic acid. Food Chem. 2011, 124, 444–449. [Google Scholar] [CrossRef]
  50. Jahromi, M.A.; Moein, M.R.; Etemadfard, H.; Zebarjad, Z. In vitro free radical scavenging effect and total phenolic and flavonoid contents of 30 iranian plant species. Trends in Pharm. Sci. 2016, 2, 229–238. [Google Scholar]
Figure 1. Visual analysis and browning index of freeze-dried (FD-TPOP), air-dried (AD-TPOP), water (W-HT, W-UT) and 6% citric acid (CA-HT, CA-UT) functional beverages.
Beverages 08 00057 g001
Figure 2. Visible (A) and UV (B) spectra of functional beverages.
Beverages 08 00057 g002
Figure 3. HPLC chromatogram (280 nm) of the frieze-dried two-phase olive pomace (FD-TPOP) extract showing the phenolic compounds selected and quantified in the two-phase olive pomace beverages. Peaks: (1) 3,4-dihydroxyphenylglycol; (2) hydroxytyrosol 4-β-D-glucoside; (3) hydroxytyrosol; (4) unknown; (5) unknown. HY-RC: hydroxytyrosol-related compounds; OLE-RC: oleuropein related compounds.
Beverages 08 00057 g003
Figure 4. Phenolic profile of fresh and HCl-heat hydrolyzed (Hydr-) functional beverages determined by HPLC analyses (HY-RC, hydroxytyrosol related compounds; OLE-RC, oleuropein related compounds; SUM of HY-RC and OLE-RC) and Folin Ciocalteu’s method (TP, Total phenols).
Beverages 08 00057 g004
Figure 5. Linear correlation between percentage DPPH free-radical inhibition and concentration (mg/mL) of hydroxytyrosol (HY) and oleuropein (OLE) standards.
Beverages 08 00057 g005
Table 1. List of samples in function of the treatments and liquid ingredients applied.
N.TagsTreatments Description and Liquid Ingredients
1W-HT30Heat treatment for 30 min in distilled water
2W-HT60Heat treatment for 60 min in distilled water
3W-HT90Heat treatment for 90 min in distilled water
4W-HTMixture of 1, 2 and 3 samples
5W-UT30Ultrasonic treatment for 30 min in distilled water
6W-UT60Ultrasonic treatment for 60 min in distilled water
7W-UT90Ultrasonic treatment for 90 min in distilled water
8W-UTMixture of 5, 6 and 7 samples
9CA-HT30Heat treatment (80 °C) for 30 min in 6% citric acid
10CA-HT60Heat treatment (80 °C) for 60 min in 6% citric acid
11CA-HT90Heat treatment (80 °C) for 90 min in 6% citric acid
12CA-HTMixture of 9, 10 and 11 samples
13CA-UT30Ultrasonic treatment (80 °C) for 30 min in 6% citric acid
14CA-UT60Ultrasonic treatment (80 °C) for 60 min in 6% citric acid
15CA-UT90Ultrasonic treatment (80 °C) for 90 min in 6% citric acid
16CA-UTMixture of 12, 13 and 14 samples
17FD-TPOPFrieze dried two-phase olive pomace—repeated extraction with methanol: water 80% v/v
18AD-TPOPAir-dried (7 days) two-phase olive pomace—extraction with methanol: water 80% v/v
Table 2. Physicochemical characteristics of the fresh two-phase olive pomace (TPOP).
ParametersResults
Humidity (%)63.4 ± 5.1
Solid residue (%)36.5 ± 3.2
Total oil (%)2.6 ± 0.4
Total protein (N × 6.25) (%)1.9 ± 0.3
Ash (%)1.5 ± 0.2
pH5.86 ± 0.73
Table 3. Determinations conducted on the samples. Different letters within the column indicate a significant difference at p ≤ 0.05.
N.SamplespHDensityTotal Soluble Solid °BrixTotal Phenols
mg CAE/g TPOP
o-Diphenols
mg CAE/g TPOP
1FD-TPOP5.11 ± 0.13 aNd *Nd *7.5 ± 0.3 a1.7 ± 0.2 a
2AD-TPOP5.15 ± 0.11 aNd *Nd *3.9 ± 0.2 b1.3 ± 0.2 a
3W-HT305.10 ± 0.12 a0.998 ± 0.001 a0.7 ± 0.1 a2.0 ± 0.1 c2.5 ± 0.1 b
4W-HT605.16 ± 0.11 a0.996 ± 0.001 a0.7 ± 0.1 a1.7 ± 0.1 c2.3 ± 0.1 b
5W-HT905.10 ± 0.10 a0.996 ± 0.001 a0.6 ± 0.1 a1.9 ± 0.2 c2.5 ± 0.2 b
Mean (3–5)5.12 ± 0.090.997 ± 0.0010.6 ± 0.01.9 ± 0.12.5 ± 0.2
6W-HT5.11 ± 0.12 a0.996 ± 0.001 a0.7 ± 0.11.7 ± 0.2 c2.3 ± 0.2 b
7W-UT305.12 ± 0.13 a0.996 ± 0.001 a0.6 ± 0.0 a1.7 ± 0.1 c2.0 ± 0.1 b
8W-UT605.15 ± 0.10 a0.996 ± 0.001 a0.5 ± 0.0 a1.9 ± 0.1 c2.2 ± 0.1 b
9W-UT905.14 ± 0.11 a0.995 ± 0.001 a0.5 ± 0.0 a1.8 ± 0.1 c2.1 ± 0.1 b
Mean (7–8)5.14 ± 0.020.996 ± 0.0010.5 ± 0.01.8 ± 0.12.1 ± 0.1
10W-UT5.14 ± 0.09 a0.995 ± 0.001 a0.6 ± 0.0 a1.7 ± 0.2 c2.0 ± 0.2 b
11CA-HT301.98 ± 0.11 b1.022 ± 0.006b5.8 ± 0.4 b2.1 ± 0.2 c2.5 ± 0.2 b
12CA-HT602.02 ± 0.10 b1.020 ± 0.008b5.6 ± 0.3 b2.2 ± 0.1 c2.5 ± 0.2 b
13CA-HT901.99 ± 0.12 b1.016 ± 0.006b5.6 ± 0.2 b2.1 ± 0.2 c2.2 ± 0.1 b
Mean (11–13)1.99 ± 0.081.019 ± 0.0055.7 ± 0.32.1 ± 0.12.4 ± 0.2
14CA-HT1.99 ± 0.12 b1.020 ± 0.004 b5.9 ± 0.3 b2.1 ± 0.1 c2.3 ± 0.3 b
15CA-UT301.96 ± 0.10 b1.020 ± 0.004 b5.5 ± 0.3 b2.0 ± 0.1 c2.3 ± 0.1 b
16CA-UT601.96 ± 0.10 b1.020 ± 0.005 b5.6 ± 0.3 b1.9 ± 0.1 c2.5 ± 0.1 b
17CA-UT901.93 ± 0.09 b1.032 ± 0.007 b5.5 ± 0.3 b2.1 ± 0.2 c2.6 ± 0.2 b
Mean (15–17)1.96 ± 0.021.024 ± 0.0075.5 ± 0.32.0 ± 0.12.5 ± 0.2
18CA-UT1.95 ± 0.08 b1.020 ± 0.005 b5.1 ± 0.4 b1.9 ± 0.2 c2.3 ± 0.2 b
* Nd: not determined. Mean of the samples with homologous treatment and relative mixture (Table 1) are in bold.
Table 4. Linear regression (%DPPH radical inhibition versus mg/mL antioxidant concentration) and IC50 value of functional beverages, dried two-phase olive pomace and ascorbic acid. The IC50 of samples was expressed as mg/mL CAE. Different letters within columns indicate a significant difference at p ≤ 0.05.
SamplesLinear EquationR2IC50 (mg/mL)
CA-HTy = 1.85x ± 4.830.99924.4 ± 1.5 a
CA-Uy = 3.36x ± 4.590.94313.5 ± 1.2 b
W-HTy = 5.43x ± 8.100.9677.7 ± 1.6 c
W-Uy = 3.56x ± 18.330.9838.9 ± 1.3 c
FD-TPOPy = 1.70x ± 7.990.99924.7 ± 3.2 a
AD-TPOPy = 0.66x ± 9.400.91561.1 ± 3.8 d
Ascorbic acidy = 6.94x ± 3.420.9966.7 ± 1.6 c
Publisher’s Note: MDPI stays neutral with regard to jurisdictional claims in published maps and institutional affiliations.

