

BU-DLNet: Breast Ultrasonography-Based Cancer Detection Using Deep-Learning Network Selection and Feature Optimization

Abstract
:
1. Introduction
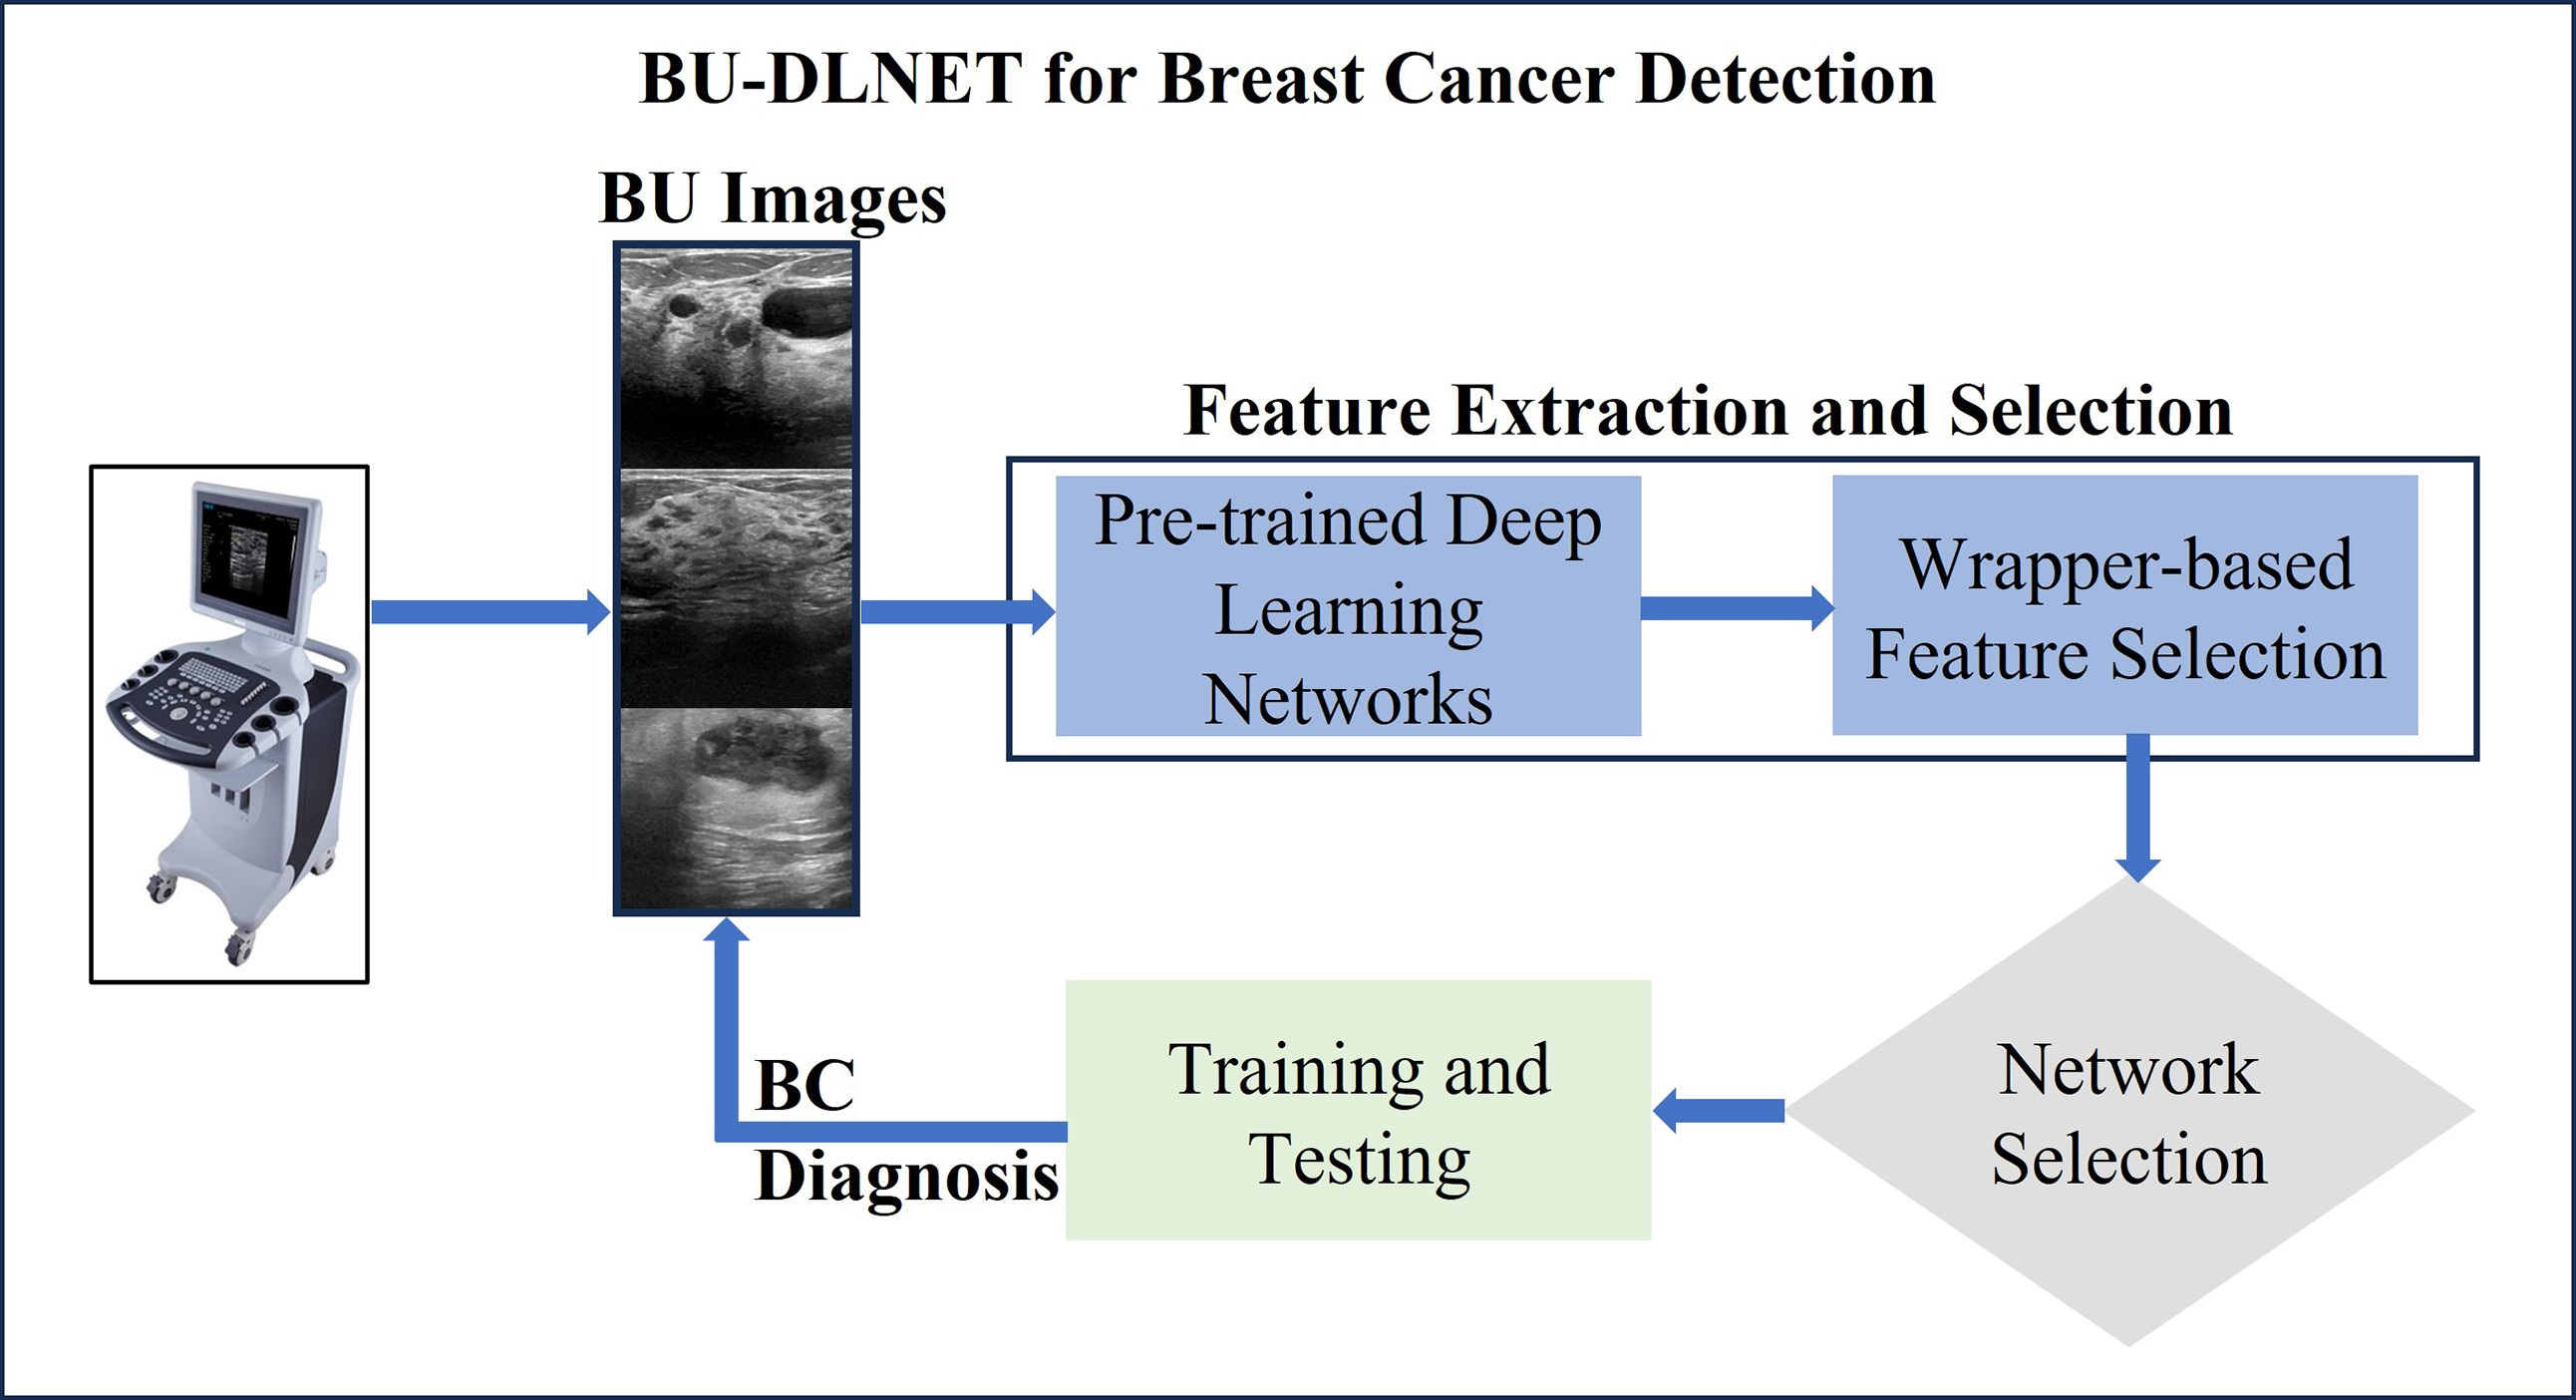
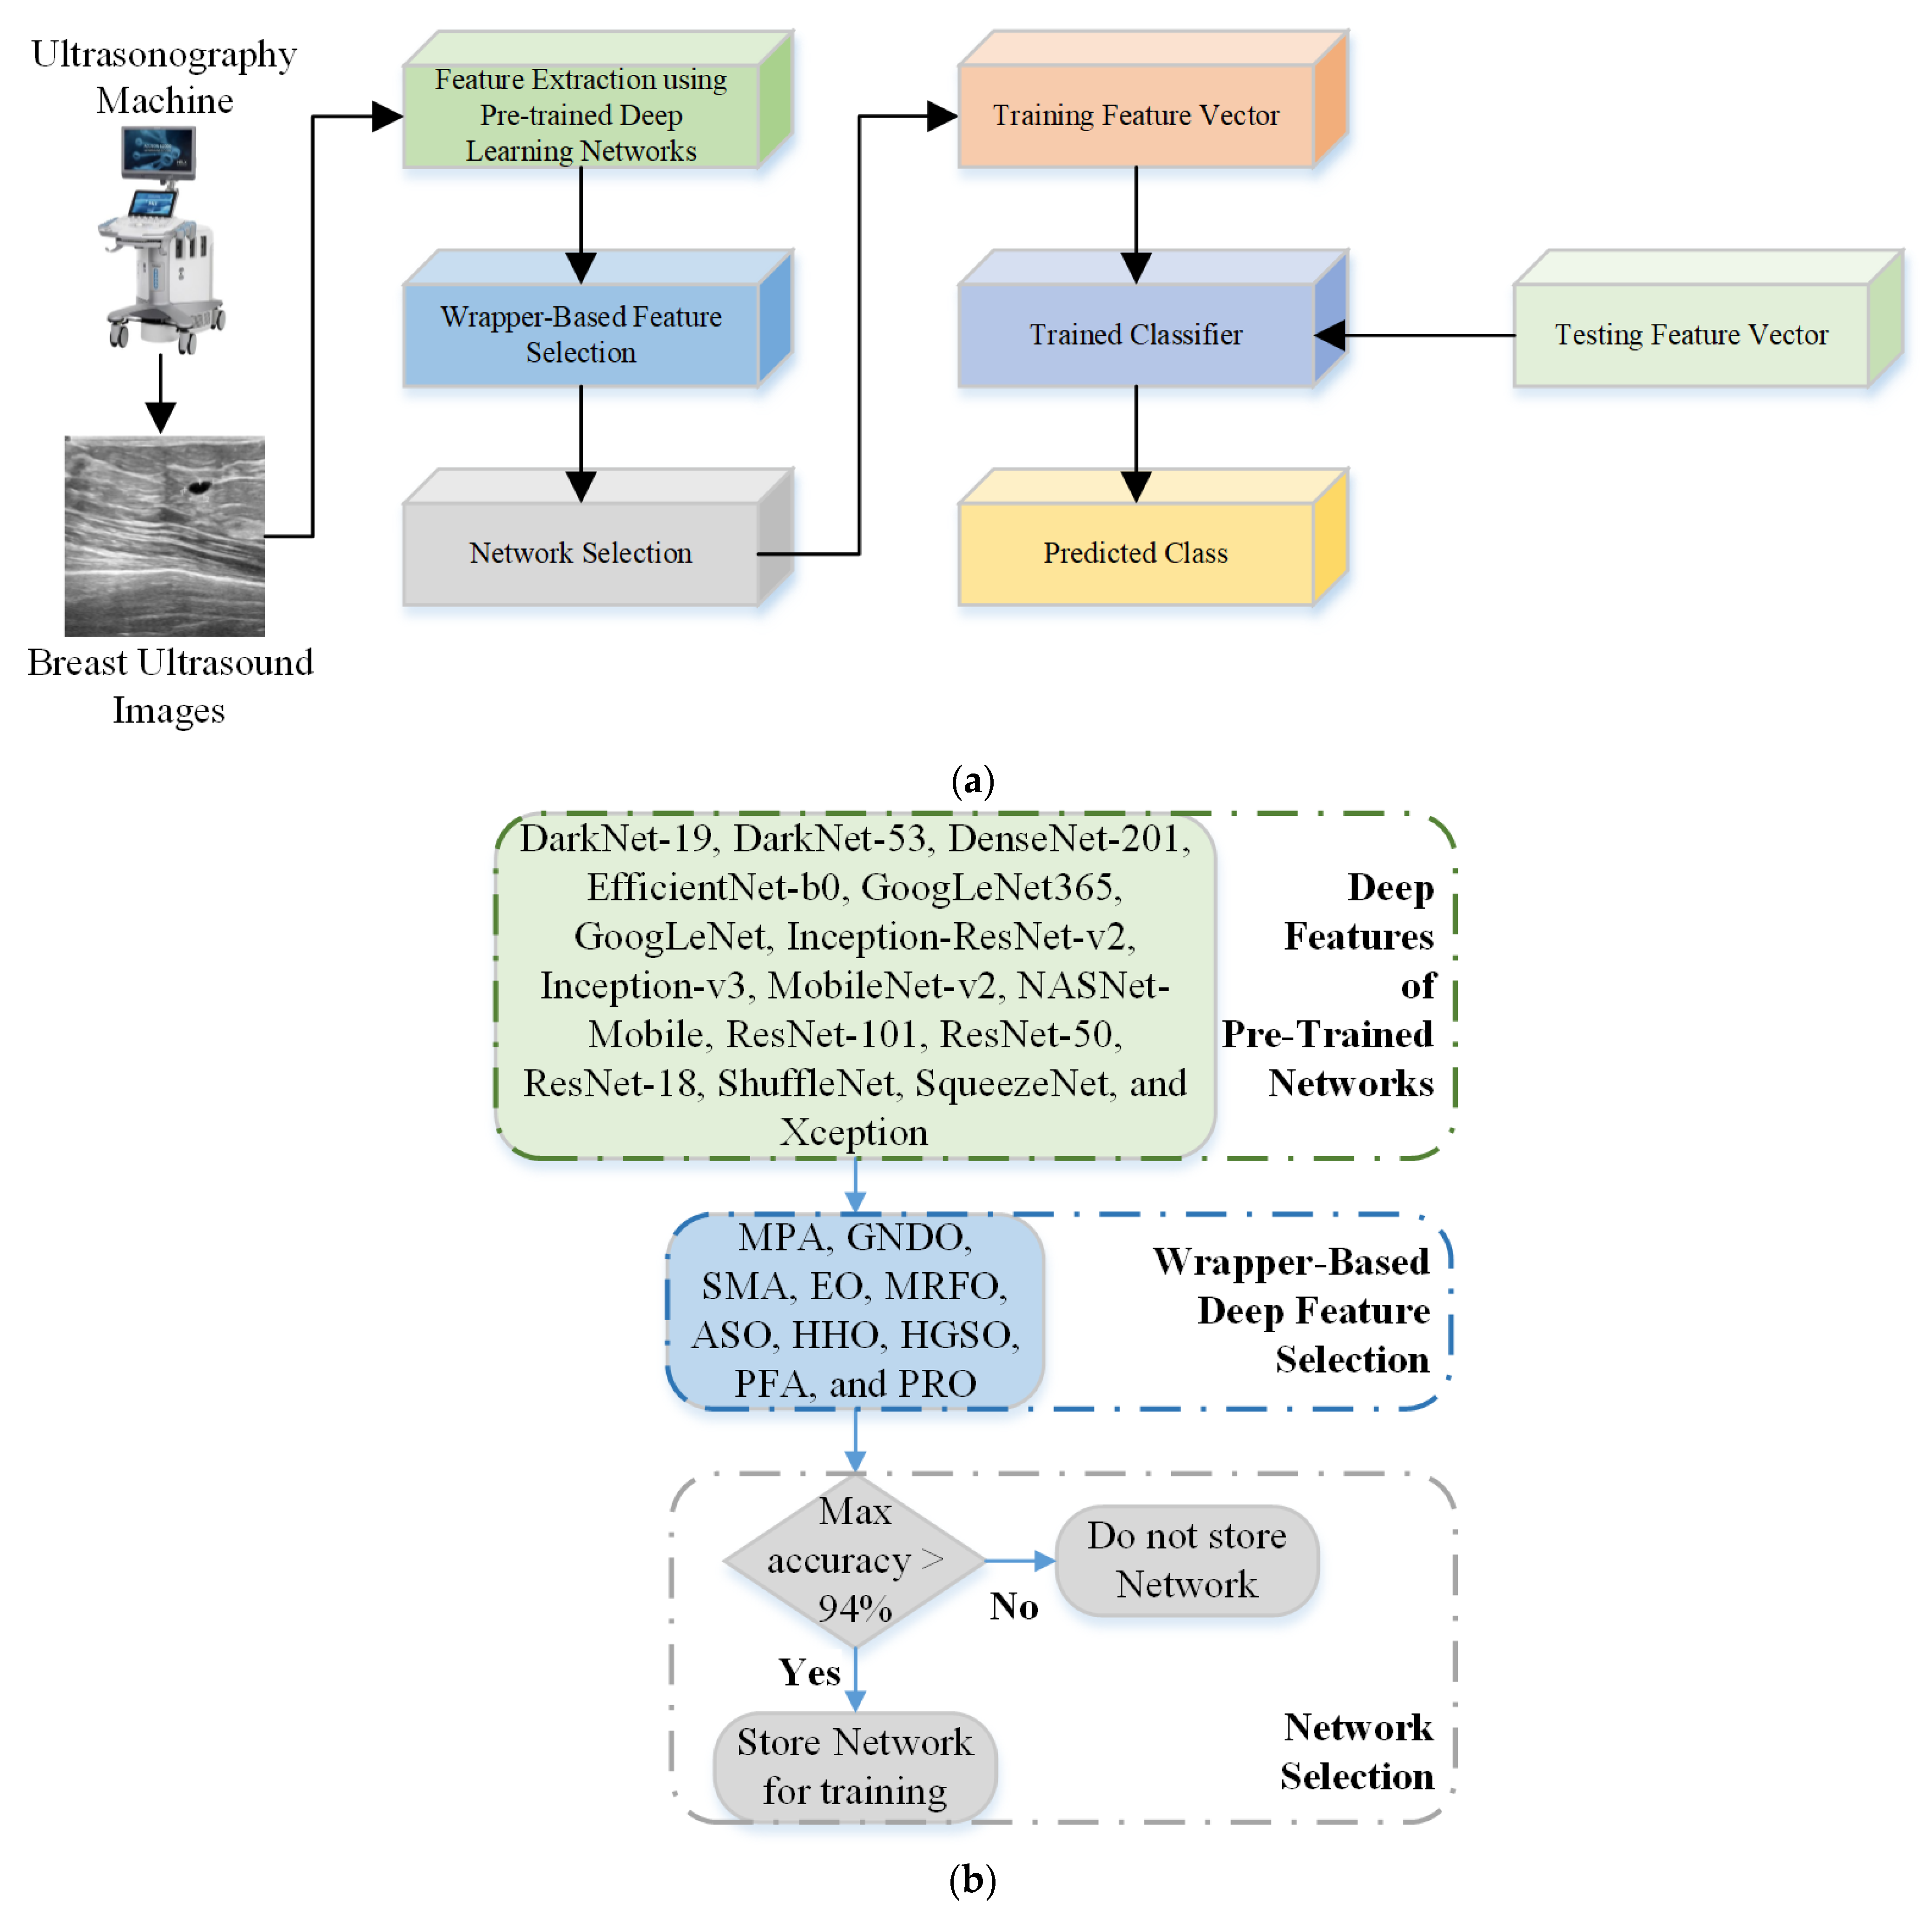
- Various pre-trained deep-learning models were utilized to compute the deep features of the BU images.
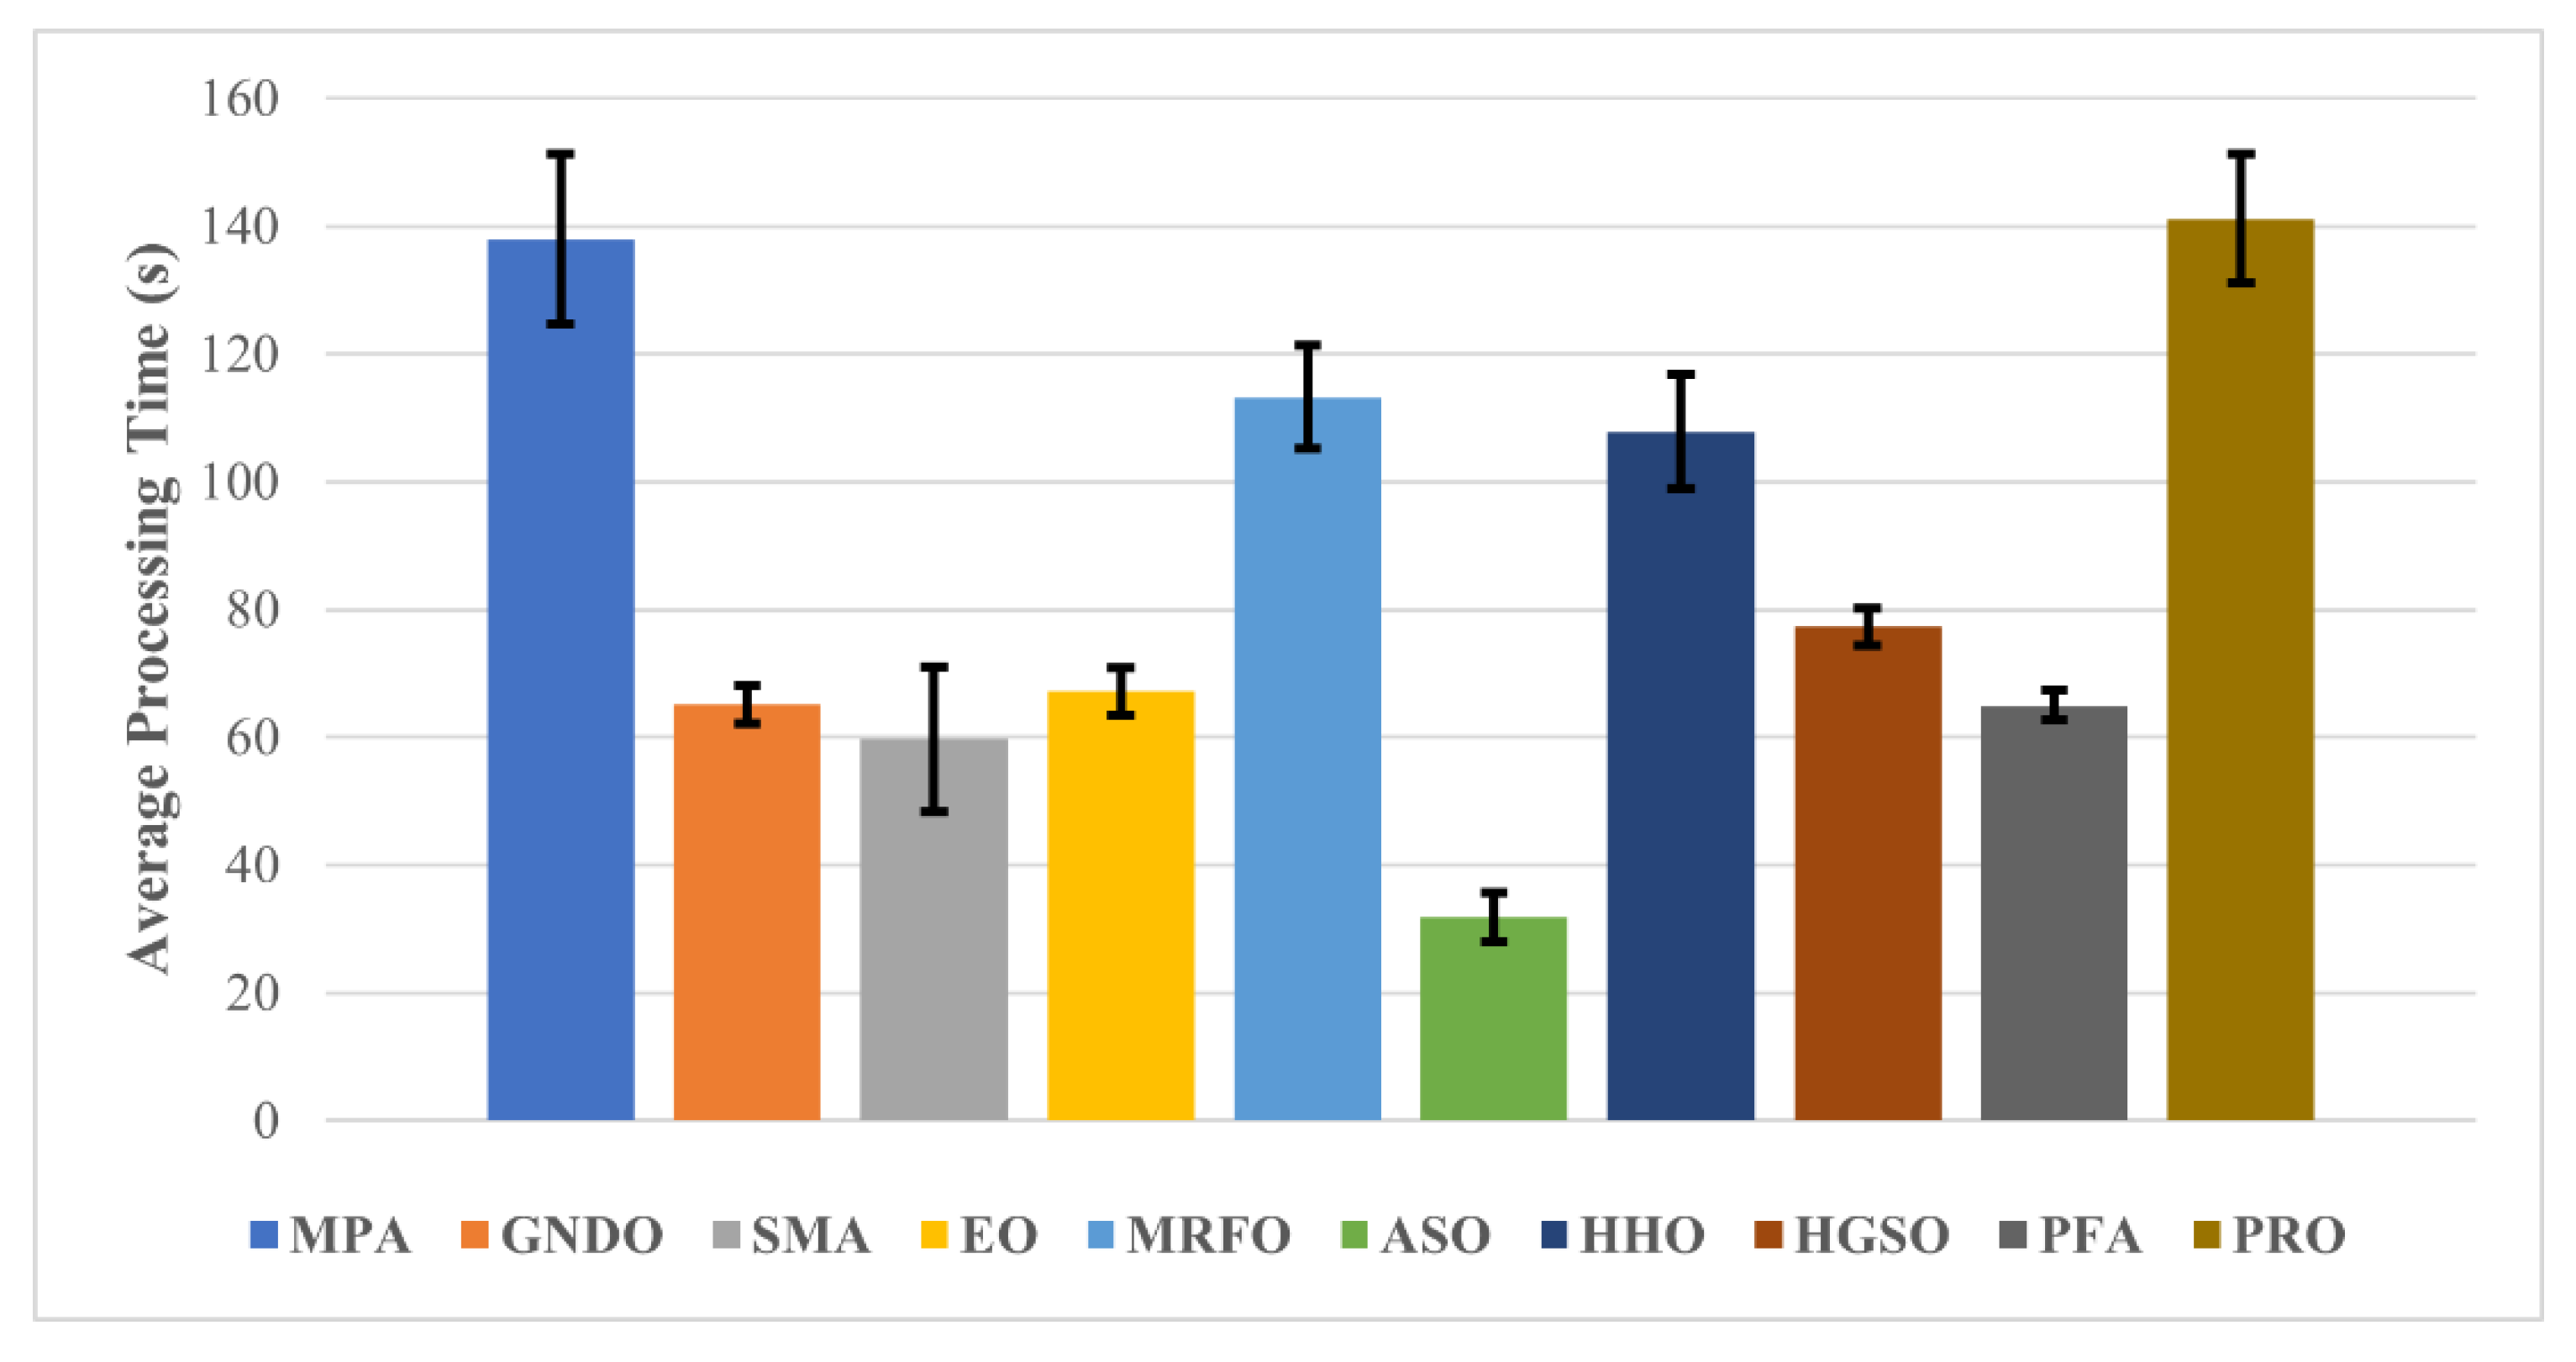
- Ten wrapper-based optimization algorithms were employed to compute the optimal subset of deep features, as follows: the marine predator algorithm (MPA), generalized normal distribution optimization (GNDO), slime mould algorithm (SMA), equilibrium optimizer (EO), manta-ray foraging optimization (MRFO), atom search optimization (ASO), Harris hawks optimization (HHO), Henry gas solubility optimization (HGSO), pathfinder algorithm (PFA), and poor and rich optimization (PRO).
- An SVM-based cost function was used to classify the BU images into subclasses (benign, malignant, and normal).
- Furthermore, a network selection algorithm was employed to determine the best deep-learning network.
- An online BU dataset was used to test the proposed methodology. Moreover, the findings of the proposed methodology are compared with those in the literature.
2. Methods and Materials
2.1. Breast Ultrasonography (BU) Dataset
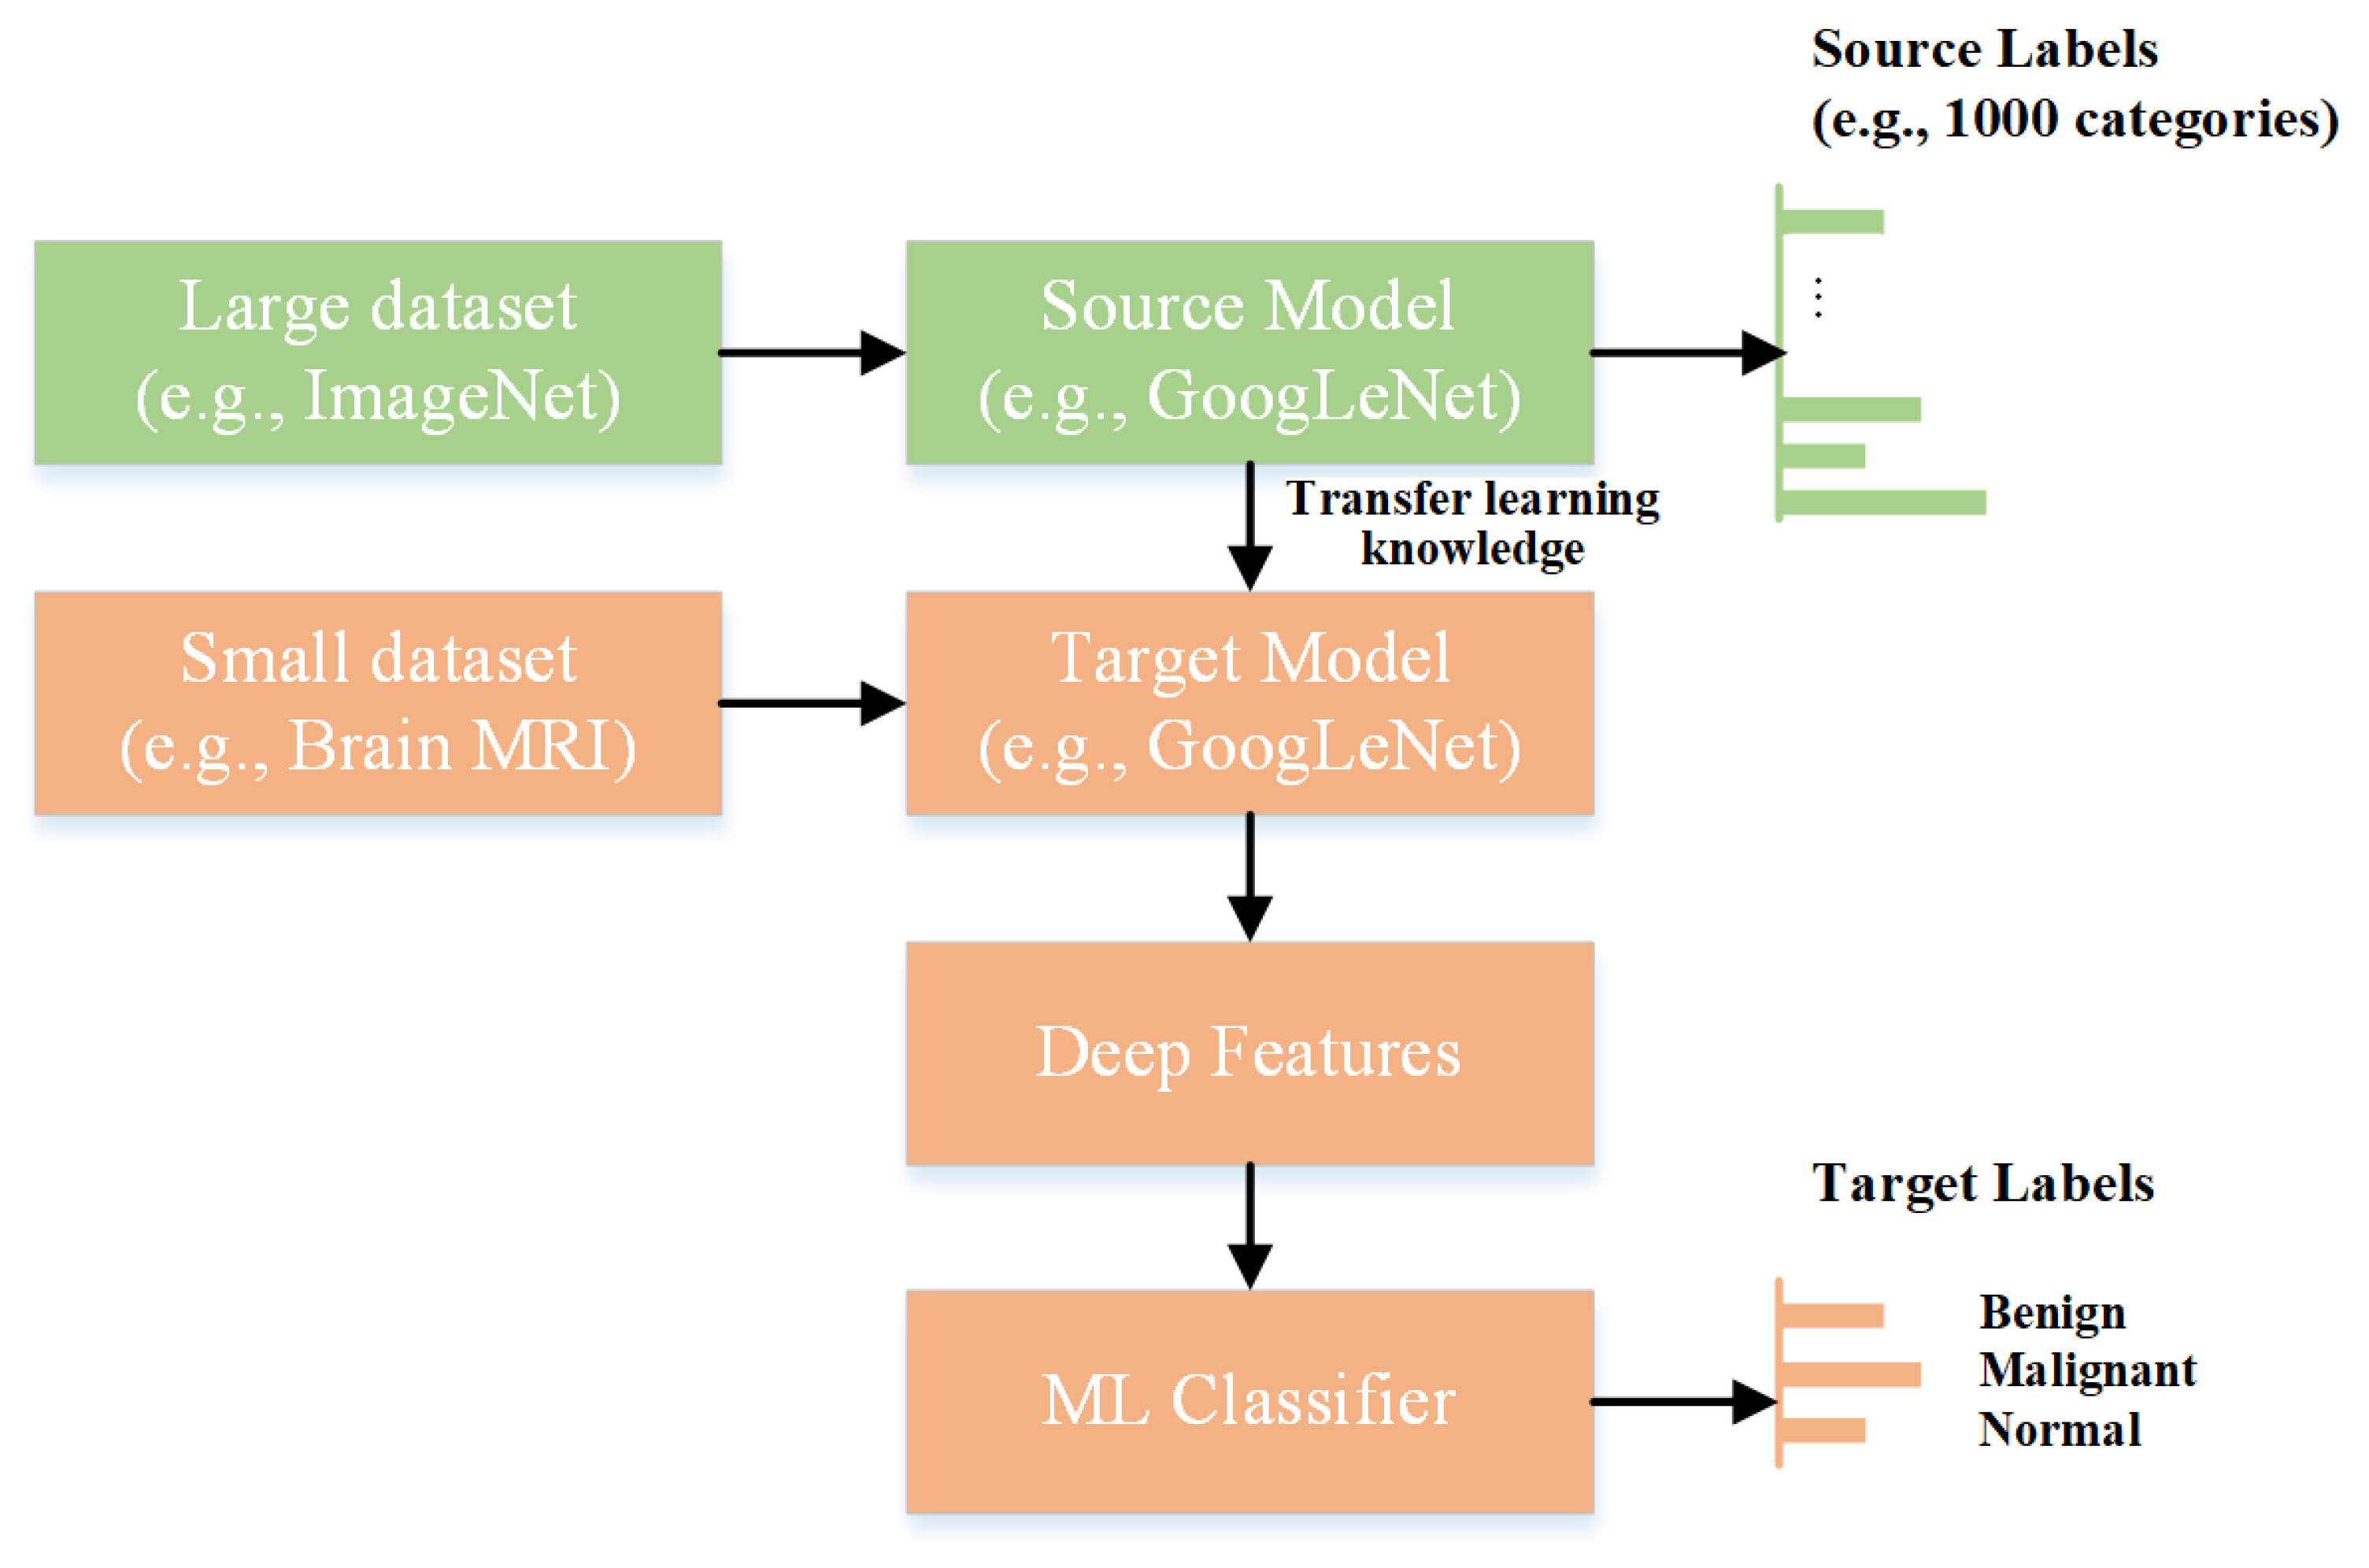
2.2. Deep Feature Extraction Using a Pre-Trained Convolutional Neural Network
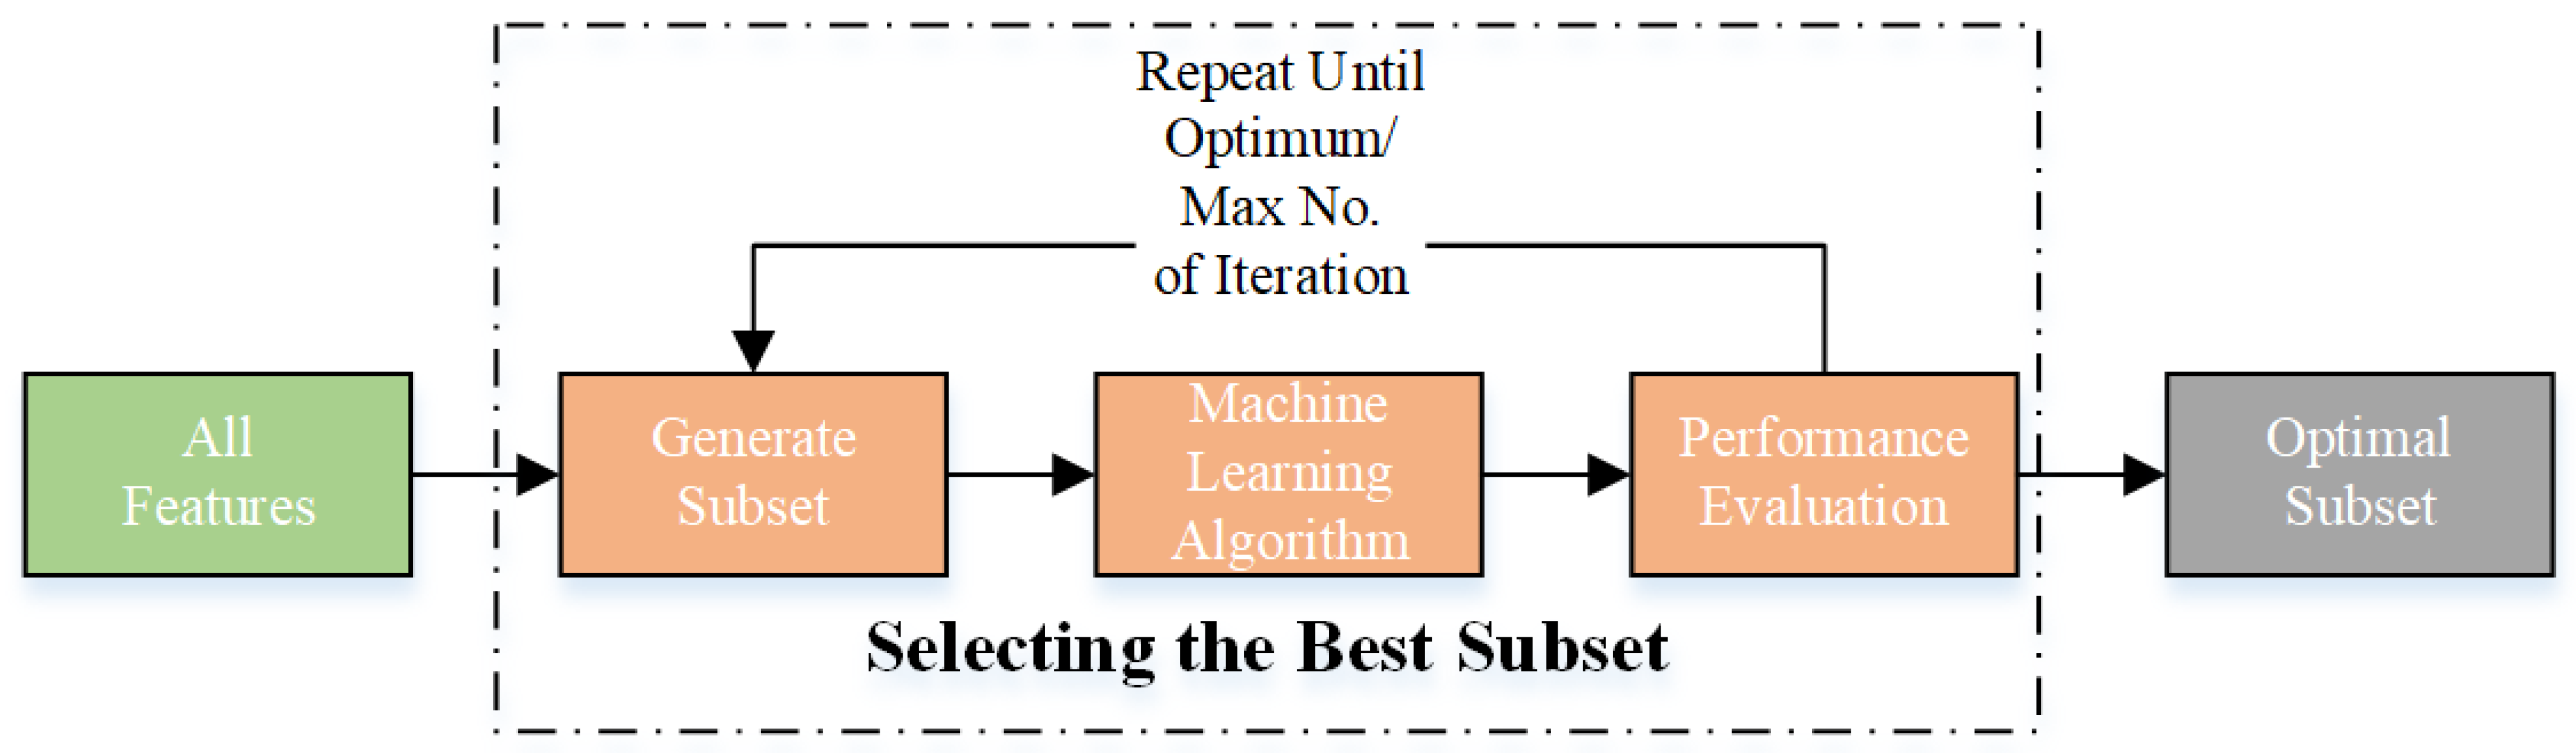
2.3. Optimal Feature Selection Using a Wrapper-Based Approach
2.3.1. Marine Predators Algorithm (MPA)
2.3.2. Generalized Normal Distribution Optimization (GNDO)
2.3.3. Slime Mold Algorithm (SMA)
2.3.4. Equilibrium Optimizer (EO)
2.3.5. Manta-Ray Foraging Optimization (MRFO)
2.3.6. Atom Search Optimization (ASO)
2.3.7. Harris Hawks Optimization (HHO)
2.3.8. Henry Gas Solubility Optimization (HGSO)
2.3.9. Path Finder Algorithm (PFA)
2.3.10. Poor and Rich Optimization (PRO)
3. Proposed Framework for Breast Cancer Detection
4. Results and Discussion
5. Conclusions
Author Contributions
Funding
Institutional Review Board Statement
Informed Consent Statement
Data Availability Statement
Acknowledgments
Conflicts of Interest
References
- Sung, H.; Ferlay, J.; Siegel, R.L.; Laversanne, M.; Soerjomataram, I.; Jemal, A.; Bray, F. Global Cancer Statistics 2020: GLOBOCAN Estimates of Incidence and Mortality Worldwide for 36 Cancers in 185 Countries. CA A Cancer J. Clin. 2021, 71, 209–249. [Google Scholar] [CrossRef]
- Cedolini, C.; Bertozzi, S.; Londero, A.P.; Bernardi, S.; Seriau, L.; Concina, S.; Cattin, F.; Risaliti, A. Type of Breast Cancer Diagnosis, Screening, and Survival. Clin. Breast Cancer 2014, 14, 235–240. [Google Scholar] [CrossRef] [PubMed]
- Ren, W.; Chen, M.; Qiao, Y.; Zhao, F. Global guidelines for breast cancer screening: A systematic review. Breast 2022, 64, 85–99. [Google Scholar] [CrossRef]
- Osako, T.; Takahashi, K.; Iwase, T.; Iijima, K.; Miyagi, Y.; Nishimura, S.; Tada, K.; Makita, M.; Akiyama, F.; Sakamoto, G.; et al. diagnostic ultrasonography and mammography for invasive and noninvasive breast cancer in women aged 30 to 39 years. Breast Cancer 2007, 14, 229–233. [Google Scholar] [CrossRef] [PubMed]
- Niell, B.L.; Freer, P.E.; Weinfurtner, R.J.; Arleo, E.K.; Drukteinis, J.S. Screening for Breast Cancer. Radiol. Clin. N. Am. 2017, 55, 1145–1162. [Google Scholar] [CrossRef]
- Lee, J.M.; Arao, R.F.; Sprague, B.L.; Kerlikowske, K.; Lehman, C.D.; Smith, R.A.; Henderson, L.M.; Rauscher, G.H.; Miglioretti, D.L. Performance of Screening Ultrasonography as an Adjunct to Screening Mammography in Women Across the Spectrum of Breast Cancer Risk. JAMA Intern. Med. 2019, 179, 658–667. [Google Scholar] [CrossRef] [PubMed]
- Yap, M.H.; Pons, G.; Marti, J.; Ganau, S.; Sentis, M.; Zwiggelaar, R.; Davison, A.K.; Marti, R.; Moi Hoon, Y.; Pons, G.; et al. Automated Breast Ultrasound Lesions Detection Using Convolutional Neural Networks. IEEE J. Biomed. Health Inform. 2018, 22, 1218–1226. [Google Scholar] [CrossRef] [Green Version]
- Berg, W.A.; Gutierrez, L.; NessAiver, M.S.; Carter, W.B.; Bhargavan, M.; Lewis, R.S.; Ioffe, O.B. Diagnostic Accuracy of Mammography, Clinical Examination, US, and MR Imaging in Preoperative Assessment of Breast Cancer. Radiology 2004, 233, 830–849. [Google Scholar] [CrossRef]
- Zafar, A.; Dad Kallu, K.; Atif Yaqub, M.; Ali, M.U.; Hyuk Byun, J.; Yoon, M.; Su Kim, K. A Hybrid GCN and Filter-Based Framework for Channel and Feature Selection: An fNIRS-BCI Study. Int. J. Intell. Syst. 2023, 2023, 8812844. [Google Scholar] [CrossRef]
- Ali, M.U.; Kallu, K.D.; Masood, H.; Tahir, U.; Gopi, C.V.V.M.; Zafar, A.; Lee, S.W. A CNN-Based Chest Infection Diagnostic Model: A Multistage Multiclass Isolated and Developed Transfer Learning Framework. Int. J. Intell. Syst. 2023, 2023, 6850772. [Google Scholar] [CrossRef]
- Ali, M.U.; Hussain, S.J.; Zafar, A.; Bhutta, M.R.; Lee, S.W. WBM-DLNets: Wrapper-Based Metaheuristic Deep Learning Networks Feature Optimization for Enhancing Brain Tumor Detection. Bioengineering 2023, 10, 475. [Google Scholar] [CrossRef] [PubMed]
- Zafar, A.; Hussain, S.J.; Ali, M.U.; Lee, S.W. Metaheuristic Optimization-Based Feature Selection for Imagery and Arithmetic Tasks: An fNIRS Study. Sensors 2023, 23, 3714. [Google Scholar] [CrossRef] [PubMed]
- Alanazi, M.F.; Ali, M.U.; Hussain, S.J.; Zafar, A.; Mohatram, M.; Irfan, M.; AlRuwaili, R.; Alruwaili, M.; Ali, N.H.; Albarrak, A.M. Brain Tumor/Mass Classification Framework Using Magnetic-Resonance-Imaging-Based Isolated and Developed Transfer Deep-Learning Model. Sensors 2022, 22, 372. [Google Scholar] [CrossRef] [PubMed]
- Almalki, Y.E.; Ali, M.U.; Ahmed, W.; Kallu, K.D.; Zafar, A.; Alduraibi, S.K.; Irfan, M.; Basha, M.A.A.; Alshamrani, H.A.; Alduraibi, A.K. Robust Gaussian and Nonlinear Hybrid Invariant Clustered Features Aided Approach for Speeded Brain Tumor Diagnosis. Life 2022, 12, 1084. [Google Scholar] [CrossRef]
- Almalki, Y.E.; Ali, M.U.; Kallu, K.D.; Masud, M.; Zafar, A.; Alduraibi, S.K.; Irfan, M.; Basha, M.A.A.; Alshamrani, H.A.; Alduraibi, A.K.; et al. Isolated Convolutional-Neural-Network-Based Deep-Feature Extraction for Brain Tumor Classification Using Shallow Classifier. Diagnostics 2022, 12, 1793. [Google Scholar] [CrossRef]
- Zahid, U.; Ashraf, I.; Khan, M.A.; Alhaisoni, M.; Yahya, K.M.; Hussein, H.S.; Alshazly, H. BrainNet: Optimal Deep Learning Feature Fusion for Brain Tumor Classification. Comput. Intell. Neurosci. 2022, 2022, 1465173. [Google Scholar] [CrossRef]
- Zhang, H.; Gao, Z.; Zhang, D.; Hau, W.K.; Zhang, H. Progressive Perception Learning for Main Coronary Segmentation in X-Ray Angiography. IEEE Trans. Med. Imaging 2023, 42, 864–879. [Google Scholar] [CrossRef]
- Xiao, T.; Liu, L.; Li, K.; Qin, W.; Yu, S.; Li, Z. Comparison of Transferred Deep Neural Networks in Ultrasonic Breast Masses Discrimination. BioMed Res. Int. 2018, 2018, 4605191. [Google Scholar] [CrossRef]
- Radak, M.; Lafta, H.Y.; Fallahi, H. Machine learning and deep learning techniques for breast cancer diagnosis and classification: A comprehensive review of medical imaging studies. J. Cancer Res. Clin. Oncol. 2023. [Google Scholar] [CrossRef]
- Rezaei, Z. A review on image-based approaches for breast cancer detection, segmentation, and classification. Expert. Syst. Appl. 2021, 182, 115204. [Google Scholar] [CrossRef]
- Kwon, B.R.; Chang, J.M.; Kim, S.Y.; Lee, S.H.; Kim, S.-Y.; Lee, S.M.; Cho, N.; Moon, W.K. Automated Breast Ultrasound System for Breast Cancer Evaluation: Diagnostic Performance of the Two-View Scan Technique in Women with Small Breasts. Korean J. Radiol. 2020, 21, 25–32. [Google Scholar] [CrossRef] [PubMed]
- Sun, Q.; Lin, X.; Zhao, Y.; Li, L.; Yan, K.; Liang, D.; Sun, D.; Li, Z.-C. Deep Learning vs. Radiomics for Predicting Axillary Lymph Node Metastasis of Breast Cancer Using Ultrasound Images: Don’t Forget the Peritumoral Region. Front. Oncol. 2020, 10. [Google Scholar] [CrossRef] [PubMed] [Green Version]
- Zhuang, Z.; Yang, Z.; Raj, A.N.J.; Wei, C.; Jin, P.; Zhuang, S. Breast ultrasound tumor image classification using image decomposition and fusion based on adaptive multi-model spatial feature fusion. Comput. Methods Programs Biomed. 2021, 208, 106221. [Google Scholar] [CrossRef]
- Zhang, X.; Li, H.; Wang, C.; Cheng, W.; Zhu, Y.; Li, D.; Jing, H.; Li, S.; Hou, J.; Li, J. Evaluating the accuracy of breast cancer and molecular subtype diagnosis by ultrasound image deep learning model. Front. Oncol. 2021, 11, 623506. [Google Scholar] [CrossRef] [PubMed]
- Zhang, H.; Han, L.; Chen, K.; Peng, Y.; Lin, J. Diagnostic Efficiency of the Breast Ultrasound Computer-Aided Prediction Model Based on Convolutional Neural Network in Breast Cancer. J. Digit. Imaging 2020, 33, 1218–1223. [Google Scholar] [CrossRef] [PubMed]
- Moon, W.K.; Huang, Y.-S.; Hsu, C.-H.; Chang Chien, T.-Y.; Chang, J.M.; Lee, S.H.; Huang, C.-S.; Chang, R.-F. Computer-aided tumor detection in automated breast ultrasound using a 3-D convolutional neural network. Comput. Methods Programs Biomed. 2020, 190, 105360. [Google Scholar] [CrossRef]
- Nascimento, C.D.L.; Silva, S.D.d.S.; Silva, T.A.d.; Pereira, W.C.d.A.; Costa, M.G.F.; Costa, C.F.F. Breast tumor classification in ultrasound images using support vector machines and neural networks. Res. Biomed. Eng. 2016, 32, 283–292. [Google Scholar] [CrossRef] [Green Version]
- Shia, W.-C.; Chen, D.-R. Classification of malignant tumors in breast ultrasound using a pretrained deep residual network model and support vector machine. Comput. Med. Imaging Graph. 2021, 87, 101829. [Google Scholar] [CrossRef]
- Alduraibi, S.-K. A Novel Convolutional Neural Networks-Fused Shallow Classifier for Breast Cancer Detection. Intell. Autom. Soft Comput. 2022, 33, 1321–1334. [Google Scholar] [CrossRef]
- Al-Dhabyani, W.; Gomaa, M.; Khaled, H.; Fahmy, A. Dataset of breast ultrasound images. Data Brief. 2020, 28, 104863. [Google Scholar] [CrossRef]
- Baltruschat, I.M.; Nickisch, H.; Grass, M.; Knopp, T.; Saalbach, A. Comparison of Deep Learning Approaches for Multi-Label Chest X-ray Classification. Sci. Rep. 2019, 9, 6381. [Google Scholar] [CrossRef] [Green Version]
- Kang, J.; Gwak, J. Ensemble of Instance Segmentation Models for Polyp Segmentation in Colonoscopy Images. IEEE Access 2019, 7, 26440–26447. [Google Scholar] [CrossRef]
- Dash, M.; Liu, H. Feature selection for classification. Intell. Data Anal. 1997, 1, 131–156. [Google Scholar] [CrossRef]
- Guyon, I.; Elisseeff, A. An introduction to variable and feature selection. J. Mach. Learn. Res. 2003, 3, 1157–1182. [Google Scholar]
- Kohavi, R.; John, G.H. Wrappers for feature subset selection. Artif. Intell. 1997, 97, 273–324. [Google Scholar] [CrossRef] [Green Version]
- Abdel-Basset, M.; Abdel-Fatah, L.; Sangaiah, A.K. Metaheuristic algorithms: A comprehensive review. Comput. Intell. Multimed. Big Data Cloud Eng. Appl. 2018, 185–231. [Google Scholar] [CrossRef]
- Liu, W.; Wang, J. A Brief Survey on Nature-Inspired Metaheuristics for Feature Selection in Classification in this Decade. In Proceedings of the 2019 IEEE 16th International Conference on Networking, Sensing and Control (ICNSC), Banff, ALB, Canada, 9–11 May 2019; pp. 424–429. [Google Scholar]
- Agrawal, P.; Abutarboush, H.F.; Ganesh, T.; Mohamed, A.W. Metaheuristic Algorithms on Feature Selection: A Survey of One Decade of Research (2009–2019). IEEE Access 2021, 9, 26766–26791. [Google Scholar] [CrossRef]
- Faramarzi, A.; Heidarinejad, M.; Mirjalili, S.; Gandomi, A.H. Marine Predators Algorithm: A nature-inspired metaheuristic. Expert. Syst. Appl. 2020, 152, 113377. [Google Scholar] [CrossRef]
- Rai, R.; Dhal, K.G.; Das, A.; Ray, S. An Inclusive Survey on Marine Predators Algorithm: Variants and Applications. Arch. Comput. Methods Eng. 2023, 30, 3133–3172. [Google Scholar] [CrossRef]
- Zhang, Y.; Jin, Z.; Mirjalili, S. Generalized normal distribution optimization and its applications in parameter extraction of photovoltaic models. Energy Convers. Manag. 2020, 224, 113301. [Google Scholar] [CrossRef]
- Vega-Forero, J.A.; Ramos-Castellanos, J.S.; Montoya, O.D. Application of the Generalized Normal Distribution Optimization Algorithm to the Optimal Selection of Conductors in Three-Phase Asymmetric Distribution Networks. Energies 2023, 16, 1311. [Google Scholar] [CrossRef]
- Li, S.; Chen, H.; Wang, M.; Heidari, A.A.; Mirjalili, S. Slime mould algorithm: A new method for stochastic optimization. Future Gener. Comput. Syst. 2020, 111, 300–323. [Google Scholar] [CrossRef]
- Tang, A.-D.; Tang, S.-Q.; Han, T.; Zhou, H.; Xie, L. A Modified Slime Mould Algorithm for Global Optimization. Comput. Intell. Neurosci. 2021, 2021, 2298215. [Google Scholar] [CrossRef]
- Chakraborty, P.; Nama, S.; Saha, A.K. A hybrid slime mould algorithm for global optimization. Multimed. Tools Appl. 2022, 82, 22441–22467. [Google Scholar] [CrossRef]
- Faramarzi, A.; Heidarinejad, M.; Stephens, B.; Mirjalili, S. Equilibrium optimizer: A novel optimization algorithm. Knowl.-Based Syst. 2020, 191, 105190. [Google Scholar] [CrossRef]
- Faramarzi, A.; Mirjalili, S.; Heidarinejad, M. Binary equilibrium optimizer: Theory and application in building optimal control problems. Energy Build. 2022, 277, 112503. [Google Scholar] [CrossRef]
- Zhao, W.; Zhang, Z.; Wang, L. Manta ray foraging optimization: An effective bio-inspired optimizer for engineering applications. Eng. Appl. Artif. Intell. 2020, 87, 103300. [Google Scholar] [CrossRef]
- Hassan, I.H.; Abdullahi, M.; Aliyu, M.M.; Yusuf, S.A.; Abdulrahim, A. An improved binary manta ray foraging optimization algorithm based feature selection and random forest classifier for network intrusion detection. Intell. Syst. Appl. 2022, 16, 200114. [Google Scholar] [CrossRef]
- Zhao, W.; Wang, L.; Zhang, Z. Atom search optimization and its application to solve a hydrogeologic parameter estimation problem. Knowl.-Based Syst. 2019, 163, 283–304. [Google Scholar] [CrossRef]
- Wang, P.; He, W.; Guo, F.; He, X.; Huang, J. An improved atomic search algorithm for optimization and application in ML DOA estimation of vector hydrophone array. AIMS Math. 2022, 7, 5563–5593. [Google Scholar] [CrossRef]
- Heidari, A.A.; Mirjalili, S.; Faris, H.; Aljarah, I.; Mafarja, M.; Chen, H. Harris hawks optimization: Algorithm and applications. Future Gener. Comput. Syst. 2019, 97, 849–872. [Google Scholar] [CrossRef]
- Bairathi, D.; Gopalani, D. A novel swarm intelligence based optimization method: Harris’ hawk optimization. In Proceedings of the Intelligent Systems Design and Applications: 18th International Conference on Intelligent Systems Design and Applications (ISDA 2018), Vellore, India, 6–8 December 2018; Volume 2, pp. 832–842. [Google Scholar]
- Hashim, F.A.; Houssein, E.H.; Mabrouk, M.S.; Al-Atabany, W.; Mirjalili, S. Henry gas solubility optimization: A novel physics-based algorithm. Future Gener. Comput. Syst. 2019, 101, 646–667. [Google Scholar] [CrossRef]
- Yapici, H.; Cetinkaya, N. A new meta-heuristic optimizer: Pathfinder algorithm. Appl. Soft Comput. 2019, 78, 545–568. [Google Scholar] [CrossRef]
- Samareh Moosavi, S.H.; Bardsiri, V.K. Poor and rich optimization algorithm: A new human-based and multi populations algorithm. Eng. Appl. Artif. Intell. 2019, 86, 165–181. [Google Scholar] [CrossRef]
- Cristianini, N.; Shawe-Taylor, J. An Introduction to Support Vector Machines and Other Kernel-Based Learning Methods; Cambridge University Press: Cambridge, UK, 2000. [Google Scholar]
- Smola, A.J.; Schölkopf, B. A tutorial on support vector regression. Stat. Comput. 2004, 14, 199–222. [Google Scholar] [CrossRef] [Green Version]
- Liao, W.X.; He, P.; Hao, J.; Wang, X.Y.; Yang, R.L.; An, D.; Cui, L.G. Automatic Identification of Breast Ultrasound Image Based on Supervised Block-Based Region Segmentation Algorithm and Features Combination Migration Deep Learning Model. IEEE J. Biomed. Health Inform. 2020, 24, 984–993. [Google Scholar] [CrossRef]
- Huang, Q.; Chen, Y.; Liu, L.; Tao, D.; Li, X. On Combining Biclustering Mining and AdaBoost for Breast Tumor Classification. IEEE Trans. Knowl. Data Eng. 2020, 32, 728–738. [Google Scholar] [CrossRef]
- Yu, X.; Kang, C.; Guttery, D.S.; Kadry, S.; Chen, Y.; Zhang, Y.D. ResNet-SCDA-50 for Breast Abnormality Classification. IEEE/ACM Trans. Comput. Biol. Bioinform. 2021, 18, 94–102. [Google Scholar] [CrossRef]
- Moon, W.K.; Lee, Y.-W.; Ke, H.-H.; Lee, S.H.; Huang, C.-S.; Chang, R.-F. Computer-aided diagnosis of breast ultrasound images using ensemble learning from convolutional neural networks. Comput. Methods Programs Biomed. 2020, 190, 105361. [Google Scholar] [CrossRef]
- Eroğlu, Y.; Yildirim, M.; Çinar, A. Convolutional Neural Networks based classification of breast ultrasonography images by hybrid method with respect to benign, malignant, and normal using mRMR. Comput. Biol. Med. 2021, 133, 104407. [Google Scholar] [CrossRef]
- Kim, E.S.; Cho, N.; Kim, S.-Y.; Kwon, B.R.; Yi, A.; Ha, S.M.; Lee, S.H.; Chang, J.M.; Moon, W.K. Comparison of Abbreviated MRI and Full Diagnostic MRI in Distinguishing between Benign and Malignant Lesions Detected by Breast MRI: A Multireader Study. Korean J. Radiol. 2021, 22, 297–307. [Google Scholar] [CrossRef]
- Sheth, D.; Giger, M.L. Artificial intelligence in the interpretation of breast cancer on MRI. J. Magn. Reson. Imaging 2020, 51, 1310–1324. [Google Scholar] [CrossRef]
- Geras, K.J.; Mann, R.M.; Moy, L. Artificial Intelligence for Mammography and Digital Breast Tomosynthesis: Current Concepts and Future Perspectives. Radiology 2019, 293, 246–259. [Google Scholar] [CrossRef]
- Le, E.P.V.; Wang, Y.; Huang, Y.; Hickman, S.; Gilbert, F.J. Artificial intelligence in breast imaging. Clin. Radiol. 2019, 74, 357–366. [Google Scholar] [CrossRef]


| Benign | Malignant | Normal | |
|---|---|---|---|
| BU images |  |  |  |
| Number of images per class | 437 | 210 | 133 |
| MPA | GNDO | SMA | EO | MRFO | ASO | HHO | HGSO | PFA | PRO |
|---|---|---|---|---|---|---|---|---|---|
| Fish aggregating devices effect = 0.2 | Lower bound = 0 | Lower bound = 0 | Constant 1 = 2 | Somersault factor = 2 | Depth weight = 50 | Lower bound = 0 | Number of gas types = 2 | Lower bound = 0 | Lower bound = 0 |
| Constant = 0.5 | Upper bound = 1 | Upper bound = 1 | Constant 2 = 1 | Multiplier weight = 0.2 | Upper bound = 1 | Constant = 1 | Upper bound = 1 | Upper bound = 1 |
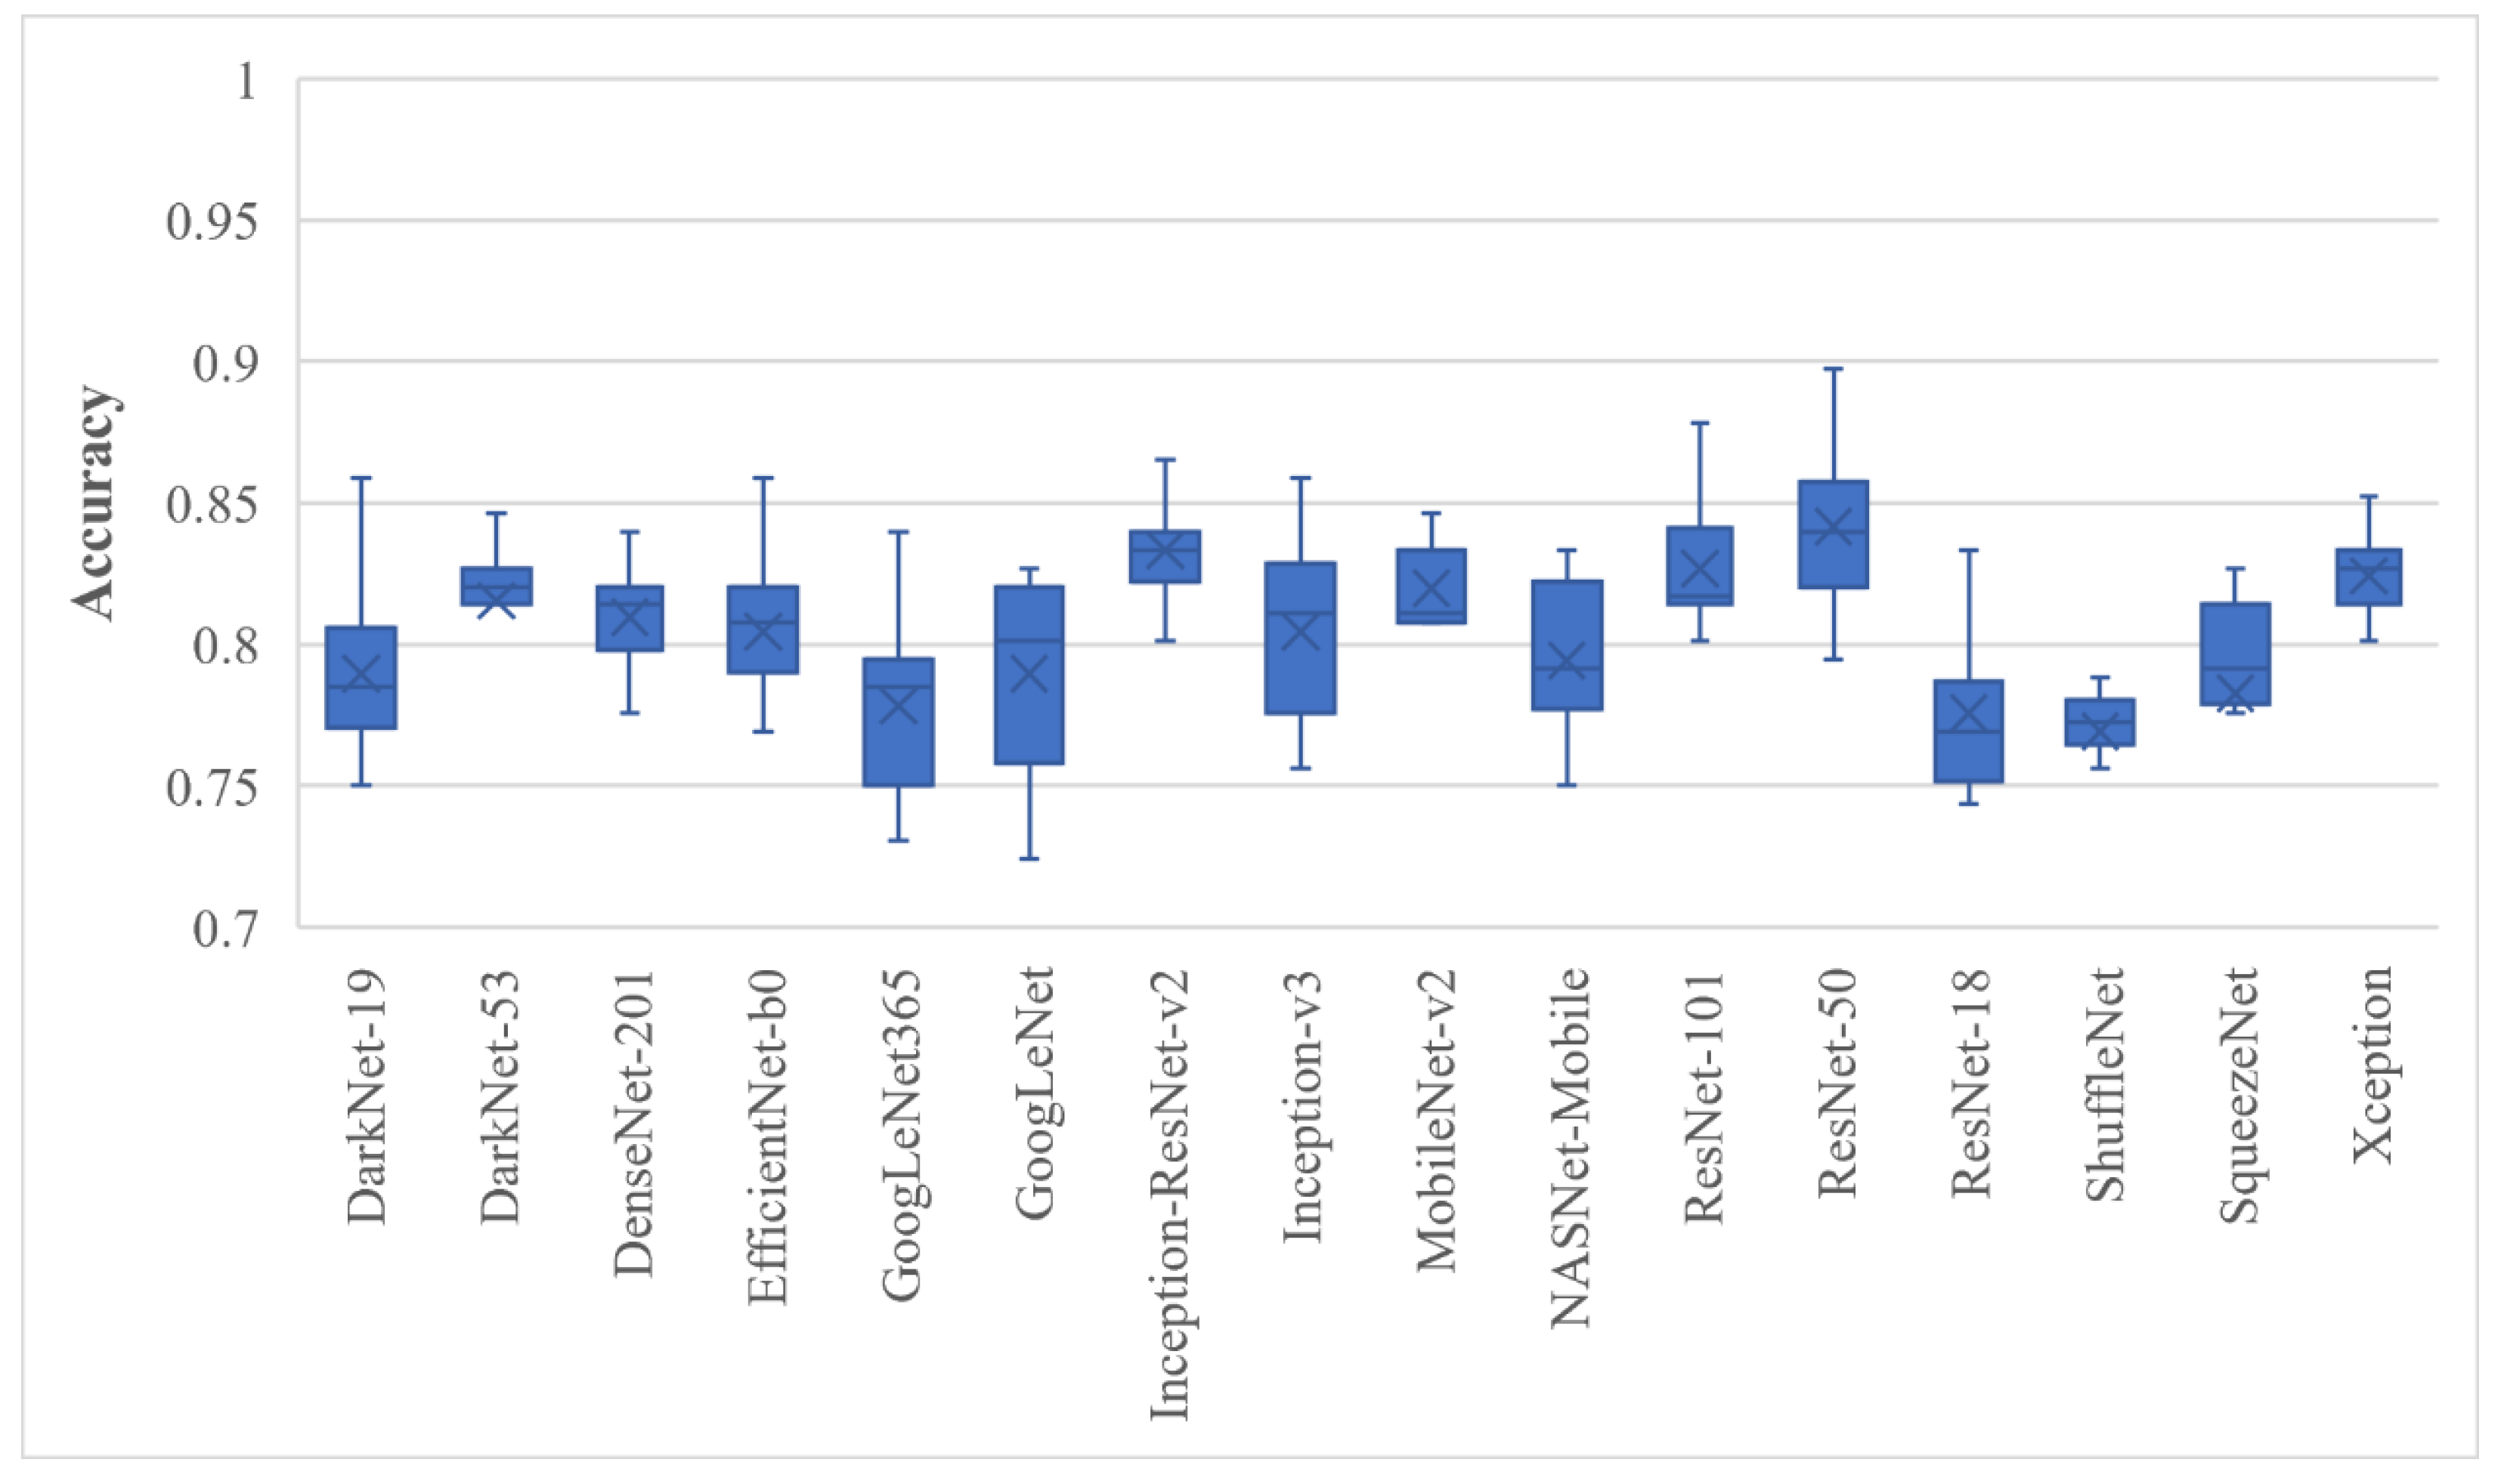
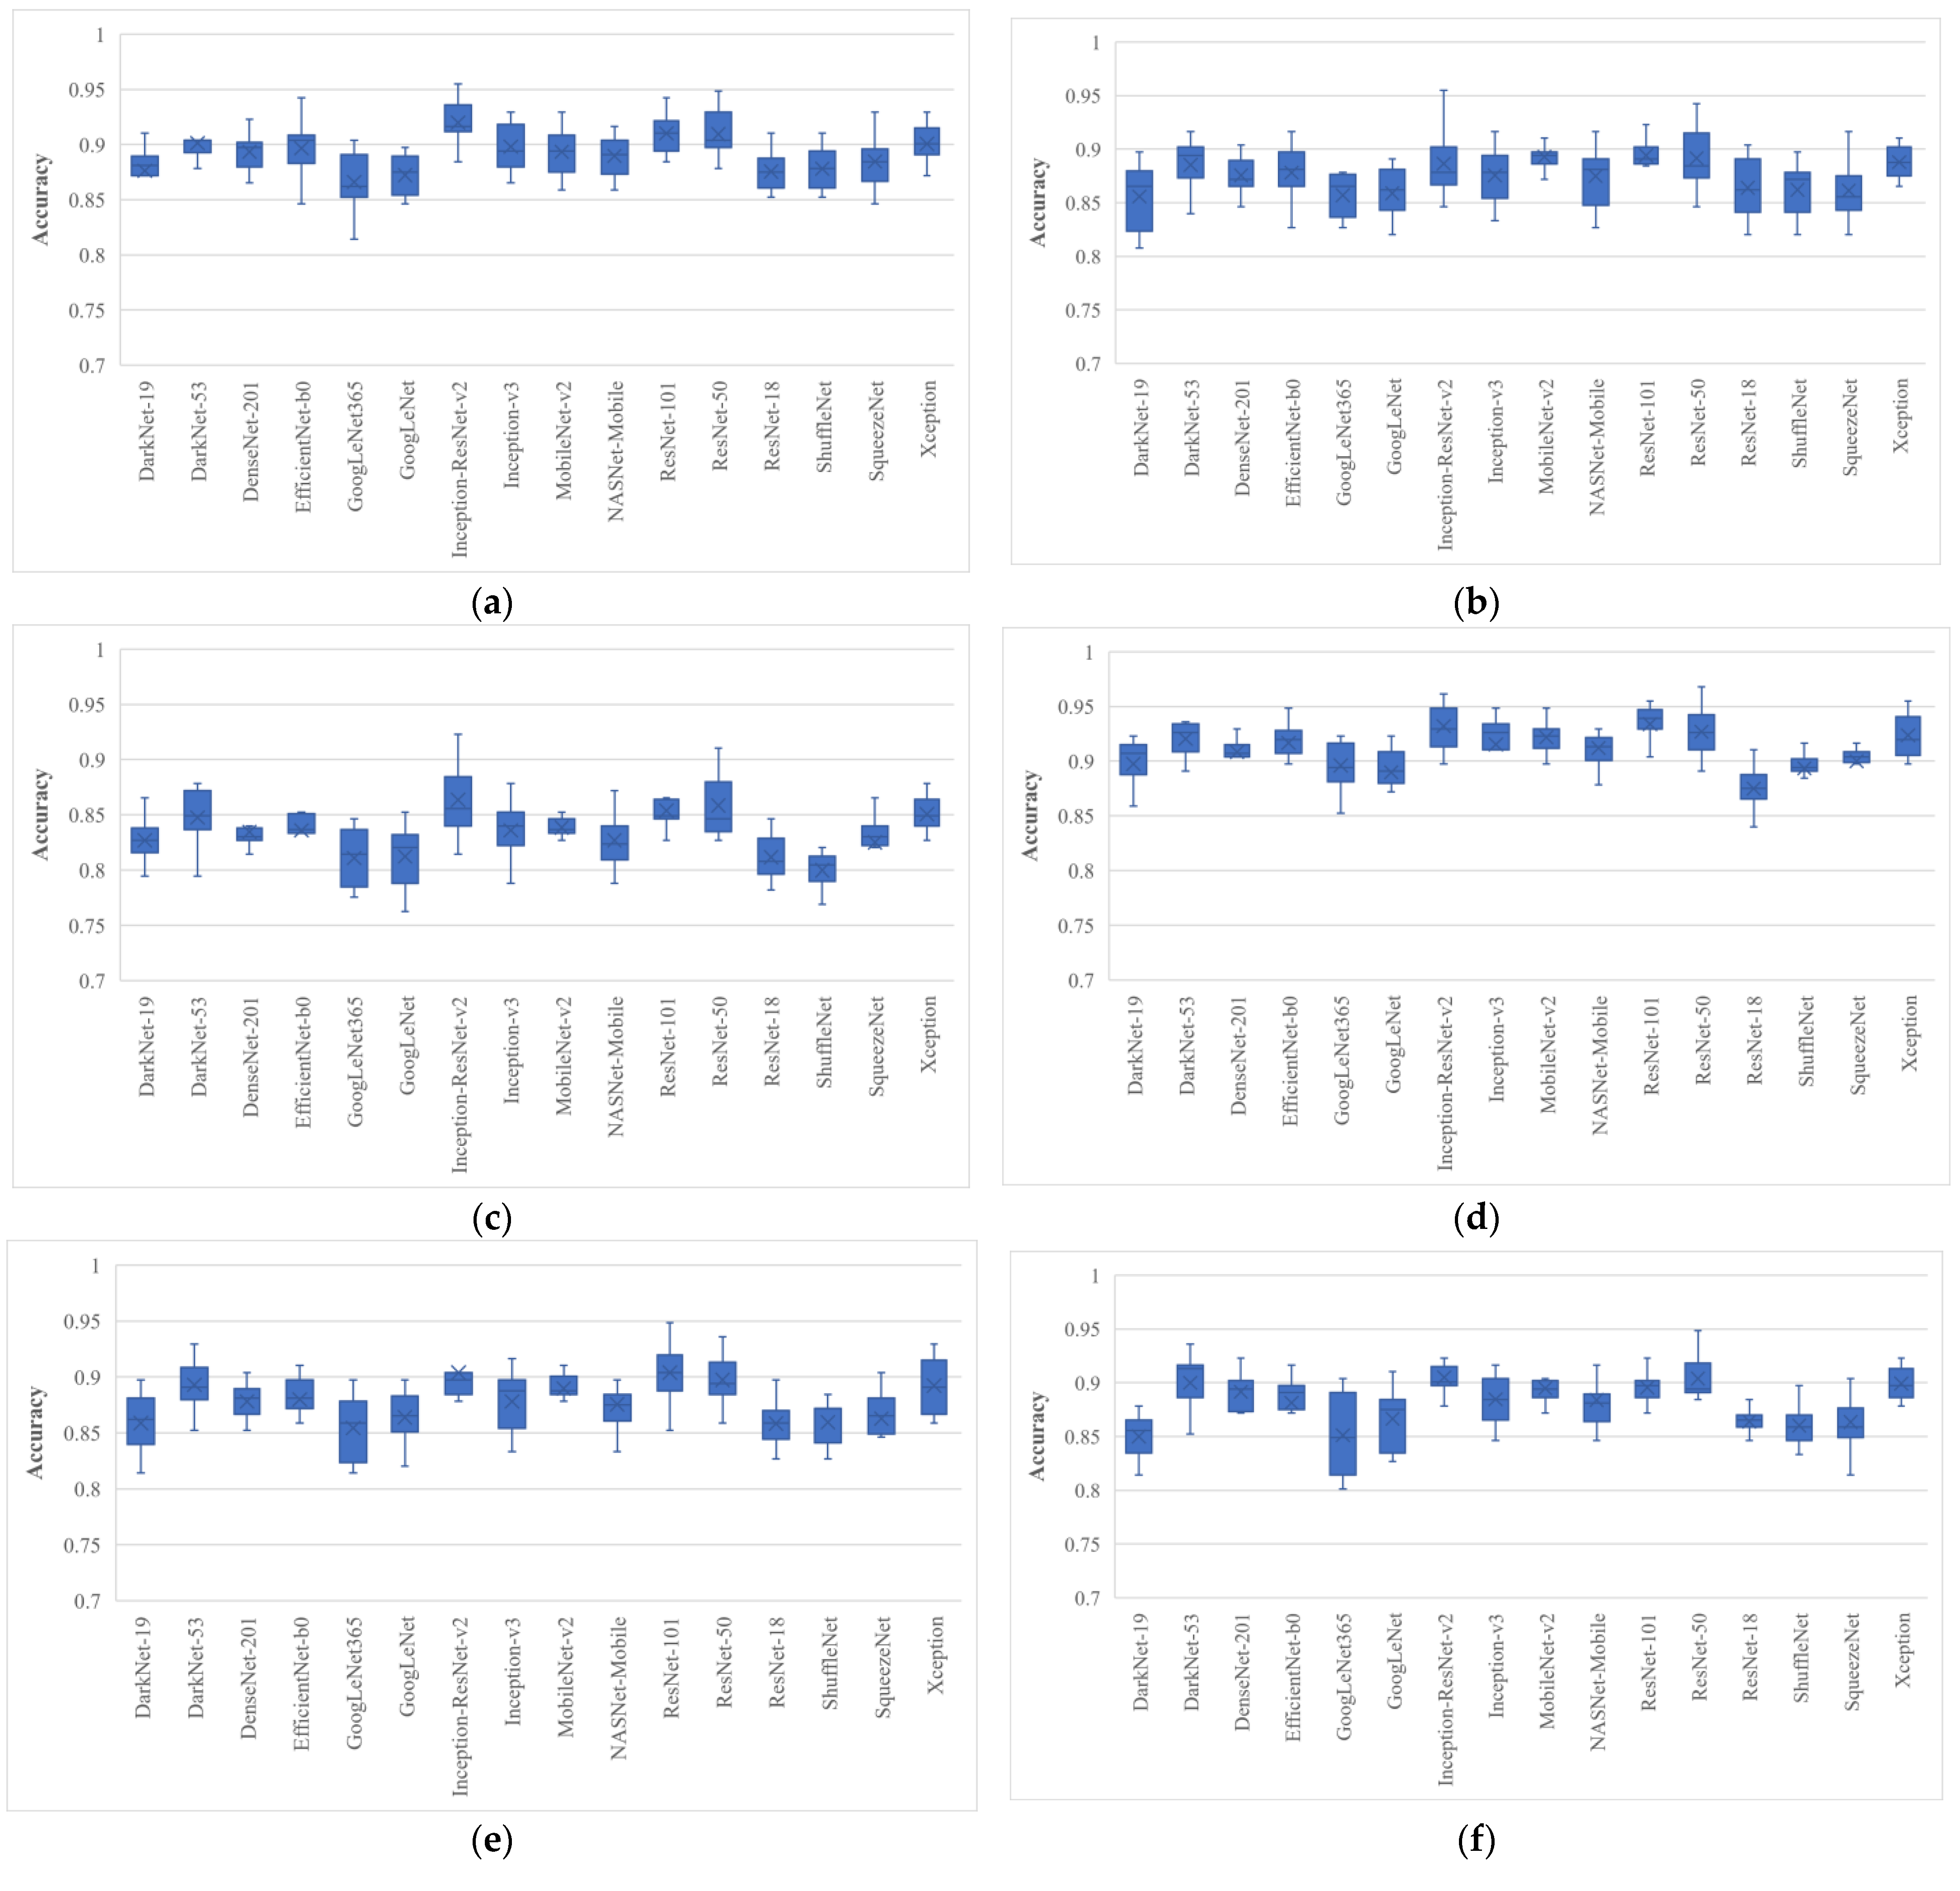
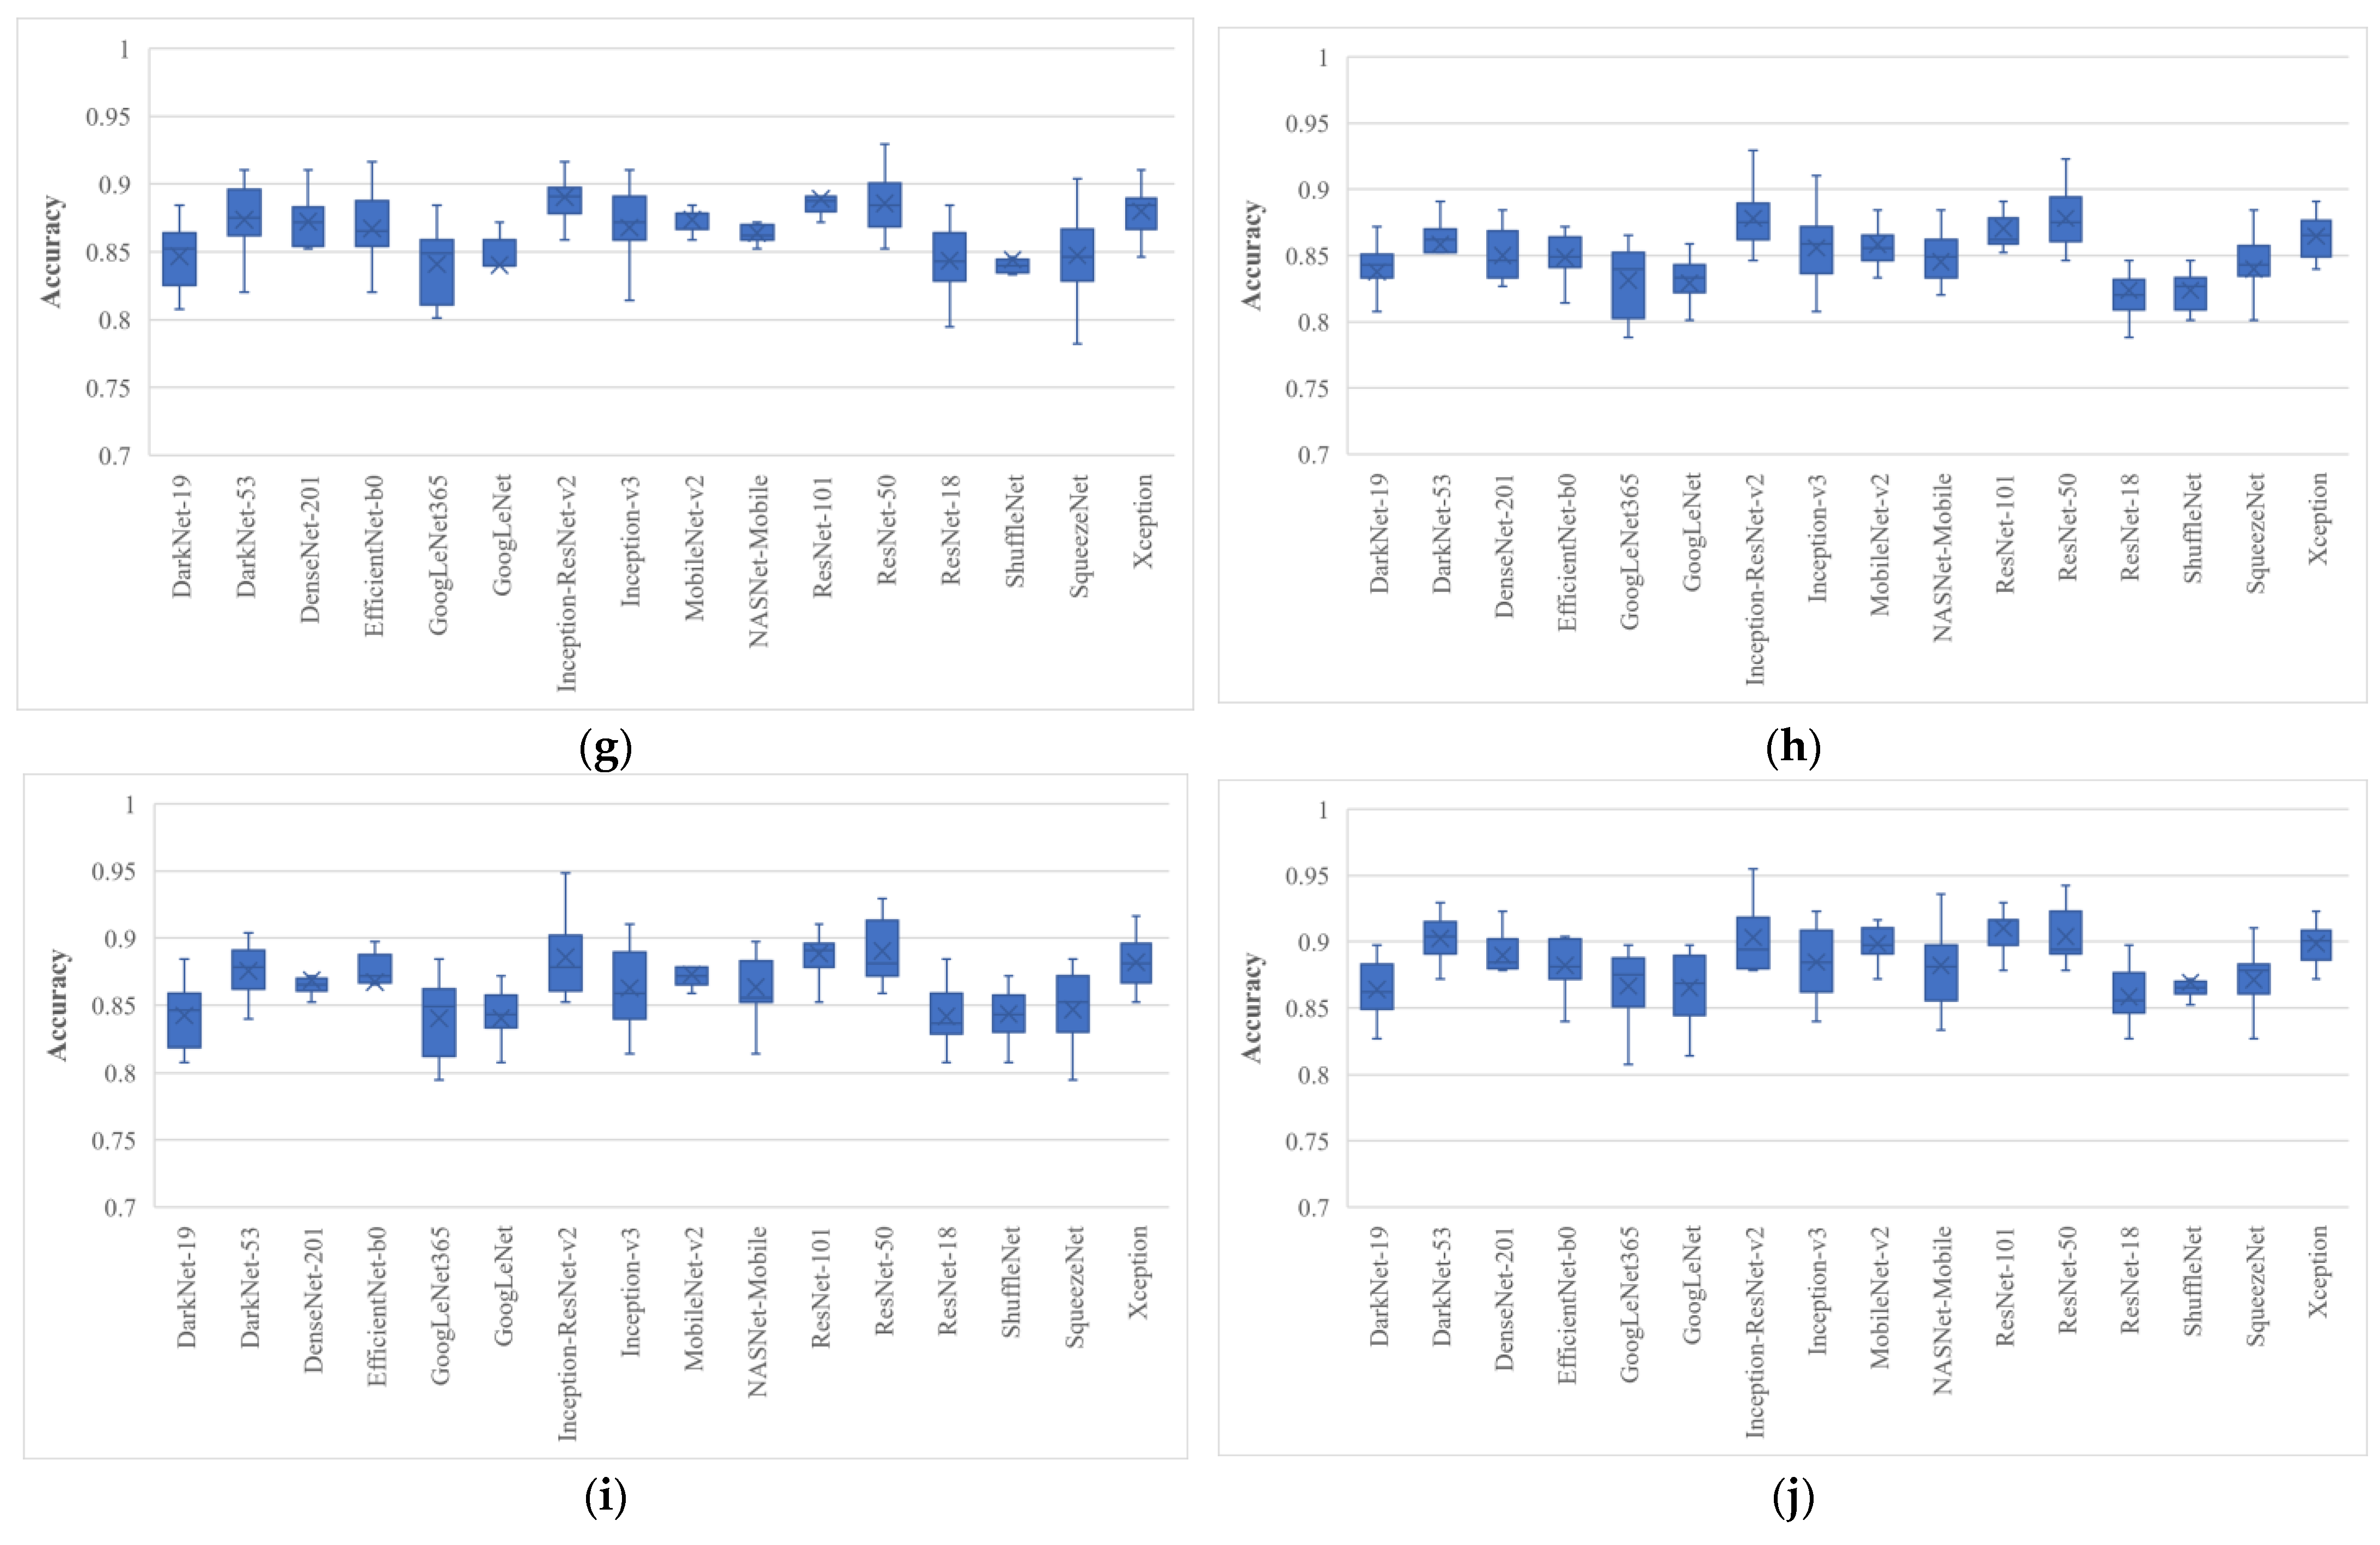
| Deep-Learning Network | MPA | GNDO | SMA | EO | MRFO | ASO | HHO | HGSO | PFA | PRO | Full Features |
|---|---|---|---|---|---|---|---|---|---|---|---|
| DarkNet-19 | 87.6 ± 2.8 | 85.6 ± 3.3 | 82.7 ± 2.1 | 89.7 ± 2.7 | 85.9 ± 3 | 85 ± 2.2 | 84.7 ± 2.6 | 83.8 ± 2.4 | 84.2 ± 2.5 | 86.4 ± 2.4 | 79 ± 3.2 |
| DarkNet-53 | 90.1 ± 1.7 | 88.5 ± 2.6 | 84.7 ± 2.8 | 92.1 ± 1.7 | 89.3 ± 2.5 | 90 ± 3.2 | 87.4 ± 2.8 | 85.8 ± 2.3 | 87.6 ± 2 | 90.3 ± 1.8 | 81.5 ± 2.7 |
| DenseNet-201 | 89.4 ± 1.7 | 87.6 ± 1.8 | 83.5 ± 1.8 | 90.8 ± 1.9 | 87.8 ± 1.8 | 89.2 ± 1.8 | 87.2 ± 1.9 | 85 ± 2.1 | 86.9 ± 1.3 | 89 ± 2.4 | 81 ± 2.2 |
| EfficientNet-b0 | 89.7 ± 2.9 | 87.8 ± 3.1 | 83.6 ± 3.3 | 91.7 ± 2.4 | 88 ± 2.5 | 88.1 ± 3 | 86.7 ± 3 | 84.9 ± 2.9 | 86.7 ± 3 | 88.2 ± 3.6 | 80.4 ± 3.5 |
| GoogLeNet365 | 86.6 ± 2.8 | 85.7 ± 2.2 | 81.1 ± 2.7 | 89.6 ± 2.3 | 85.4 ± 3.1 | 85.1 ± 4.1 | 84.1 ± 3 | 83.1 ± 2.9 | 84 ± 3.1 | 86.7 ± 2.9 | 77.8 ± 3.5 |
| GoogLeNet | 87.2 ± 2 | 85.9 ± 2.6 | 81.2 ± 3 | 89 ± 2.6 | 86.4 ± 2.6 | 86.7 ± 3.1 | 84 ± 2.6 | 82.9 ± 2.4 | 84 ± 2.7 | 86.5 ± 2.7 | 79 ± 3.7 |
| Inception-ResNet-v2 | 92 ± 2.2 | 88.7 ± 3.2 | 86.3 ± 3.4 | 94.2 ± 2.3 | 90.4 ± 2.7 | 90.5 ± 2.1 | 89 ± 2.2 | 87.8 ± 2.4 | 88.6 ± 3.1 | 90.3 ± 2.8 | 83.3 ± 2.8 |
| Inception-v3 | 89.8 ± 2.3 | 87.6 ± 2.8 | 83.6 ± 2.9 | 91.5 ± 2.9 | 87.8 ± 2.8 | 88.5 ± 2.4 | 86.8 ± 3.3 | 85.6 ± 3 | 86.3 ± 3.2 | 88.5 ± 2.9 | 80.4 ± 3.4 |
| MobileNet-v2 | 89.4 ± 2.2 | 89.3 ± 1.5 | 83.8 ± 1.8 | 92.2 ± 1.5 | 89 ± 1.6 | 89.5 ± 2.3 | 87.4 ± 1.4 | 85.8 ± 1.7 | 87.3 ± 1.3 | 89.9 ± 1.4 | 82 ± 1.5 |
| NASNet-Mobile | 89 ± 1.9 | 87.5 ± 3.1 | 82.7 ± 2.6 | 91.2 ± 2.2 | 87.6 ± 2.4 | 88.4 ± 2.8 | 86.4 ± 2.4 | 84.6 ± 2.8 | 86.3 ± 2.6 | 88.2 ± 3.4 | 79.4 ± 3.1 |
| ResNet-101 | 91 ± 1.8 | 89.4 ± 2 | 85.4 ± 1.8 | 93.4 ± 2 | 90.4 ± 2.7 | 89.6 ± 1.4 | 88.9 ± 2.5 | 87.1 ± 1.9 | 88.8 ± 2 | 91 ± 2.1 | 82.7 ± 2.5 |
| ResNet-50 | 91 ± 2.5 | 89.2 ± 2.9 | 85.8 ± 3 | 94.7 ± 2.5 | 89.7 ± 2.3 | 90.4 ± 2.1 | 88.6 ± 2.3 | 87.8 ± 2.4 | 89 ± 2.6 | 90.4 ± 2.2 | 84.2 ± 3.1 |
| ResNet-18 | 87.6 ± 1.9 | 86.4 ± 2.8 | 81.2 ± 2.2 | 87.5 ± 2.1 | 85.8 ± 2.1 | 86.4 ± 1.7 | 84.4 ± 2.9 | 82.4 ± 2.3 | 84.2 ± 2.5 | 85.8 ± 2.3 | 77.6 ± 3 |
| ShuffleNet | 87.8 ± 2 | 86.2 ± 2.7 | 80 ± 1.6 | 89.4 ± 1.7 | 86 ± 2.1 | 86 ± 2.2 | 84.4 ± 2.6 | 82.4 ± 1.5 | 84.4 ± 2.1 | 86.9 ± 1.7 | 76.9 ± 1.7 |
| SqueezeNet | 88.5 ± 2.6 | 86.2 ± 2.8 | 82.5 ± 2.9 | 90 ± 2.1 | 86.3 ± 3 | 86.3 ± 2.8 | 84.7 ± 3.6 | 84 ± 3.1 | 84.7 ± 3.3 | 87.1 ± 2.6 | 78.3 ± 4.6 |
| Xception | 90.1 ± 1.8 | 88.8 ± 1.6 | 85.1 ± 1.7 | 92.4 ± 2.3 | 89.2 ± 2.6 | 89.9 ± 1.6 | 88 ± 2 | 86.5 ± 1.7 | 88.2 ± 2.1 | 89.9 ± 1.8 | 82.4 ± 1.5 |
| Deep-Learning Network | MPA | GNDO | SMA | EO | MRFO | ASO | HHO | HGSO | PFA | PRO | Full Features |
|---|---|---|---|---|---|---|---|---|---|---|---|
| DarkNet-19 | 309 ± 128 | 481 ± 14 | 386 ± 172 | 257 ± 49 | 368 ± 155 | 489 ± 18 | 308 ± 95 | 192 ± 124 | 487 ± 21 | 341 ± 156 | 1000 ± 0 |
| DarkNet-53 | 425 ± 161 | 500 ± 15 | 374 ± 212 | 299 ± 57 | 491 ± 91 | 506 ± 15 | 502 ± 91 | 490 ± 158 | 498 ± 18 | 492 ± 29 | 1024 ± 0 |
| DenseNet-201 | 783 ± 245 | 939 ± 21 | 790 ± 342 | 636 ± 93 | 1055 ± 231 | 954 ± 20 | 1071 ± 194 | 1033 ± 173 | 955 ± 25 | 948 ± 26 | 1920 ± 0 |
| EfficientNet-b0 | 429 ± 130 | 612 ± 22 | 540 ± 222 | 391 ± 51 | 510 ± 163 | 637 ± 21 | 630 ± 150 | 500 ± 231 | 634 ± 22 | 618 ± 124 | 1280 ± 0 |
| GoogLeNet365 | 321 ± 135 | 490 ± 14 | 294 ± 222 | 240 ± 53 | 498 ± 153 | 506 ± 15 | 469 ± 244 | 244 ± 150 | 501 ± 13 | 401 ± 139 | 1024 ± 0 |
| GoogLeNet | 386 ± 122 | 505 ± 17 | 337 ± 234 | 319 ± 49 | 523 ± 112 | 505 ± 16 | 481 ± 156 | 468 ± 153 | 498 ± 21 | 396 ± 134 | 1024 ± 0 |
| Inception-ResNet-v2 | 405 ± 137 | 736 ± 19 | 500 ± 350 | 376 ± 62 | 567 ± 169 | 746 ± 20 | 529 ± 193 | 495 ± 203 | 753 ± 24 | 555 ± 216 | 1536 ± 0 |
| Inception-v3 | 462 ± 132 | 990 ± 20 | 587 ± 455 | 540 ± 173 | 831 ± 189 | 1011 ± 26 | 771 ± 352 | 659 ± 345 | 1014 ± 28 | 735 ± 278 | 2048 ± 0 |
| MobileNet-v2 | 533 ± 119 | 622 ± 18 | 527 ± 232 | 423 ± 59 | 633 ± 93 | 628 ± 15 | 650 ± 116 | 549 ± 237 | 634 ± 21 | 620 ± 16 | 1280 ± 0 |
| NASNet-Mobile | 357 ± 134 | 521 ± 10 | 361 ± 191 | 305 ± 75 | 511 ± 125 | 517 ± 11 | 396 ± 113 | 359 ± 206 | 522 ± 15 | 392 ± 184 | 1056 ± 0 |
| ResNet-101 | 698 ± 261 | 996 ± 16 | 770 ± 428 | 573 ± 123 | 990 ± 360 | 1019 ± 18 | 913 ± 176 | 774 ± 303 | 1006 ± 28 | 970 ± 199 | 2048 ± 0 |
| ResNet-50 | 737 ± 243 | 993 ± 30 | 789 ± 391 | 567 ± 46 | 968 ± 215 | 1005 ± 15 | 755 ± 286 | 857 ± 305 | 1014 ± 26 | 1016 ± 40 | 2048 ± 0 |
| ResNet-18 | 202 ± 70 | 251 ± 11 | 256 ± 6 | 153 ± 20 | 266 ± 50 | 254 ± 11 | 244 ± 47 | 207 ± 69 | 253 ± 9 | 250 ± 11 | 512 ± 0 |
| ShuffleNet | 171 ± 58 | 260 ± 16 | 173 ± 106 | 140 ± 31 | 278 ± 74 | 269 ± 13 | 259 ± 54 | 227 ± 80 | 269 ± 12 | 242 ± 67 | 544 ± 0 |
| SqueezeNet | 229 ± 90 | 477 ± 10 | 190 ± 215 | 249 ± 38 | 388 ± 97 | 490 ± 13 | 348 ± 156 | 322 ± 218 | 480 ± 13 | 360 ± 186 | 1000 ± 0 |
| Xception | 652 ± 186 | 999 ± 26 | 938 ± 227 | 584 ± 49 | 793 ± 142 | 999 ± 30 | 826 ± 119 | 843 ± 322 | 1022 ± 25 | 992 ± 38 | 2048 ± 0 |
| Reference | Classes | Accuracy (%) |
|---|---|---|
| Liao et al. [59] | Benign and Malignant | 92.95 |
| Huang et al. [60] | Benign and Malignant | 94.20 |
| Yu et al. [61] | Benign, Malignant, Normal | 95.74 |
| Moon et al. [62] | Benign, Malignant, Normal | 94.62 |
| Alduraibi [29] | Benign, Malignant, Normal | 94.57 |
| Eroğlu et al. [63] | Benign, Malignant, Normal | 95.6 |
| This study | Benign, Malignant, Normal | 96.79 |
Disclaimer/Publisher’s Note: The statements, opinions and data contained in all publications are solely those of the individual author(s) and contributor(s) and not of MDPI and/or the editor(s). MDPI and/or the editor(s) disclaim responsibility for any injury to people or property resulting from any ideas, methods, instructions or products referred to in the content. |
© 2023 by the authors. Licensee MDPI, Basel, Switzerland. This article is an open access article distributed under the terms and conditions of the Creative Commons Attribution (CC BY) license (https://creativecommons.org/licenses/by/4.0/).
Share and Cite
Zafar, A.; Tanveer, J.; Ali, M.U.; Lee, S.W. BU-DLNet: Breast Ultrasonography-Based Cancer Detection Using Deep-Learning Network Selection and Feature Optimization. Bioengineering 2023, 10, 825. https://0-doi-org.brum.beds.ac.uk/10.3390/bioengineering10070825
Zafar A, Tanveer J, Ali MU, Lee SW. BU-DLNet: Breast Ultrasonography-Based Cancer Detection Using Deep-Learning Network Selection and Feature Optimization. Bioengineering. 2023; 10(7):825. https://0-doi-org.brum.beds.ac.uk/10.3390/bioengineering10070825
Chicago/Turabian StyleZafar, Amad, Jawad Tanveer, Muhammad Umair Ali, and Seung Won Lee. 2023. "BU-DLNet: Breast Ultrasonography-Based Cancer Detection Using Deep-Learning Network Selection and Feature Optimization" Bioengineering 10, no. 7: 825. https://0-doi-org.brum.beds.ac.uk/10.3390/bioengineering10070825