
Diet Shift May Trigger LuxS/AI-2 Quorum Sensing in Rumen Bacteria


Jiangxi Province Key Laboratory of Animal Nutrition, Animal Nutrition and Feed Safety Innovation Team, College of Animal Science and Technology, Jiangxi Agricultural University, Nanchang 330045, China
*
Author to whom correspondence should be addressed.
Bioengineering 2022, 9(8), 379; https://0-doi-org.brum.beds.ac.uk/10.3390/bioengineering9080379
Submission received: 15 July 2022
/
Revised: 4 August 2022
/
Accepted: 6 August 2022
/
Published: 10 August 2022
(This article belongs to the Special Issue Strategies for the Efficient Development of Microbial Bioprocesses)
Abstract
:Recent studies have revealed that LuxS/AI-2 quorum sensing (QS) is the most universal cell-to-cell communication in rumen bacteria; however, it remains unknown how they respond to nutritional stress from a diet shift. This study aimed to explore whether a diet shift could trigger rumen bacterial LuxS/AI-2 QS and its influences on rumen fermentation characteristics and bacterial community diversity and composition. A total of fifteen Hu sheep were selected to undergo a pre-shift diet (Pre, concentrate to forage ratio 75:25) for one month and then abruptly switch to a post-shift diet (Post, concentrate to forage ratio 49:51). Results showed that the serum cortisol and immunoglobulin G concentrations were higher in Post than in Pre (p < 0.05). The microbial density, AI-2 concentration, biofilm formation, and the gene expression of ftsH were higher in Post when compared with Pre (p < 0.05), whilst the gene expression of luxS tended to be lower in Post (p = 0.054). The molar concentration of valerate and fermentation efficiency decreased after the diet shift, while the acetate to propionate ratio and the molar proportion of butyrate were higher in Post compared to Pre (p < 0.05). Moreover, the diet shift increased the richness of ruminal bacteria and the relative abundances of Roseburia, Prevotellaceae UCG-001, and Lachnospira, and decreased the relative abundances of Prevotella, Megasphaera, and Dialister (p < 0.05). A difference in trends was also observed in an analysis of similarity (R = 0.1208 and p = 0.064). This study suggests that a diet shift could trigger rumen bacterial LuxS/AI-2 QS by altering microbial density, AI-2 concentration, biofilm formation, and related gene expression, as well as affect the rumen fermentation pattern and bacterial community diversity and composition. This study may provide insight into a potential strategy for relieving nutritional stress via regulating bacterial communication.
1. Introduction
The complex community of rumen microbiota, including bacteria, protozoa, fungi, and archaea, contributes substantially to the powerful ability of ruminants in digesting plant materials into exploitable nutrients [1]. Rumen bacteria have been regarded as the most diverse microbial community and have been studied extensively over the past decades [2,3,4], especially when next-generation sequencing technologies coupled with “omics” approaches became available and popular. These studies mainly focused on the interactions of diet–microbe, host–microbe, and environment–microbe [1,5,6]. However, ruminal bacteria are generally cooperative in the microbial fermentation of carbohydrates, with bacterial species contributing uniquely to maintaining normal and ecological balance [1,7]. Therefore, a deep understanding of the bacteria–bacteria network is urgently required to generate potential strategies for improving the productivity of ruminants.
Quorum sensing (QS) is a cell-to-cell communication mediated by signal molecules to regulate their phenotypes, such as biofilm formation, motility, and virulence [8,9]. The signal molecules include acyl-homoserine lactones (AHLs), autoinducer peptides (AIPs), and autoinducer-2 (AI-2), which are primarily secreted by gram-negative bacteria, gram-positive bacteria, and both gram-positive and gram-negative bacteria, respectively [10]. Moreover, the signal molecule AI-2 was proposed to be the universal language for interspecies communication [9]. Once the concentration of signal molecules secreted by bacteria reaches its threshold, other bacteria will sense the change and facilitate cooperative defense against an unfavorable environment via altering gene expression and phenotype [10]. Therefore, the QS system is actually a self-defense strategy to enhance bacterial adaptability and survival to the various habitat. Numerous studies have reported on bacteria-to-bacteria communication from a single species (e.g., Escherichia coli, Salmonella typhimurium, and Vibrio harveyi) of non-ruminant origin [11,12,13]; however, these communications in the rumen microbiome are limited. Since Erickson et al. [14] detected AHLs in ruminal contents, many reports have revealed the existence of AHLs in rumen bacteria [12,15,16]. Data from expression levels in rumen metatranscriptome datasets showed that LuxS/AI-2 QS was the most abundant in the rumen, and the genus of Prevotella expressed the highest LuxS synthase [17]. Similar data from rumen microbial metagenomics also revealed that AI-2-mediated QS system may participate in biofilm formation and fiber degradation [8]. However, Ran et al. [10] detected the presence of the gene luxS, but not the AI-2 signaling molecules, both in vivo and in vitro, probably due to the limitations of detection techniques or pre-adapted diets. Environmental changes, such as initial pH, carbon sources, and glucose concentration, were reported to stimulate AI-2 production and luxS transcription [18]. These results indicated that bacterial LuxS/AI-2 QS may be opportunistic in rumens of ruminants.
A modern ruminant production system generally involves several growth or finishing stages, and each stage requires a unique nutritional feeding strategy to meet its requirement for maintenance and production [19]. A diet shift is the most popular manner in which to adjust a feeding strategy, and a rapid shift leads to a perturbed microbial community, reduced performance, and poor host immune response [20,21]. Many reports have revealed the strong associations between improved host health and production and stable ruminal microbiomes [20,22]. Therefore, less time to achieve the stability of microbiomes will improve host productivity, and the regulation of ruminal bacteria communications, such as QS, may be a potential strategy for shortening the adaptation time before stability.
This study attempted to uncover the possibility of a diet shift on the triggering of LuxS/AI-2 QS, and provide further insight into a new strategy for relieving stress upon a diet shift. We hypothesized that a diet shift would trigger the LuxS/AI-2 QS of rumen bacteria, and that cooperative behavior would be activated to fight against adversity due to the dietary shift.
2. Materials and Methods
2.1. Animals and Experimental Design
This experiment was conducted at the test site of Jiangxi Agricultural University. All animal care and welfare guidelines were strictly followed from the Committee for the Care and Use of Experimental Animals at Jiangxi Agricultural University (JXAULL-2021036). A total of fifteen Hu sheep, with average body weight of 16.03 ± 0.55 kg and age of 3.09 ± 0.16 months, were selected to undergo a diet shift. The pre-shifted diet (Pre, concentrate to forage ratio 75:25) was the routine diet for feeding these sheep for one month, and the post-shifted diet (Post, concentrate to forage ratio 49:51) was another popular ration for growing sheep in China according to the Chinese Feeding Standard of Sheep (NY/T816-2004). Both Pre and Post diets were designed with a similar metabolic energy (ME) to crude protein (CP) ratio of 0.068 MJ/g to avoid extra effects due to energy or protein balance. The ingredient and chemical composition of these two diets are shown in Table 1. All animals were fed twice a day at 7:30 and 17:30, and approximately 10% feed residues were kept for them to allow ad libitum. Round-the-clock fresh water was provided for the tested sheep and they suffered from no other stress except for the diet shift.
2.2. Sample Collection
Samples from each sheep were collected the day before the diet shift and the day after the diet shift. Blood samples were collected from jugular vein by means of vacuum vasculature without anticoagulant before morning feeding, and the serum was obtained by centrifuging blood samples at the speed of 3000 rpm/min for 20 min. Rumen contents, including both liquid and solid fractions, were collected before morning feeding using the esophageal tubing method as described by Paz et al. [23]. The rumen pH was determined after the rumen contents were removed using a portable pH meter (Testo 206, Testo AG, Schwarzwald, Germany). The rumen fluid was then obtained by filtering rumen contents through four layers of gauze, and these samples were stored at −80 °C and used for both DNA and RNA extraction and for rumen fermentation characteristics determination.
2.3. RNA Extraction, LuxS/AI-2 Quorum Sensing, and Biofilm Formation Assay
The method of TRIzol extraction after bead beating was taken to extract the RNA of rumen fluid as Kang et al. [24] described, as they reported that this method yielded higher quantity and quality of rumen bacterial RNA when compared with the traditional method using phenol/chloroform. The concentration and purity of extracted RNA were determined by an ultrafine spectrophotometer (NanoDrop 2000, Thermo Fisher Scientific, Waltham, MA, USA), and all RNA samples were diluted to 200 ng/µL to perform the following reverse transcription to obtain cDNA. The genus of Prevotella was selected as the target bacteria, as a recent metatranscriptome dataset analysis revealed that Prevotella expressed the highest level of LuxS synthase [17]. The luxS and ftsH of Prevotella were the target genes for LuxS/AI-2 QS and biofilm formation, respectively, and the 16S rRNA was used as the reference gene. The detailed primer information is listed in Table 2. A real-time quantitative PCR was performed in a CFX96 Touch Real-Time PCR Detection System (Bio-Rad Laboratories, Inc., Hercules, CA, USA), and each sample was conducted in triplicate. The relative expressions of target genes were calculated by the method of [25].
Ruminal bacteria density was expressed as the absorbance at the wavelength of 595 nm (OD595) after centrifuging at 10,000× g for 5 min [26]. The AI-2 concentration was quantified with the colorimetric method developed by Wattanavanitchakorn et al. [27]. In brief, the supernatant of rumen fluid was obtained by centrifugation at 12,000× g for 10 min and was then filtered through 0.45 µm and 0.22 µm membrane in sequence. The filtered supernatant was mixed evenly with Fe (III)—1, 10-phenanthroline reagent in equal volume, and then the mixture was left to stand for 1 min to allow a complete chromogenic reaction. Absorbance of colored [(o-phen)3 Fe(II)]SO4 ferroin complex was detected within 3 min at a wavelength of 510 nm using an absorbance microplate reader (SpectraMax 190, Molecular Devices, San Jose, CA, USA). The standard curve was drawn using ascorbic acid with the same procedures as mentioned above, with 20 µM ascorbic acid as the positive control and the deionized distilled water as the negative control. Biofilm formation assay was performed with the crystal violet staining method as described in Gu et al. [26] wherein methanol, crystal violet, and ethanol were used as fixative, stain, and decolouration, respectively. The extracellular polymeric substances were extracted following the method described by Gu et al. [26]. The amount of exopolysaccharide was determined using the phenol-sulfuric acid method with glucose as the standard [28], and the extracellular protein was measured by the Lowry method [29].
2.4. Serum Indicators and Rumen Volatile Fatty Acids Determination
Serum parameters included glucose, cortisol, and immunoglobulin G (Ig G), which are indicators of energy metabolism, stress status, and immunocompetence, respectively. The concentration of glucose was measured using the glucose oxidase method by an automatic biochemical analyzer (HITACHI7170, Hitachi Limited, Kokyo, Japan). The serum cortisol and Ig G concentrations were detected by their corresponding commercial kits manufactured by the Beijing Sinouk Institute of Biological Technology (Beijing, China). Volatile fatty acids (VFA) determined in this study included acetate, propionate, isobutyrate, butyrate, isovalerate, and valerate, and the sum of isobutyrate, isovalerate, and valerate was defined as branched chain volatile fatty acids (BCVFA). The identification and concentration of each individual VFA referred to the relative retention time and peak area of the standard curve, respectively. Both the standard curve and sample determination were performed by a gas chromatograph (GC-2014 Shimadzu Corporation, Kyoto, Japan) with nitrogen as the carrier gas, and the injection volume and injector temperature were kept at 0.4 µL and 220 °C, respectively. The oven procedure was the same as Qiu et al. [30]. Rumen fermentation patterns were indicated by the acetate to propionate ratio, non-glucogenic to glucogenic acids ratio (NGR), and fermentation efficiency. NGR was calculated as (C2 + 2 × C4 + C5)/(C3 + C5) and fermentation efficiency was expressed as (0.622 × C2 + 1.092 × C3 + 1.56 × C4)/(C2 + C3 + 2 × C4), where C2, C3, C4, and C5 indicate acetate, propionate, butyrate, and valerate, respectively [31].
2.5. DNA Extraction, Sequencing, and Data Analysis
A total of sixteen rumen fluid samples, with eight before the diet shift (homogeneously mixing the first sample (S1) and the last sample (S15), the second sample (S2) and the penult sample (S14), …, S7 and S9, single S8) and eight after diet shift (the same mixture method as the former), were extracted using a bacterial DNA Kit (OMEGA, Omega Bio-Tek, Norcross, GA, USA) with special caution taken to follow the manufacture’s instruction. The purity of extracted DNA was checked on 1% agarose gels, and quality and concentration were evaluated by a Qubit 2.0 Fluorometer (Life Technologies, Carlsbad, CA, USA). The bacterial V3 to V4 regions were amplified with barcoded primers as follows: 338F (5′-ACTCCTACGGGAGGCAGCAG-3′) and 806R (5′-GGACTACNNGGGTATCTAAT-3′). The PCR reaction system and amplification program were the same as Qiu et al. [32] described. Each sample was performed in triplicate, and PCR products were checked on 1% agarose gels and purified using an Agencourt AMPure XP Kit (Beckman, Brea, CA, USA). High throughput sequencing was performed on Illumina Miseq PE300 platform by Allwegene Gene Technology Co., Ltd. (Nanjing, China), and paired-end reads were generated for the subsequent data analysis.
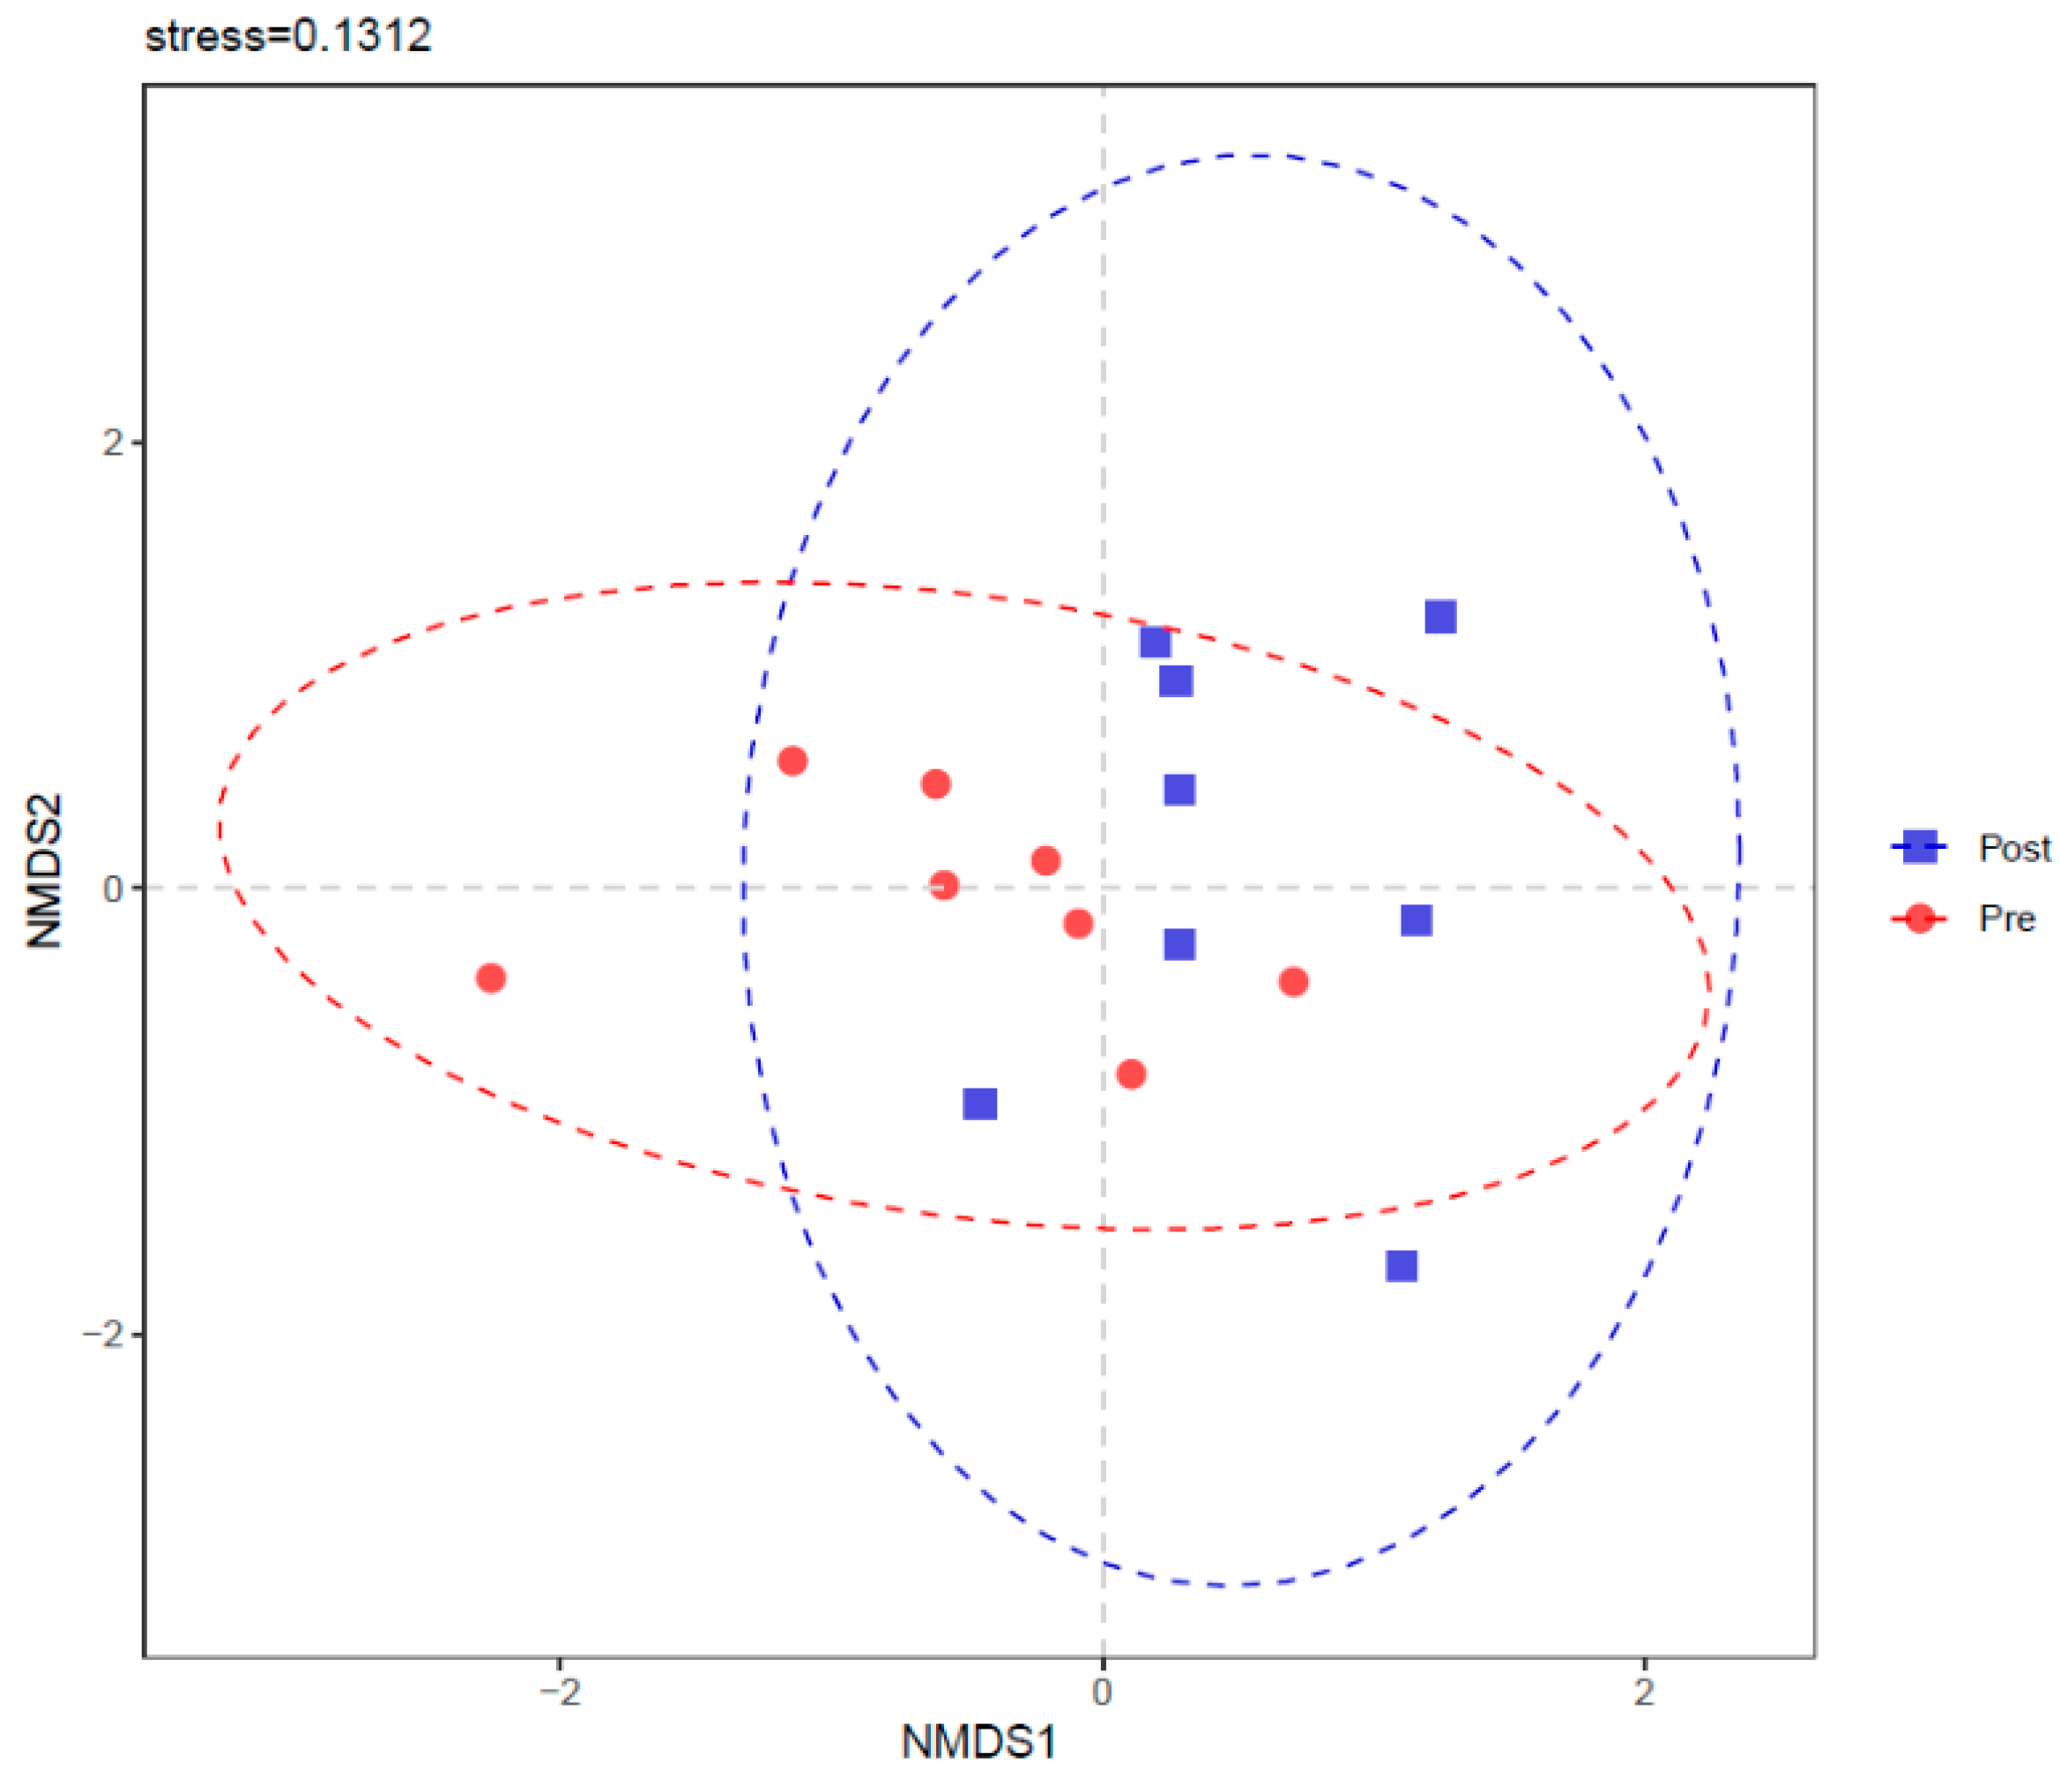
Sequencing data were analyzed using QIIME 2 (https://qiime2.org/, accessed on 5 May 2022, [33]). The raw data were removed if they met one of the following criteria: sequences length less than 250 bp or greater than 500 bp; evaluated quality score below 20; and containing ambiguous bases or not exactly matching to primer sequences and barcode. The filtered data were merged into tags by paired-end reAd mergeR (PEAR, v0.9.6, [34]) software, where the minimum overlap and the mismatch rate were set to 10 bp and 0.10, respectively. Qualified tags were denoised into amplicon sequence variants (ASVs) by means of the Deblur algorithm of QIIME 2. Taxonomic classifications for each ASV were obtained using the Ribosomal Database Project (RDP) Classifier tool with a confidence threshold of 0.70, wherein the database of bacterial SILVA 132 was taken to be assigned against. Alpha diversity metrics, including Chao 1, observed species, phylogenetic diversity (PD) whole tree, Shannon index, and Simpson index, were calculated to evaluate the richness and evenness of each sample, and were finished by QIIME 2 based on ASV information. Principal coordinates analysis (PCoA) and non-metric multidimensional scaling (NMDS) were performed to show the differences or similarities between Pre and Post based on Bray–Curtis distances. Analysis of similarity (ANOSIM) was conducted to reveal the similarities between Pre and Post using the vegan package in the R software.
2.6. Statistical Analysis
After the confirmation of normal distribution using the Shapiro–Wilk test, all data involved in this study were analyzed using the paired sample t-test of SPSS (version 20, IBM Corporation, Armonk, NY, USA). Significant difference was declared at 0.05 (p < 0.05), and a trend was introduced if p value was between 0.05 and 0.10 (0.05 ≤ p < 0.10).
3. Results
3.1. Serum Biochemical, Immune, and Hormonal Indicators
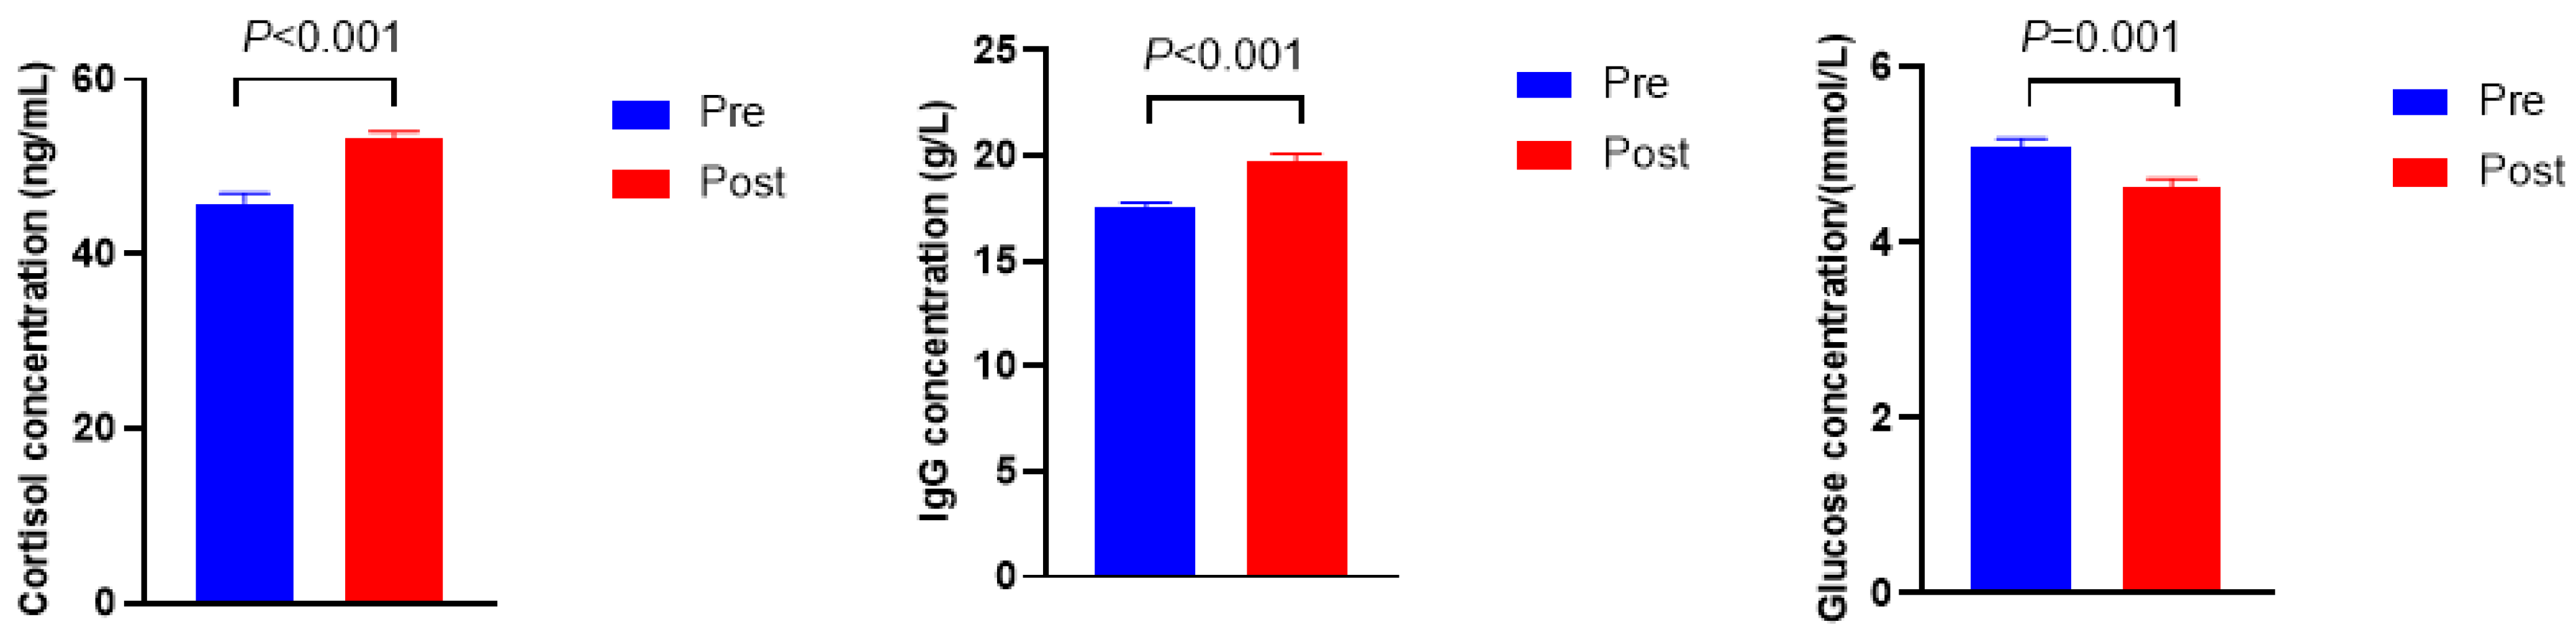
As shown in Figure 1, the cortisol and immunoglobulin G (Ig G) concentrations were higher in Post when compared with Pre (p < 0.001), whereas the concentration of glucose was lower in Post than in Pre (p = 0.001).
3.2. AI-2 Concentration and luxS Gene Expression
The AI-2 activity and luxS gene expression are shown in Figure 2. The concentration of AI-2 was higher in Post than in Pre (p = 0.024). Moreover, the expression of the luxS gene tended to be lower in Post when compared with Pre (p = 0.054).
3.3. Microbial Density, Biofilm Formation, ftsH Gene Expression, and Extracellular Polymeric Substances Composition
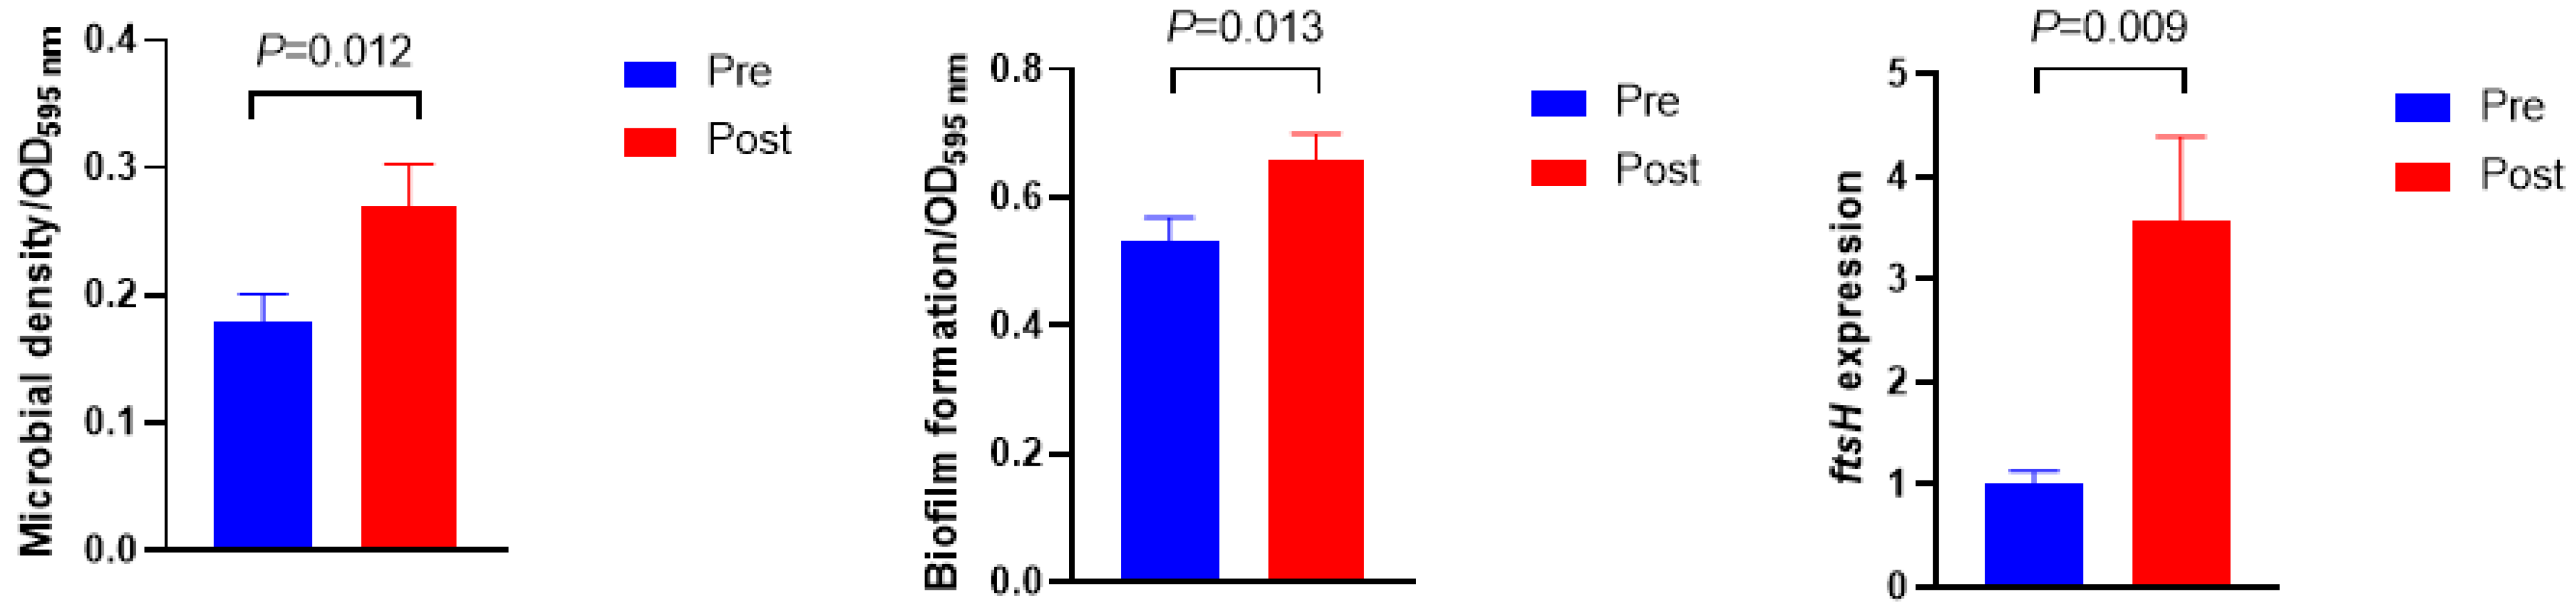
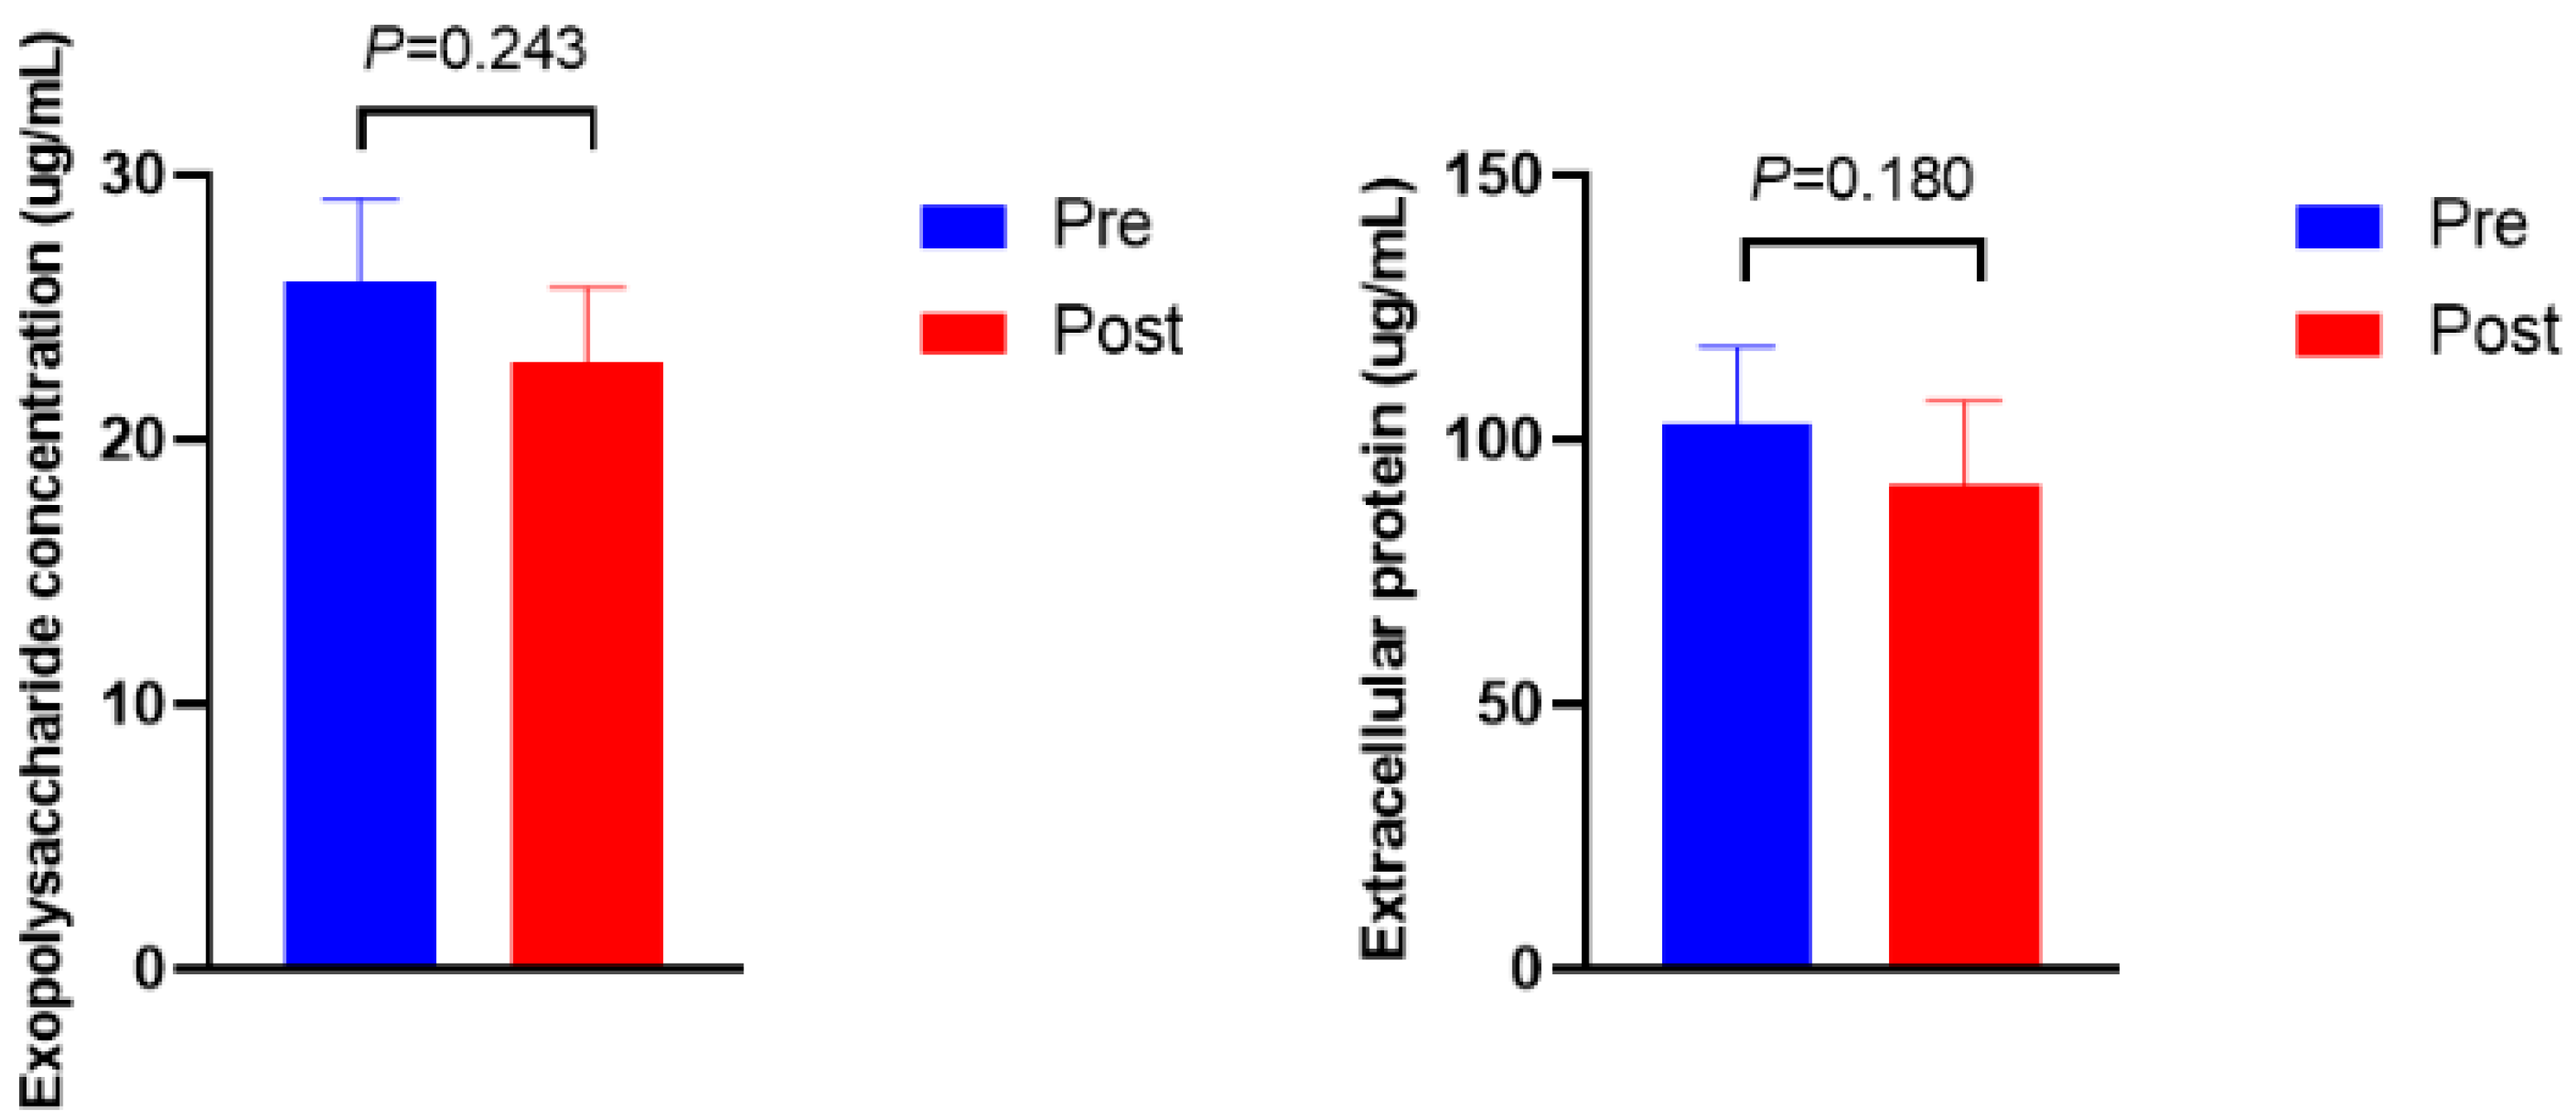
Figure 3 shows the microbial density, biofilm formation, and ftsH gene expression. The microbial density and biofilm formation were higher in Post than in Pre (p = 0.012 and p = 0.013, respectively). The expression of the ftsH gene in Post was 3.5-fold higher than in Pre (p = 0.009). No significant differences were observed in the exopolysaccharide and protein concentrations of extracellular polymeric substances (Figure 4, p > 0.10).
3.4. Rumen Fermentation Characteristics
Rumen fermentation characteristics before and after the diet shift are presented in Table 3. The molar concentration of valerate was lower in Post than in Pre (p = 0.049). The acetate to propionate ratio and NGR were found to be higher in Post, whereas fermentation efficiency decreased after the diet shift (p < 0.05). The molar proportions of propionate and valerate were lower in Post compared to Pre, whilst the former showed an increased butyrate proportion (p < 0.05). The molar concentration and proportion of BCVFA tended to be higher in Pre than in Post (p = 0.092 and p = 0.072, respectively).
3.5. Rumen Bacterial Diversity and Community Structure
The alpha diversity metrics before and after the diet shift are shown in Table 4. Chao 1, observed species, and PD whole tree were higher in Post when compared with Pre (p < 0.05). No significant differences were observed in the Shannon index and Simpson index between Pre and Post (p > 0.10).
As shown in Table 5, eight phyla were found with a relative abundance greater than 0.10%. The abundance of Actinobacteriota in Pre tended to be higher than in Post (p = 0.059), whereas other phyla showed no differences between Pre and Post (p > 0.10).
A total of nineteen genera were observed with a relative abundance above 0.50% (Table 6). The relative abundance of Prevotella, Megasphaera, and Dialister were higher in Pre than in Post (p < 0.05), whereas Roseburia, Prevotellaceae UCG-001, and Lachnospira abundances were higher in Post when compared with Pre (p < 0.05). The relative abundance of Acetitomaculum in Pre tended to be higher compared to Post (p = 0.072).
4. Discussion
When the dietary concentrate to forage ratio shifted abruptly from 75:25 to 49:51, serum physicochemical characteristics changed accordingly. As a sensitive hormonal indicator of stress, the level of cortisol increases remarkably by activating the hypothalamic–pituitary–adrenocortical (HPA) axis when animals and humans suffer from stressors [35]. A higher concentration of cortisol indicated that the diet shift caused stress successfully. It is widely known that, once stress occurs, the body initiates an immune response to withstand adversity stress. As the main immunoglobulin class among five distinct immunoglobulins, Ig G plays a decisive role in maintaining normal life [36]. This study found that the concentration of Ig G increased after the diet shift, indicating that a defensive response was activated to fight against nutritional stress. Glucose concentration is a critical indicator for energy metabolism, and its value increased with greater intake of digestible energy or more concentrate [37,38]. The serum glucose before the diet shift showed higher levels, which could be attributed to the higher density of energy in Pre when compared with the energy density in Post. Another possible explanation for the lower concentration of glucose in Post would be the fact that glucose could be synthesized from rumen propionate via hepatic gluconeogenesis [39], because numerically higher molar concentration and higher molar proportion of propionate were observed in Pre.
As the primary QS in rumen bacteria revealed by both metagenomics and metatranscriptome dataset analysis, LuxS/AI-2 QS plays a vital role in the interspecies communication of rumen bacteria [8,17]. AI-2 is the core and featured signaling molecule in LuxS/AI-2 QS system, and its concentration could be perceived by bacteria to coordinate collective behavior, such as cell density and biofilm formation [8,9]. In the current study, the concentration of AI-2 increased after the diet shift; meanwhile, increased microbial density and more biofilm formation were observed, indicating that bacteria had exhibited collective behaviors when the signaling molecule concentration reached its threshold to defend against the abrupt diet shift. These phenotype variations were regulated by their corresponding gene expressions, namely luxS for AI-2 synthesis and ftsH for biofilm formation. The gene luxS encodes autoinducer 2 synthase (LuxS), which is responsible for the synthesis of AI-2 [8,17]. The sequences of the luxS gene were found to be abundant in Prevotella, Butyrivibrio, Ruminococcus, Pseudobutyrivibrio, and Eubacterium [8,17]. In this study, a decline in the trend of luxS gene expression was observed in Prevotella after the diet shift even with a higher AI-2 concentration, probably due to the uncharacterized relationships between diverse luxS-containing bacteria and AI-2 secretion [26]. Another possible explanation for the inconsistent results is that they may be attributed to the lower serum glucose in Post, because a previous study found that the level of luxS-mRNA decreased when deficient glucose was supplied to Streptococcus bovis [40]. Biofilm is a complex three-dimensional structure of bacterial aggregates, mainly composed of polysaccharides, proteins, nucleic acids, and lipids [41,42]. Its existence proved more resistant to stress when compared with its planktonic counterpart, and mixed-species biofilm exhibited more resistance to environmental stress than single-species biofilm [42,43]. The gene ftsH was proposed to be involved in biofilm formation to protect against stress, and its mutant strain showed a reduced biofilm formation capacity [44]. Higher gene expression of ftsH, as well as more biofilm formation, was observed in Post when compared with Pre, indicating that the diet shift stimulated more biofilm formation via up-regulating the gene expression of ftsH. However, extracellular polysaccharide and protein concentrations did not show a significant difference in rumen fluid between Pre and Post, which is probably due to the distinct development, structure, and function of biofilm between mixed species and single species [43]. This study revealed a positive association between AI-2 concentration and biofilm formation, which is in line with previous reports [26,45]. Moreover, the current results also revealed that the ftsH gene was more sensitive to the diet shift than to the luxS gene, indicating that biofilm formation may be prioritized over AI-2 synthesis when undergoing a diet shift. These results suggest that the diet shift triggered rumen bacterial LuxS/AI-2 QS, and ruminal bacteria cooperated together to defend against the diet shift by improving microbial density, AI-2 synthesis, and biofilm formation.
The diet shift altered ruminal fermentation patterns and efficiency, but did not affect the absolute concentrations of VFA and individual VFA, except for valerate. Generally, VFA is considered as the primary energy utilization form of ruminants, and a higher NGR indicates a lower FE of dietary energy from carbohydrates to VFA [31]. In this study, higher NGR and lower FE were observed after the diet shift, indicating that the diet shift impeded rumen fermentation. Liu et al. [46] reported that an increase in dietary concentrate feeding yields a higher concentration of valerate; similar results were observed for the valerate concentration of Post regarding both concentration and proportion, probably due to the reduction in dietary concentrates in Post. It is easy to explain why Post showed a decreased proportion of propionate and a higher acetate to propionate ratio because of the well-established theory that structural carbohydrates produce more acetate and less propionate when compared with non-structural carbohydrates [47]. A higher proportion of butyrate was found in Post, which is inconsistent with previous reports that a high-density diet produced more butyrate [32]; this is probably explained by the fact that the VFA of Pre decreased faster due to its high-grain composition [48]. Branched-chain volatile fatty acids, including isobuyrate, valerate, and isovalerate, are the main products of crude protein degradation and are commonly used to monitor protein fermentation [49]. Therefore, it is reasonable to expect the increments in the trend of concentration and proportion of BCVFA in Pre when compared with Post due to differences in dietary crude protein (16.14% vs. 14.12%).
The diet shift altered the rumen bacterial richness, which was indicated by Chao 1 and observed species. A previous study revealed that a high-density diet decreased ruminal bacteria richness and evenness [32], and the current study found similar results, since the dietary energy and protein in Pre were higher than in Post. Zhao et al. [50] reported higher Actinobacteriota abundance when the concentration of oxygen decreased, probably explaining the trending decline of this phylum in Post because more roughage could carry more oxygen into the rumen [51]. The genus Prevotella is involved in fermenting starch and degrading protein [52], which partly explains its higher abundance in Pre due to its higher dietary protein and energy density. However, as a genus belonging to the family Prevotellaceae, Prevotellaceae UCG-001 showed opposing results to Prevotella, indicating not all genera in the same family share similar responses to dietary change. Scott et al. [53] reported that Roseburia was identified as a producer of butyrate, and the current results revealed a higher abundance of this genus in Post, which corresponded well to the higher molar proportion of buyrate in Post. Megasphaera is a predominant gram-negative commonly found in the rumens of cattle fed high-grain diets [54], and its main function is to ferment lactate into acetate and propionate [55]. Therefore, it is expected that the higher abundance of Megasphaera was observed in Pre because of the high dietary concentrate to forage ratio. Similar to Megasphaera, Dialister possesses the capability of utilizing simple sugar [56], probably providing evidence for the higher abundance of this genus in Pre due to the higher content of non-structure carbohydrates. The family Lachnospiraceae is commonly isolated from the rumens of cattle fed high-fiber diets and plays a vital role in facilitating forage degradation [57], and Liu et al. [58] found higher abundances of genera in this family when goats were fed an all-forage diet. These findings explain the current higher abundance of Lachnospira in Post because sheep in this treatment received more fiber (Table 1).
5. Conclusions
Taken together, the diet shift increased the concentrations of serum cortisol and Ig G, rumen AI-2 concentration, microbial density, biofilm formation, and the gene expression of ftsH. The diet shift also affected the rumen fermentation pattern by increasing the acetate to propionate ratio, decreasing fermentation efficiency, and altering molar proportions of propionate, butyrate, and valerate. Moreover, the diet shift altered the richness of the rumen bacterial community and some of the bacteria at the level of phylum or genus. This study suggests that a diet shift could trigger rumen bacterial LuxS/AI-2 QS by altering microbial density, AI-2 concentration, biofilm formation, and related gene expression, as well as affect the rumen fermentation pattern and bacterial diversity and community composition. This study may provide insight into a potential strategy for relieving nutritional stress via regulating bacterial communication.
Author Contributions
Conceptualization, Q.Q.; data curation, X.W. and T.L.; formal analysis, Q.Q. and Y.L.; methodology, Q.Q., X.W. and T.L.; validation, Q.Q., X.W. and T.L.; investigation, Q.Q., X.W. and T.L.; writing—original draft, Q.Q.; writing—review and editing, Q.Q., X.W., T.L., Y.L. and K.O. All authors have read and agreed to the published version of the manuscript.
Funding
This research was funded by the Science and Technology Project of the Education Department of Jiangxi Province, GJJ210405; National Natural Science Foundation of China, 32160807; Major Discipline Academic and Technical Leaders Training Program of Jiangxi Province, 20213BCJL22043; Jiangxi Agriculture Research System, JXARS-13; and China Agriculture Research System of MOF and MARA, CARS-37.
Institutional Review Board Statement
The animal study protocol was approved by the Committee for the Care and Use of Experimental Animals at Jiangxi Agricultural University (JXAULL-2021036).
Informed Consent Statement
Not applicable.
Data Availability Statement
The raw data involved in this study were deposited in the Sequence Read Archive (SRA) of NCBI with the accession number of PRJNA835689.
Acknowledgments
We would like to express our thanks to the laboratory members of the Jiangxi Province Key Laboratory of Animal Nutrition for their assistance in sampling.
Conflicts of Interest
The authors declare no conflict of interest.
References
- Pitta, D.W.; Indugu, N.; Baker, L.; Vecchiarelli, B.; Attwood, G. Symposium review: Understanding diet-microbe interactions to enhance productivity of dairy cows. J. Dairy Sci. 2018, 101, 7661–7679. [Google Scholar] [CrossRef]
- Brede, M.; Orton, T.; Pinior, B.; Roch, F.-F.; Dzieciol, M.; Zwirzitz, B.; Wagner, M.; Breves, G.; Wetzels, S.U. PacBio and Illumina MiSeq amplicon sequencing confirm full recovery of the bacterial community after subacute ruminal acidosis challenge in the RUSITEC system. Front. Microbiol. 2020, 11, 1813. [Google Scholar] [CrossRef] [PubMed]
- Liu, J.; Zhang, M.; Xue, C.; Zhu, W.; Mao, S. Characterization and comparison of the temporal dynamics of ruminal bacterial microbiota colonizing rice straw and alfalfa hay within ruminants. J. Dairy Sci. 2016, 99, 9668–9681. [Google Scholar] [CrossRef] [PubMed]
- Fernando, S.C.; Purvis, H.T.; Najar, F.Z.; Sukharnikov, L.O.; Krehbiel, C.R.; Nagaraja, T.G.; Roe, B.A.; DeSilva, U. Rumen microbial population dynamics during adaptation to a high-grain diet. Appl. Environ. Microbiol. 2010, 76, 7482–7490. [Google Scholar] [CrossRef] [PubMed]
- Bickhart, D.M.; Weimer, P.J. Symposium review: Host–rumen microbe interactions may be leveraged to improve the productivity of dairy cows. J. Dairy Sci. 2018, 101, 7680–7689. [Google Scholar] [CrossRef] [PubMed]
- Uyeno, Y.; Sekiguchi, Y.; Tajima, K.; Takenaka, A.; Kurihara, M.; Kamagata, Y. An rRNA-based analysis for evaluating the effect of heat stress on the rumen microbial composition of Holstein heifers. Anaerobe 2010, 16, 27–33. [Google Scholar] [CrossRef]
- Huws, S.A.; Edwards, J.E.; Lin, W.; Rubino, F.; Alston, M.; Swarbreck, D.; Caim, S.; Stevens, P.R.; Pachebat, J.; Won, M.Y.; et al. Microbiomes attached to fresh perennial ryegrass are temporally resilient and adapt to changing ecological niches. Microbiome 2021, 9, 143. [Google Scholar] [CrossRef] [PubMed]
- Ines, G.; Takumi, S.; Makoto, M. Mining of luxS genes from rumen microbial consortia by metagenomic and metatranscriptomic approaches. Anim. Sci. J. 2015, 87, 666–673. [Google Scholar]
- Vendeville, A.; Winzer, K.; Heurlier, K.; Tang, C.; Hardie, K. Making ‘sense’ of metabolism: Autoinducer-2, LUXS and pathogenic bacteria. Nat. Rev. Microbiol. 2005, 3, 383–396. [Google Scholar] [CrossRef]
- Ran, T.; Zhou, C.S.; Xu, L.W.; Geng, M.M.; Tan, Z.L.; Tang, S.X.; Wang, M.; Han, X.F.; Kang, J.H. Initial detection of the quorum sensing autoinducer activity in the rumen of goats in vivo and in vitro. J. Integr. Agric. 2016, 15, 2343–2352. [Google Scholar] [CrossRef]
- Sharifi, A.; Nayeri Fasaei, B. Selected plant essential oils inhibit biofilm formation and luxS- and pfs-mediated quorum sensing by Escherichia coli O157:H7. Lett. Appl. Microbiol. 2022, 74, 916–923. [Google Scholar] [CrossRef] [PubMed]
- Soares, J.A.; Ahmer, B.M.M. Detection of acyl-homoserine lactones by Escherichia and Salmonella. Curr. Opin. Microbiol. 2011, 14, 188–193. [Google Scholar] [CrossRef] [PubMed]
- Lenz, D.H.; Mok, K.C.; Lilley, B.N.; Kulkarni, R.V.; Wingreen, N.S.; Bassler, B.L. The small RNA chaperone Hfq and multiple small RNAs control quorum sensing in Vibrio harveyi and Vibrio cholerae. Cell 2004, 118, 69–82. [Google Scholar] [CrossRef] [PubMed]
- Erickson, D.L.; Nsereko, V.L.; Morgavi, D.P.; Selinger, L.B.; Rode, L.M.; Beauchemin, K.A. Evidence of quorum sensing in the rumen ecosystem: Detection of N-acyl homoserine lactone autoinducers in ruminal contents. Can. J. Microbiol. 2002, 48, 374–378. [Google Scholar] [CrossRef]
- Yang, Y.; Zhou, M.; Hardwidge, P.R.; Cui, H.; Zhu, G. Isolation and characterization of N-acyl homoserine lactone-producing bacteria from cattle rumen and swine intestines. Front. Cell. Infect. Microbiol. 2018, 8, 155. [Google Scholar] [CrossRef] [PubMed]
- Sperandio, V. SdiA sensing of acyl-homoserine lactones by enterohemorrhagic E. coli (EHEC) serotype O157:H7 in the bovine rumen. Gut Microbes 2010, 1, 432–435. [Google Scholar] [CrossRef] [PubMed]
- Won, M.Y.; Oyama, L.B.; Courtney, S.J.; Creevey, C.J.; Huws, S.A. Can rumen bacteria communicate to each other? Microbiome 2020, 8, 23. [Google Scholar] [CrossRef] [PubMed]
- Sun, S.J.; Liu, H.J.; Weng, C.H.; Lai, C.F.; Ai, L.Y.; Liu, Y.C.; Zhu, H. The response of Serratia marcescens JG to environmental changes by quorum sensing system. Arch. Microbiol. 2016, 198, 585–590. [Google Scholar] [CrossRef] [PubMed]
- National Academies of Sciences, Engineering, and Medicine (NASEM). Nutrient Requirements of Beef Cattle, 8th ed.; The National Academies Press: Washington, DC, USA, 2016; pp. 397–399. [Google Scholar] [CrossRef]
- Clemmons, B.A.; Martino, C.; Schneider, L.G.; Lefler, J.; Embree, M.M.; Myer, P.R. Temporal stability of the ruminal bacterial communities in beef steers. Sci. Rep. 2019, 9, 9522. [Google Scholar] [CrossRef] [PubMed]
- Brown, M.S.; Ponce, C.H.; Pulikanti, R. Adaptation of beef cattle to high-concentrate diets: Performance and ruminal metabolism. J. Anim. Sci. 2006, 84, E25–E33. [Google Scholar] [CrossRef] [PubMed]
- Palmonari, A.; Stevenson, D.M.; Mertens, D.R.; Cruywagen, C.W.; Weimer, P.J. pH dynamics and bacterial community composition in the rumen of lactating dairy cows. J. Dairy Sci. 2010, 93, 279–287. [Google Scholar] [CrossRef] [PubMed]
- Paz, H.A.; Anderson, C.L.; Muller, M.J.; Kononoff, P.J.; Fernando, S.C. Rumen bacterial community composition in Holstein and Jersey cows is different under same dietary condition and is not affected by sampling method. Front. Microbiol. 2016, 7, 1206. [Google Scholar] [CrossRef] [PubMed]
- Kang, S.; Denman, S.E.; Morrison, M.; Yu, Z.; McSweeney, C.S. An efficient RNA extraction method for estimating gut microbial diversity by polymerase chain reaction. Curr. Microbiol. 2009, 58, 464–471. [Google Scholar] [CrossRef] [PubMed]
- Schmittgen, T.D.; Livak, K.J. Analyzing real-time PCR data by the comparative CT method. Nat. Protoc. 2008, 3, 1101–1108. [Google Scholar] [CrossRef] [PubMed]
- Gu, Y.; Tian, J.; Zhang, Y.; Wu, R.; He, Y. Dissecting signal molecule AI-2 mediated biofilm formation and environmental tolerance in Lactobacillus plantarum. J. Biosci. Bioeng. 2020, 131, 153–160. [Google Scholar] [CrossRef] [PubMed]
- Wattanavanitchakorn, S.; Prakitchaiwattana, C.; Thamyongkit, P. Rapid and simple colorimetric method for the quantification of AI-2 produced from Salmonella Typhimurium. J. Microbiol. Methods 2014, 99, 15–21. [Google Scholar] [CrossRef] [PubMed]
- DuBois, M.; Gilles, K.A.; Hamilton, J.K.; Rebers, P.A.; Smith, F. Colorimetric method for determination of sugars and related substances. Anal. Chem. 1956, 28, 350–356. [Google Scholar] [CrossRef]
- Frølund, B.; Palmgren, R.; Keiding, K.; Nielsen, P.H. Extraction of extracellular polymers from activated sludge using a cation exchange resin. Water Res. 1996, 30, 1749–1758. [Google Scholar] [CrossRef]
- Qiu, Q.; Wei, X.; Zhang, L.; Li, Y.; Qu, M.; Ouyang, K. Effect of dietary inclusion of tea residue and tea leaves on ruminal fermentation characteristics and methane production. Anim. Biotechnol. 2021; in press. [Google Scholar] [CrossRef] [PubMed]
- Wang, W.; Wu, Q.; Li, W.; Wang, Y.; Zhang, F.; Lv, L.; Li, S.; Yang, H. High-gossypol whole cottonseed exhibited mediocre rumen degradability and less microbial fermentation efficiency than cottonseed hull and cottonseed meal with an in vitro gas production technique. Fermentation 2022, 8, 103. [Google Scholar] [CrossRef]
- Qiu, Q.; Gao, C.; Aziz ur Rahman, M.; Cao, B.; Su, H. Digestive ability, physiological characteristics, and rumen bacterial community of Holstein finishing steers in response to three nutrient density diets as fattening phases advanced. Microorganisms 2020, 8, 335. [Google Scholar] [CrossRef] [PubMed]
- Bolyen, E.; Rideout, J.R.; Dillon, M.R.; Bokulich, N.A.; Abnet, C.C.; Al-Ghalith, G.A.; Alexander, H.; Alm, E.J.; Arumugam, M.; Asnicar, F.; et al. Reproducible, interactive, scalable and extensible microbiome data science using QIIME 2. Nat. Biotechnol. 2019, 37, 852–857. [Google Scholar] [CrossRef] [PubMed]
- Zhang, J.; Kobert, K.; Flouri, T.; Stamatakis, A. PEAR: a fast and accurate Illumina Paired-End reAd mergeR. Bioinformatics 2014, 30, 614–620. [Google Scholar] [CrossRef] [PubMed]
- Dickerson, S.S.; Kemeny, M.E. Acute stressors and cortisol responses: A theoretical integration and synthesis of laboratory research. Psychol. Bull. 2004, 130, 355–391. [Google Scholar] [CrossRef] [PubMed]
- Dwyer, J.M. Manipulating the immune system with immune globulin. N. Engl. J. Med. 1992, 326, 107–116. [Google Scholar]
- Tadahisa, F.; Hiroya, M.; Takahiro, I.; Hiroaki, S. Combined effect of salinomycin and feeding on whole body glucose kinetics in sheep fed a high-concentrate diet. Reprod. Nutr. Dev. 2006, 46, 503–514. [Google Scholar]
- Judson, G.J.; Leng, R.A. Effect of diet on glucose synthesis in sheep. Proc. Aust. Soc. Anim. Prod. 1968, 7, 354–358. [Google Scholar]
- Aschenbach, J.R.; Kristensen, N.B.; Donkin, S.S.; Hammon, H.M.; Penner, G.B. Gluconeogenesis in dairy cows: The secret of making sweet milk from sour dough. IUBMB Life 2010, 62, 869–877. [Google Scholar] [CrossRef]
- Asanuma, N.; Yoshii, T.; Hino, T. Molecular characterization and transcription of the luxS gene that encodes LuxS autoinducer 2 synthase in Streptococcus bovis. Curr. Microbiol. 2004, 49, 366–371. [Google Scholar] [CrossRef]
- Allison, D.G. The biofilm matrix. Biofouling 2003, 19, 139–150. [Google Scholar] [CrossRef]
- Tan, L.J.; Wang, J.J.; Peng, Z.Y.; Li, Y.F.; Zeng, Q.H.; Zhao, Y. Mixed-species biofilms formation, interaction and novel control strategies in the food industry. Food Science 2022, in press. [Google Scholar]
- Lee, K.W.K.; Periasamy, S.; Mukherjee, M.; Xie, C.; Kjelleberg, S.; Rice, S.A. Biofilm development and enhanced stress resistance of a model, mixed-species community biofilm. ISME J. 2014, 8, 894–907. [Google Scholar] [CrossRef] [PubMed]
- Bove, P.; Capozzi, V.; Garofalo, C.; Rieu, A.; Spano, G.; Fiocco, D. Inactivation of the ftsH gene of Lactobacillus plantarum WCFS1: Effects on growth, stress tolerance, cell surface properties and biofilm formation. Microbiol. Res. 2012, 167, 187–193. [Google Scholar] [CrossRef]
- Wang, Y.; Liu, B.; Grenier, D.; Yi, L. Regulatory mechanisms of the LuxS/AI-2 system and bacterial resistance. Antimicrob. Agents Chemother. 2019, 63, e01186-19. [Google Scholar] [CrossRef] [PubMed]
- Liu, H.J.; Xu, T.W.; Xu, S.X.; Ma, L.; Han, X.P.; Wang, X.G.; Zhang, X.L.; Hu, L.Y.; Zhao, N.; Chen, Y.W.; et al. Effect of dietary concentrate to forage ratio on growth performance, rumen fermentation and bacterial diversity of Tibetan sheep under barn feeding on the Qinghai-Tibetan plateau. PeerJ 2019, 7, e7462. [Google Scholar] [CrossRef] [PubMed]
- Dijkstra, J. Production and absorption of volatile fatty acids in the rumen. Livest. Prod. Sci. 1994, 39, 61–69. [Google Scholar] [CrossRef]
- Wang, Q.; Zeng, Y.; Zeng, X.; Wang, X.; Wang, Y.; Dai, C.; Li, J.; Huang, P.; Huang, J.; Hussain, T.; et al. Effects of dietary energy levels on rumen fermentation, gastrointestinal tract histology, and bacterial community diversity in fattening male Hu lambs. Front. Microbiol. 2021, 12, 695445. [Google Scholar] [CrossRef]
- Yang, C.M.J. Response of forage fiber degradation by ruminal microorganisms to branched-chain volatile fatty acids, amino acids, and dipeptides. J. Dairy Sci. 2002, 85, 1183–1190. [Google Scholar] [CrossRef]
- Zhao, D.; Gao, P.; Xu, L.; Qu, L.; Han, Y.; Zheng, L.; Gong, X. Disproportionate responses between free-living and particle-attached bacteria during the transition to oxygen-deficient zones in the Bohai Seawater. Sci. Total Environ. 2021, 791, 148097. [Google Scholar] [CrossRef]
- Sano, H.; Ito, T.; Terashima, Y. Effect of diet forage-to-concentrate ratio on partition of dietary energy and nutrients in fed and fasted sheep. J. Appl. Anim. Res. 2004, 25, 101–108. [Google Scholar] [CrossRef]
- Purushe, J.; Fouts, D.E.; Morrison, M.; White, B.A.; Mackie, R.I.; Coutinho, P.M.; Henrissat, B.; Nelson, K.E. Comparative genome analysis of prevotella ruminicola and prevotella bryantii: Insights into their environmental niche. Microb. Ecol. 2010, 60, 721–729. [Google Scholar] [CrossRef]
- Scott, K.P.; Martin, J.C.; Campbell, G.; Mayer, C.; Flint, H.J. Whole-genome transcription profiling reveals genes up-regulated by growth on fucose in the human gut bacterium “Roseburia inulinivorans”. J. Bacteriol. 2006, 188, 4340–4349. [Google Scholar] [CrossRef]
- Nagaraja, T.G.; Fina, L.R.; Lassman, B.A.; Bartley, E.E.; Anthony, H.D.; Sapienza, D.A.; Brent, B.E. Characterization of endotoxin from the rumen bacterium Megasphaera elsdenii. Am. J. Vet. Res. 1979, 40, 35–39. [Google Scholar]
- Mazon, G.; Campler, M.R.; Holcomb, C.; Bewley, J.M.; Costa, J.H.C. Effects of a Megasphaera elsdenii oral drench on reticulorumen pH dynamics in lactating dairy cows under subacute ruminal acidosis challenge. Anim. Feed Sci. Technol. 2020, 261, 114404. [Google Scholar] [CrossRef]
- Trabi, E.B.; Seddik, H.; Xie, F.; Lin, L.; Mao, S. Comparison of the rumen bacterial community, rumen fermentation and growth performance of fattening lambs fed low-grain, pelleted or non-pelleted high grain total mixed ration. Anim. Feed Sci. Technol. 2019, 253, 1–12. [Google Scholar] [CrossRef]
- Li, D.; Leahy, S.; Henderson, G.; Kelly, W.; Cookson, A.; Attwood, G.; Moon, C. Atypical bacterial rRNA operon structure is prevalent within the Lachnospiraceae, and use of the 16S-23S rRNA internal transcribed spacer region for the rapid identification of ruminal Butyrivibrio and Pseudobutyrivibrio strains. Ann. Microbiol. 2014, 64, 1623–1631. [Google Scholar] [CrossRef]
- Liu, K.; Xu, Q.; Wang, L.; Wang, J.; Guo, W.; Zhou, M. The impact of diet on the composition and relative abundance of rumen microbes in goat. Asian-Australas. J. Anim. Sci. 2017, 30, 531–537. [Google Scholar] [CrossRef] [PubMed]
Figure 1.
Serum biochemical, immune, and hormonal indicators before (Pre) and after (Post) diet shift.
Figure 1.
Serum biochemical, immune, and hormonal indicators before (Pre) and after (Post) diet shift.

Figure 2.
AI-2 concentration and luxS gene expression before (Pre) and after (Post) diet shift.

Figure 3.
Microbial density, biofilm formation, and its related gene expression before (Pre) and after (Post) diet shift.
Figure 3.
Microbial density, biofilm formation, and its related gene expression before (Pre) and after (Post) diet shift.

Figure 4.
Exopolysaccharide and protein concentrations of extracellular polymeric substances before (Pre) and after (Post) diet shift.
Figure 4.
Exopolysaccharide and protein concentrations of extracellular polymeric substances before (Pre) and after (Post) diet shift.

Figure 5.
Principal coordinates analysis (PCoA) of rumen bacterial community before (Pre) and after (Post) diet shift.
Figure 5.
Principal coordinates analysis (PCoA) of rumen bacterial community before (Pre) and after (Post) diet shift.

Figure 6.
Non-metric multidimensional scaling (NMDS) of rumen bacterial community before (Pre) and after (Post) diet shift.
Figure 6.
Non-metric multidimensional scaling (NMDS) of rumen bacterial community before (Pre) and after (Post) diet shift.


Table 1.
Ingredients and nutritional composition of pre- and post-shift diet.
| Item | Pre-Shift Diet | Post-Shift Diet |
|---|---|---|
| Ingredients, % of dry matter (DM) | ||
| Corn | 36.20 | 20.00 |
| Soybean meal | 19.47 | 19.80 |
| Wheat bran | 13.24 | 3.49 |
| Wheat straw | 25.09 | 50.71 |
| Calcium bicarbonate | 0.50 | 0.50 |
| Calcium hydrophosphate | 0.50 | 0.50 |
| Limestone | 0.50 | 0.50 |
| Salt | 0.50 | 0.50 |
| Premix 1 | 4.00 | 4.00 |
| Total | 100 | 100 |
| Nutritional composition, g/kg of DM | ||
| Metabolic energy (ME), MJ/kg | 10.97 | 9.59 |
| Crude protein (CP) | 161.4 | 141.2 |
| ME to CP ratio, MJ/g | 0.068 | 0.068 |
| Neutral detergent fiber (NDF) | 308.6 | 428.0 |
| Acid detergent fiber (ADF) | 164.8 | 266.4 |
1 Premix provided the following per kg of DM: 1400 mg of Fe, 1200 mg of Zn, 250 mg of Cu, 900 mg of Mn, 100,000 IU of vitamin A, 27,000 IU of vitamin D3, and 800 IU of vitamin E.
Table 2.
Primers designed for gene expressions of LuxS/AI-2 quorum sensing and biofilm formation.
| Accession Number | Gene Name | Primer Sequence (5-3) | Product Size (bp) |
|---|---|---|---|
| SEW05678.1 | 16S rRNA-F | AGAGCCTGAACCAGCCAAGTAG | 128 |
| 16S rRNA-R | GAATTAGCCGGTCCTTATTCATACA | ||
| luxS-F | GGATGATGTAGTGTATGTCGGTCC | 185 | |
| luxS-R | GGAGGTCGTGGAGCAGATAGTT | ||
| SHK82531.1 | 16S rRNA-F | TGCGTCTGATTAGGTAGTAGGCG | 112 |
| 16S rRNA-R | CGTAGGAGTTTGGACCGTGTCT | ||
| ftsH-F | AGATGTATGAGAAGGGTGGTGAGT | 146 | |
| ftsH--R | TCCCTTGGGTATCTTACCTCCC |
Table 3.
Rumen fermentation characteristics before (Pre) and after (Post) diet shift.
| Item 1 | Pre | Post | SEM 2 | p-Value |
|---|---|---|---|---|
| pH value | 6.94 | 6.95 | 0.07 | 0.821 |
| Molar concentration (mM) | ||||
| Acetate | 11.06 | 10.68 | 1.137 | 0.743 |
| Propionate | 5.89 | 4.94 | 0.673 | 0.180 |
| Isobutyrate | 0.11 | 0.10 | 0.022 | 0.448 |
| Butyrate | 1.26 | 1.52 | 0.171 | 0.153 |
| Isovalerate | 0.18 | 0.16 | 0.019 | 0.327 |
| Valerate | 0.56 | 0.47 | 0.044 | 0.049 |
| Total volatile fatty acids | 19.07 | 17.86 | 1.945 | 0.546 |
| Branched-chain volatile fatty acids | 0.86 | 0.72 | 0.073 | 0.092 |
| Acetate to propionate ratio | 1.98 | 2.28 | 0.114 | 0.017 |
| NGR | 2.29 | 2.73 | 0.117 | 0.002 |
| Fermentation efficiency | 0.78 | 0.77 | 0.005 | 0.022 |
| Molar proportion (mol/100 mol) | ||||
| Acetate | 58.62 | 60.17 | 1.137 | 0.194 |
| Propionate | 30.30 | 27.21 | 1.041 | 0.010 |
| Isobutyrate | 0.64 | 0.59 | 0.102 | 0.678 |
| Butyrate | 6.51 | 8.40 | 0.673 | 0.014 |
| Isovalerate | 0.99 | 0.94 | 0.056 | 0.406 |
| Valerate | 2.95 | 2.68 | 0.111 | 0.032 |
| Branched-chain volatile fatty acids | 4.57 | 4.22 | 0.183 | 0.072 |
1 Branched-chain volatile fatty acids are the sum of isobutyrate, valerate, and isovalerate; NGR, non-glucogenic to glucogenic acids ratio. 2 SEM, standard error of the mean.
Table 4.
Rumen bacterial alpha diversity metrics before (Pre) and after (Post) diet shift.
| Item | Pre | Post | SEM | p-Value |
|---|---|---|---|---|
| Chao 1 | 592.76 | 648.48 | 10.47 | 0.001 |
| Observed species | 506.13 | 560.74 | 9.41 | 0.001 |
| PD whole tree 1 | 30.63 | 33.00 | 0.44 | 0.001 |
| Shannon index | 5.44 | 5.61 | 0.17 | 0.383 |
| Simpson index | 0.94 | 0.94 | 0.02 | 0.807 |
1 PD whole tree, phylogenetic diversity whole tree.
Table 5.
Rumen bacterial community at the level of phylum before (Pre) and after (Post) diet shift.
| Item | Pre | Post | SEM | p-Value |
|---|---|---|---|---|
| Bacteroidetes | 51.46 | 46.40 | 2.89 | 0.124 |
| Firmicutes | 27.21 | 25.50 | 4.09 | 0.689 |
| Proteobacteria | 18.56 | 25.19 | 5.38 | 0.257 |
| Cyanobacteria | 0.74 | 1.07 | 0.26 | 0.237 |
| Actinobacteriota | 1.00 | 0.62 | 0.17 | 0.059 |
| Fibrobacterota | 0.53 | 0.64 | 0.46 | 0.822 |
| Desulfobacterota | 0.25 | 0.27 | 0.06 | 0.823 |
| Spirochaetota | 0.12 | 0.19 | 0.04 | 0.121 |
Table 6.
Rumen bacterial community at the level of genus before (Pre) and after (Post) diet shift.
| Item | Pre | Post | SEM | p-Value |
|---|---|---|---|---|
| Prevotella | 49.72 | 42.77 | 2.79 | 0.042 |
| Succinivibrio | 15.50 | 21.95 | 5.15 | 0.251 |
| Roseburia | 1.42 | 5.64 | 1.75 | 0.047 |
| Succinivibrionaceae UCG-001 | 2.78 | 2.70 | 0.81 | 0.922 |
| Selenomonas | 3.44 | 1.94 | 1.02 | 0.185 |
| Erysipelotrichaceae UCG-002 | 4.00 | 0.55 | 2.90 | 0.274 |
| Megasphaera | 2.53 | 0.72 | 0.34 | 0.001 |
| Syntrophococcus | 1.22 | 1.28 | 0.17 | 0.719 |
| Acetitomaculum | 1.85 | 0.52 | 0.63 | 0.072 |
| Dialister | 1.46 | 0.91 | 0.16 | 0.011 |
| Oribacterium | 1.04 | 1.26 | 0.34 | 0.552 |
| Prevotellaceae UCG-001 | 0.20 | 1.41 | 0.31 | 0.006 |
| Lachnospiraceae NK3A20 group | 0.94 | 0.58 | 0.37 | 0.348 |
| Acidaminococcus | 0.87 | 0.58 | 0.17 | 0.126 |
| Ruminococcus | 0.86 | 0.43 | 0.25 | 0.132 |
| Succiniclasticum | 0.49 | 0.80 | 0.18 | 0.123 |
| Fibrobacter | 0.53 | 0.64 | 0.46 | 0.822 |
| Olsenella | 0.69 | 0.47 | 0.12 | 0.119 |
| Lachnospira | 0.26 | 0.77 | 0.13 | 0.006 |
Publisher’s Note: MDPI stays neutral with regard to jurisdictional claims in published maps and institutional affiliations. |
© 2022 by the authors. Licensee MDPI, Basel, Switzerland. This article is an open access article distributed under the terms and conditions of the Creative Commons Attribution (CC BY) license (https://creativecommons.org/licenses/by/4.0/).
Share and Cite
MDPI and ACS Style
Wei, X.; Long, T.; Li, Y.; Ouyang, K.; Qiu, Q. Diet Shift May Trigger LuxS/AI-2 Quorum Sensing in Rumen Bacteria. Bioengineering 2022, 9, 379. https://0-doi-org.brum.beds.ac.uk/10.3390/bioengineering9080379
AMA Style
Wei X, Long T, Li Y, Ouyang K, Qiu Q. Diet Shift May Trigger LuxS/AI-2 Quorum Sensing in Rumen Bacteria. Bioengineering. 2022; 9(8):379. https://0-doi-org.brum.beds.ac.uk/10.3390/bioengineering9080379
Chicago/Turabian StyleWei, Xiao, Tanghui Long, Yanjiao Li, Kehui Ouyang, and Qinghua Qiu. 2022. "Diet Shift May Trigger LuxS/AI-2 Quorum Sensing in Rumen Bacteria" Bioengineering 9, no. 8: 379. https://0-doi-org.brum.beds.ac.uk/10.3390/bioengineering9080379
Note that from the first issue of 2016, this journal uses article numbers instead of page numbers. See further details here.