Article

Cytokines and Obstructive Sleep Apnea in Childhood: Study of a Group of Children

1
Department of Clinical and Experimental Medicine, University of Insubria, 21100 Varese, Italy
2
Pulmonology Unit, ASST Santi Paolo e Carlo, Department of Health Sciences, University of Milan, 20122 Milan, Italy
3
Center of Research in Medical Pharmacology, University of Insubria, 21100 Varese, Italy
4
Department of Electrical, Computer and Biomedical Engineering, University of Pavia, 27100 Pavia, Italy
5
Immuno-Allergology Laboratory of the Clinical Chemistry Unit, Pediatric Clinic Fondazione IRCCS Policlinico San Matteo, 27100 Pavia, Italy
6
Formerly Medicine Unit Laboratory, ASST Rhodense Garbagnate Milanese, 20024 Rho, Italy
7
Clinic of Pediatrics, University of Insubria, 21100 Varese, Italy
*
Authors to whom correspondence should be addressed.
Submission received: 24 October 2023 / Revised: 22 January 2024 / Accepted: 24 January 2024 / Published: 1 February 2024
(This article belongs to the Section Cytokines and Allied Mediators)

Abstract

:
Introduction: Obstructive Sleep Apnea (OSA) in children is characterized by repeated episodes of partial or complete obstruction of the upper airways that impair normal ventilation and cause hypoxia and sleep disruption. These episodes activate innate and adaptive immunity resulting in the production of proinflammatory cytokines: IL-1β, IL-6, TNF-α, and reactive oxygen species. The hypothalamic–pituitary–adrenal (HPT) axis is also activated with alteration of the circadian rhythm of cortisol synthesis. OSA in children, and even more in adults, induces a systemic inflammatory condition that contributes to the genesis of clinical complications: poor growth, learning disabilities, cardiovascular changes, insulin resistance, and metabolic syndrome. Methods: A total of 42 non-obese children (age 1–15 years) were enrolled among those sent to our sleep center to perform full polysomnography (PSG). After PSG, 6 children did not show OSA (controls), 20 had mild OSA (m OSA), and 16 had medium-severe OSA (MS OSA). In vitro IL-1β, TNF-α, and serum cortisol levels were measured at 2 and 8 am in the analyzed groups. Results: Cortisol levels did not differ between controls and OSA children. At 2 am, there were no differences between controls and OSA in TNF-α production, whereas at 8 am, TNF-α was reduced in MS-OSA. IL-1β production showed no differences between OSA and controls. Conclusions: In our population, only TNF-α production is suppressed in MS-OSA: this might indicate a role of OSA severity in inducing inflammation. In adults, the phenomenon is more pronounced due to the habitual greater severity/duration of OSA, presence of comorbidities (cardiovascular and metabolic), and different immune system function.

1. Introduction

Obstructive Sleep Apnea is the most severe form of Breathing Sleep Disorder (BSD) [1]. OSA is present in both adults and children and must be diagnosed and treated early to avoid acute, behavioral, learning, and cardiac problems and prevent late complications such as cardiovascular disease, Type 2 Diabetes, and metabolic syndrome [2,3].
The prevalence of Obstructive Sleep Apnea (OSA) in childhood is between 1.2 and 5.7% and it is increasing with the rising prevalence of obesity among adolescents [4,5]. It has a peak in preschool age when the tonsils and adenoids reach the largest volume.
Childhood OSA is characterized by prolonged partial and/or intermittent complete upper airway obstruction that disrupts normal ventilation and sleep pattern. It is usually associated with hypoxemia and hypercapnia [6].
The repeated episodes of desaturation and reoxygenation and sleep fragmentation characteristic of OSA trigger oxidative stress, the production of reactive oxygen species (ROS) and of systemic mediators of inflammation, and hyper-activation of the sympathetic system [7,8,9,10,11].
David Gozal first demonstrated an increase in high-sensitivity-C-Reactive-Protein (hsCRP) in adults and in children affected by severe OSA. OSA is associated with a systemic inflammatory state as shown by increased hsCRP, proinflammatory cytokines, and Hypoxia-Inducible Factor (HIF). Consequently, endothelial damage and metabolic syndrome are triggered from the pediatric age [12].
Furthermore, the sleep fragmentation associated with OSA may interfere with the hypothalamic–pituitary–adrenocortical (HPA) axis: cortisol has a nadir around 2 am and a peak 30–60 min after awakening while TNF-α displays a symmetrical pattern [13]. Alternatively, reduced or increased morning cortisol levels have been found in adults and in children with OSA [11,14].
The diagnosis of OSA can be suspected clinically based on clinical history, which should always include some questions about sleep quality, and physical examination [2]. Daytime symptoms such as behavioral problems, learning difficulties, and hyperactivity are common among these children [6,15,16,17,18,19].
Some objective signs such as “allergic shiners”, mouth breathing, anteverted nostrils, a horizontal nasal crease, peculiar facial skeletal structure (adenoidal facies), and dental malocclusion are common.
Hypertrophy of adeno-tonsillar tissue is almost always present and is the main cause of OSA in non-obese and non-syndromic children. The latter reduces the caliber of the upper airways, increases resistance to airflow, and can lead during sleep to reduced/interrupted airflow with consequences on sleep quality, gas exchanges, cardiac activity, the nervous system, and inflammatory response [20,21]. Adenotonsillectomy (AT) is the first-line treatment in the management of OSA in otherwise healthy children [22,23,24,25].
According to many sleep societies, only an overnight polysomnography (PSG) in a sleep laboratory will reach a definitive diagnosis. The PSG allows for the exclusion of other causes of sleep-disordered breathing and to evaluate numerous parameters: among them, the Apnea Hypopnea Index (AHI) (number of events/hour of sleep) is commonly used to classify OSA as mild, moderate, or severe. In the United States, only 10% of children undergoing AT perform a PSG before surgery [26,27].
AHI is used as an indication for urgent referral for AT but has low sensitivity for post-AT prognosis. Unfortunately, AT results in complete recovery in 51 to 81% of children [24,25,28].
Early treatment of childhood OSA is very important for reducing the risk of neurocognitive and behavioral morbidities as well as late cardiovascular events [28]. For this reason, potential diagnostic and prognostic biomarkers are searched and many AAs consider it appropriate to identify OSA biomarkers that are easily measurable, sensitive, and specific. According to R Cortese, “there is a need for molecular diagnostic methods which can simplify OSA diagnosis, and provide an accurate, quick and affordable method, which is applicable in a clinical setting”. Many AAs consider it appropriate to identify OSA biomarkers that can be associated with AHI [29,30,31]. As already mentioned, OSA is associated with a condition of systemic inflammation that worsens when induced by overweight/obesity, which are present in an increasing percentage of adolescents and in the majority of adult patients.
Plasma levels of several proinflammatory cytokines are increased in subjects with severe OSA. Recent meta-analyses show TNF-α, IL-1 β, and IL-6 as the most reliable in severe OSA. At variance, the blood levels of some of these proinflammatory somnogenic cytokines, IL-1β, and TNF-α showed large intergroup variations. Their levels decrease following effective treatment (weight loss, CPAP in adults, and AT in children) and thus could be useful for follow-up [12,32].
In recent years, the possibility of studying the urinary metabolome has emerged with promising data [33].
Recently, single-cell RNA sequencing has been used to study the activation of inflammation genes in Peripheral Blood Mononuclear Cells (PBMCs) and to identify new cell subsets on PBMCs, and peripheral blood cellular components have also been investigated. It was already known that normal or pathological sleep modifies cellular subpopulations (CD4, CD8, NK, Treg, B lymphocytes, and monocytes) which are present in PBMCs. PBMCs receive all endogenous and exogenous stimuli and therefore this easily obtainable tissue is an excellent source of more sophisticated information [34,35,36,37,38,39,40].
PBMCs are easily obtained from a blood sample. They allow us to study the immune and inflammatory contribution to the plasma TNF-α and IL-1 β levels, where the plasma concentrations are the result of the synthesis of these cytokines in all the body compartments and of all the previous events.
We studied 42 non-obese, non-syndromic children. After PSG, 6 were healthy and 36 had OSA. The aim of the study was to compare the groups measuring the serum cortisol levels and the in vitro production of TNF-α and IL-1β by PBMCs as the most involved in inflammation and sleep regulation.

2. Materials and Methods

2.1. Subjects

In a period of 7 months, among the children sent to our sleep laboratory by family pediatricians, we selected 42 children aged 1–15 years old with suspected Breathing Sleep Disorder (BSD) for enrolment in our study. The investigation followed the Helsinki declaration principles for clinical investigations and was approved by the University of Insubria Ethics Committee for Clinical Studies. OSA diagnosis was based on the criteria of the American Academy of Sleep Medicine, ICSD-3. Six children who were found to be free of BSD at polysomnography (PSG) were included in the study as controls. Below, we list the exclusion criteria: child’s age under 12 months or greater than 15 years; evidence or history of acute or chronic inflammatory diseases; infectious diseases; obesity (BMI > 95th percentile for age and gender); endocrine dysfunction; neuromuscular diseases; major craniofacial abnormalities; associated chromosomal syndromes; or evidence of steroid therapy from 3 weeks before undergoing PSG. All participants received a complete physical examination which included detailed family and personal medical history.

2.2. Polysomnographic Evaluation

All patients underwent an overnight polysomnographic evaluation, performed using an e-Series PSG system (Compumedics, Singen, Germany). The following channels were recorded: electroencephalographic leads (C3-A2, O2-A1, and O1-A2), left and right electro-oculograms, sub-mental electromyogram (using two electrodes located at the point of the chin and belly of the digastric muscle on each side of the chin), two electrocardiogram leads, airflow by nasal pressure transducer, respiratory effort by thoracic and abdominal strain gauges, snoring noise by a microphone, and peripheral capillary oxygen saturation (SpO2) by a pulse oximeter (Xpod Model 3011, Nonin Medical Inc., Plymouth, MN, USA) and body position sensor, according to the American Academy of Sleep Medicine criteria. All the measured parameters were first scored by a technician and later reviewed by the lead study physician. A family member was present during the overnight recording.
The diagnostic criterion for OSA in pediatric subjects was AHI ≥ 1 event per hour (event/h), where AHI was defined as the number of obstructive apnea and hypopnea events/h. Apnea was defined as a ≥90% reduction or absence of oronasal airflow for >90% of the event, which lasted for at least two regular breaths compared with the previous baseline amplitude. Obstructive hypopnea was defined as an airflow reduction ≥ 50% for more than 90% of the entire event, which lasted for at least two regular breaths, with a desaturation ≥ 3%, awakening, or EEG arousal compared with the previous baseline amplitude. Eventually, based on the outcome of PSG, subjects were divided in three groups: mild OSA (m-OSA: 1 ≤ AHI < 5), moderate-severe OSA (MS-OSA: AHI ≥ 5), and controls (AHI < 1).

2.3. Serum Cortisol Levels

Blood samples were drawn from all the children undergoing the PSG evaluation, at 2 am and 8 am, from a peripheral heparinized catheter already placed in the vein at the beginning of the PSG recording. The blood was allowed to clot for 30 min. The samples were then centrifuged, and the serum was frozen at −80 °C until the assay. The serum cortisol levels were determined by a radioimmunoassay technique (Bridge Cortisol Kit, Adaltis, Rome, Italy). Sampling times were chosen following the circadian rhythms of cortisol secretion reported in the literature: nadir at about 2 am and peak 30–60 min after awakening. TNF alpha follows the same circadian rhythm, reversed: peak at 2 am and nadir after awakening.

2.4. In Vitro Production of Cytokines by Peripheral Blood Mononuclear Cell Cultures

During the night of PSG, a sample of heparinized blood was also collected for the in vitro cultures. Lymphocyte subpopulations vary in correlation with cortisol secretion and are also affected by sleep disturbance. This, in our opinion, should make the use of PBMCs to assess the effect of OSAS on cytokine secretion by T lymphocytes more sensitive. The blood was layered on a Ficoll-Paque Plus density gradient, centrifuged, and the PBMC layer was collected, washed, and frozen at −80 °C until cultured. A typical PBMC preparation contained about 80% lymphocytes and 16% monocytes, and the cell viability was always >99% as assessed by flow cytometric analysis. The PBMCs were cultured in RPMI 1640 medium supplemented with 10% heath inactivated fetal calf serum, 2 mM glutamine, and 100 U/mL penicillin/streptomycin at 37 °C in a moist atmosphere, in a humidified incubator under CO2 5% in 24-well plates at a concentration of 1 × 10⁶ cells/mL. PHA (10 µg/mL) was added as a mitogenic stimulus, and PHA was not added to the control cultures. After 24 h, the supernatants were collected, frozen, and stored at −80 °C until the assay for TNF-α and IL-1β was conducted. Finally, all the supernatants were analyzed simultaneously by an immunoenzymatic technique (ELISA Bio Trak system, GE Healthcare, Bio-Sciences, Uppsala, Sweden). The lower TNF-α and IL-1β detection limits were 25 pg/mL and 10 pg/mL, with a sensitivity of <5 pg/mL and <1 pg/mL, respectively.

2.5. Statistical Analysis

Data analysis was performed using IBM SPSS version 20. To compare quantitative variables between subgroups, we used the Wilcoxon test (for two groups) and the Kruskall–Wallis test (for more than 2 groups). To compare variables at different points in time, we used the one-way ANOVA test with repeated measurements. To compare quantitative variables between the two different cultures, we used the Wilcoxon test for paired data. To simultaneously evaluate the effect of time and severity of the disease, we used a mixed ANOVA, considering time as the within-subject factor and severity as the between-subjects factor. Statistical significance was considered for all tests at p < 0.05.
It is important to notice that, given the small number of cases in our analysis, the results of these tests should be interpreted with caution.

3. Results

3.1. Subjects

A total of 42 non-obese children (24 F, 18 M) were enrolled in our study. According to the AHI score calculated from the PSG, they were divided in three groups: controls (AHI < 1), m-OSA (1 ≤ AHI < 5), and MS-OSA (AHI > 5). The demographic and anthropometric data are presented in Table 1. The groups were matched for age, weight, BMI, and BMI percentile. There was no difference in Total Sleep Time (TST) among groups. The average and the lowest SpO2 were significantly lower in MS-OSA as compared to controls and m-OSAS.

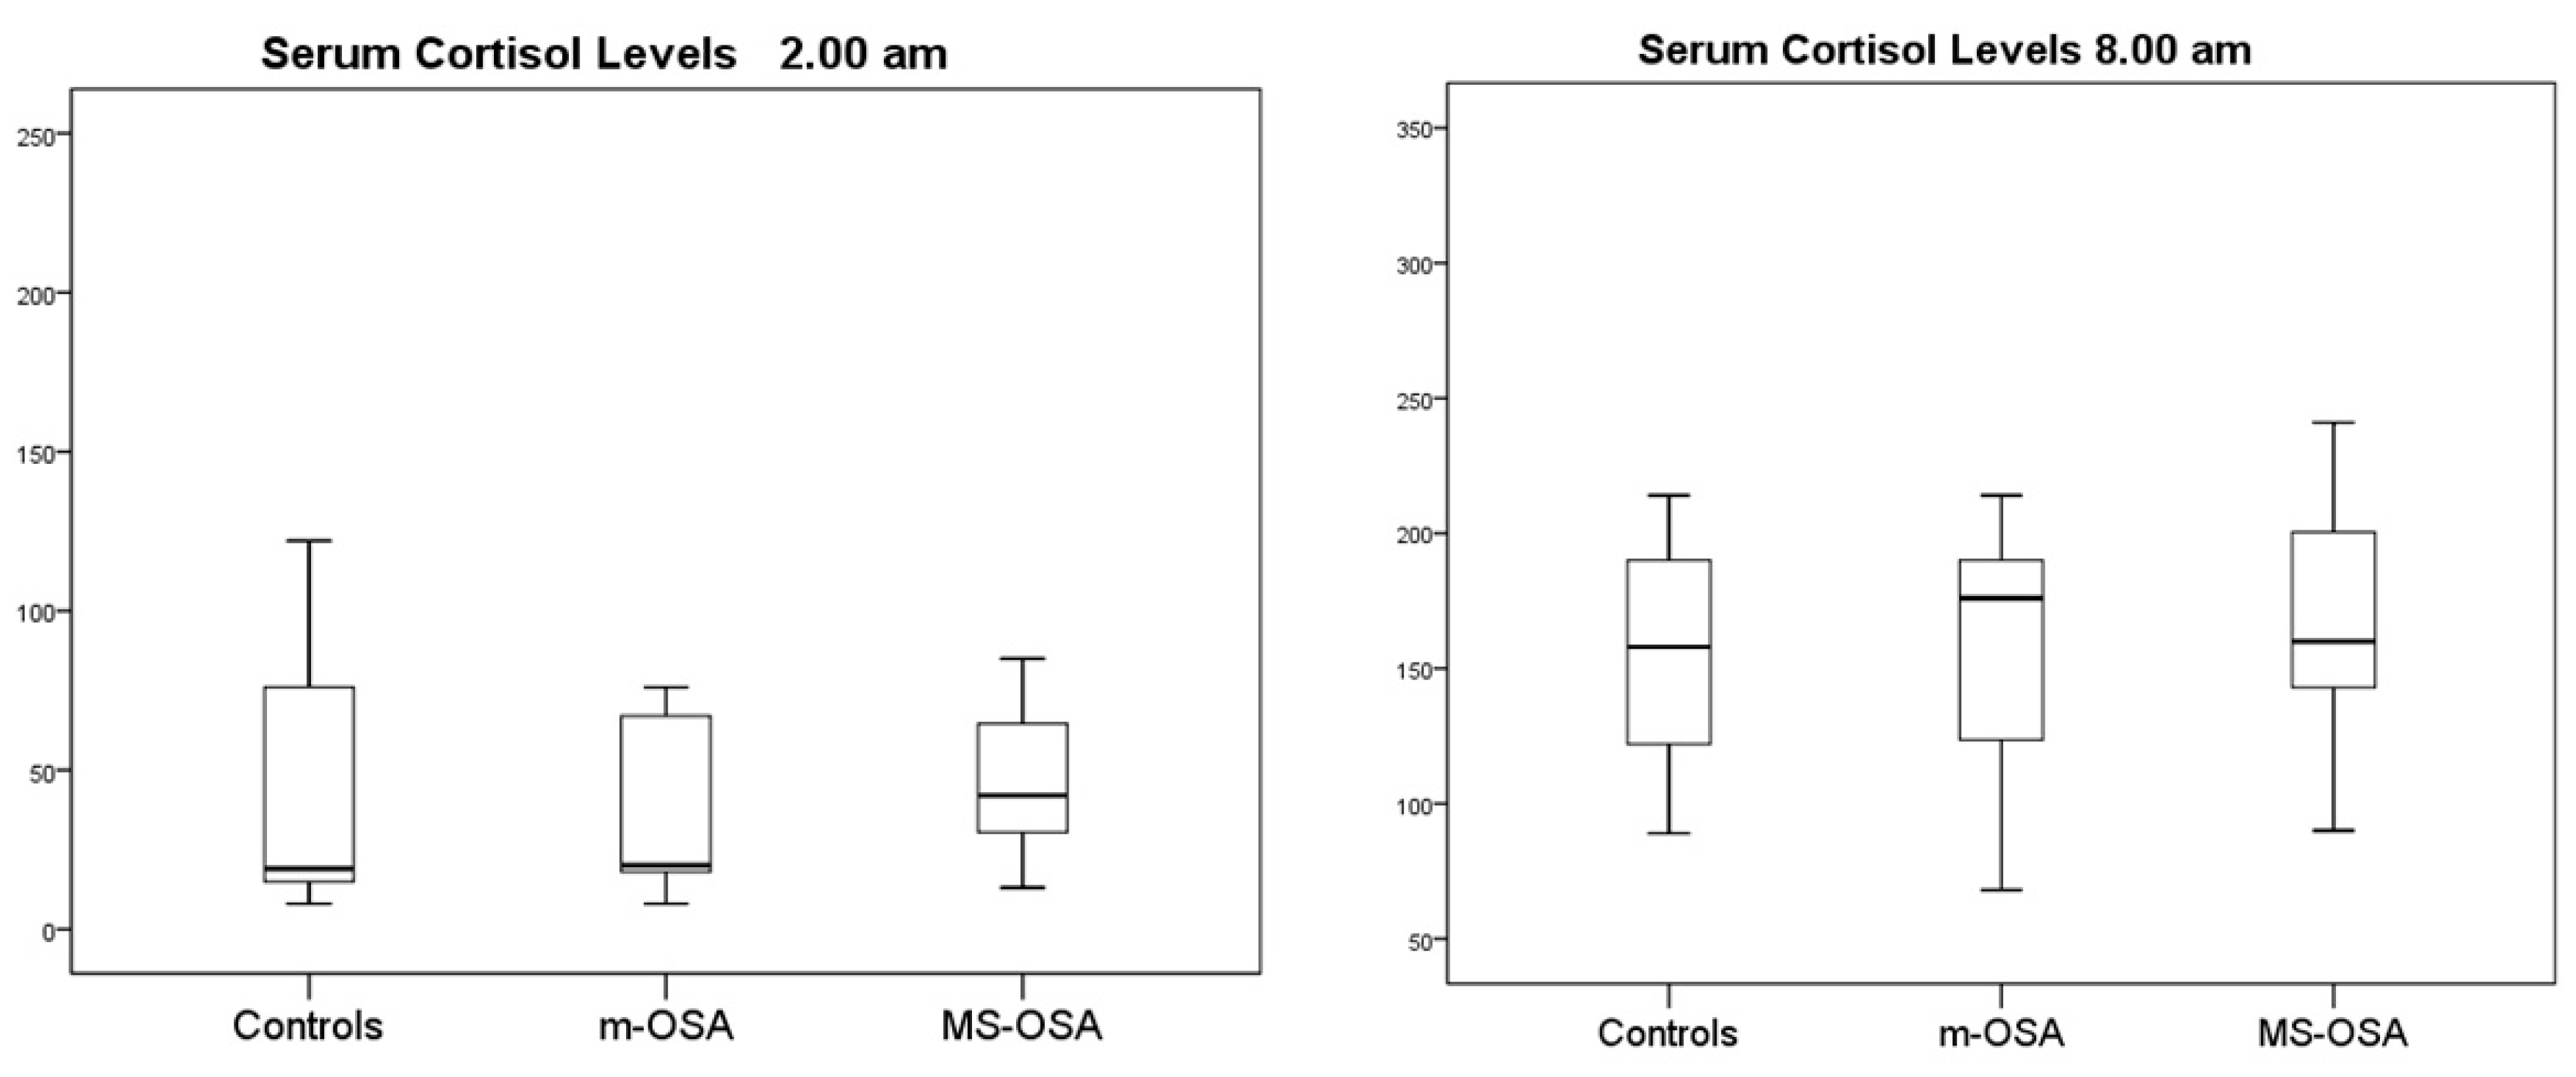
3.2. Serum Cortisol Levels

Serum levels were assessed in all children at 2.00 am during the PSG recording and at 8.00 am within 30 min after awakening. All the samples were processed simultaneously. In all groups, the nadir was observed at 2.00 am and the higher cortisol levels were present at 8.00 am (Figure 1). No significant differences were present between controls and OSA children irrespective of the OSA severity, both at 2.00 am and at 8.00 am. No correlations were found with the minimum SpO2 and TST.

3.3. In Vitro Cytokine Production by PBMCs

Table 2 and Table 3 show, for TNF-α and IL-1β, at 2 am and at 8 am, the comparison between the values obtained from unstimulated cultures and those obtained from cultures stimulated with PHA. As descriptive statistics, Table 2 reports the median and interquartile range (IQR) for all the cultures. Table 3 reports the results of the statistical tests used to carry out four different comparisons: changes in the median values of the cytokines for the two considered conditions (unstimulated vs. stimulated with PHA) at 2 am and at 8 am and changes between the values measured at 2 am and those measured at 8 am in unstimulated cultures and in cultures stimulated with PHA. In this table, arrows indicate the changes in the median values of the cytokines for the two considered conditions, while in brackets we report the p-value of the following tests: Wilcoxon signed-rank test for the comparison between unstimulated and stimulated cultures and ANOVA test for repeated measures for the comparison between values at 2 am vs. values at 8 am. Significant differences are marked with a *.
TNF-α was increased in all the PHA-stimulated cultures compared to the unstimulated cultures in all the conditions tested (at 2.00 am and at 8.00 am). IL-1β was increased in all the PHA-stimulated cultures compared to the unstimulated cultures in all the conditions tested (at 2.00 am and at 8.00 am), except for MS-OSA patients. Table 3 shows that, considering all the patients, TNF-a significantly decreases from 2 am to 8 am in unstimulated cultures. This effect of the time component is confirmed by a mixed effect ANOVA test, where the inter-subject factor is time and the intra-subject factor is the severity of the disease. Time has a significant effect on TNF- a values (p = 0.015), while the severity level does not (p = 0.91).

3.3.1. m-OSA vs. MS-OSA

We compared the TNF-α and IL-1β synthesis obtained in children with m-OSA versus those with MS-OSA. For IL-1β production, no differences were observed in samples drawn from MS-OSA at 2.00 am and 8.00 am, cultured without PHA (p = 0.84). A slightly significant reduction in median TNF-α production was found in MS-OSA as compared to m-OSA after 24 h of culture with PHA by PBMCs at 8.00 am (p = 0.05). As mentioned, PHA increased the production of both cytokines, and no significant difference was found between the quantity of IL-1β and TNF-α present in supernatants from cultures of PBMCs drawn at 2.00 vs. 8.00 am. The value of IL-1β was found to decrease, even though not significantly, in the m-OSA group from 2 am to 8 am, in both culturing conditions.

3.3.2. OSA vs. Controls

At 2.00 am, no difference in TNF-α in vitro production by unstimulated and PHA-stimulated cultures was observed between OSA patients and controls. At 8.00 am, TNF-α production was significantly suppressed in MS-OSA but not in mild OSA as compared to controls (p = 0.022). The in vitro production of IL-1β by PBMCs at 2.00 am and at 8.00 am was not different between OSA children and controls.

3.3.3. Controls

We also compared the TNF-α in vitro synthesis in PBMC cultures at 2.00 am and 8.00 am in the control group: no difference was found in unstimulated PBMC cultures between 2.00 am and 8.00 am (p = 0.058) and in the PHA-stimulated culture (p = 0.95). As far as IL-1β production is concerned, no difference was noticed in unstimulated cultures at 2.00 am and 8.00 am (p = 0.39), but higher levels in PHA cultures were documented at 8.00 am vs. 2.00 am (p = 0.021).

4. Discussion

Our study aimed to identify new markers to add to AHI obtained from PSG, which would be easier to measure and could increase its prognostic power as suggested by others [40]. In 42 non-obese, non-syndromic children, we documented that serum cortisol levels, taken at 2 am and 8 am, did not differ between healthy controls and children with OSA of different severities according to the AHI measured from the PSG. (Figure 1) In adults with severe OSA, an increase in serum cortisol levels has been reported by some authors. As pediatricians, we must remember that a child is not a little adult. The immunity of the child is very different from that of the adult. Sadly, this was documented by the recent COVD-19 pandemic. Very few children had severe forms and died. The adult–child comparison has so far been based on PSG data, but the inflammatory and metabolic fallout is necessarily different. Adult OSA patients can be compared to our children with OSA with precaution: adults usually have more severe OSA (AHI > 15), long-lasting disease, and are often overweight or frankly obese. Obese children were not enrolled in our study group and only two had an AHI > 15 [41,42]. Salivary cortisol was assessed by some authors in order to reduce the stress of drawing blood from children [43,44]. Morning salivary cortisol was reported to have increased, to be stable, or also to have decreased [11,14,45,46]. OSA is a condition of systemic inflammation caused by sleep fragmentation, recurrent episodes of hypoxia inducing HIF, and the production of excess ROS with each cycle of rebreathing after apneas/hypopneas [12]. Therefore, many authors searched among inflammatory proteins for those that could function as biomarkers for OSA. Plasma TNF-α and IL-1 β proinflammatory cytokines are consistently increased in adults with severe OSA and their levels are reduced after effective CPAP treatment. Numerous cytokines have been studied, but TNF-α seems to be the one most regularly correlated with OSA severity [29,47,48]. To avoid the interference on inflammatory cytokines (i.e., TNF-α and IL-1 β in our system) caused by adiposity as is often the case in adult patients, we enrolled only children with normal BMI. Indeed, there is evidence that the endothelial inflammation that will lead to adult cardiovascular disease is already present in children [20,21,49]. The attention difficulties and poor school performance that characterize children with OSA are also attributable to the suffering of certain CNS structures secondary to alterations in the blood–brain barrier mediated mainly by TNF-α, IL-1 β, and IL-6 [21]. The diagnosis of OSA and its severity cannot be conclusive without a PSG study, which in children with OSA allows for the recording of numerous parameters. The AHI is commonly used to establish the severity of the condition. It has been shown to be very useful and effective in identifying children who urgently need ATX, but it has a low prognostic value. Therefore, sensitive and specific biomarkers for severity and prognosis are being sought [30]. TNF- α in adults seems to meet these requirements, but it is incorrect to transfer this observation to children with OSA. Adults often have comorbidities that are not present in children, and especially after 55 years of age when the incidence of OSA increases, the immune system functions less efficiently than that of children and promotes an inflammatory condition [50]. Overweight/obesity often present significant contributions to systemic inflammation.
The prototypical proinflammatory cytokines include TNF-α, IL-6, and IL-1β. We studied TNF-α and IL-1β because these cytokines are the most somnogenic, and they interact with each other. Our study found a reduction in TNF-α synthesis by PBMCs taken at 8 am from children with MS-OSA vs. m-OSA and from any OSA patient vs. controls. IL-1 β synthesis by PBMCs drawn at 8 am increased in PHA-stimulated cultures of healthy and m-OSA children but not in MS-OSA subjects. In the literature, more severe OSA is frequently associated with increased circulating TNF-α, and our discordant results may have several possible causes. TNF-α is produced by numerous cell types in both the blood (adaptive and natural immune system) and other organs and districts. Plasma TNF-α is the resulting sum from all these districts. We wanted to study only TNF-α produced by PBMCs at the same time as PSG recording: our goal was to identify an easily measurable biomarker for screening. PBMCs from children with OSA according to recently published studies exhibit the activation of several genes involved in inflammation; therefore, in our opinion, PBMCs best represent what occurs in the body during sleep [36,37,38,39,40]. We did not study the gene because we were looking for a marker applicable in a clinical setting. It should be noted that an increase in mRNA in PBMCs has been reported without a significant translation into the cytokine protein production [51]. We stimulated the cultures with PHA, a polyclonal activator mainly of T cells. Other AAs in the past had used, with different results, LPS, which acts primarily on cells of innate immunity using whole blood and not PBMCs [52]. Our culture conditions were titrated using blood from volunteer (young adult lab trainees) donors and could respond differently to PHA as compared with children with OSA. In the future, it might be useful to test different polyclonal activators and different culture conditions in the same experiment. IL-1 β synergizes with TNF-α in promoting the inflammatory reaction and stimulates the production of several cytokines and adhesion molecules that lead to endothelial damage. Its production is also stimulated by hypoxia in addition to sleep fragmentation, which acts mainly on TNF-α. It showed opposite kinetics as compared to TNF-α and is suppressed only in MS-OSA.

5. Conclusions

In conclusion, our data, preliminary obtained from a selected group of children who were not obese, indicate that TNF-α is a promising marker that complements PSG results in childhood OSA. Improved culture conditions are needed before using it as a biomarker. Longitudinal study of these children undergoing or not undergoing AT will allow for the evaluation of its prognostic value.

Author Contributions

Conceptualization, L.M.N., C.T., F.M., M.D.A. and L.N.; methodology, L.S.; formal analysis, L.S.; investigation, L.M.N., C.T., F.M., M.G., M.D.A., F.B., R.M., M.C. and L.N.; writing—original draft preparation, L.M.N., M.D.A. and L.N.; writing—review and editing, C.T., F.B. and L.N.; supervision, L.N. All authors have read and agreed to the published version of the manuscript.

Funding

This research received no external funding.

Institutional Review Board Statement

The study was conducted in accordance with the Declaration of Helsinki and approved by the Ethics Committee of the University of Insubria (approval date: 25 May 2019, Study number 14/2019).

Informed Consent Statement

Informed consent was obtained from all subjects involved in the study.

Data Availability Statement

The data presented in this study are available on request from the corresponding author.

Conflicts of Interest

The authors declare no conflicts of interest.

References

  1. Bryant, P.A.; Trinder, J.; Curtis, N. Sick and tired: Does sleep have a vital role in the immune system? Nat. Rev. Immunol. 2004, 4, 457–467. [Google Scholar] [CrossRef] [PubMed]
  2. Williamson, A.A.; Amin, R.S.; Meltzer, L.J.; Laposky, A.; Fiks, A.G.; Tapia, I.E. Defining and Promoting Pediatric Pulmonary Health: Understanding Sleep and Ventilatory Health. Pediatrics 2023, 152 (Suppl. S2), e2023062292D. [Google Scholar] [CrossRef] [PubMed]
  3. Verhulst, S. The metabolic consequences of obstructive sleep apnoea in children. Breathe 2009, 6, 111–114. [Google Scholar] [CrossRef]
  4. Lumeng, J.C.; Chervin, R.D. Epidemiology of Pediatric Obstructive Sleep Apnea. Proc. Am. Thorac. Soc. 2008, 5, 242–252. [Google Scholar] [CrossRef] [PubMed]
  5. Arens, R.; Muzumdar, H. Childhood obesity and obstructive sleep apnea syndrome. J. Appl. Physiol. 2010, 108, 436–444. [Google Scholar] [CrossRef] [PubMed]
  6. Marcus, C.L.; Brooks, L.J.; Davidson Ward, S.; Draper, K.A.; Gozal, D.; Halbower, A.C.; Jones, J.; Lehmann, C.; Schechter, M.S.; Sheldon, S.; et al. American Academy of Pediatrics. Obstructive sleep apnea syndrome: Clinical practice guideline for the diagnosis and management of childhood obstructive sleep apnea syndrome. Pediatrics 2012, 130, e714–e755. [Google Scholar] [CrossRef] [PubMed]
  7. Dyugovskaya, L.; Lavie, P.; Lavie, L. Increased adhesion molecules expression and production of reactive oxygen species in leukocytes of sleep apnea patients. Am. J. Respir. Crit. Care Med. 2002, 165, 934–939. [Google Scholar] [CrossRef]
  8. Israel, L.P.; Benharoch, D.; Gopas, J.; Goldbart, A.D. A Pro-Inflammatory Role for Nuclear Factor Kappa B in Childhood Obstructive Sleep Apnea Syndrome. Sleep 2013, 36, 1947–1955. [Google Scholar] [CrossRef]
  9. Goldbart, A.D.; Gannot, M.; Haddad, H.; Gopas, J. Nuclear factor kappa B activation in cardiomyocytes by serum of children with obstructive sleep apnea syndrome. Sci. Rep. 2020, 10, 22115. [Google Scholar] [CrossRef]
  10. Regev, D.; Etzion, S.; Haddad, H.; Gopas, J.; Goldbart, A. Obstructive sleep apnea syndrome in vitro model: Controlled intermittent hypoxia stimulation of human stem cells-derived cardiomyocytes. Int. J. Mol. Sci. 2022, 23, 10272. [Google Scholar] [CrossRef]
  11. Imani, M.M.; Sadeghi, M.; Khazaie, H.; Sanjabi, A.; Brand, S.; Brühl, A.; Bahmani, D.S. Associations between morning salivary and blood cortisol concentrations in individuals with obstructive sleep apnea syndrome: A Meta-Analysis. Front. Endocrinol. 2021, 11, 568823. [Google Scholar] [CrossRef]
  12. Kheirandish-Gozal, L.; Gozal, D. Obstructive Sleep Apnea and Inflammation: Proof of Concept Based on Two Illustrative Cytokines. Int. J. Mol. Sci. 2019, 20, 459. [Google Scholar] [CrossRef]
  13. Balbo, M.; Leproult, R.; Van Cauter, E. Impact of sleep and its disturbances on hypothalamo-pituitary-adrenal axis activity. Int. J. Endocrinol. 2010, 2010, 759234. [Google Scholar] [CrossRef]
  14. Park, C.S.; Guilleminault, C.; Hwang, S.H.; Jeong, J.H.; Park, D.S.; Maeng, J.H. Correlation of salivary cortisol level with obstructive sleep apnea syndrome in pediatric subjects. Sleep Med. 2013, 14, 978–984. [Google Scholar] [CrossRef]
  15. Muzumdar, H.; Arens, R. Physiological effects of obstructive sleep apnea syndrome in childhood. Respir. Physiol. Neurobiol. 2013, 188, 370–382. [Google Scholar] [CrossRef]
  16. Carroll, J. Obstructive sleep-disordered breathing in children: New controversies, new directions. Clin. Chest Med. 2003, 24, 261–282. [Google Scholar] [CrossRef]
  17. Alexander, N.S.; Schroeder, J.W. Pediatric Obstructive Sleep Apnea Syndrome. Pediatr. Clin. N. Am. 2013, 60, 827–840. [Google Scholar] [CrossRef]
  18. Brockmann, P.E.; Gozal, D. Review Neurocognitive Consequences in Children with Sleep Disordered Breathing: Who Is at Risk? Children 2022, 9, 1278. [Google Scholar] [CrossRef]
  19. Liu, X.; Ma, Y.; Ouyang, R.; Zeng, Z.; Zhan, Z.; Lu, H.; Cui, Y.; Dai, Z.; Luo, L.; He, C.; et al. The relationship between inflammation and neurocognitive dysfunction in obstructive sleep apnea syndrome. J. Neuroinflammation 2020, 17, 229. [Google Scholar] [CrossRef]
  20. Ryan, S.; Taylor, C.T.; McNicholas, W.T. Selective Activation of Inflammatory Pathways by Intermittent Hypoxia in Obstructive Sleep Apnea Syndrome. Circulation 2005, 112, 2660–2667. [Google Scholar] [CrossRef]
  21. Smith, D.F.; Hossain, M.; Hura, A.; Huang, G.; McConnell, K.; Ishman, S.L.; Amin, R.S. Inflammatory Milieu and Cardiovascular Homeostasis in Children with Obstructive Sleep Apnea. Sleep 2017, 40, zsx022. [Google Scholar] [CrossRef]
  22. Gipson, K.; Lu, M.; Kinane, T.G. Sleep-disordered breathing in children. Pediatr. Rev. 2019, 40, 3–13. [Google Scholar] [CrossRef]
  23. Katz, E.S.; Moore, R.H.; Rosen, C.L.; Mitchell, R.B.; Amin, R.; Arens, R.; Muzumdar, H.; Chervin, R.D.; Marcus, C.L.; Paruthi, S.; et al. Growth after adenotonsillectomy for obstructive apnea: An RCT. Pediatrics 2014, 134, 282–289. [Google Scholar] [CrossRef]
  24. Kheiradish Gozal, L.; Gileles Hillel, A.; Alonso Alvarez, M.L.; Peris, E.; Bhattacharjee, R.; Terán-Santos, J.; Duran-Cantolla, J.; Gozal, D. Effects of adenotonsillectomy on plasma inflammatory biomarkers in obese children with obstructive sleep apnea: A community-based study. Int. J. Obes. 2015, 39, 1094–1100. [Google Scholar] [CrossRef]
  25. Lee, C.H.; Hsu, W.C.; Chang, W.H.; Lin, M.T.; Kang, K.T. Polysomnographic finding after adenotonsillectomy for obstructive sleep apnea in obese and non-obese children: A systematic review and meta-analysis. Clin. Otolaryngol. 2016, 41, 498–510. [Google Scholar] [CrossRef]
  26. Bhattacharyya, N.; Lin, H.W. Changes and consistencies in the epidemiology of pediatric adenotonsillar surgery, 1996–2006. Otolaryngol. Head Neck Surg. 2010, 143, 680–684. [Google Scholar] [CrossRef]
  27. Weatherly, R.A.; Mai, E.F.; Ruzicka, D.L.; Chervin, R.D. Identification and evaluation of obstructive sleep apnea prior to adenotonsillectomy in children: A survey of practice patterns. Sleep Med. 2003, 4, 297–307. [Google Scholar] [CrossRef]
  28. Bhattacharjee, R.; Kheirandish-Gozal, L.; Kaditis, A.G.; Verhulst, S.L.; Gozal, D. C-reactive protein as a potential biomarker of residual obstructive sleep apnea following adenotonsillectomy in children. Sleep 2016, 39, 283–291. [Google Scholar] [CrossRef]
  29. Li, Q.; Zheng, X. Tumor necrosis factor alpha is a promising circulating biomarker for the development of Obstructive Sleep Apnea-syndrome: A meta-analysis. Oncotarget 2017, 8, 27616–27626. [Google Scholar] [CrossRef]
  30. Martınez-Garcıa, M.A.; Oscullo, G.; Gomez-Olivas, J.D.; Gozal, D. Measuring severity in OSA: The arguments for collaboratively developing a multidimensional score. J. Clin. Sleep Med. 2023, 19, 1705–1707. [Google Scholar] [CrossRef]
  31. Cortese, R.; Adams, T.S.; Cataldo, K.H.; Hummel, J.; Kaminski, N.; Kheirandish-Gozal, L.; Gozal, D. Single-cell RNA-seq uncovers cellular heterogeneity and provides a signature for paediatric sleep apnoea. Eur. Respir. J. 2023, 61, 2201465. [Google Scholar] [CrossRef] [PubMed]
  32. Mohamed, S.E.; Mohamed, A.; Ebrahim, A.; Zahran, M.; Eltonsy, M.; Zewail, A.; Kasem, A.; Abdelaal, K.; Seddeek, M.; Ahmed, Z. Alterations in Inflammatory Markers and Cognitive Ability after Treatment of Pediatric Obstructive Sleep Apnea. Medicina 2023, 59, 204. [Google Scholar] [CrossRef]
  33. Mohit; Tomar, M.S.; Sharma, D.; Nandan, S.; Pateriya, A.; Shrivastava, A.; Chand, P. Emerging role of metabolomics for biomarker discovery in obstructive sleep apnea. Sleep Breath. 2023, 27, 1247–1254. [Google Scholar] [CrossRef]
  34. Liao, J.; Gao, X.; Shi, Y.; Li, Y.; Han, D. Evaluation of obstructive sleep apnea: An analysis based on aberrant genes. Sleep Breath. 2023, 27, 1419–1431. [Google Scholar] [CrossRef]
  35. Sánchez-de-la-Torre, M.; Barbé, F. Cellular heterogeneity insights and molecular signatures in paediatric sleep apnoea. Eur. Respir. J. 2023, 61, 2202316. [Google Scholar] [CrossRef]
  36. Kohane, I.S.; Valtchinov, V.I. Quantifying the white blood cell transcriptome as an accessible window to the multiorgan transcriptome. Bioinformatics 2012, 28, 538–545. [Google Scholar] [CrossRef]
  37. Polotsky, V.Y.; Bevans-Fonti, S.; Grigoryev, D.N.; Punjabi, N.M. Intermittent hypoxia alters gene expression in peripheral blood mononuclear cells of healthy volunteers. PLoS ONE 2015, 10, e0144725. [Google Scholar] [CrossRef]
  38. Lin, S.W.; Tsai, C.N.; Lee, Y.S.; Chu, S.F.; Chen, N.H. Gene expression profiles in peripheral blood mononuclear cells of Asian obstructive sleep apnea patients. Biomed. J. 2014, 37, 60–70. [Google Scholar] [CrossRef]
  39. Tan, H.-L.; Gozal, D.; Wang, Y.; Bandla, H.P.; Bhattacharjee, R.; Kulkarni, R.; Kheirandish-Gozal, L. Alterations in circulating T-cell lymphocyte populations in children with obstructive sleep apnea. Sleep 2013, 36, 913–922. [Google Scholar] [CrossRef] [PubMed]
  40. Fiedorczuk, P.; Polecka, A.; Walasek, M.; Olszewska, E. Potential diagnostic and monitoring biomarkers of obstructive sleep apnea-umbrella review of Meta-Analysis. J. Clin. Med. 2022, 12, 60. [Google Scholar] [CrossRef]
  41. Karaka, Z.; Ismailogullari, S.; Korkmaz, S.; Cakir, I.; Aksu, M.; Baydemir, R.; Tanriverdi, F.; Bayram, F. Obstructive sleep apnea is associated with relative hypocortisolemia and decrease hypothalamo-pituitary-adrenal axis response to 1 and 250 µg ACTH and glucagon stimulation tests. Sleep Med. 2013, 14, 160–164. [Google Scholar] [CrossRef]
  42. Späth-Schwalbe, E.; Schöller, T.; Kern, W.; Fehma, H.L.; Born, J. Nocturnal adrenocorticotropin and cortisol secretion depends on sleep duration and decreases in association with spontaneous awakening in the morning. J. Clin. Endocrinol. Metab. 1992, 75, 1431–1435. [Google Scholar] [CrossRef]
  43. Cain, D.W.; Cidlowshi, J.A. Immune regulation by glucocorticoids. Nature Rev. Immunol. 2017, 17, 233–247. [Google Scholar] [CrossRef]
  44. Meeran, K.; Hattersley, A.; Mould, G.; Bloom, S.R. Venipuncture causes rapid rise in plasma ACTH. Br. J. Clin. Pract. 1993, 47, 246–247. [Google Scholar] [CrossRef] [PubMed]
  45. Malakasioti, G.; Alexopoulos, E.I.; Varlami, V.; Chaidas, K.; Liakos, N.; Gourgoulianis, K.; Kaditis, A.G. Low morning serum cortisol levels in children with tonsillar hypertrophy and moderate-to-severe OSA. Sleep 2013, 36, 1349–1354. [Google Scholar] [CrossRef] [PubMed]
  46. Patacchioli, F.R.; Tabarrini, A.; Ghiciuc, C.M.; Dima-Cozma, L.C.; Prete, A.; Bianchini, C.; Nicoletti, F.; Gozal, D.; Villa, M.P. Salivary Biomarkers of Obstructive Sleep Apnea Syndrome in Children. Pediatr. Pulmonol. 2014, 49, 1145–1152. [Google Scholar] [CrossRef] [PubMed]
  47. Tauman, R.; Ivanenko, A.; O’Brien, L.M.; Gozal, D. Plasma C-reactive protein levels among children with sleep-disordered breathing. Pediatrics 2004, 113, e564–e569. [Google Scholar] [CrossRef] [PubMed]
  48. Gozal, D.; Serpero, L.D.; Kheirandish-Gozal, L.; Capdevila, S.O.; Khalyfa, A.; Tauman, R. Sleep measures and morning plasma TNF-α levels in children with sleep-disordered sleeping. Sleep 2010, 33, 319–325. [Google Scholar] [CrossRef] [PubMed]
  49. Cofta, S.; Wysocka, E.; Michalak, S.; Piorunek, T.; Batura-Gabryel, H.; Torlinski, L. Endothelium-derived markers and antioxidant status in the blood of obstructive sleep apnea males. Eur. J. Med. Res. 2009, 14 (Suppl. S4), 49–52. [Google Scholar] [CrossRef] [PubMed]
  50. Okuyama, H.; Weyand, C.M.; Goronzy, J. Generation and durability of immune memory in older adults. J. Allergy Clin. Immunol. 2023, 152, 601–603. [Google Scholar] [CrossRef] [PubMed]
  51. Ghezzi, P.; Dinarello, C.A.; Bianchi, M.; Rosandich, M.E.; Repine, J.E.; White, C.W. Hypoxia increases production of interleukin-1 and tumor necrosis factor by human mononuclear cells. Cytokine 1991, 3, 189–194. [Google Scholar] [CrossRef] [PubMed]
  52. Entzian, P.; Linnemann, K.; Schlaak, M.; Zabel, P. Obstructive sleep apnea syndrome and circadian rhytms of hormones and cytokines. Am. J. Respir. Crit. Care 1996, 153, 1080–1086. [Google Scholar] [CrossRef] [PubMed]
Figure 1. Serum cortisol levels (mg/L) assessed at 2.00 and 8.00 am in controls and OSA patients.
Biologics 04 00004 g001
Table 1. Demographic and anthropometric characteristics of the study population. The data are shown as mean ± SD. All the comparisons between the groups resulted in no significant differences.
Controls (n = 6)m-OSA (n = 20)MS-OSA (n = 16)p Value
Sex (F/M)3/312/89/7>0.05
Age (months)81.53 ± 40.7486 ± 878 ± 12>0.05
BMI (kg/m2)17.05 ± 2.5716.9 ± 0.517.1 ± 0.8>0.05
BMI (percentile)48.7 ± 6.754.7 ± 6.851.9 ± 7.6>0.05
Table 2. In vitro IL-1β and TNF-α production by PBMCs at 2.00 am and 8.00 am in cultures unstimulated versus stimulated by PHA. Values are shown as medians (interquartile range).
2 am8 am
UnstimulatedPHAUnstimulatedPHA
IL-1βm-OSA87.2 (38.3–330.6) pg/mL318.1 (193.4–492) pg/mL71.0 (47.2–138.5) pg/mL317.4 (245.8–460.8) pg/mL
Controls49.0 (34.8–135.4) pg/mL233.2 (131.1–334.6) pg/mL, 71.0 (52.5–89.1) pg/mL313.9 (217.9–368.3) pg/mL
MS-OSA54.9 (41.2–177.3) pg/mL189.5 (135.5–276.2) pg/mL62.3 (60.1–321.8) pg/mL502.9 (231.0–533.3) pg/mL
All patients49.0 (34.8–267.2) pg/mL276.2 (135.5–344.3) pg/mL71.0 (52.5–199.0) pg/mL317.4 (197.6–525.7) pg/mL
TNF-am-OSA44.2 (17.1–105.1) pg/mL226.6 (176.1–341.8) pg/mL17.9 (10.8–46.0) pg/mL276.7 (188.9–344.7) pg/mL
Controls46.8 (18.0–47.9) pg/mL321.4 (182.3–360.6) pg/mL16.4 (10.8–17.8) pg/mL289.4 (210.8–307.8) pg/mL
MS-OSA32.7 (6.7–55.2) pg/mL79.7 (70.5–120.2) pg/mL17.8 (13.5–25.2) pg/mL105.4 (75.2–190.7) pg/mL
All patients45.9 (8.4–55.2) pg/mL220.5 (82.9–360.6) pg/mL16.5 (10.4–25.2) pg/mL262.4 (116.6–298.6) pg/mL
Table 3. Results of the statistical tests performed to compare the values obtained from unstimulated cultures and those obtained from cultures stimulated with PHA at the different considered time points. The comparison between unstimulated and stimulated cultures is carried out using a Wilcoxon signed-rank test, whereas the comparison of unstimulated (or PHA) cultures at 2 am vs. 8 am is carried out through an ANOVA test for repeated measures. ↑ indicates increased median production, ↓ indicates a reduced median production. Median values are reported in Table 2. Significant results (p-value < 0.05) are marked with a *.
Comparison between Conditions (p-Values)
Unstimulated vs. PHA—2amUnstimulated vs. PHA—8 am2 am vs. 8 am—Unstimulated2 am vs. 8 am—PHA
IL-1βm-OSA↑ (p = 0.028) *↑ (p = 0.018) *↓ (p = 0.214)↓ (p = 0.15)
Controls↑ (p = 0.043) *↑ (p = 0.043) *↑ (p = 0.39)↑ (p = 0.021) *
MS-OSA↑ (p = 0.068)↑ (p = 0.08)↑ (p = 0.84)↑ (p = 0.72)
All Patients↑ (p = 0.001) *↑ (p < 0.01) *↑ (p = 0.4)↑ (p = 0.11)
TNF-αm-OSA↑ (p = 0.028) *↑ (p = 0.028) *↓ (p = 0.073)↑ (p = 0.16)
Controls↑ (p = 0.027) *↑ (p = 0.027) *↓ (p = 0.058)↓ (p = 0.95)
MS-OSA↑ (p = 0.046) *↑ (p = 0.046) *↓ (p = 0.27)↑ (p = 0.94)
All Patients↑ (p < 0.01) *↑ (p < 0.01) *↓ (p = 0.01) *↑ (p = 0.33)
Disclaimer/Publisher’s Note: The statements, opinions and data contained in all publications are solely those of the individual author(s) and contributor(s) and not of MDPI and/or the editor(s). MDPI and/or the editor(s) disclaim responsibility for any injury to people or property resulting from any ideas, methods, instructions or products referred to in the content.

