
Plant Endemism Centres and Biodiversity Hotspots in Greece
by
 , , ,
, , ,
Konstantinos Kougioumoutzis
1,2,3,*,† ,
,
Ioannis P. Kokkoris
1,†,
Maria Panitsa
1,
Athanasios Kallimanis
3,
Arne Strid
4 and
Panayotis Dimopoulos
1 1
Division of Plant Biology, Laboratory of Botany, Department of Biology, University of Patras, 26504 Patras, Greece
2
Department of Ecology and Systematics, Faculty of Biology, National and Kapodistrian University of Athens, Panepistimiopolis, 15701 Athens, Greece
3
Department of Ecology, School of Biology, Aristotle University of Thessaloniki, 54124 Thessaloniki, Greece
4
Bakkevej 6, DK-5853 Ørbæk, Denmark
*
Author to whom correspondence should be addressed.
†
These authors contributed equally to this work.
Biology 2021, 10(2), 72; https://0-doi-org.brum.beds.ac.uk/10.3390/biology10020072
Submission received: 3 December 2020
/
Revised: 11 January 2021
/
Accepted: 17 January 2021
/
Published: 20 January 2021
(This article belongs to the Section Conservation Biology and Biodiversity)
Abstract
:Simple Summary
Aiming to cope with the provisions of Aichi Biodiversity Targets, EU Biodiversity Strategy and EU Green Deal, we conducted the first nationwide, phylogenetically informed identification of vascular plant diversity hotspots and endemism centres in Greece. By this, we identified the most important factors that shaped them, and assessed the effectiveness of the Special Areas of Conservation of the Natura 2000 network in safeguarding them. Qualitative and quantitative results are provided and presented in thematic maps and relevant diagrams, highlighting areas of conservation importance, and identifying current protection scheme gaps. Simultaneously, our work contributes to national efforts for drafting Natura 2000 sites Management Plans, as well as to the MAES implementation in Greece.
Abstract
Biodiversity hotspots (BH) cover a small fraction of the Earth’s surface, yet host numerous endemics. Human-induced biodiversity loss has been increasing worldwide, despite attempts to halt the extinction crisis. There is thus an urgent need to efficiently allocate the available conservation funds in an optimised conservation prioritization scheme. Identifying BH and endemism centres (EC) is therefore a valuable tool in conservation prioritization and planning. Even though Greece is one of the most plant species-rich European countries, few studies have dealt with the identification of BH or EC and none has ever incorporated phylogenetic information or extended to the national scale. Consequently, we are unaware of the extent that Special Areas of Conservation (SAC) of the Natura 2000 network efficiently protect Greek plant diversity. Here, we located for the first time at a national scale and in a phylogenetic framework, the areas serving as BH and EC, and assessed the effectiveness of the Greek SAC in safeguarding them. BH and EC are mainly located near mountainous areas, and in areas supposedly floristically impoverished, such as the central Aegean islands. A critical re-assessment of the Greek SAC might be needed to minimize the extinction risk of the Greek endemics, by focusing the conservation efforts also on the BH and EC that fall outside the established Greek SAC.
1. Introduction
Nearly 430,000 plant species occur on Earth [1]. Their distribution is uneven [2], due to historical and ecoevolutionary processes [3]. As a consequence, few areas or countries are mega-diverse in terms of overall plant species richness and few countries host more than 1000 endemic species [4,5]. These mega-diverse areas, which may include several countries or be part of a single country, experience intense anthropogenic pressure [5] and have been recognised as global biodiversity hotspots [6,7], since they exhibit exceptionally high plant species richness, high endemism levels and face very high levels of human-induced threat [7]. Climatically stable areas [8] may coincide with these global biodiversity hotspots, thus constituting macrorefugia [9] and more often than not, have high irreplaceability values (a measure of the conservation value of a given area [10,11]). Global biodiversity hotspots cover less than 20% of Earth’s surface, yet ca. 80% of all plant species are confined there [6,7], being thus extremely important in terms of conservation priority and even more so, in the Anthropocene era [12], which is characterised by elevated extinction rates [13,14,15]. In the last two centuries, species extinctions and biotic homogenization have been rapidly increasing [5,16], due to the synergistic effects of climate and land-use change [17,18,19] with evident spatiotemporal patterns [5], eventually leading also to an observable decline in ecosystem services. This homogenization and biodiversity deterioration trend is detected all over the globe [20,21,22], at all scales [18] and facets of biodiversity [23,24], despite plants’ innate resilience to extinction [25] (but see [26]).
In order to halt this trend, the Conservation on Biological Diversity set the Aichi Targets, among which the Targets 11 and 12 that aim to establish the minimum threshold of the percentage of terrestrial land under some form of protection and avert the extinction of known threatened species, respectively [27]. However, current conservation strategies have been inefficient regarding the prevention of biodiversity decline [28], since most conservation funds have been allocated in information gathering instead of recovery actions [29], but this inefficiency might also be a result of ecological time-lags [30]. Either way, the Aichi Targets might need to be re-evaluated when drawing the post-2020 biodiversity conservation agenda [31]. Due to the limited economic resources and the CBD’s ‘soft law’ approach [32], we are currently in urgent need to efficiently allocate the available conservation funds in an optimised and cost-effective conservation prioritization scheme [33,34,35]. These efforts should be accelerated [36,37] due to the intensifying negative effects of climate and land-use change on biodiversity world-wide [17,18,20,38,39]. In this regard, the identification of regional biodiversity hotspots (areas with elevated native and endemic species richness within global biodiversity hotspots [40]) and endemism centres (i.e., areas with significantly higher number of endemics than the surrounding landscape [41]) has been a useful and effective tool in conservation prioritization and planning [42,43,44]. However, the focus of conservation efforts may sometimes overlook such areas (e.g., [45]), so it is crucial that prioritization schemes are aimed at areas where the intersection between the different facets of biodiversity (i.e., taxonomic, phylogenetic and functional) is high [46] and at fine spatial scales [40], since endemism patterns are strongly scale dependent [41,47]. Spatial phylogenetics [48] via the incorporation of phylogenetic information (e.g., [49]), aid our understanding of the spatial biodiversity and endemism patterns and enable the effective design of conservation schemes [49,50,51,52,53,54], as well as elucidate the biogeographical origin of the area under study [46,50,55].
Five of the global biodiversity hotspots include islands or archipelagos [6,7], one of them being the Mediterranean Basin with its ca. 10,000 islands and islets. The latter constitutes the second largest hotspot in the world [56], with its largest islands exhibiting up to 18% plant endemism, which reaches up to 40% in their (sub-)alpine zones [57]. Several biogeographical and biodiversity studies have been undertaken in the Mediterranean Basin (e.g., [58,59,60,61,62,63,64,65]), yet few of them have dealt with the identification of phylogenetically-informed endemism centres and have been conducted at the subnational scale [22,66,67,68,69].
Greece (Figure 1) is one of the most species-rich European countries [70], since more than 7000 native plant taxa occur there, with ca. 20% being endemic [70,71]. This high diversity and endemism are due to its topographical complexity, as Greece hosts ca. 8000 islands and islets and ca. 4800 mountain-tops [72,73], as well as to its long paleogeographical history [74,75,76,77]. Modern botanical exploration in Greece dates back to the 18th century [78,79] and a wealth of studies have been undertaken regarding the biogeography and the biodiversity patterns in Greece and its constituent archipelagos (i.e., the Aegean and the Ionian archipelagos [80,81,82,83,84,85,86,87,88,89,90,91,92,93,94,95,96,97,98,99,100,101,102,103,104,105,106,107,108,109,110,111,112,113,114]). Recent advances have addressed the Wallacean shortfall (i.e., the lack of knowledge on the geographical distribution of species) in Greece (e.g., [73,115,116,117,118,119,120]; Flora Hellenica Database (ongoing): ca. 1.2 M records). To date, very few studies have applied phylogenetic diversity metrics to macroecological analyses in Greece [22,103,121,122]. Equally few studies have dealt with the identification of regional biodiversity hotspots or endemism centres in Greece and they have been conducted at either a very coarse spatial scale or at the subnational level [22,116,123,124]. Furthermore, few studies exist regarding biodiversity conservation assessment and the efficiency of the protected areas network in Greece [125,126,127,128,129], yet none of them has incorporated any phylogenetic metrics in conservation prioritization analyses. Taking into consideration the ongoing progress on drafting species’ and habitats’ action plans and area-prioritization efforts inside Natura 2000 Special Areas of Conservation (SACs), the timing seems ideal for the first national, fine-scale and phylogenetically informed identification of biodiversity hotspots and endemism centres in Greece.
Our general goal is to improve the understanding of areas and patterns of endemism, biodiversity and biogeography based on a variety of spatially derived and phylogenetically informed metrics. More specifically, we aim to: (i) identify regional biodiversity hotspots and centres of endemism in Greece, (ii) investigate the factors leading to their creation and (iii) assess if and to what extent these areas are covered by SACs in Greece.
2. Materials and Methods
2.1. Environmental Data
Climatic data were obtained from the WorldClim [131] and the ENVIREM [132] databases at a ~5 km resolution. We extracted soil pH data from the SoilGrids database [133]. We extracted altitudinal and ruggedness data from the CGIAR-CSI database [134] and from [135], respectively. Since these data have a different resolution than the climatic data, we used functions from the ”raster” 2.6.7 R package [136] to aggregate and resample them in order for all environmental variables to have the same resolution. We then used functions from the “raster” 2.6.7 [136] and the ”spatialEco” 1.2-0 [137] R packages to estimate supplementary topographical variables (aspect, heat load index, slope, topographic position index and terrain ruggedness index) based on the altitudinal data. Geological data were derived from the 1:500,000 scale Geological Map of Greece [138] and classified as calcareous/not calcareous. As a measure of human impact, we used the Global Human Modification Index [139].
Following [140], we extracted paleoclimatic data from Paleoclim [141] and Oscillayers [142] and by using functions from the “climateStability” 0.1.1 R package [140], we were able to identify climatically stable areas in Greece (in terms of temperature, precipitation and their interaction-sensu [140]) for the past 4 My. We defined climate refugia as the 10% of cells (i.e., the 90% percentile) that had the highest score for the climate stability index.
From this initial set of 47 predictors, only thirteen (altitude, aspect, climate stability, heat load index, isothermality, potential evapotranspiration of the driest quarter, potential evapotranspiration of the wettest quarter, precipitation stability, slope, soil pH, the Thornthwaite aridity index and the topographic position index) did not have a collinearity problem (Spearman rank correlation < 0.7 and VIF < 10 [143]) and were thus included in our analyses. We used the “vifcor” function from the “usdm” 1.1.18 R package [144] to assess multicollinearity. All predictors were centred to a mean of zero and scaled to a standard deviation of one prior to the analysis [145], so as to enhance the comparability of parameter estimates in the subsequent analyses.
2.2. Species Occurrence Data
Greece hosts 7043 native plant taxa, 1435 of which are Greek endemics [70,71]. All subsequent analyses are based on the most extensive and detailed database of plants occurring in Greece [ca. 1.2 M occurrences—Flora Hellenica Database, Strid (continuously updated)]. All plant taxa were cross-checked for synonyms, following the nomenclature proposed by [70,71]. We used a grid cell resolution of ~5 km to match the resolution of the predictor variables, since preliminary tests indicated that this cell size delivered acceptable results considering the abrupt environmental gradients, high geodiversity and high endemic diversity characterising Greece. All subsequent analyses are based on the native and Greek endemic taxa that occur in Greece.
We calculated the number of native and Greek endemic taxa occurring in each grid cell (SR and ER, respectively). In order to put more emphasis on the range-restricted species (endemic or not), we also calculated the weighted endemism index (WE), as well as its corrected weighted variant (CWE [41,42,43]), using the functions provided from [146]. In WE, species are inversely weighted by their range size [147]. Consequently, CWE is the WE score divided by the SR (or ER) score. As a result, cells containing more range-restricted species will have a higher WE and/or CWE score than cells with fewer such species, thus providing crucial information regarding areas with exceptionally high diversity that can be regarded as biodiversity hotspots [42,43]. WE and CWE are thus range-weighted metrics and are consequently scale-dependent. We assessed the statistical significance of WE and CWE for both SR and ER by comparing the raw values of each grid cell to the 999 values of a null distribution, using the functions provided from [147]. As WE is usually strongly correlated with SR [41,148], we focused on CWE, which performs better in detecting biodiversity hotspots even when SR is not high [149]. We defined CWE, SR and ER diversity hotspots as the 1%, 5% and 10% of cells (i.e., the 99%, 95% and 90% percentile; L1, L2 and L3 diversity hotspots, respectively) that had the highest score for each of these indices. In a similar manner, we defined CWE diversity coldspots for the 1%, 5% and 10% percentile, using functions from the “phyloregion” [47,150,151] R package. Biodiversity hotspots are herein and hereafter defined as regional biodiversity hotspots (i.e., hotspots within global biodiversity hotspots [40]).
2.3. Phylogenetic Tree
A phylogenetic tree was generated following a “supertree” approach for all the taxa occurring in Greece, based on the phylogeny of seed plants by [152,153], using the largest dated mega-tree for vascular plants (GBOTB [153]). We appended any taxa present in Greece, but missing from the phylogeny, by adding them next to a randomly selected congener (except for the subspecies, which were added to the species they belong to), following [154] and [155], using the R code provided by [154] (https://github.com/oliverpurschke/sPlot_Phylogeny), as this procedure does not add any bias to subsequent analyses [154,155,156] and does not affect community-level phylogenetic metrics [157,158].
2.4. Biodiversity Analyses
We followed the categorical analyses of neo- and paleo-endemism (CANAPE) protocol for spatial phylogenetic analyses as set out in [48,159]. This procedure provides concrete insights regarding the evolutionary mechanisms that define biotas and enables solid and reliable conservation assessment and prioritization [160]. We carried out all the relevant analyses in Biodiverse version 3.0 [159] only for the Greek endemic plant taxa. We estimated phylogenetic endemism [161] and relative phylogenetic endemism [48], the core CANAPE metrics, and assessed their statistical significance using a null model in Biodiverse (i.e., the “rand_structured” option) as suggested by [48].
CANAPE characterizes grid cells into four different types of endemism centres: neo-, paleo-, mixed- and super-centres of endemism. Paleo- and neo-endemism centres have significantly high or low values respective to the relative phylogenetic endemism ratio (restricted long or short branches), respectively [48]. Mixed-endemism centres have a high percentage of both rare long and short branches, while super-endemism centres are a subdivision of mixed-endemism centres at the α = 0.1 level [48] (see Supplementary Materials for a thorough and in-depth explanation of the CANAPE protocol).
All analyses were performed using Perl wrapper functions to run Biodiverse in R modified from https://github.com/NunzioKnerr/biodiverse_pipeline.
2.5. Spatial Autoregressive Models
We used spatial autoregressive models with spatially autocorrelated errors (SAR) as outlined in [162], which take into consideration the spatial autocorrelation in parameter estimation [163], to investigate the relationships between the biodiversity indices we included in our analyses [i.e., number of native and endemic taxa (SR and ER, respectively), corrected weighted endemism of the native and the endemic taxa (CWENAT and CWEEND, respectively), as well as phylogenetic endemism and relative phylogenetic endemism of the endemic taxa (PE and RPE, respectively)] with the uncorrelated predictors we included in our analyses. We used correlograms of the residuals of both SAR and generalized linear models to infer the degree of spatial autocorrelation [163], using functions from the “spdep” 1.1.3 R package [164]. The number of neighbours for SAR, as well as subsequent model selection was based on the lowest corrected Akaike information criterion (AICc [162]) value.
2.6. SACs Overlap
Traditionally, Priority Hotspots are defined based on the intersection of SR and CWE/WE hotspots [165]. We defined Priority Hotspots as any cells belonging to the top 1%, 5% and 10% of cells that had the highest score for both the CWEEND and PE indices, the two geographically-weighted variants of taxonomic and phylogenetic species richness, respectively. By doing so, we take into account two different facets of biodiversity, the geographically-weighted variants taxonomic and phylogenetic components of biodiversity, which more accurately identify biodiversity hotspots [42,43,48].
We overlapped the CWEEND hotspots, the areas identified as endemism centres, as well as the Priority Hotspots as previously defined with the Natura 2000 SACs (including SACs which are also Special Protection Areas, i.e., SAC/SPA) in Greece using R 4.0.3 and QGIS 3.14 in a Geographical Information Systems (GIS) analysis framework, in order to identify conservation gaps following [165]. SACs exclusively related to marine protection were excluded. Any cells identified as Priority Hotspots for both percentiles included in our analyses not covered by SACs (or their coverage was <10% [166]), were defined as Priority conservation gaps following [165].
3. Results
3.1. Biodiversity Hotspots and Centres of Endemism in Greece
Endemic species richness (ER) was higher in southern Greece, being highest in the Lefka Ori mountain range located in western Crete (Figure 2). Other mountain ranges in Crete, in northern and southern Peloponnese, as well as Mt. Parnassos in Sterea Ellas, exhibited high ER values (Figure 2). On the other hand, most of mainland Greece and the Ionian islands had very low ER values (Figure 2). Native species richness (SR) was higher in northern Greece, being highest in Mt. Timfristos in Sterea Ellas (Figure 3). Other areas with high SR values are mainly found in northern Greece, such as the Vikos gorge (in the N Pindos mountain range), the wider Lake Prespa area, Mts. Cholomon and Chortiatis in Chalkidiki peninsula, Mt. Falakron in NE Greece, as well as the central Aegean island of Naxos (Figure 3). The central and southern Aegean islands had higher SR values than most low-elevation mainland areas and the Ionian islands (Figure 3).
CWE values for the endemic taxa (CWEEND) ranged between 0 and 8.25, the highest value found on Mt. Taygetos in southern Peloponnese (Figure 4). Most L1-L3 CWEEND hotspots occurred in high-elevation areas in Crete and the Peloponnese (Figure 5, Figures S1 and S2). Most CWEEND coldspots occurred in mainland Greece near the Thessalian plain, in Evvia and western Peloponnese regarding L1 CWEEND coldspots (Figure 5) and central and northern Greece in general, regarding L2-L3 CWEEND coldspots (Figures S1 and S2). Important L1 CWEEND hotspots occurred on Mts. Oiti and Parnassos, on Mts. Olympus and Athos, on Mt. Vourinos [the only L1 CWEEND hotspot on ultramafic rocks (i.e., with silica content below 45% and a high concentration of heavy metals [167])], as well as Samos and Samothraki (Figure 5). Several Aegean islands (Amorgos, Antikythera, Astypalaea, Crete, Folegandros, Ikaria, Karpathos, Kythera, Lesvos, Naxos, Rodos, Samos, Samothraki, Skyros, Symi and Thasos) and only one Ionian island (Kephallinia) emerged as L2-L3 CWEEND hotspots (Figures S1 and S2). Most L1 CWEEND hotspots had significantly high values according to the randomization tests (Figure S3). CWE values for the native taxa (CWENAT) ranged between 0 and 24.38, the highest value found on Mt. Pangeon in NE Greece (Figure 6), followed by Mts. Falakron and Voras (Kajmakcalan) in NE Greece and Vikos gorge in Epirus. Every high CWENAT area had significantly high values according to the randomization tests (Figure S4), while some central and northern Aegean islands, as well as Crete, had significantly low values according to the randomization tests (Figure S4).
The endemism centres were mainly concentrated within and at the periphery of the Greek mountain massifs (Figure 7). Areas of mixed-endemism were the most common, followed by neo-, paleo- and super-endemism areas (301, 89, 54 and 13, respectively; Figure 7). Excluding the insignificant endemism centres, mixed-endemism areas were the most species-rich, while paleo-endemism areas were the poorest in terms of species richness (Table S1). At the family level, Asteraceae had the most species occurring in a single endemism centre type, followed by Caryophyllaceae and Plumbaginaceae (Figure 8A). At the genus level, Limonium had the most species occurring in a single endemism centre type, followed by Centaurea, Hieracium and Campanula (Figure 8B). Most neo-endemics belong to Asteraceae and Plumbaginaceae (Figure 8A), with Hieracium and Limonium being the most species-rich in neo-endemics (Figure 8B).
3.2. Characteristics of Endemism Centres
Centres of neo-endemism occurred at a significantly lower altitude than all other types of endemism centres (Kruskal–Wallis ANOVA: H = 4000, df = 4000, p = 0.2; Table S2; Figure 9A) and in climatically-stable areas (Figure S5). Paleo-endemism centres had significantly lower climate stability values than all other types of endemism centres (Kruskal–Wallis ANOVA: H = 4000, df = 4000, p < 0.1; Table S2; Figure 9B). Regarding human impact, neo- and super-endemism centres experienced the highest and lowest impacts of human disturbance, respectively (Kruskal–Wallis ANOVA: H = 4000, df = 4000, p = 0.5; Table S2; Figure 9C). Finally, paleo-endemism areas occurred in southern and western Greece compared to neo-endemism areas, which occurred in northern and eastern Greece (Kruskal–Wallis ANOVA: H = 400, df = 200, p < 0.01; Table S2; Figure 7).
3.3. Factors Shaping Biodiversity Hotspots and Endemism Centres
Elevation was the most important predictor of all the biodiversity indices we included in our analyses, except for phylogenetic endemism (PE), with Nagelkerke pseudo-R-squared (GR2) ranging between 18.1% and 48.0% (Table 1). Climate-related variables (e.g., aridity, evapotranspiration of the driest quarter, climate stability) usually followed elevation in variable significance for SR, ER, CWEEND, CWENAT and RPE (Table 1). Regarding PE, evapotranspiration of the driest quarter was the most important variable, followed by the occurrence of calcareous rocks (Table 1).
3.4. Overlap with SACs
The overlap between the SACs of Greece and endemism centres detected by CANAPE was rather high and ranged between 38.9% and 84.5% (when excluding the insignificant endemism centres; Table S3; Figure S6). The overlap between the SACs in Greece and the CWEEND hotspots was in general higher than that reported for endemism centres and ranged between 72.2% and 95.7%, depending on the percentile threshold used to define L1-L3 hotspots (Table S5; Figure 5). The same trend was observed for the overlap between SACs in Greece and the areas recognized as Priority hotspots (Table S4; Figure 10, Figures S7 and S8). The conservation gaps in Greece thus range from 3.3% to 61.1% (Tables S3 and S4).
4. Discussion
The Mediterranean Basin is one the richest and largest biodiversity hotspots in the world, due to its rugged topography and its intricate geography and orography since the Palaeocene [168]. The Iberian, Italian and Balkan peninsulas have largely shaped the region’s biogeographical patterns [169,170], as a result of complex interactions between geographical, topographical and climatic factors [170,171,172,173,174,175], which led to the occurrence of numerous refugia that fostered both the persistence, as well as the diversification of several species [176,177,178,179]. More specifically, the Balkan Peninsula due to its patchy and mountainous landscape, has provided shelter to several cold- and warm-adapted species [180,181,182] of usually relict origin [173], while allowing a westward migration from Asia to Europe during climatic oscillations and in-situ speciation [183,184,185,186,187], thus eventually leading to its currently observed high endemism rates [188,189,190]. Greece stands out as one of the most diverse Mediterranean and European countries in terms of plant species richness and has a rich and long floristic exploration record, with many of its northern mountain massifs probably acting as refugia [70]. Here, we located for the first time at a national scale, the areas serving as biodiversity hotspots, as well as the areas that act as diversity cradles and museums (centres of neo- and paleo-endemism, respectively), identified the most important factors that shaped them, and assessed the effectiveness of the Special Areas of Conservation of the Natura 2000 network in safeguarding these areas. By doing so, we moved one step towards the completion of Aichi Biodiversity Target 11 in Greece.
4.1. Biodiversity Hotspots in Greece
A large number of Greek mountains, as well as some Aegean islands are among the main Mediterranean and Balkan biodiversity hotspots [191] and are rich in endemics [123,190,192]. This is more pronounced in the southern Greek mainland and Crete: the Peloponnese hosts the most Greek endemic species [70,71,89,193], while Crete constitutes the hottest endemic island hotspot in the Mediterranean [57]. Islands and island regions in general were thought to be poorer in terms of species richness compared to the Greek mainland, due to the area-effect and the existence of a more ‘balanced’ continental flora [111,194,195]. More specifically, the central Aegean islands were considered as having an impoverished flora due to the ”Kykladenfenster” phenomenon (i.e., the absence of certain plant taxa from the central Aegean islands that are present in mainland Greece and Asia Minor) [195] and even though there are cracks to this view [92,111,112,114], it has not yet been established [115]. Overall, endemism rate seems to decline in a NW-SE axis, with a small fraction of narrow endemics occurring above 1500 m a.s.l. [193,196,197] and elevation-driven isolation has played a significant role in shaping the patterns of endemic species richness in southern mainland and insular Greece [22,89,90,91,94].
Generally, higher and drier areas host more native and endemic plant taxa in Greece (Table S3, Figure 2, Figure 3, Figure 4 and Figure 6), with native and endemic species richness being higher in northern and southern Greece, respectively (Figure 2 and Figure 3). Elevation emerged as the most important predictor for all the taxonomic diversity metrics (unweighted or weighted; ER/CWEEND and SR/CWENAT) spatial patterns in Greece, and several mountain ranges materialised as the main (native or endemic) diversity centres in Greece. This pattern has been observed at the local scale in Greece [22,84,90,91,93,114] and at the regional scale, in areas such as the Iberian Peninsula [198,199], Mexico [200], New Zealand [201] and Iran [202], as well as at the global scale [203]. Increased topographical complexity, along with stable climatic conditions during the Quaternary stadials and interstadials, may have triggered ecological speciation, while reducing extinction risk and gene flow, thus promoting allopatric speciation and in the same time allowing the persistence of warm-adapted species [191,202,203,204,205,206,207]. According to the Mountain-Geobiodiversity-Hypothesis (MGH [208]), mountain formation and uplift determine regional biodiversity patterns by providing refugia and an increased chance of allopatric speciation if in a given mountain massif: (i) steep environmental gradients along its elevational range exist, (ii) Quaternary climatic oscillations that aided the ‘species-pump’ effect were recorded and (iii) its terrain is highly rugged. During more favourable conditions (e.g., during the interstadials) plant species would have tracked their niche [209,210] and based on the possibility of connectivity among sites on a given mountain massif, diversification might have increased (Flickering Connectivity Hypothesis [211]). This seems to be the case in Greece as well, since several mountain ranges were identified as biodiversity hotspots, the most prominent of which being the Lefka Ori mountain range in Crete regarding the endemic plant taxa (Figure 4) and Mt. Pangeon in NE Greece regarding the native plant taxa (Figure 6). Many Greek mountain massifs, such as the Pindos mountain range, are included among the most important Mediterranean glacial refugia [182] and in this context, Mt. Pangeon has acted as a local refugium for some relict (microthermic) species [212], while other mountainous areas in central Greece served as refugia for Tertiary relicts [70,184], for primitive Caryophyllaceae taxa [213] and for xerothermic species [214,215]; the latter due to the occurrence of ultramafic rocks [98,123,216]. One such mountain is Mt. Vourinos, a serpentine “island” in the limestone-dominated valley of Thessalia [123], which is among the areas with statistically significant higher CWENAT values and constitutes the only L1 CWEEND hotspot on ultramafic rocks (Figure 5); all other L1 CWEEND hotspots occur on calcareous substrates, since Greek endemics seem to be in most cases habitat specialists, preferably occurring on limestone cliffs [70,199], probably due to human-induced pressure [217,218].
The southern Greek mainland, as well as Crete, were thought to be regional endemic hotspots, while the rate of endemism in northern Greek mainland was considered to be significantly lower compared to the Peloponnese and the southern Aegean islands [70,71,90,193,219]. Mt. Taygetos, the highest and one of the most topographically complex Peloponnesian mountains, abides to this notion, since it emerged as the most important CWEEND area in Greece, probably as a result of the peninsular effect and of ecological isolation [89,213,219]. This seems superficially in harmony with what has been perceived as the norm regarding the endemism patterns in Greece [193]. Our findings, however, paint a slightly different picture, as several northern mainland mountains, such as Parnassos, Oiti, Olympus and Athos are identified as L1 CWEEND hotspots (Figure 5), along with the Cretan and the Peloponnesian mountain massifs. This phenomenon becomes more evident, when considering L2 and L3 CWEEND hotspots (Figures S1 and S2), as most of these hotspots occur in central and northern mainland Greece. This may be linked to the MGH and FCH hypotheses [208,211,220], as well as to the fact that most of these mountains have acted as Quaternary refugia for many relict species [70,182,184] and as diversity cradles probably due to numerous hybridization events (e.g., as in the genus Hieracium [221,222,223]) and elevation-driven ecological isolation [203,223,224]. Several Aegean islands are also identified as L1 CWEEND hotspots, confirming previous studies stating that some of the central and eastern Aegean islands are important Greek endemic hotspots [84,88,114], while also lending weight to the rebuttal of the impoverishment of the central Aegean flora [195]. Even when taking into consideration the native flora, most central Aegean islands have higher native species richness than most lowland mainland areas (Figure 3) and only Andros and Syros seem to have statistically significant lower CWENAT values (Figure S4). These incongruences might be partly due to the different methodologies used, in addition to the quality of the data at hand: we used the most extensive occurrence database to date regarding the native plant taxa occurring in Greece and the CWE metric that puts more emphasis on range-restricted species, thus being more reliable in detecting biodiversity hotspots [41,42,43].
4.2. Endemism Centres in Greece
Mountains may promote or hinder species dispersal depending on the ease of connectivity [211] and by doing so, they can increase the diversification rate either by reducing gene-flow or by providing the ground for intense hybridization and polyploidization events [220,225]. Even though mountain radiations mainly occurred during the Pleistocene [226,227], some may have occurred during the Pliocene [220]. Balkan Mountains constitute the main Pleistocenic refugia for several Tertiary relics [228,229], are regarded as genetic diversification havens [176,178,186] and seem to have shaped the diversification of several species complexes [187,191]. The Greek mountains are no exception to this rule [230], as they host numerous Tertiary relicts [70,182,184], providing shelter either to cold- or warm-adapted species during the climatic oscillations of the Pleistocene [214,215,231] and have given rise to several narrow endemics [191,219]. Our results corroborate this hypothesis, since in Greece, the species-rich, mixed-endemism centres dominate (Table S1; Figure 7 and Figure 9) and most endemism centres occur in or near montane regions (Figure 7 and Figure 9), suggesting that the Greek mountains act both as diversity cradles and museums—A trend observed elsewhere as well [51,53,200,232,233]. Several mixed- and paleo-endemism centres occur in the N and S Pindos mountain range in northern and central Greece (Figure 7), thus confirming the hypothesis that it constitutes a major endemism centre and phylogeographical hotspot in the Mediterranean Basin [182]. More specifically, Mts. Parnassos and Oiti in central Greece have a high concentration of mixed-endemism centres (Figure 7), probably a result of their geographical setting and topographical heterogeneity, serving as stepping stones between two major Mediterranean diversity hotspots, namely the Peloponnese and the Pindos mountain chain [190]. Mt. Olympus, the highest mountain in Greece, also forms an important endemism centre (Figure 7), as several local endemics and Tertiary relics occur there, such as Jankaea heldreichii [70,234].
Paleo-endemism centres tend to occur in lower latitudes, higher altitudes and in less climatically stable areas in Greece than neo-endemism centres (Table S2; Figure 7 and Figure 9). This might be due to elevation-driven ecological isolation [90,207,223], the increased ruggedness of the southern mainland and insular Greek mountains [90,219], their long-lasting geographical isolation and the existence of Pliocenic islands that now constitute large mountain chains (as in the case of Crete [22]) that may have reduced gene-flow, thus enabling the persistence of those paleo-endemic species, a phenomenon observed elsewhere as well [233]. On the other hand, neo-endemism centres occur in sites of greater climatic stability and intense human pressure (Table S2; Figure 7, Figure 9 and Figure S5) and are mainly found in NE lowland Greece and to a lesser degree, in southern Peloponnese, Evvia and in other few Aegean islands (Figure 7). Our results align with the hypothesis that low climate-change velocity areas may be linked with the existence of neo-endemism centres [235,236], since long-term climate refugia promote speciation [236,237,238]. Another important factor in shaping neo-endemism centres in Mediterranean-type ecosystems is aridification and dry climate conditions in general [68,199,239,240], as the intensification of summer drought since the Pliocene, resulted in increased spatial and genetic isolation [59,168,184,210] and subsequent accelerated speciation of numerous species complexes in the Mediterranean [53,241,242,243]. This seems to be the case in Greece as well, since aridity and dry climatic conditions in general (Table 1) drive RPE patterns and may explain the existence of several neo-endemism centres in areas experiencing such conditions, viz. the lowlands in NE Greece and the coasts of some central Aegean islands (i.e., Paros, Naxos and Astypalaea—Figure 7), where recent radiations occurred for many species complexes, such as Limonium [242], Nigella [244,245,246] or Hieracium [221,222] spp. The southern Peloponnesian lowlands also contain neo-endemism centres, and this might be ascribed to their older geological age and their elevated ecological isolation due to the sea-barrier existing in their south and the large mountain massifs that lie to their north [89,219]. The neo-endemism centres that lie in Evvia (Figure 7) may be linked to the vast outcrops of ultramafic rocks, which have largely driven the evolution of many plant lineages [98,122,213,214].
4.3. Conservation Prioritization–Management Implications
A central aim of conservation biology is the identification of biodiversity hotspots, i.e., areas with a relative high species richness and endemism, which pinpoint underlying ecological and evolutionary patters and processes [247], at global and regional scales, with the latter termed ”hotspots-within-hotspots” [40]. This process enables the efficient and cost-effective conservation management of biodiversity by deftly allocating the limited available resources (e.g., [248]). The identification of biodiversity hotspots relies at its core on species-level metrics, such as species richness (e.g., endemic and threatened species richness) [7,249,250], so that the identification of endemism centres is crucial for regional conservation planning.
Most Greek endemic plant taxa have a narrow distribution and are considered threatened [195,251]. The established Greek SACs cover up to ca. 28% of the country’s area [252] and seem to adequately protect the endemism and diversity centres, when considering CWEEND values (Table S3; Figure 5). In this regard, the conservation gap in Greece might seem minimal. However, it is pivotal for prioritization schemes to search for areas where there is high intersection between different facets of biodiversity (e.g., taxonomic and phylogenetic) [46] and thus relying only on one of these facets [165], may be misleading regarding the protection and conservation status of the areas identified as biodiversity hotspots. By using the Priority Hotspots metric as defined herein, we were able to overcome this predicament. Our results suggest that the conservation gap in Greece is actually not minimal, as suggested by the CWE metric, but instead it is quite significant (Table S4; Figures S6 and S7), at least for the L2-L3 Priority Hotspots. Despite the fact that the overlap between the SACs and the Priority Hotspots identified in our study meets the 10% threshold, which refers to the minimal percentage of a range that must be overlapped by the SACs in order for the species to be considered covered [253,254], as well as meeting the Aichi Biodiversity Target 11 threshold for important biodiversity areas to be effectively conserved and equitably managed via ecologically representative and well-connected systems of protected areas, such as SACs, a significant amount lies outside any protection scheme. The same trend is observed for the endemism centres as well (Table S3; Figure S6). Moreover, these thresholds should be always considered when referring to species with a narrow geographic range, such as the Greek endemics (or range-restricted taxa and local endemics). Therefore, a more careful assessment of the current SACs extent is recommended, in order to protect the Greek endemics as they are integral structural and functional elements of habitat types. As anthropogenic pressure will increase in the coming decades due to climate- and land-use change [17,18,19], even for Type-III organisms such as orchids [255], a critical re-assessment of the current SACs might indeed be needed in order to minimize the extinction risk of the Greek endemics, by focusing the conservation efforts also on the Priority Hotspots that fall outside of the established Greek SACs or on mixed-endemism centres. The former host many rare species [42,43], while simultaneously representing evolutionary history and, potentially, adaptive capacity [247]. The latter on the other hand, contain a large number of both neo- and paleo-endemic species. Thus, by aiming the available human and economic resources in the protection and management of either of these areas would be socioeconomically cost-effective and align with the ongoing efforts on expanding SACs to capture and protect the phylogenetic aspect of biodiversity and evolutionary heritage in general [256,257].
Regarding the importance of this work in current conservation, management and policy efforts, our results contribute to the implementation of the ongoing state efforts via drafting Special Environmental Studies (SES) for the Natura 2000 Network sites in Greece, as well as to the Life Integrated Project with the acronym “LIFE-IP 4 Natura” [258], led by the Hellenic Ministry of Environment and Energy. More specifically, the identified biodiversity hotspots, endemism centres and Priority Hotspots are fundamental for the aforementioned, nationally designed, holistic approaches of conservation management and sustainable development since they: (a) provide spatial explicit biodiversity information which can be incorporated in the creation of protection zones via the SES implementation and (b) fulfil the adopted biodiversity indicators for the MAES (Mapping and Assessment of Ecosystem and their services) implementation in Greece (i.e., the indicators of Floristic diversity and Endemic diversity—[252]). They do so, as they directly correspond to the project’s needs, while simultaneously meeting all index requirements as proposed by [259] (i.e., being scientifically sound, supporting environmental legislation, being policy-relevant, including habitat and species conservation status, including soil-related information, being applicable for natural capital accounts, being spatially explicit, supporting baseline and being sensitive to change). Our work thus acts not only as a dissemination medium of scientific results and outcomes, but also provides the robust baseline for future assessments, where data is available at any scale (local to national). For instance, a similar analysis could be conducted for certain selected taxa of particular economic and/or cultural importance and not only for conservation management. The endemic Lamiaceae taxa, with documented importance regarding their properties (e.g., aromatic, medical, antimicrobial, traditional medicine, environmental interest) [260], is a characteristic group of economic and cultural importance and could be used for a similar case-study assessment. Moreover, our results cope with the needs of the National and EU Biodiversity Strategy, as well as with the proposals made by the EU Green Deal, which urge Member States to follow, in order to bend the curve of biodiversity loss, ecosystem melioration at all scales and the subsequent provided social equity and well-being.
5. Conclusions
Spatial phylogenetic analyses provided informative aspects of biodiversity related to evolutionary history, distinctiveness, and uniqueness. This study presents for the first time a nationwide, phylogenetically informed identification of vascular plant diversity hotspots and endemism centres in Greece. These areas are mainly located near or at mountain-tops and mountain ranges, as well as in areas which were until now thought of as floristically impoverished or were in one way or another, overlooked. By applying a metric which takes into account the geographically-weighted variants of both taxonomic and phylogenetic diversity, we were able to discern the conservation gaps in the Greek Natura 2000 network, regarding the areas that serve as both taxonomic and phylogenetic hotspots, providing evidence that the incorporation of phylogenetic metrics in national conservation strategies does indeed unveil patterns yet unseen. Owing to the detailed data availability used for this study, our outcomes provide results adequate for decision making and policy support, for the implementation of the National Biodiversity Strategy as well as to support the requirements of the European Green Deal.
Supplementary Materials
The following are available online at https://0-www-mdpi-com.brum.beds.ac.uk/2079-7737/10/2/72/s1, Extended Materials and Methods, Figure S1: Red colouring indicates cells with Level-2 (top 5%) CWEEND values. Blue colouring indicates cells with values from the 5% percentile (CWEEND coldspots). Black colouring indicates the areas where ultramafic rocks occur in Greece, Figure S2: Red colouring indicates cells with Level-3 (top 10%) CWEEND values. Blue colouring indicates cells with values from the 10% percentile (CWEEND coldspots). Black colouring indicates the areas where ultramafic rocks occur in Greece, Figure S3: Randomization results (999 runs) for the CWEEND metric. Pink and blue colouring indicates areas with statistically significantly lower and higher than expected corrected weighted endemic richness. NS: non-significant, Figure S4: Randomization results (999 runs) for the CWENAT metric. Pink and blue colouring indicates areas with statistically significantly lower and higher than expected corrected weighted endemic richness. NS: non-significant, Figure S5: Map of significant phylogenetic endemism (PE) identified by the categorical analysis of neo- and paleo-endemism (CANAPE) analysis for the endemic plant taxa occurring in Greece. Dark green colouring indicates the areas where ultramafic rocks occur in Greece. Dark blue colouring indicates the climatically stable areas for the past 4 My, Figure S6: Map of significant phylogenetic endemism (PE) identified by the categorical analysis of neo- and paleo-endemism (CANAPE) analysis for the endemic plant taxa occurring in Greece. Light brown polygons depict the Special Areas of Conservation of the Natura 2000 network in Greece, Figure S7: Red colouring indicates cells identified as Priority Hotspots with Level-1 (top 1%) CWEEND and PE values that are inside the Special Areas of Conservation of the Natura 2000 network. Blue colouring indicates cells identified as Priority Hotspots with Level-1 (top 1%) CWEEND and PE values that are outside the Special Areas of Conservation of the Natura 2000 network. Green polygons depict the Special Areas of Conservation of the Natura 2000 network in Greece, Figure S8: Red colouring indicates cells identified as Priority Hotspots with Level-2 (top 5%) CWEEND and PE values that are inside the Special Areas of Conservation of the Natura 2000 network. Blue colouring indicates cells identified as Priority Hotspots with Level-2 (top 5%) CWEEND and PE values that are outside the Special Areas of Conservation of the Natura 2000 network. Green polygons depict the Special Areas of Conservation of the Natura 2000 network in Greece, Table S1: Summary statistics regarding plant species richness for every type of endemism centre identified by the Categorical Analysis of Neo- and Paleo-Endemism (CANAPE) analysis in Greece. SR: species richness. SD: standard deviation. Unique SR refers to the taxa that occur exclusively in a single type of endemism centre, Table S2: Summary statistics regarding altitude (m a.s.l.), climate stability and the global human modification index for the different types of endemism centres, as well as for the not-significant sites. NS: not-significant. SD: standard deviation. CS: climate stability. GHM: Global Human Modification index. * denotes a p-value < 0.001 in the Kruskal-Wallis ANOVA, Table S3: Percent overlap (%) between the Special Areas of Conservation of the Natura 2000 network in Greece and the endemism centres detected by the Categorical Analyses of Neo- and Paleo-Endemism (CANAPE). The extent (in km2) of each CANAPE category is also presented, Table S4: Percent overlap (%) between the Special Areas of Conservation of the Natura 2000 network in Greece and: (i) the Corrected Weighted Endemism hotspots for the Greek endemic plant taxa (CWEEND) and (ii) the Priority Hotspots detected by our analyses. PE: Phylogenetic endemism. L1, L2 and L3 refer to the 99%, 95% and 90% percentile, respectively. The Priority Hotspots are defined here as any cells belonging to the 1%, 5% and 10% of cells that had the highest score for both the CWEEND and PE indices, the two geographically-weighted variants of taxonomic and phylogenetic species richness, respectively.
Author Contributions
Conceptualization, K.K., I.P.K. and P.D.; investigation, K.K. and I.P.K.; methodology, K.K. and I.P.K.; formal analysis, K.K.; resources, A.S. and P.D.; supervision, P.D.; writing—original draft preparation, K.K., I.P.K., M.P., A.K., A.S. and P.D.; writing—review and editing, K.K., I.P.K., M.P., A.K., A.S. and P.D.; visualization, K.K. and I.P.K. All authors have read and agreed to the published version of the manuscript.
Funding
This research is co-financed by Greece and the European Union (European Social Fund- ESF) through the Operational Program “Human Resources Development, Education and Lifelong Learning” in the context of the project “Reinforcement of Postdoctoral Researchers-2nd Cycle” (MIS-5033021), implemented by the State Scholarships Foundation (ΙΚΥ). Grant contract number: 2019-050-0503-17842.
Institutional Review Board Statement
Not applicable.
Informed Consent Statement
Not applicable.
Data Availability Statement
Not applicable.
Acknowledgments
The authors would like to thank three anonymous reviewers for their useful and constructive comments on earlier versions of our manuscript.
Conflicts of Interest
The authors declare no conflict of interest. The funders had no role in the design of the study; in the collection, analyses, or interpretation of data; in the writing of the manuscript, or in the decision to publish the results.
References
- Lughadha, E.N.; Govaerts, R.; Belyaeva, I.; Black, N.; Lindon, H.; Allkin, R.; Magill, R.E.; Nicolson, N. Counting counts: Revised estimates of numbers of accepted species of flowering plants, seed plants, vascular plants and land plants with a review of other recent estimates. Phytotaxa 2016, 272, 82–88. [Google Scholar] [CrossRef] [Green Version]
- Kier, G.; Kreft, H.; Lee, T.M.; Jetz, W.; Ibisch, P.L.; Nowicki, C.; Mutke, J.; Barthlott, W. A global assessment of endemism and species richness across island and mainland regions. Proc. Natl. Acad. Sci. USA 2009, 106, 9322–9327. [Google Scholar] [CrossRef] [PubMed] [Green Version]
- Fine, P.V.A. Ecological and Evolutionary Drivers of Geographic Variation in Species Diversity. Annu. Rev. Ecol. Evol. Syst. 2015. [Google Scholar] [CrossRef] [Green Version]
- Gallagher, R.V.; Allen, S.; Rivers, M.C.; Allen, A.P.; Butt, N.; Keith, D.; Auld, T.D.; Enquist, B.J.; Wright, I.J.; Possingham, H.P.; et al. Global shortfalls in extinction risk assessments for endemic flora. bioRxiv 2020. [Google Scholar] [CrossRef]
- Le Roux, J.J.; Hui, C.; Castillo, M.L.; Iriondo, J.M.; Keet, J.H.; Khapugin, A.A.; Médail, F.; Rejmánek, M.; Theron, G.; Yannelli, F.A.; et al. Recent Anthropogenic Plant Extinctions Differ in Biodiversity Hotspots and Coldspots. Curr. Biol. 2019, 29, 2912–2918. [Google Scholar] [CrossRef] [PubMed]
- Barthlott, W.; Mutke, J.; Rafiqpoor, D.; Kier, G.; Kreft, H. Global Centers of Vascular Plant Diversity. Nov. Acta Leopoldina 2005, 92, 61–83. [Google Scholar]
- Myers, N.; Mittermeier, R.A.; Mittermeier, C.G.; Da Fonseca, G.A.B.; Kent, J. Biodiversity hotspots for conservation priorities. Nature 2000, 403, 853–858. [Google Scholar] [CrossRef]
- Keppel, G.; Ottaviani, G.; Harrison, S.; Wardell-Johnson, G.W.; Marcantonio, M.; Mucina, L. Towards an eco-evolutionary understanding of endemism hotspots and refugia. Ann. Bot. 2018, 122, 927–934. [Google Scholar] [CrossRef]
- Ashcroft, M.B. Identifying refugia from climate change. J. Biogeogr. 2010, 37, 1407–1413. [Google Scholar] [CrossRef]
- Hoffmann, S.; Irl, S.D.H.; Beierkuhnlein, C. Predicted climate shifts within terrestrial protected areas worldwide. Nat. Commun. 2019, 10, 1–10. [Google Scholar] [CrossRef] [Green Version]
- Le Saout, S.; Hoffmann, M.; Shi, Y.; Hughes, A.; Bernard, C.; Brooks, T.M.; Bertzky, B.; Butchart, S.H.M.; Stuart, S.N.; Badman, T.; et al. Protected Areas and Effective Biodiversity Conservation. Science 2013, 342, 803–805. [Google Scholar] [CrossRef] [PubMed]
- Zalasiewicz, J.; Waters, C.N.; Williams, M.; Barnosky, A.D.; Cearreta, A.; Crutzen, P.; Ellis, E.; Ellis, M.A.; Fairchild, I.J.; Grinevald, J.; et al. When did the Anthropocene begin? A mid-twentieth century boundary level is stratigraphically optimal. Quat. Int. 2015, 383, 196–203. [Google Scholar] [CrossRef] [Green Version]
- Urban, M.C. Accelerating extinction risk from climate change. Science 2015, 348, 571–573. [Google Scholar] [CrossRef] [PubMed] [Green Version]
- Gray, A. The ecology of plant extinction: Rates, traits and island comparisons. Oryx 2019, 53, 424–428. [Google Scholar] [CrossRef] [Green Version]
- Vellend, M.; Baeten, L.; Becker-Scarpitta, A.; Boucher-Lalonde, V.; McCune, J.L.; Messier, J.; Myers-Smith, I.H.; Sax, D.F. Plant Biodiversity Change Across Scales During the Anthropocene. Annu. Rev. Plant Biol. 2017, 68, 563–586. [Google Scholar] [CrossRef] [Green Version]
- Enquist, B.J.; Feng, X.; Boyle, B.; Maitner, B.; Newman, E.A.; Jørgensen, P.M.; Roehrdanz, P.R.; Thiers, B.M.; Burger, J.R.; Corlett, R.T.; et al. The commonness of rarity: Global and future distribution of rarity across land plants. Sci. Adv. 2019, 5, eaaz0414. [Google Scholar] [CrossRef] [Green Version]
- Newbold, T. Future effects of climate and land-use change on terrestrial vertebrate community diversity under different scenarios. Proc. R. Soc. B Biol. Sci. 2018, 285, 6229. [Google Scholar] [CrossRef]
- Newbold, T.; Hudson, L.N.; Contu, S.; Hill, S.L.L.; Beck, J.; Liu, Y.; Meyer, C.; Phillips, H.R.P.; Scharlemann, J.P.W.; Purvis, A. Widespread winners and narrow-ranged losers: Land use homogenizes biodiversity in local assemblages worldwide. PLOS Biol. 2018, 16, e2006841. [Google Scholar] [CrossRef]
- Powers, R.P.; Jetz, W. Global habitat loss and extinction risk of terrestrial vertebrates under future land-use-change scenarios. Nat. Clim. Chang. 2019, 9, 323–329. [Google Scholar] [CrossRef]
- Li, D.; Olden, J.D.; Lockwood, J.L.; Record, S.; McKinney, M.L.; Baiser, B. Changes in taxonomic and phylogenetic diversity in the Anthropocene. Proc. R. Soc. B Biol. Sci. 2020, 287, 20200777. [Google Scholar] [CrossRef]
- Menéndez-Guerrero, P.A.; Green, D.M.; Davies, T.J. Climate change and the future restructuring of Neotropical anuran biodiversity. Ecography 2020, 43, 222–235. [Google Scholar] [CrossRef]
- Kougioumoutzis, K.; Kokkoris, I.P.; Panitsa, M.; Trigas, P.; Strid, A.; Dimopoulos, P. Spatial Phylogenetics, Biogeographical Patterns and Conservation Implications of the Endemic Flora of Crete (Aegean, Greece) under Climate Change Scenarios. Biology 2020, 9, 199. [Google Scholar] [CrossRef] [PubMed]
- Olden, J.D.; Comte, L.; Giam, X. The Homogocene: A research prospectus for the study of biotic homogenisation. NeoBiota 2018, 37, 23–36. [Google Scholar] [CrossRef] [Green Version]
- Thuiller, W.; Lavergne, S.; Roquet, C.; Boulangeat, I.; Lafourcade, B.; Araujo, M.B. Consequences of climate change on the tree of life in Europe. Nature 2011, 470, 531–534. [Google Scholar] [CrossRef] [PubMed]
- Cronk, Q. Plant extinctions take time. Science 2016, 353, 446–447. [Google Scholar] [CrossRef]
- Nic Lughadha, E.; Bachman, S.P.; Leão, T.C.C.; Forest, F.; Halley, J.M.; Moat, J.; Acedo, C.; Bacon, K.L.; Brewer, R.F.A.; Gâteblé, G.; et al. Extinction risk and threats to plants and fungi. Plants People Planet 2020, 2, 389–408. [Google Scholar] [CrossRef]
- CBD (Convention on Biological Diversity) X/17. Consolidated Update of the Global Strategy for Plant Conservation 2011–2020. Available online: https://www.cbd.int/kb/record/decision/12283?RecordType=decision (accessed on 10 January 2021).
- CBD (Convention on Biological Diversity). In Updated Analysis of the Contribution of Targets Established by Parties and Progress Towards the Aichi Biodiversity Targets. Available online: https://www.cbd.int/kb/record/meetingDocument/111071?Event=COP-13 (accessed on 10 January 2021).
- Buxton, R.; Avery-Gomm, S.; Lin, H.-Y.; Smith, P.A.; Cooke, S.; Bennett, J.R. Half of resources in threatened species conservation plans are allocated to research and monitoring. Nat. Commun. 2020, 11, 1–8. [Google Scholar] [CrossRef]
- Watts, K.; Whytock, R.C.; Park, K.J.; Fuentes-Montemayor, E.; Macgregor, N.A.; Duffield, S.; McGowan, P.J.K. Ecological time lags and the journey towards conservation success. Nat. Ecol. Evol. 2020, 4, 304–311. [Google Scholar] [CrossRef]
- Corlett, R.T. Safeguarding our future by protecting biodiversity. Plant Divers. 2020, 42, 221–228. [Google Scholar] [CrossRef]
- Heywood, V.H. Plant conservation in the Anthropocene—Challenges and future prospects. Plant Divers. 2017, 39, 314–330. [Google Scholar] [CrossRef]
- Arponen, A. Prioritizing species for conservation planning. Biodivers. Conserv. 2012, 21, 875–893. [Google Scholar] [CrossRef]
- Maes, J.; Teller, A.; Erhard, M.; Liquete, C.; Braat, L.; Berry, P.; Egoh, B.; Puydarrieus, P.; Fiorina, C.; Santos, F.; et al. Mapping and Assessment of Ecosystem and Their Services. An Analytical Framework for Ecosystem Assessments under Action 5 of the EU Biodiversity Strategy to 2020; Publications Office of the European Union: Luxemburg, 2013. [Google Scholar]
- Reece, J.S.; Noss, R.F. Prioritizing Species by Conservation Value and Vulnerability: A New Index Applied to Species Threatened by Sea-Level Rise and Other Risks in Florida. Nat. Areas, J. 2014, 34, 31–45. [Google Scholar] [CrossRef]
- Reid, W. V Biodiversity hotspots. Trends Ecol. Evol. 1998, 13, 275–280. [Google Scholar] [CrossRef]
- Brooks, T.M.; Mittermeier, R.A.; da Fonseca, G.A.B.; Gerlach, J.; Hoffmann, M.; Lamoreux, J.F.; Mittermeier, C.G.; Pilgrim, J.D.; Rodrigues, A.S.L. Global biodiversity conservation priorities. Science 2006, 313, 58–61. [Google Scholar] [CrossRef] [PubMed] [Green Version]
- Harrison, S.; Spasojevic, M.J.; Li, D. Climate and plant community diversity in space and time. Proc. Natl. Acad. Sci. USA 2020, 117, 4464–4470. [Google Scholar] [CrossRef]
- Newbold, T.; Oppenheimer, P.; Etard, A.; Williams, J.J. Tropical and Mediterranean biodiversity is disproportionately sensitive to land-use and climate change. Nat. Ecol. Evol. 2020. [Google Scholar] [CrossRef]
- Cañadas, E.M.; Fenu, G.; Peñas, J.; Lorite, J.; Mattana, E.; Bacchetta, G. Hotspots within hotspots: Endemic plant richness, environmental drivers, and implications for conservation. Biol. Conserv. 2014, 170, 282–291. [Google Scholar] [CrossRef]
- Crisp, M.D.; Laffan, S.; Linder, H.P.; Monro, A.N.N.A. Endemism in the Australian flora. J. Biogeogr. 2001, 28, 183–198. [Google Scholar] [CrossRef]
- Linder, H.P. On areas of endemism, with an example from the African restionaceae. Syst. Biol. 2001, 50, 892–912. [Google Scholar] [CrossRef]
- Linder, H.P. Plant diversity and endemism in sub-Saharan tropical Africa. J. Biogeogr. 2001, 28, 169–182. [Google Scholar] [CrossRef]
- Jetz, W.; Rahbek, C.; Colwell, R.K. The coincidence of rarity and richness and the potential signature of history in centres of endemism. Ecol. Lett. 2004, 7, 1180–1191. [Google Scholar] [CrossRef]
- Xu, Y.; Huang, J.; Lu, X.; Ding, Y.; Zang, R. Priorities and conservation gaps across three biodiversity dimensions of rare and endangered plant species in China. Biol. Conserv. 2019, 229, 30–37. [Google Scholar] [CrossRef]
- Kling, M.M.; Mishler, B.D.; Thornhill, A.H.; Baldwin, B.G.; Ackerly, D.D. Facets of phylodiversity: Evolutionary diversification, divergence and survival as conservation targets. Philos. Trans. R. Soc. B Biol. Sci. 2019, 374, 20170397. [Google Scholar] [CrossRef] [PubMed] [Green Version]
- Daru, B.H.; Farooq, H.; Antonelli, A.; Faurby, S. Endemism patterns are scale dependent. Nat. Commun. 2020, 11, 1–11. [Google Scholar] [CrossRef] [PubMed]
- Mishler, B.D.; Knerr, N.; González-Orozco, C.E.; Thornhill, A.H.; Laffan, S.W.; Miller, J.T. Phylogenetic measures of biodiversity and neo-and paleo-endemism in Australian acacia. Nat. Commun. 2014, 5, 4473. [Google Scholar] [CrossRef]
- Scherson, R.A.; Thornhill, A.H.; Urbina-Casanova, R.; Freyman, W.A.; Pliscoff, P.A.; Mishler, B.D. Spatial phylogenetics of the vascular flora of Chile. Mol. Phylogenet. Evol. 2017, 112, 88–95. [Google Scholar] [CrossRef]
- Thornhill, A.H.; Mishler, B.D.; Knerr, N.J.; González-Orozco, C.E.; Costion, C.M.; Crayn, D.M.; Laffan, S.W.; Miller, J.T. Continental-scale spatial phylogenetics of Australian angiosperms provides insights into ecology, evolution and conservation. J. Biogeogr. 2016, 43, 2085–2098. [Google Scholar] [CrossRef]
- Sosa, V.; De-Nova, J.A.; Vásquez-Cruz, M. Evolutionary history of the flora of Mexico: Dry forests cradles and museums of endemism. J. Syst. Evol. 2018, 56, 523–536. [Google Scholar] [CrossRef]
- Spalink, D.; Kriebel, R.; Li, P.; Pace, M.C.; Drew, B.T.; Zaborsky, J.G.; Rose, J.; Drummond, C.P.; Feist, M.A.; Alverson, W.S.; et al. Spatial phylogenetics reveals evolutionary constraints on the assembly of a large regional flora. Am. J. Bot. 2018, 105, 1938–1950. [Google Scholar] [CrossRef]
- Dagallier, L.P.M.J.; Janssens, S.B.; Dauby, G.; Blach-Overgaard, A.; Mackinder, B.A.; Droissart, V.; Svenning, J.C.; Sosef, M.S.M.; Stévart, T.; Harris, D.J.; et al. Cradles and museums of generic plant diversity across tropical Africa. New Phytol. 2020, 225, 2196–2213. [Google Scholar] [CrossRef] [Green Version]
- Fuentes-Castillo, T.; Scherson, R.A.; Marquet, P.A.; Fajardo, J.; Corcoran, D.; Román, M.J.; Pliscoff, P. Modelling the current and future biodiversity distribution in the Chilean Mediterranean hotspot. The role of protected areas network in a warmer future. Divers. Distrib. 2019, 25, 1897–1909. [Google Scholar] [CrossRef] [Green Version]
- Laffan, S.W.; Rosauer, D.F.; Di Virgilio, G.; Miller, J.T.; González-Orozco, C.E.; Knerr, N.; Thornhill, A.H.; Mishler, B.D. Range-weighted metrics of species and phylogenetic turnover can better resolve biogeographic transition zones. Methods Ecol. Evol. 2016, 7, 580–588. [Google Scholar] [CrossRef]
- Critical Ecosystem Partnership Fund Mediterranean Basin Biodiversity Hotspot. Ecosystem Profile. Available online: https://www.cepf.net/sites/default/files/mediterranean-basin-2017-ecosystem-profile-english_0.pdf (accessed on 10 January 2021).
- Médail, F. The specific vulnerability of plant biodiversity and vegetation on Mediterranean islands in the face of global change. Reg. Environ. Chang. 2017, 17, 1775–1790. [Google Scholar] [CrossRef] [Green Version]
- Fady, B.; Conord, C. Macroecological patterns of species and genetic diversity in vascular plants of the Mediterranean basin. Divers. Distrib. 2010, 16, 53–64. [Google Scholar] [CrossRef]
- Nieto Feliner, G. Patterns and processes in plant phylogeography in the Mediterranean Basin. A review. Perspect. Plant Ecol. Evol. Syst. 2014, 16, 265–278. [Google Scholar] [CrossRef]
- Fois, M.; Bacchetta, G.; Cuena-Lombraña, A.; Cogoni, D.; Pinna, M.S.; Sulis, E.; Fenu, G. Using extinctions in species distribution models to evaluate and predict threats: A contribution to plant conservation planning on the island of Sardinia. Environ. Conserv. 2018, 45, 11–19. [Google Scholar] [CrossRef]
- Carta, A.; Gargano, D.; Rossi, G.; Bacchetta, G.; Fenu, G.; Montagnani, C.; Abeli, T.; Peruzzi, L.; Orsenigo, S. Phylogenetically informed spatial planning as a tool to prioritise areas for threatened plant conservation within a Mediterranean biodiversity hotspot. Sci. Total Environ. 2019, 665, 1046–1052. [Google Scholar] [CrossRef]
- Médail, F.; Monnet, A.-C.; Pavon, D.; Nikolic, T.; Dimopoulos, P.; Bacchetta, G.; Arroyo, J.; Barina, Z.; Albassatneh, M.C.; Domina, G. What is a tree in the Mediterranean Basin hotspot? A critical analysis. For. Ecosyst. 2019, 6, 17. [Google Scholar] [CrossRef] [Green Version]
- Fois, M.; Fenu, G.; Cañadas, E.M.; Bacchetta, G. Disentangling the influence of environmental and anthropogenic factors on the distribution of endemic vascular plants in Sardinia. PLoS ONE 2017, 12, e0182539. [Google Scholar] [CrossRef] [Green Version]
- Abdelaal, M.; Fois, M.; Fenu, G.; Bacchetta, G. Biogeographical characterisation of Egypt based on environmental features and endemic vascular plants distribution. Appl. Geogr. 2020, 119, 102208. [Google Scholar] [CrossRef]
- Ojeda, F.; Marañón, T.; Arroyo, J. Plant diversity patterns in the Aljibe Mountains (S. Spain): A comprehensive account. Biodivers. Conserv. 2000, 9, 1323–1343. [Google Scholar] [CrossRef] [Green Version]
- Molina-venegas, R.; Aparicio, A.; Slingsby, J.A. Investigating the evolutionary assembly of a Mediterranean biodiversity hotspot: Deep phylogenetic signal in the distribution of eudicots across elevational belts. J. Biogeogr. 2014, 42, 507–518. [Google Scholar] [CrossRef]
- Molina-Venegas, R.; Aparicio, A.; Pina, F.J.; Valdés, B.; Arroyo, J. Disentangling environmental correlates of vascular plant biodiversity in a Mediterranean hotspot. Ecol. Evol. 2013, 3, 3879–3894. [Google Scholar] [CrossRef] [PubMed]
- Molina-Venegas, R.; Aparicio, A.; Lavergne, S.; Arroyo, J. Climatic and topographical correlates of plant palaeo- and neoendemism in a Mediterranean biodiversity hotspot. Ann. Bot. 2017, 119, 229–238. [Google Scholar] [CrossRef] [Green Version]
- Carta, A.; Pierini, B.; Roma-Marzio, F.; Bedini, G.; Peruzzi, L. Phylogenetic measures of biodiversity uncover pteridophyte centres of diversity and hotspots in Tuscany. Plant Biosyst.-Int. J. Deal. Asp. Plant Biol. 2018, 157, 831–839. [Google Scholar] [CrossRef]
- Dimopoulos, P.; Raus, T.; Bergmeier, E.; Constantinidis, T.; Iatrou, G.; Kokkini, S.; Strid, A.; Tzanoudakis, D. Vascular Plants of Greece: An Annotated Checklist; Botanischer Garten und Botanisches Museum Berlin-Dahlem, Freie Universität Berlin/Hellenic Botanical Society: Athens, Greece, 2013. [Google Scholar]
- Dimopoulos, P.; Raus, T.; Bergmeier, E.; Constantinidis, T.; Iatrou, G.; Kokkini, S.; Strid, A.; Tzanoudakis, D. Vascular plants of Greece: An annotated checklist. Supplement. Willdenowia 2016, 46, 301–347. [Google Scholar] [CrossRef] [Green Version]
- Triantis, K.A.; Mylonas, M. Greek islands, biology. Encycl. Isl. 2009, 388–392. [Google Scholar]
- Strid, A.; Tan, K. Mountain Flora of Greece. Brittonia 1991, 43, 177. [Google Scholar]
- Sakellariou, D.; Galanidou, N. Pleistocene submerged landscapes and Palaeolithic archaeology in the tectonically active Aegean region. Geol. Soc. Lond. Spec. Publ. 2016, 411, 145–178. [Google Scholar] [CrossRef]
- Kapsimalis, V.; Pavlopoulos, K.; Panagiotopoulos, I.; Drakopoulou, P.; Vandarakis, D.; Sakelariou, D.; Anagnostou, C. Geoarchaeological challenges in the Cyclades continental shelf (Aegean Sea). Z. Geomorphol. Suppl. Issues 2009, 53, 169–190. [Google Scholar] [CrossRef]
- Lykousis, V. Sea-level changes and shelf break prograding sequences during the last 400 ka in the Aegean margins: Subsidence rates and palaeogeographic implications. Cont. Shelf Res. 2009, 29, 2037–2044. [Google Scholar] [CrossRef]
- Fassoulas, C. The geodynamic and paleogeographic evolution of the Aegean in the Tertiary and Quaternary: A review. In Biogeography and Biodiversity of the Aegean. In Honour of Prof. Moysis Mylonas; Sfenthourakis, S., Pafilis, P., Parmakelis, A., Poulakakis, N., Triantis, K.A., Eds.; Broken Hill Publishers Ltd.: Nicosia, Cyprus, 2018; pp. 25–46. ISBN 9789925563784. [Google Scholar]
- Cribb, P.; Lack, H.W.; Mabberley, D.J. The Flora Graeca Story. Sibthorp, Bauer, and Hawkins in the Levant. Kew Bull. 1999, 54, 243. [Google Scholar] [CrossRef]
- Strid, A. The botanical exploration of Greece. Plant Syst. Evol. 2020, 306, 1–23. [Google Scholar] [CrossRef]
- Kougioumoutzis, K.; Tiniakou, A.; Georgiadis, T.; Georgiou, O. CONTRIBUTION TO THE FLORA OF THE SOUTH AEGEAN VOLCANIC ARC: THE METHANA PENINSULA (SARONIC GULF, GREECE). Edinburgh J. Bot. 2012, 69, 53–81. [Google Scholar] [CrossRef]
- Kougioumoutzis, K.; Tiniakou, A.; Georgiou, O.; Georgiadis, T. Contribution to the flora of the south aegean volcanic arc: Kimolos island (kiklades, greece). Edinburgh J. Bot. 2014, 71, 135–160. [Google Scholar] [CrossRef]
- Kokkoris, I.; Dimitrellos, G.; Kougioumoutzis, K.; Laliotis, I.; Georgiadis, T.; Tiniakou, A. The native flora of Mountain Panachaikon (Peloponnese, Greece): New records and diversity. J. Biol. Res. 2014, 21, 9. [Google Scholar] [CrossRef] [Green Version]
- Strid, A. Phytogeographia Aegaea and the Flora Hellenica Database. Ann. Naturhistorischen Museums Wien 1996, 98B, 279–289. [Google Scholar]
- Panitsa, M.; Trigas, P.; Iatrou, G.; Sfenthourakis, S. Factors affecting plant species richness and endemism on land-bridge islands-An example from the East Aegean archipelago. Acta Oecologica 2010, 36, 431–437. [Google Scholar] [CrossRef]
- Panitsa, M.; Snogerup, B.; Snogerup, S.; Tzanoudakis, D. Floristic investigation of Lemnos island ( NE Aegean area, Greece). Willdenowia 2003, 33, 79–105. [Google Scholar] [CrossRef] [Green Version]
- Panitsa, M.; Tzanoudakis, D.; Triantis, K.A.; Sfenthourakis, S. Patterns of species richness on very small islands: The plants of the Aegean archipelago. J. Biogeogr. 2006, 33, 1223–1234. [Google Scholar] [CrossRef]
- Tzanoudakis, D.; Iatrou, G.; Panitsa, M.; Trigas, P. Contribution to the Study of the Greek Insular Flora: Antikythera and the Islets Around Kythera. In Progress in Botanical Research; Springer: Dordrecht, The Netherlands, 1998; pp. 177–180. [Google Scholar]
- Trigas, P.; Iatrou, G.; Panitsa, M. Vascular plant species diversity, biogeography and vulnerability in the Aegean islands as exemplified by Evvia island (W.; Aegean, Greece). Fresenius Environ. Bull. 2008, 17, 48–57. [Google Scholar]
- Trigas, P.; Tsiftsis, S.; Tsiripidis, I.; Iatrou, G. Distribution Patterns and Conservation Perspectives of the Endemic Flora of Peloponnese (Greece). Folia Geobot. 2012, 47, 421–439. [Google Scholar] [CrossRef]
- Trigas, P.; Panitsa, M.; Tsiftsis, S. Elevational Gradient of Vascular Plant Species Richness and Endemism in Crete-The Effect of Post-Isolation Mountain Uplift on a Continental Island System. PLoS ONE 2013, 8, e59425. [Google Scholar] [CrossRef] [PubMed]
- Lazarina, M.; Kallimanis, A.S.; Dimopoulos, P.; Psaralexi, M.; Michailidou, D.E.; Sgardelis, S.P. Patterns and drivers of species richness and turnover of neo-endemic and palaeo-endemic vascular plants in a Mediterranean hotspot: The case of Crete, Greece. J. Biol. Res. 2019, 26, 1–13. [Google Scholar] [CrossRef] [Green Version]
- Kougioumoutzis, K.; Simaiakis, S.M.; Tiniakou, A. Network biogeographical analysis of the central Aegean archipelago. J. Biogeogr. 2014, 41, 1848–1858. [Google Scholar] [CrossRef]
- Kallimanis, A.S.; Bergmeier, E.; Panitsa, M.; Georghiou, K.; Delipetrou, P.; Dimopoulos, P. Biogeographical determinants for total and endemic species richness in a continental archipelago. Biodivers. Conserv. 2010, 19, 1225–1235. [Google Scholar] [CrossRef] [Green Version]
- Kallimanis, A.S.; Panitsa, M.; Bergmeier, E.; Dimopoulos, P. Examining the relationship between total species richness and single island palaeo- and neo-endemics. Acta Oecologica 2011, 37, 65–70. [Google Scholar] [CrossRef]
- Panitsa, M.; Iliadou, E.; Kokkoris, I.; Kallimanis, A.; Patelodimou, C.; Strid, A.; Raus, T.; Bergmeier, E.; Dimopoulos, P. Distribution patterns of ruderal plant diversity in Greece. Biodivers. Conserv. 2020, 29, 869–891. [Google Scholar] [CrossRef]
- Panitsa, M.; Bazos, I.; Dimopoulos, P.; Zervou, S.; Yannitsaros, A.; Tzanoudakis, D. Contribution to the study of the flora and vegetation of the Kithira island group: Offshore islets of Kithira (S Aegean, Greece). Willdenowia 2004, 34, 101. [Google Scholar] [CrossRef]
- Iliadou, E.; Kallimanis, A.S.; Dimopoulos, P.; Panitsa, M. Comparing the two Greek archipelagos plant species diversity and endemism patterns highlight the importance of isolation and precipitation as biodiversity drivers. J. Biol. Res. 2014, 21, 16. [Google Scholar] [CrossRef] [Green Version]
- Trigas, P.; Iatrou, G. The local endemic flora of Evvia (W Aegean, Greece). Willdenowia 2006, 36, 257. [Google Scholar] [CrossRef] [Green Version]
- Christodoulakis, D. The flora of Ikaria (Greece, E Aegean islands). Phyt.-Ann. Rei Bot. 1996, 36, 63–91. [Google Scholar]
- Honer, D.; Greuter, W. Plant population dynamics and species turnover on small islands near Karapathos (South Aegean, Greece). Vegetatio 1988, 77, 129–137. [Google Scholar] [CrossRef]
- Runemark, H. The plant geography of the central Aegean. Feddes Repert. 1970, 81, 229–231. [Google Scholar] [CrossRef]
- Spanou, S.; Verroios, G.; Dimitrellos, G.; Tiniakou, A.; Georgiadis, T. Notes on flora and vegetation of the sand dunes of western Greece. Willdenowia 2006, 36, 235–246. [Google Scholar] [CrossRef] [Green Version]
- Iliadou, E.; Bazos, I.; Kougioumoutzis, K.; Karadimou, E.; Kokkoris, I.; Panitsa, M.; Raus, T.; Strid, A.; Dimopoulos, P. Taxonomic and phylogenetic diversity patterns in the Northern Sporades islets complex (West Aegean, Greece). Plant Syst. Evol. 2020, 306, 1–17. [Google Scholar] [CrossRef]
- Tiniakou, A. Cytogeographical studies on some species of Viola sect. Viola (Violaceae) from Greece. Willdenowia 1991, 20, 153–158. [Google Scholar]
- Vlachos, A.; Georgiadis, T.; Tiniakou, A. Floristic research of the mountains of Sterea Ellas (Central Greece) and their affinities with mountains of Peloponissos. J. Biol. Res.-Thessalon 2009, 12, 193–209. [Google Scholar]
- Constantinidis, T. The flora of the Kastellorizo island group (East Aegean Islands, Greece): New records and comments. Flora Mediterr. 2013, 23, 69–86. [Google Scholar] [CrossRef]
- Greuter, W. The relict element of the flora of Crete and its evolutionary significance. In Taxonomy, Phytogeography and Evolution; Valentine, D.H., Ed.; Academic Press: London, UK, 1972; pp. 161–177. ISBN 0127102507. [Google Scholar]
- Greuter, W. The Origins and Evolution of Island Floras as Exemplified by the Aegean Archipelago; Academic Press: London, UK, 1979. [Google Scholar]
- Runemark, H. Investigations of the flora in the Central Aegean. Boissiera 1971, 33, 87–106. [Google Scholar] [CrossRef] [Green Version]
- Kougioumoutzis, K.; Tiniakou, A.; Georgiou, O.; Georgiadis, T. Contribution to the flora of the South Aegean volcanic arc: Anafi Island (Kiklades, Greece). Willdenowia 2012, 42, 127–141. [Google Scholar] [CrossRef]
- Panitsa, M.; Kagiampaki, A.; Kougioumoutzis, K. Plant diversity and biogeography of the Aegean Archipelago: A New Synthesis. In Biogeography and Biodiversity of the Aegean. In honour of Prof. Moysis Mylonas; Sfenthourakis, S., Pafilis, P., Parmakelis, A., Poulakakis, N., Triantis, K., Eds.; Broken Hill Publishers Ltd.: Nicosia, Cyprus, 2018; pp. 223–244. ISBN 9789925563784. [Google Scholar]
- Kougioumoutzis, K.; Valli, A.T.; Georgopoulou, E.; Simaiakis, S.M.; Triantis, K.A.; Trigas, P. Network biogeography of a complex island system: The Aegean Archipelago revisited. J. Biogeogr. 2017, 44, 651–660. [Google Scholar] [CrossRef]
- Kougioumoutzis, K.; Kokkoris, I.P.; Panitsa, M.; Trigas, P.; Strid, A.; Dimopoulos, P. Plant Diversity Patterns and Conservation Implications under Climate-Change Scenarios in the Mediterranean: The Case of Crete (Aegean, Greece). Diversity 2020, 12, 270. [Google Scholar] [CrossRef]
- Kougioumoutzis, K.; Tiniakou, A. Ecological factors driving plant species diversity in the South Aegean Volcanic Arc and other central Aegean islands. Plant Ecol. Divers. 2014, 8, 1–14. [Google Scholar] [CrossRef]
- Strid, A. Atlas of the Aegean Flora; Botanic Garden and Botanical Museum Berlin, Freie Universität Berlin: Berlin, Germany, 2016; ISBN 9783921800973. [Google Scholar]
- Strid, A.; Tan, K. Recent progress in plant taxonomy and floristic studies in Greece. Bot. Serbica 2017, 41, 123–152. [Google Scholar] [CrossRef]
- Strid, A.; Tan, K. Flora Hellenica; Koeltz Scientific Books: Königstein, Germany, 1997. [Google Scholar]
- Strid, A.; Tan, K. Flora Hellenica. Volume II.; Gantner Verlag: Ruggell, Liechtenstein, 2002. [Google Scholar]
- Tsiftsis, S.; Antonopoulos, Z. Atlas of the Greek Orchids Vol I; Mediterraneo Editions: Rethimno, Crete, Greece, 2017. [Google Scholar]
- Antonopoulos, Z.; Tsiftsis, S. Atlas of the Greek Orchids Vol II; Mediterraneo Editions: Rethimno, Crete, Greece, 2017. [Google Scholar]
- Mastrogianni, A.; Kallimanis, A.S.; Chytrý, M.; Tsiripidis, I. Phylogenetic diversity patterns in forests of a putative refugial area in Greece: A community level analysis. For. Ecol. Manag. 2019, 446, 226–237. [Google Scholar] [CrossRef]
- Matthews, T.J.; Rigal, F.; Kougioumoutzis, K.; Trigas, P.; Triantis, K.A. Unravelling the small-island effect through phylogenetic community ecology. J. Biogeogr. 2020, 47, 2341–2352. [Google Scholar] [CrossRef]
- Stevanović, V.; Tan, K.; Iatrou, G. Distribution of the endemic Balkan flora on serpentine I.-Obligate serpentine endemics. Plant Syst. Evol. 2003, 242, 149–170. [Google Scholar] [CrossRef]
- Kati, V.; Devillers, P.; Dufrêne, M.; Legakis, A.; Vokou, D.; Lebrun, P. Hotspots, complementarity or representativeness? Designing optimal small-scale reserves for biodiversity conservation. Biol. Conserv. 2004, 120, 471–480. [Google Scholar] [CrossRef]
- Tsiftsis, S.; Tsiripidis, I.; Karagiannakidou, V. Identifying areas of high importance for orchid conservation in east Macedonia (NE Greece). Biodivers. Conserv. 2009, 18, 1765–1780. [Google Scholar] [CrossRef]
- Tsiftsis, S.; Tsiripidis, I.; Trigas, P. Identifying important areas for orchid conservation in Crete. Eur. J. Environ. Sci. 2011, 1, 28–37. [Google Scholar] [CrossRef]
- Apostolopoulou, E.; Pantis, J.D. Conceptual gaps in the national strategy for the implementation of the European Natura 2000 conservation policy in Greece. Biol. Conserv. 2009, 142, 221–237. [Google Scholar] [CrossRef]
- Mazaris, A.D.; Kallimanis, A.S.; Sgardelis, S.P.; Pantis, J.D. Does higher taxon diversity reflect richness of conservation interest species?: The case for birds, mammals, amphibians, and reptiles in Greek protected areas. Ecol. Indic. 2008, 8, 664–671. [Google Scholar] [CrossRef]
- Tsianou, M.A.; Mazaris, A.D.; Kallimanis, A.S.; Deligioridi, P.S.K.; Apostolopoulou, E.; Pantis, J.D. Identifying the criteria underlying the political decision for the prioritization of the Greek Natura 2000 conservation network. Biol. Conserv. 2013, 166, 103–110. [Google Scholar] [CrossRef]
- Hoffman, M.; Koenig, K.; Bunting, G.; Costanza, J.; Williams, K.J. Biodiversity Hotspots (version 2016.1). Available online: https://zenodo.org/record/3261807#.YAa7VRapRPY (accessed on 1 January 2021).
- Hijmans, R.J.; Cameron, S.E.; Parra, J.L.; Jones, P.G.; Jarvis, A. Very high resolution interpolated climate surfaces for global land areas. Int. J. Climatol. 2005, 25, 1965–1978. [Google Scholar] [CrossRef]
- Title, P.O.; Bemmels, J.B. ENVIREM: An expanded set of bioclimatic and topographic variables increases flexibility and improves performance of ecological niche modeling. Ecography 2017. [Google Scholar] [CrossRef] [Green Version]
- Hengl, T.; de Jesus, J.M.; Heuvelink, G.B.M.; Gonzalez, M.R.; Kilibarda, M.; Blagotić, A.; Shangguan, W.; Wright, M.N.; Geng, X.; Bauer-Marschallinger, B.; et al. SoilGrids250m: Global gridded soil information based on machine learning. PLoS ONE 2017, 12, e0169748. [Google Scholar] [CrossRef] [Green Version]
- Jarvis, A.; Reuter, H.I.; Nelson, A.; Guevara, E. Hole-filled SRTM for the globe Version 4. CGIAR-CSI SRTM 90 m Database. 2008. Available online: http//srtm.csi.cgiar.org (accessed on 3 November 2020).
- Amatulli, G.; Domisch, S.; Tuanmu, M.-N.; Parmentier, B.; Ranipeta, A.; Malczyk, J.; Jetz, W. A suite of global, cross-scale topographic variables for environmental and biodiversity modeling. Sci. Data 2018, 5, 180040. [Google Scholar] [CrossRef] [Green Version]
- Hijmans, R.J. raster: Geographic Data Analysis and Modeling. Available online: http://CRAN.R-project.org/package=raster (accessed on 1 January 2021).
- Evans, J.S. spatialEco: Spatial Analysis and Modelling Utilities, Version 1.2-0; CRAN, R Core Team: Cary, CA, USA, 2019. [Google Scholar]
- Bornovas, I.; Rondogianni-Tsiambaou, T. Geological Map of Greece. Scale 1:500,000, 2nd ed.; Institute of Geology and Mineral Exploration, Division of General Geology and Economic Geology: Athens, Greece, 1983. [Google Scholar]
- Kennedy, C.M.; Oakleaf, J.R.; Theobald, D.M.; Baruch-Mordo, S.; Kiesecker, J. Managing the middle: A shift in conservation priorities based on the global human modification gradient. Glob. Chang. Biol. 2019, 25, 811–826. [Google Scholar] [CrossRef]
- Owens, H.L.; Guralnick, R. climateStability: An R package to estimate climate stability from time-slice climatologies. Biodivers. Inform. 2019, 14, 8–13. [Google Scholar] [CrossRef] [Green Version]
- Brown, J.L.; Hill, D.J.; Dolan, A.M.; Carnaval, A.C.; Haywood, A.M. Paleoclim, high spatial resolution paleoclimate surfaces for global land areas. Sci. Data 2018, 5, 180254. [Google Scholar] [CrossRef] [Green Version]
- Gamisch, A. Oscillayers: A dataset for the study of climatic oscillations over Plio-Pleistocene time-scales at high spatial-temporal resolution. Glob. Ecol. Biogeogr. 2019, 28, 1552–1560. [Google Scholar] [CrossRef] [PubMed] [Green Version]
- Dormann, C.F.; Elith, J.; Bacher, S.; Buchmann, C.; Carl, G.; Carré, G.; Marquéz, J.R.G.; Gruber, B.; Lafourcade, B.; Leitão, P.J.; et al. Collinearity: A review of methods to deal with it and a simulation study evaluating their performance. Ecography 2013, 36, 027–046. [Google Scholar] [CrossRef]
- Naimi, B.; Hamm, N.A.S.; Groen, T.A.; Skidmore, A.K.; Toxopeus, A.G. Where is positional uncertainty a problem for species distribution modelling? Ecography 2014, 37, 191–203. [Google Scholar] [CrossRef]
- Kuhn, M. Building predictive models in R using the caret package. J. Stat. Softw. 2008, 28, 1–26. [Google Scholar] [CrossRef] [Green Version]
- Guerin, G.R.; Ruokolainen, L.; Lowe, A.J. A georeferenced implementation of weighted endemism. Methods Ecol. Evol. 2015, 6, 845–852. [Google Scholar] [CrossRef]
- Williams, P. Some properties of rarity scores used in site quality assessment. Br. J. Entomol. Nat. Hist. 2000, 13, 73–86. [Google Scholar]
- Zuloaga, J.; Currie, D.J.; Kerr, J.T. The origins and maintenance of global species endemism. Glob. Ecol. Biogeogr. 2019, 28, 170–183. [Google Scholar] [CrossRef]
- Guerin, G.R.; Lowe, A.J. ‘Sum of inverse range-sizes’ (SIR), a biodiversity metric with many names and interpretations. Biodivers. Conserv. 2015, 24, 2877–2882. [Google Scholar] [CrossRef]
- Daru, B.H.; Karunarathne, P.; Schliep, K. phyloregion: R package for biogeographical regionalization and macroecology. Methods Ecol. Evol. 2020, 11, 1483–1491. [Google Scholar] [CrossRef]
- Daru, B.H.; Elliott, T.L.; Park, D.S.; Davies, T.J. Understanding the Processes Underpinning Patterns of Phylogenetic Regionalization. Trends Ecol. Evol. 2017, 32, 845–860. [Google Scholar] [CrossRef] [PubMed]
- Smith, S.A.; Brown, J.W. Constructing a broadly inclusive seed plant phylogeny. Am. J. Bot. 2018, 105, 302–314. [Google Scholar] [CrossRef] [PubMed] [Green Version]
- Jin, Y.; Qian, H.V. PhyloMaker: An R package that can generate very large phylogenies for vascular plants. Ecography 2019, 42, 1353–1359. [Google Scholar] [CrossRef] [Green Version]
- Bruelheide, H.; Dengler, J.; Jiménez-Alfaro, B.; Purschke, O.; Hennekens, S.M.; Chytrý, M.; Pillar, V.D.; Jansen, F.; Kattge, J.; Sandel, B.; et al. sPlot–A new tool for global vegetation analyses. J. Veg. Sci. 2019, 30, 161–186. [Google Scholar] [CrossRef]
- Maitner, B.S.; Boyle, B.; Casler, N.; Condit, R.; Donoghue, J.; Durán, S.M.; Guaderrama, D.; Hinchliff, C.E.; Jørgensen, P.M.; Kraft, N.J.B.; et al. The bien r package: A tool to access the Botanical Information and Ecology Network (BIEN) database. Methods Ecol. Evol. 2018, 9, 373–379. [Google Scholar] [CrossRef] [Green Version]
- Davies, T.J.; Kraft, N.J.B.; Salamin, N.; Wolkovich, E.M. Incompletely resolved phylogenetic trees inflate estimates of phylogenetic conservatism. Ecology 2012, 93, 242–247. [Google Scholar] [CrossRef] [Green Version]
- Swenson, N.G. Phylogenetic Resolution and Quantifying the Phylogenetic Diversity and Dispersion of Communities. PLoS ONE 2009, 4, e4390. [Google Scholar] [CrossRef]
- Li, D.; Trotta, L.; Marx, H.E.; Allen, J.M.; Sun, M.; Soltis, D.E.; Soltis, P.S.; Guralnick, R.P.; Baiser, B. For common community phylogenetic analyses, go ahead and use synthesis phylogenies. Ecology 2019, 100, e02788. [Google Scholar] [CrossRef] [Green Version]
- Laffan, S.W.; Lubarsky, E.; Rosauer, D.F. Biodiverse, a tool for the spatial analysis of biological and related diversity. Ecography 2010, 33, 643–647. [Google Scholar] [CrossRef] [Green Version]
- Allen, J.M.; Germain-Aubrey, C.C.; Barve, N.; Neubig, K.M.; Majure, L.C.; Laffan, S.W.; Mishler, B.D.; Owens, H.L.; Smith, S.A.; Whitten, W.M.; et al. Spatial Phylogenetics of Florida Vascular Plants: The Effects of Calibration and Uncertainty on Diversity Estimates. iScience 2019, 11, 57–70. [Google Scholar] [CrossRef] [Green Version]
- Rosauer, D.; Laffan, S.W.; Crisp, M.D.; Donnellan, S.C.; Cook, L.G. Phylogenetic endemism: A new approach for identifying geographical concentrations of evolutionary history. Mol. Ecol. 2009, 18, 4061–4072. [Google Scholar] [CrossRef] [PubMed]
- Kissling, W.D.; Carl, G. Spatial autocorrelation and the selection of simultaneous autoregressive models. Glob. Ecol. Biogeogr. 2008, 17, 59–71. [Google Scholar] [CrossRef]
- Ver Hoef, J.M.; Peterson, E.E.; Hooten, M.B.; Hanks, E.M.; Fortin, M.J. Spatial autoregressive models for statistical inference from ecological data. Ecol. Monogr. 2018, 88, 36–59. [Google Scholar] [CrossRef] [Green Version]
- Bivand, R.S.; Wong, D.W.S. Comparing implementations of global and local indicators of spatial association. TEST 2018, 27, 716–748. [Google Scholar] [CrossRef]
- Noroozi, J.; Naqinezhad, A.; Talebi, A.; Doostmohammadi, M.; Plutzar, C.; Rumpf, S.B.; Asgarpour, Z.; Schneeweiss, G.M. Hotspots of vascular plant endemism in a global biodiversity hotspot in Southwest Asia suffer from significant conservation gaps. Biol. Conserv. 2019, 237, 299–307. [Google Scholar] [CrossRef]
- Xu, Y.; Shen, Z.; Ying, L.; Wang, Z.; Huang, J.; Zang, R.; Jiang, Y. Hotspot analyses indicate significant conservation gaps for evergreen broadleaved woody plants in China. Sci. Rep. 2017, 7, 1–10. [Google Scholar] [CrossRef] [Green Version]
- Proctor, J. Vegetation and soil and plant chemistry on ultramafic rocks in the tropical Far East. Perspect. Plant Ecol. Evol. Syst. 2003, 6, 105–124. [Google Scholar] [CrossRef] [Green Version]
- Rundel, P.W.; Arroyo, M.T.K.; Cowling, R.M.; Keeley, J.E.; Lamont, B.B.; Vargas, P. Mediterranean Biomes: Evolution of Their Vegetation, Floras, and Climate. Annu. Rev. Ecol. Evol. Syst. 2016, 47, 383–407. [Google Scholar] [CrossRef]
- Taberlet, P.; Fumagalli, L.; Wust-Saucy, A.G.; Cosson, J.F. Comparative phylogeography and postglacial colonization routes in Europe. Mol. Ecol. 1998, 7, 453–464. [Google Scholar] [CrossRef]
- Hewitt, G.M. Mediterranean Peninsulas: The Evolution of Hotspots. In Biodiversity Hotspots; Springer: Berlin/Heidelberg, Germany, 2011; pp. 123–147. [Google Scholar]
- Petit, R.J.; Aguinagalde, I.; De Beaulieu, J.L.; Bittkau, C.; Brewer, S.; Cheddadi, R.; Ennos, R.; Fineschi, S.; Grivet, D.; Lascoux, M.; et al. Glacial refugia: Hotspots but not melting pots of genetic diversity. Science 2003, 300, 1563–1565. [Google Scholar] [CrossRef] [Green Version]
- Griffiths, H.I.; Krystufek, B.; Reed, J.M. Balkan Biodiversity: Pattern and Process in the European Hotspot. J. Paleolimnol. 2007, 38, 609–611. [Google Scholar] [CrossRef]
- Tzedakis, P.C. The Balkans as Prime Glacial Refugial Territory of European Temperate Trees. In Balkan Biodiversity; Springer: Dordrecht, The Netherlands, 2004; pp. 49–68. [Google Scholar]
- Mansion, G.; Rosenbaum, G.; Schoenenberger, N.; Bacchetta, G.; Rosselló, J.A.; Conti, E. Phylogenetic analysis informed by geological history supports multiple, sequential invasions of the Mediterranean Basin by the angiosperm family Araceae. Syst. Biol. 2008, 57, 269–285. [Google Scholar] [CrossRef] [PubMed] [Green Version]
- Frajman, B.; Pachschwöll, C.; Schönswetter, P. Contributions to the knowledge of the flora of the dinarides (Balkan Peninsula). Phyt.-Ann. Rei Bot. 2014, 54, 27–46. [Google Scholar] [CrossRef]
- Lakušić, D.; Liber, Z.; Nikolić, T.; Surina, B.; Kovačić, S.; Bogdanović, S.; Stefanović, S. Molecular phylogeny of the Campanula pyramidalis species complex (Campanulaceae) inferred from chloroplast and nuclear non-coding sequences and its taxonomic implications. Taxon 2013, 62, 505–524. [Google Scholar] [CrossRef] [Green Version]
- Surina, B.; Schönswetter, P.; Schneeweiss, G.M. Quaternary range dynamics of ecologically divergent species (Edraianthus serpyllifolius and E. tenuifolius, Campanulaceae) within the Balkan refugium. J. Biogeogr. 2011, 38, 1381–1393. [Google Scholar] [CrossRef]
- Surina, B.; Schneeweiss, G.M.; Glasnović, P.; Schönswetter, P. Testing the efficiency of nested barriers to dispersal in the Mediterranean high mountain plant Edraianthus graminifolius (Campanulaceae). Mol. Ecol. 2014, 23, 2861–2875. [Google Scholar] [CrossRef]
- Kutnjak, D.; Kuttner, M.; Niketić, M.; Dullinger, S.; Schönswetter, P.; Frajman, B. Escaping to the summits: Phylogeography and predicted range dynamics of Cerastium dinaricum, an endangered high mountain plant endemic to the western Balkan Peninsula. Mol. Phylogenet. Evol. 2014, 78, 365–374. [Google Scholar] [CrossRef]
- Gaston, K.J.; David, R. Hotspots Across Europe. Biodivers. Lett. 1994, 2, 108. [Google Scholar] [CrossRef]
- Gómez, A.; Lunt, D.H. Refugia within Refugia: Patterns of Phylogeographic Concordance in the Iberian Peninsula. In Phylogeography of Southern European Refugia; Springer: Dordrecht, The Netherlands, 2007; pp. 155–188. ISBN 9781402049040. [Google Scholar]
- Médail, F.; Diadema, K. Glacial refugia influence plant diversity patterns in the Mediterranean Basin. J. Biogeogr. 2009, 36, 1333–1345. [Google Scholar] [CrossRef]
- Manafzadeh, S.; Salvo, G.; Conti, E. A tale of migrations from east to west: The Irano-Turanian floristic region as a source of Mediterranean xerophytes. J. Biogeogr. 2014, 41, 366–379. [Google Scholar] [CrossRef]
- Thompson, J.D. Plant Evolution in the Mediterranean; Oxford University Press: Oxford, UK, 2005; ISBN 0198515332. [Google Scholar]
- Magyari, E.K.; Chapman, J.C.; Gaydarska, B.; Marinova, E.; Deli, T.; Huntley, J.P.; Allen, J.R.M.; Huntley, B. The “oriental” component of the Balkan flora: Evidence of presence on the Thracian Plain during the Weichselian late-glacial. J. Biogeogr. 2008, 35, 865–883. [Google Scholar] [CrossRef]
- Đurović, S.; Schönswetter, P.; Niketić, M.; Tomović, G.; Frajman, B. Disentangling relationships among the members of the silene saxifraga alliance (Caryophyllaceae): Phylogenetic structure is geographically rather than taxonomically segregated. Taxon 2017, 66, 343–364. [Google Scholar] [CrossRef]
- Olšavská, K.; Slovák, M.; Marhold, K.; Štubňová, E.; Kučera, J. On the origins of Balkan endemics: The complex evolutionary history of the Cyanus napulifer group (Asteraceae). Ann. Bot. 2016, 118, 1071–1088. [Google Scholar] [CrossRef] [Green Version]
- Eastwood, W.J. Eastwood, W.J. East Mediterranean vegetation and climate change. In Balkan Biodiversity; Springer: Berlin/Heidelberg, Germany, 2004; pp. 25–48. [Google Scholar]
- Kryštufek, B.; Reed, J.M. Pattern and process in Balkan biodiversity—An overview. In Balkan Biodiversity; Springer: Berlin/Heidelberg, Germany, 2004; pp. 1–8. [Google Scholar]
- Stevanović, V.; Tan, K.; Petrova, A. Mapping the endemic flora of the Balkans—a progress report. Bocconea 2007, 21, 131–137. [Google Scholar]
- López-Vinyallonga, S.; López-Pujol, J.; Constantinidis, T.; Susanna, A.; Garcia-Jacas, N. Mountains and refuges: Genetic structure and evolutionary history in closely related, endemic Centaurea in continental Greece. Mol. Phylogenet. Evol. 2015, 92, 243–254. [Google Scholar] [CrossRef] [PubMed]
- Tan, K.; Stevanović, V.; Strid, A. Distribution and centres of diversity for endemic geophytic Monocots in the Balkans. Bocconea 2007, 21, 139–146. [Google Scholar]
- Georghiou, K.; Delipetrou, P. Patterns and traits of the endemic plants of Greece. Bot. J. Linn. Soc. 2010, 162, 130–422. [Google Scholar] [CrossRef] [Green Version]
- Strid, A. The Greek mountain flora, with special reference to the Central European element. Bocconea 1995, 5, 99–112. [Google Scholar]
- Phitos, D. The Red Data Book of Rare and Threatened Plants of Greece; World Wide Fund for Nature: Athens, Greece, 1995. [Google Scholar]
- Kontopanou, A.; Panitsa, M. Elevational Gradient of Chasmophytic Diversity, Monitoring and Conservation. Diversity 2020, 12, 33. [Google Scholar] [CrossRef] [Green Version]
- Strid, A. Phytogeographical aspects of the Greek mountain flora. Fragm. Florist. Geobot. Suppl. 1993, 2, 411–433. [Google Scholar]
- Buira, A.; Aedo, C.; Medina, L. Spatial patterns of the Iberian and Balearic endemic vascular flora. Biodivers. Conserv. 2017, 26, 479–508. [Google Scholar] [CrossRef]
- Buira, A.; Fernández-Mazuecos, M.; Aedo, C.; Molina-Venegas, R. The contribution of the edaphic factor as a driver of recent plant diversification in a Mediterranean biodiversity hotspot. J. Ecol. 2020. [CrossRef]
- Sosa, V.; Loera, I. Influence of current climate, historical climate stability and topography on species richness and endemism in Mesoamerican geophyte plants. PeerJ 2017, 5. [Google Scholar] [CrossRef] [PubMed] [Green Version]
- Millar, T.R.; Heenan, P.B.; Wilton, A.D.; Smissen, R.D.; Breitwieser, I. Spatial distribution of species, genus and phylogenetic endemism in the vascular flora of New Zealand, and implications for conservation. Aust. Syst. Bot. 2017, 30, 134–147. [Google Scholar] [CrossRef]
- Noroozi, J.; Talebi, A.; Doostmohammadi, M.; Rumpf, S.B.; Linder, H.P.; Schneeweiss, G.M. Hotspots within a global biodiversity hotspot-areas of endemism are associated with high mountain ranges. Sci. Rep. 2018, 8, 1–10. [Google Scholar] [CrossRef] [PubMed] [Green Version]
- Steinbauer, M.J.; Field, R.; Grytnes, J.A.; Trigas, P.; Ah-Peng, C.; Attorre, F.; Birks, H.J.B.; Borges, P.A.V.; Cardoso, P.; Chou, C.H.; et al. Topography-driven isolation, speciation and a global increase of endemism with elevation. Glob. Ecol. Biogeogr. 2016, 25, 1097–1107. [Google Scholar] [CrossRef]
- Irl, S.D.H.; Harter, D.E.V.; Steinbauer, M.J.; Gallego Puyol, D.; Fernández-Palacios, J.M.; Jentsch, A.; Beierkuhnlein, C. Climate vs. topography-spatial patterns of plant species diversity and endemism on a high-elevation island. J. Ecol. 2015, 103, 1621–1633. [Google Scholar] [CrossRef]
- Petrova, G.; Moyankova, D.; Nishii, K.; Forrest, L.; Tsiripidis, I.; Drouzas, A.D.; Djilianov, D.; Möller, M. The european paleoendemic haberlea rhodopensis (Gesneriaceae) has an oligocene origin and a pleistocene diversification and occurs in a long-persisting refugial area in southeastern europe. Int. J. Plant Sci. 2015, 176, 499–514. [Google Scholar] [CrossRef]
- Walas, L.; Ganatsas, P.; IszkuLo, G.; Thomas, P.A.; Dering, M. Spatial genetic structure and diversity of natural populations of Aesculus hippocastanum L. in Greece. PLoS ONE 2019, 14. [Google Scholar] [CrossRef] [Green Version]
- Hoorn, C.; Mosbrugger, V.; Mulch, A.; Antonelli, A. Biodiversity from mountain building. Nat. Geosci. 2013, 6, 154. [Google Scholar] [CrossRef]
- Mosbrugger, V.; Favre, A.; Muellner-Riehl, A.N.; Päckert, M.; Mulch, A. Cenozoic evolution of geo-biodiversity in the Tibeto-Himalayan region. Mt. Clim. Biodivers. 2018, 429, 448. [Google Scholar]
- Pyron, R.A.; Costa, G.C.; Patten, M.A.; Burbrink, F.T. Phylogenetic niche conservatism and the evolutionary basis of ecological speciation. Biol. Rev. 2015, 90, 1248–1262. [Google Scholar] [CrossRef] [PubMed]
- Sobierajska, K.; Boratyńska, K.; Jasińska, A.; Dering, M.; Ok, T.; Douaihy, B.; Bou Dagher-Kharrat, M.; Romo, Á.; Boratyński, A. Effect of the Aegean Sea barrier between Europe and Asia on differentiation in Juniperus drupacea (Cupressaceae). Bot. J. Linn. Soc. 2016, 180, 365–385. [Google Scholar] [CrossRef] [Green Version]
- Flantua, S.G.A.; Hooghiemstra, H. Historical connectivity and mountain biodiversity. Mt. Clim. Biodivers; Wiley Blackwell: Hoboken, NJ, USA, 2018; pp. 171–185. [Google Scholar]
- Papageorgiou, A.C.; Tsiripidis, I.; Mouratidis, T.; Hatziskakis, S.; Gailing, O.; Eliades, N.G.H.; Vidalis, A.; Drouzas, A.D.; Finkeldey, R. Complex fine-scale phylogeographical patterns in a putative refugial region for Fagus sylvatica (Fagaceae). Bot. J. Linn. Soc. 2014, 174, 516–528. [Google Scholar] [CrossRef] [Green Version]
- Trigas, P.; Iatrou, G.; Karetsos, G. Species diversity, endemism and conservation of the family Caryophyllaceae in Greece. Biodivers. Conserv. 2007, 16, 357–376. [Google Scholar] [CrossRef]
- Cecchi, L.; Coppi, A.; Selvi, F. Evolutionary dynamics of serpentine adaptation in Onosma (Boraginaceae) as revealed by ITS sequence data. Plant Syst. Evol. 2011, 297, 185–199. [Google Scholar] [CrossRef]
- Cecchi, L.; Selvi, F. Phylogenetic relationships of the monotypic genera Halacsya and Paramoltkia and the origins of serpentine adaptation in circummediterranean Lithospermeae (Boraginaceae): Insights from ITS and matK DNA sequences. Taxon 2009, 58, 700–714. [Google Scholar] [CrossRef]
- Augustinos, A.; Sotirakis, K.; Trigas, P.; Kalpoutzakis, E.; Papasotiropoulos, V. Genetic Variation in Three Closely Related Minuartia (Caryophyllaceae) Species Endemic to Greece: Implications for Conservation Management. Folia Geobot. 2014, 49, 603–621. [Google Scholar] [CrossRef]
- Tzanoudakis, D.; Panitsa, M.; Trigas, P.; Iatrou, G. Floristic and phytosociological investigation of the island Antikythera and nearby islets (SW Aegean area, Greece). Willdenowia 2006, 36, 285. [Google Scholar] [CrossRef] [Green Version]
- Runemark, H. The phytogeography of the central Aegean. Opera Bot. 1971, 30, 20–28. [Google Scholar]
- Tan, K.; Iatrou, G. Endemic lants of Greece-The Peloponnese; Tan, K., Iatrou, G., Eds.; Narayana Press: Gylling, Denmark, 2001; ISBN 87-12-03857-1. [Google Scholar]
- Perrigo, A.; Hoorn, C.; Antonelli, A. Why mountains matter for biodiversity. J. Biogeogr. 2020, 47, 315–325. [Google Scholar] [CrossRef] [Green Version]
- Gottschlich, G.; Dunkel, F.G. New taxa of Hieracium and Pilosella (Asteraceae) from Northern Greece. Stapfia 2018, 24, 3–24. [Google Scholar]
- Gottschlich, G.; Dunkel, F.G. New taxa of Hieracium and Pilosella (Asteraceae) from Northern Greece II. Stapfia 2019, 111, 5–32. [Google Scholar]
- Steinbauer, M.J.; Irl, S.D.H.; Beierkuhnlein, C. Elevation-driven ecological isolation promotes diversification on Mediterranean islands. Acta Oecologica 2013, 47, 52–56. [Google Scholar] [CrossRef]
- Flantua, S.G.A.; Payne, D.; Borregaard, M.K.; Beierkuhnlein, C.; Steinbauer, M.J.; Dullinger, S.; Essl, F.; Irl, S.D.H.; Kienle, D.; Kreft, H.; et al. Snapshot isolation and isolation history challenge the analogy between mountains and islands used to understand endemism. Glob. Ecol. Biogeogr. 2020, 29, 1651–1673. [Google Scholar] [CrossRef]
- Rundell, R.J.; Price, T.D. Adaptive radiation, nonadaptive radiation, ecological speciation and nonecological speciation. Trends Ecol. Evol. 2009, 24, 394–399. [Google Scholar] [CrossRef]
- Madriñán, S.; Cortés, A.J.; Richardson, J.E. Páramo is the world’s fastest evolving and coolest biodiversity hotspot. Front. Genet. 2013, 4, 193. [Google Scholar] [CrossRef] [Green Version]
- Hughes, C.E.; Atchison, G.W. The ubiquity of alpine plant radiations: From the Andes to the Hengduan Mountains. New Phytol. 2015, 207, 275–282. [Google Scholar] [CrossRef]
- Hewitt, G. Some genetic consequences of ice ages, and their role in divergence and speciation. Biol. J. Linn. Soc. 1996, 58, 247–276. [Google Scholar] [CrossRef]
- Hewitt, G.M. Genetic consequences of climatic oscillations in the Quaternary. Philos. Trans. R. Soc. B Biol. Sci. 2004, 359, 183–195. [Google Scholar] [CrossRef] [Green Version]
- Tzedakis, P.C.; Lawson, I.T.; Frogley, M.R.; Hewitt, G.M.; Preece, R.C. Buffered tree population changes in a quaternary refugium: Evolutionary implications. Science 2002, 297, 2044–2047. [Google Scholar] [CrossRef] [PubMed] [Green Version]
- Jones, K.E.; Korotkova, N.; Petersen, J.; Henning, T.; Borsch, T.; Kilian, N. Dynamic diversification history with rate upshifts in Holarctic bell-flowers (Campanula and allies). Cladistics 2017, 33, 637–666. [Google Scholar] [CrossRef]
- Zhang, Y.; Qian, L.; Spalink, D.; Sun, L.; Chen, J.; Sun, H. Spatial phylogenetics of two topographic extremes of the Hengduan Mountains in southwestern China and its implications for biodiversity conservation. Plant Divers. 2020. [Google Scholar] [CrossRef]
- Heenan, P.B.; Millar, T.R.; Smissen, R.D.; McGlone, M.S.; Wilton, A.D. Phylogenetic measures of neo- and palaeo-endemism in the indigenous vascular flora of the New Zealand archipelago. Aust. Syst. Bot. 2017, 30, 124–133. [Google Scholar] [CrossRef]
- Vokou, D.; Petanidou, T.; Bellos, D. Pollination ecology and reproductive potential of Jankaea heldreichii (Gesneriaceae); a tertiary relict on Mt Olympus, Greece. Biol. Conserv. 1990, 52, 125–133. [Google Scholar] [CrossRef]
- Dynesius, M.; Jansson, R. Evolutionary consequences of changes in species’ geographical distributions driven by Milankovitch climate oscillations. Proc. Natl. Acad. Sci. USA 2000, 97, 9115–9120. [Google Scholar] [CrossRef] [Green Version]
- Harrison, S.; Noss, R. Endemism hotspots are linked to stable climatic refugia. Ann. Bot. 2017, 119, 207–214. [Google Scholar] [CrossRef]
- Weber, L.C.; VanDerWal, J.; Schmidt, S.; McDonald, W.J.F.; Shoo, L.P. Patterns of rain forest plant endemism in subtropical Australia relate to stable mesic refugia and species dispersal limitations. J. Biogeogr. 2014, 41, 222–238. [Google Scholar] [CrossRef]
- Feng, G.; Ma, Z.; Sandel, B.; Mao, L.; Normand, S.; Ordonez, A.; Svenning, J.C. Species and phylogenetic endemism in angiosperm trees across the Northern Hemisphere are jointly shaped by modern climate and glacial–interglacial climate change. Glob. Ecol. Biogeogr. 2019, 28, 1393–1402. [Google Scholar] [CrossRef]
- Thornhill, A.H.; Baldwin, B.G.; Freyman, W.A.; Nosratinia, S.; Kling, M.M.; Morueta-Holme, N.; Madsen, T.P.; Ackerly, D.D.; Mishler, B.D. Spatial phylogenetics of the native California flora. BMC Biol. 2017, 15, 96. [Google Scholar] [CrossRef] [Green Version]
- Verboom, G.A.; Archibald, J.K.; Bakker, F.T.; Bellstedt, D.U.; Conrad, F.; Dreyer, L.L.; Forest, F.; Galley, C.; Goldblatt, P.; Henning, J.F.; et al. Origin and diversification of the Greater Cape flora: Ancient species repository, hot-bed of recent radiation, or both? Mol. Phylogenet. Evol. 2009, 51, 44–53. [Google Scholar] [CrossRef] [PubMed]
- Crowl, A.A.; Visger, C.J.; Mansion, G.; Hand, R.; Wu, H.-H.; Kamari, G.; Phitos, D.; Cellinese, N. Evolution and biogeography of the endemic Roucela complex (Campanulaceae: Campanula) in the Eastern Mediterranean. Ecol. Evol. 2015, 5, 5329–5343. [Google Scholar] [CrossRef] [PubMed]
- Koutroumpa, K.; Theodoridis, S.; Warren, B.H.; Jiménez, A.; Celep, F.; Doğan, M.; Romeiras, M.M.; Santos-Guerra, A.; Fernández-Palacios, J.M.; Caujapé-Castells, J.; et al. An expanded molecular phylogeny of Plumbaginaceae, with emphasis on Limonium (sea lavenders): Taxonomic implications and biogeographic considerations. Ecol. Evol. 2018, 8, 12397–12424. [Google Scholar] [CrossRef] [PubMed] [Green Version]
- Vargas, P.; Fernández-Mazuecos, M.; Heleno, R. Phylogenetic evidence for a Miocene origin of Mediterranean lineages: Species diversity, reproductive traits and geographical isolation. Plant Biol. 2018, 20, 157–165. [Google Scholar] [CrossRef] [PubMed]
- Bittkau, C.; Comes, H.P. Molecular inference of a Late Pleistocene diversification shift in Nigella s. lat. (Ranunculaceae) resulting from increased speciation in the Aegean archipelago. J. Biogeogr. 2009, 36, 1346–1360. [Google Scholar] [CrossRef]
- Comes, H.P.; Tribsch, A.; Bittkau, C. Plant speciation in continental island floras as exemplified by Nigella in the Aegean Archipelago. Philos. Trans. R. Soc. Lond. B. Biol. Sci. 2008, 363, 3083–3096. [Google Scholar] [CrossRef] [Green Version]
- Jaros, U.; Tribsch, A.; Comes, H.P. Diversification in continental island archipelagos: New evidence on the roles of fragmentation, colonization and gene flow on the genetic divergence of Aegean Nigella (Ranunculaceae). Ann. Bot. 2018, 121, 241–254. [Google Scholar] [CrossRef]
- Daru, B.H.; le Roux, P.C.; Gopalraj, J.; Park, D.S.; Holt, B.G.; Greve, M. Spatial overlaps between the global protected areas network and terrestrial hotspots of evolutionary diversity. Glob. Ecol. Biogeogr. 2019, 28, 757–766. [Google Scholar] [CrossRef]
- Forest, F.; Grenyer, R.; Rouget, M.; Davies, T.J.; Cowling, R.M.; Faith, D.P.; Balmford, A.; Manning, J.C.; Procheş, Ş.; Van Der Bank, M.; et al. Preserving the evolutionary potential of floras in biodiversity hotspots. Nature 2007. [Google Scholar] [CrossRef]
- Ceballos, G.; Ehrlich, P.R. Global mammal distributions, biodiversity hotspots, and conservation. Proc. Natl. Acad. Sci. USA 2006, 103, 19374–19379. [Google Scholar] [CrossRef] [Green Version]
- Orme, C.D.L.; Davies, R.G.; Burgess, M.; Eigenbrod, F.; Pickup, N.; Olson, V.A.; Webster, A.J.; Ding, T.-S.; Rasmussen, P.C.; Ridgely, R.S.; et al. Global hotspots of species richness are not congruent with endemism or threat. Nature 2005, 436, 1016–1019. [Google Scholar] [CrossRef] [PubMed]
- Phitos, D.; Constantinidis, T.H.; Kamari, G. The red data book of rare and threatened plants of Greece, Vol. II (EZ); Hellenic Botanical Society: Patras, Greece, 2009. [Google Scholar]
- Kokkoris, I.P.; Mallinis, G.; Bekri, E.S.; Vlami, V.; Zogaris, S.; Chrysafis, I.; Mitsopoulos, I.; Dimopoulos, P. National Set of MAES Indicators in Greece: Ecosystem Services and Management Implications. Forests 2020, 11, 595. [Google Scholar] [CrossRef]
- Venter, O.; Fuller, R.A.; Segan, D.B.; Carwardine, J.; Brooks, T.; Butchart, S.H.M.; Di Marco, M.; Iwamura, T.; Joseph, L.; O’Grady, D.; et al. Targeting Global Protected Area Expansion for Imperiled Biodiversity. PLoS Biol. 2014, 12, e1001891. [Google Scholar] [CrossRef] [Green Version]
- Rodrigues, A.S.L.; Akcakaya, H.R.; Andelman, S.J.; Bakarr, M.I.; Boitani, L.; Brooks, T.M.; Chanson, J.S.; Fishpool, L.D.C.; Da Fonseca, G.A.B.; Gaston, K.J. Global gap analysis: Priority regions for expanding the global protected-area network. Bioscience 2004, 54, 1092–1100. [Google Scholar] [CrossRef]
- Charitonidou, M.; Halley, J.M. What goes up must come down–why high fecundity orchids challenge conservation beliefs. Biol. Conserv. 2020, 252, 108835. [Google Scholar] [CrossRef]
- Laity, T.; Laffan, S.W.; González-Orozco, C.E.; Faith, D.P.; Rosauer, D.F.; Byrne, M.; Miller, J.T.; Crayn, D.; Costion, C.; Moritz, C.C.; et al. Phylodiversity to inform conservation policy: An Australian example. Sci. Total Environ. 2015, 534, 131–143. [Google Scholar] [CrossRef]
- Rosauer, D.F.; Byrne, M.; Blom, M.P.K.; Coates, D.J.; Donnellan, S.; Doughty, P.; Keogh, J.S.; Kinloch, J.; Laver, R.J.; Myers, C.; et al. Real-world conservation planning for evolutionary diversity in the Kimberley, Australia, sidesteps uncertain taxonomy. Conserv. Lett. 2018, 11, e12438. [Google Scholar] [CrossRef] [Green Version]
- LIFE-IP 4 NATURA. Available online: https://edozoume.gr/en/ (accessed on 12 April 2020).
- Maes, J.; Teller, A.; Erhard, M.; Grizzetti, B.; Barredo, J.I.; Paracchini, M.-L.; Condé, S.; Somma, F.; Orgiazzi, A.; Jones, A. Mapping and Assessment of Ecosystems and their Services: An analytical framework for ecosystem condition. Publ. Off. Eur. Union Luxemb. 2018, 5, 1–78. [Google Scholar]
- Cheminal, A.; Kokkoris, I.P.; Strid, A.; Dimopoulos, P. Medicinal and Aromatic Lamiaceae Plants in Greece: Linking Diversity and Distribution Patterns with Ecosystem Services. Forests 2020, 11, 661. [Google Scholar] [CrossRef]
Figure 1.
Upper panel: Map of Greece presenting major mountain massifs, as well as Aegean and Ionian islands that were identified as biodiversity hotspots and/or endemism centres and mentioned in the text. 1: Mt Falakron, 2: Mt Pangeon, 3: Chalkidiki mountains, 4: Mt Athos, 5: Isl. Thasos, 6: Isl. Samothraki, 7: Mt. Voras, 8: Lake Prespa area, 9: Mt. Vourinos, 10: Mt. Olympus, 11: Thessalian plain, 12: Vikos gorge, 13: Mt. Iti, 14: Mt Parnassos, 15: Isl Evvia, 16: Isl Skyros, 17: Isl Lesvos, 18: Isl Samos, 19: Isl Naxos, 20: Isl Rodos, 21: Mt Chelmos, 22: Mt Kyllini, 23: Mt Parnonas, 24: Mt Taygetos, 25: Isl Kithira, 26: Lefka Ori mountain range, 27: Isl Karpathos, 28: Isl Kefallinia. Red-dashed ellipses indicate (a) Pindos mountain range and (b) Kiklades island complex. Lower panel: Red colouring indicates the Mediterranean Biodiversity Hotspot (shapefile available from [130]).

Figure 2.
Endemic plant species richness in Greece (number of Greek endemic plant species per grid cell).
Figure 2.
Endemic plant species richness in Greece (number of Greek endemic plant species per grid cell).

Figure 3.
Native plant species richness in Greece (number of native plant species per grid cell).

Figure 4.
Corrected weighted endemism values for the Greek endemic plant taxa (CWEEND) occurring in each grid cell in Greece.
Figure 4.
Corrected weighted endemism values for the Greek endemic plant taxa (CWEEND) occurring in each grid cell in Greece.

Figure 5.
Red colouring indicates cells with Level-1 (top-1%) CWEEND values. Blue colouring indicates cells with values from the 1% percentile (CWEEND coldspots). Green polygons depict the Natura 2000 SACs in Greece.
Figure 5.
Red colouring indicates cells with Level-1 (top-1%) CWEEND values. Blue colouring indicates cells with values from the 1% percentile (CWEEND coldspots). Green polygons depict the Natura 2000 SACs in Greece.

Figure 6.
Corrected weighted endemism values for the native plant taxa (CWENAT) occurring in each grid cell in Greece.
Figure 6.
Corrected weighted endemism values for the native plant taxa (CWENAT) occurring in each grid cell in Greece.

Figure 7.
Map of significant phylogenetic endemism (PE) identified by the categorical analysis of neo- and paleo-endemism (CANAPE) analysis for the endemic plant taxa occurring in Greece. Dark green colouring indicates the areas where ultramafic rocks occur in Greece.
Figure 7.
Map of significant phylogenetic endemism (PE) identified by the categorical analysis of neo- and paleo-endemism (CANAPE) analysis for the endemic plant taxa occurring in Greece. Dark green colouring indicates the areas where ultramafic rocks occur in Greece.

Figure 8.
Richest plant families and genera [left (A) and right (B) panel, respectively] exclusively occurring in a single endemism centre type.
Figure 8.
Richest plant families and genera [left (A) and right (B) panel, respectively] exclusively occurring in a single endemism centre type.

Figure 9.
From left to right: (A) Altitudinal distribution, (B) Climate stability values and (C) Global Human Modification index values of the different types of endemism centres identified by the CANAPE analysis in Greece.
Figure 9.
From left to right: (A) Altitudinal distribution, (B) Climate stability values and (C) Global Human Modification index values of the different types of endemism centres identified by the CANAPE analysis in Greece.

Figure 10.
Red colouring indicates cells identified as Priority Hotspots with Level-3 (top 10%) CWEEND and PE values that are inside the Natura 2000 SACs. Blue colouring indicates cells identified as Priority Hotspots with Level-3 (top 10%) CWEEND and PE values that are outside the Natura 2000 SACs. Green polygons depict the Natura 2000 SACs in Greece.


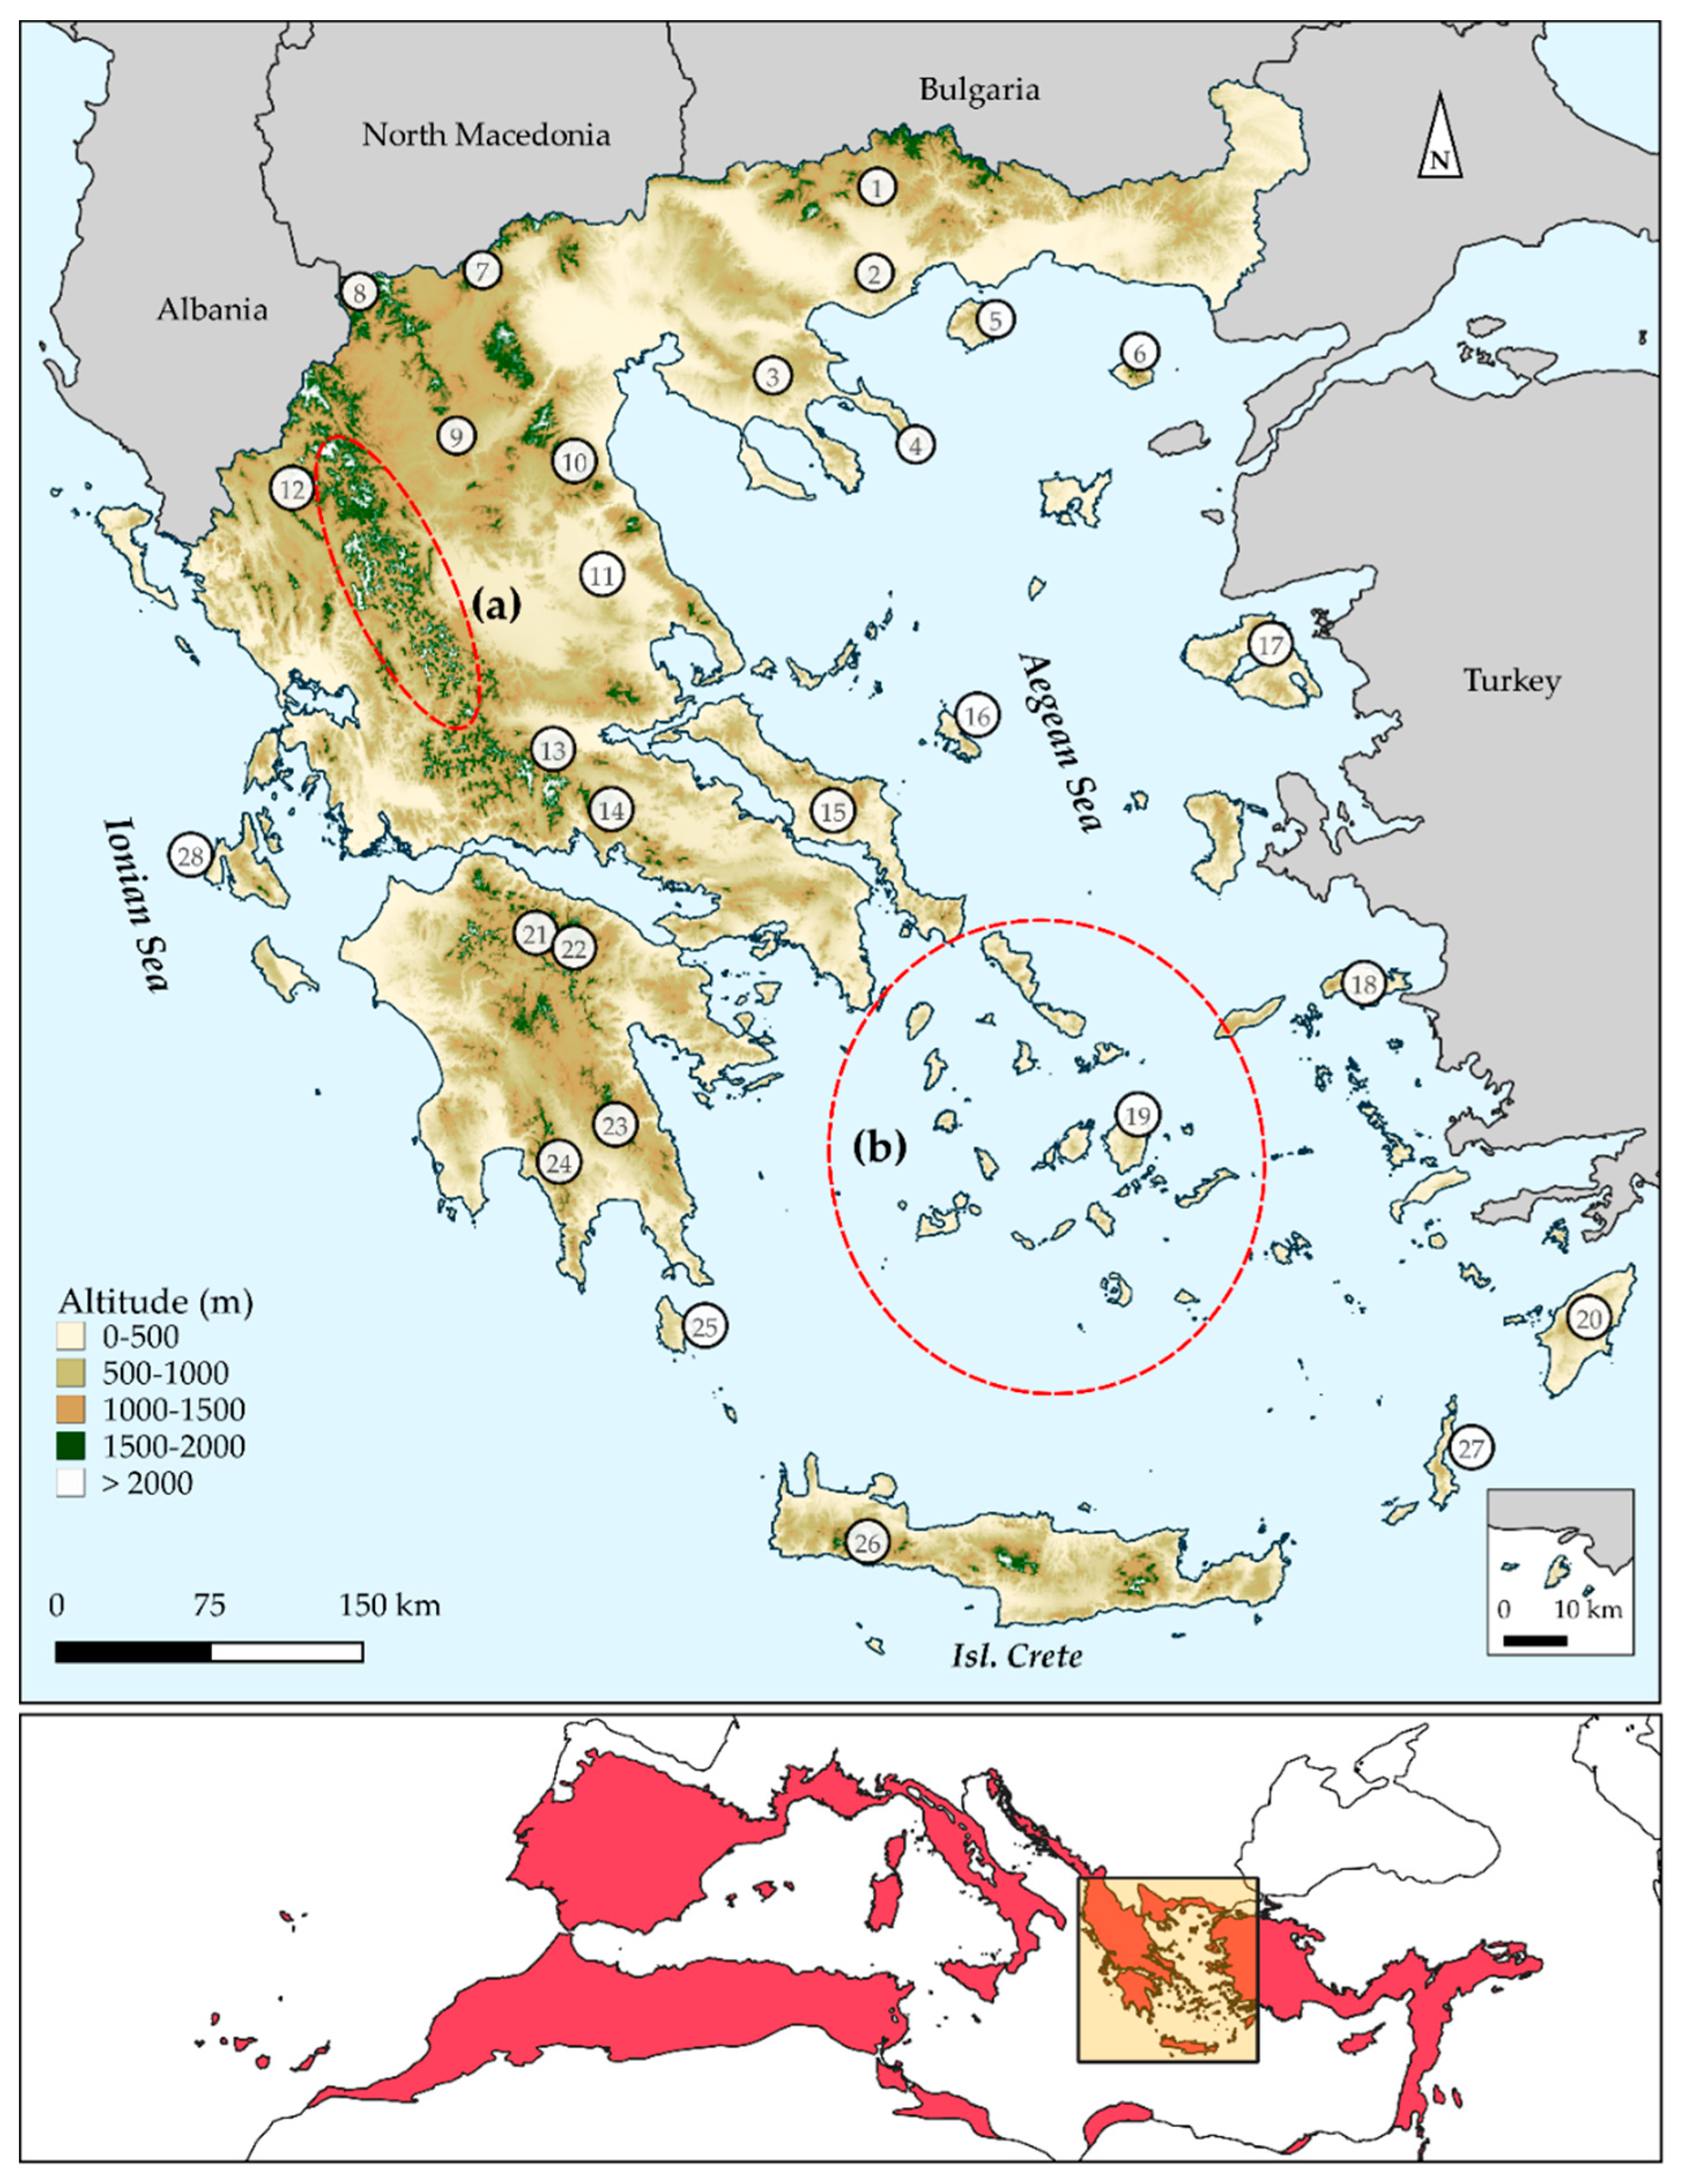
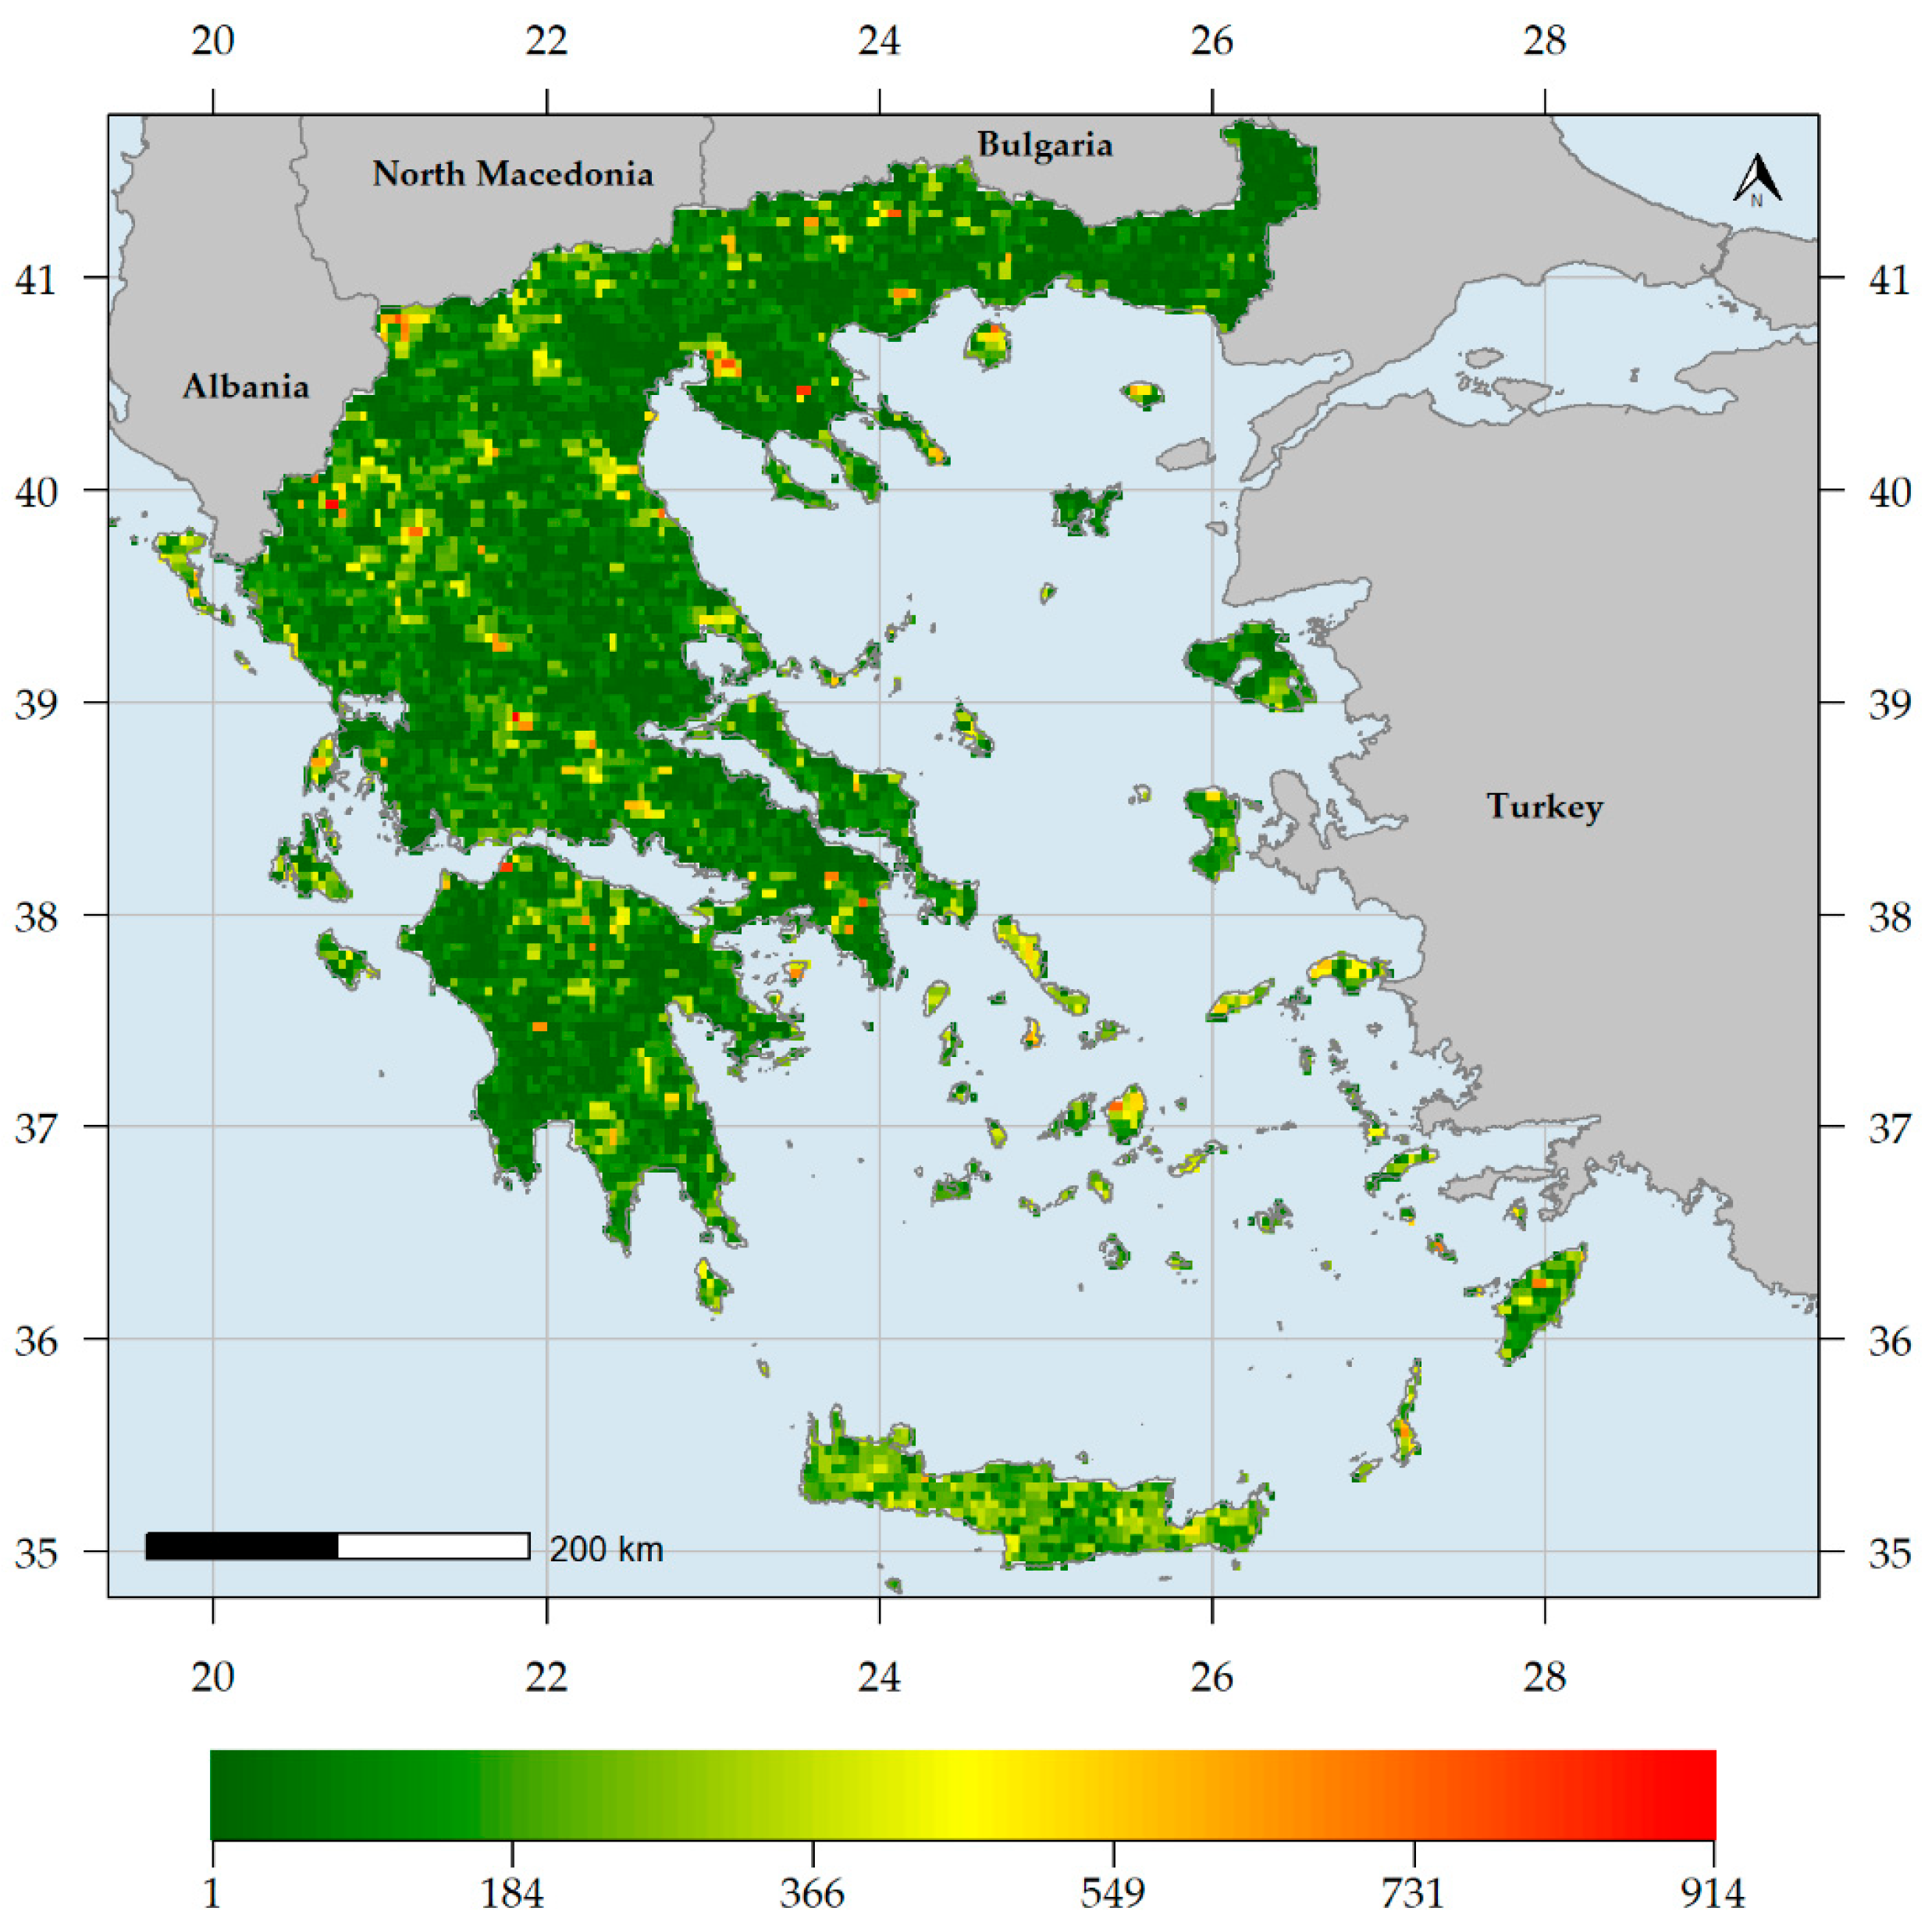
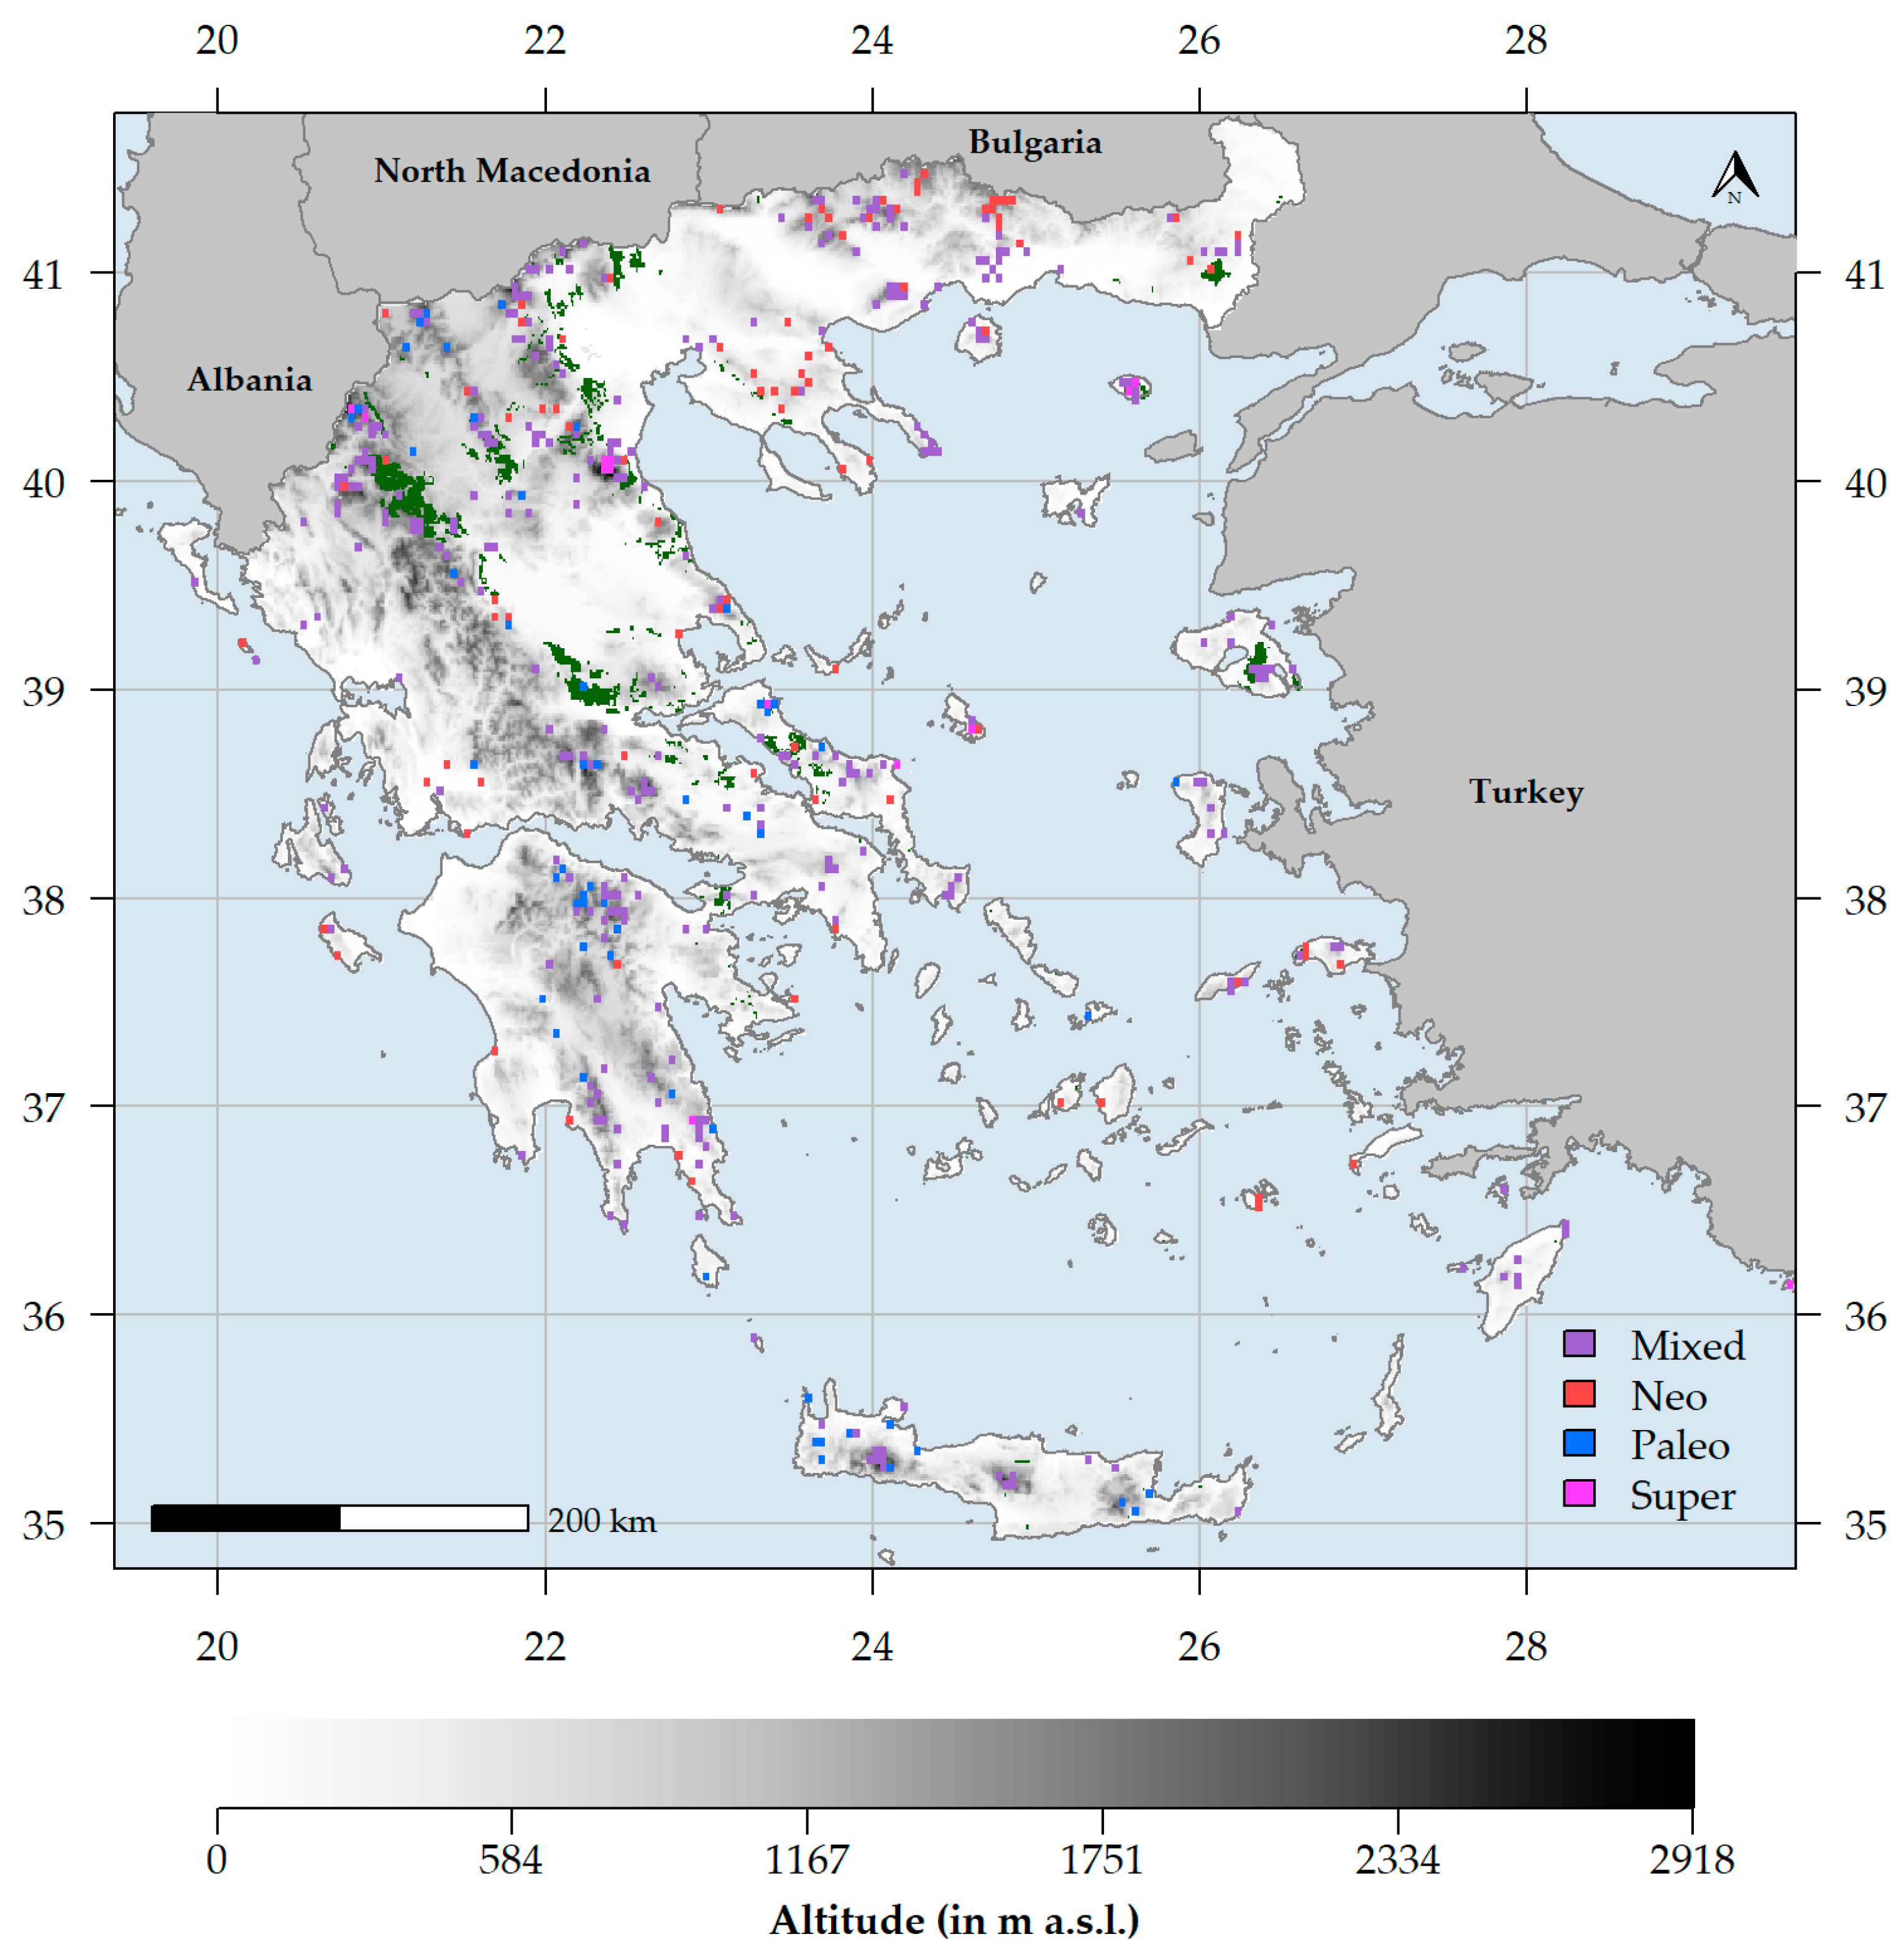
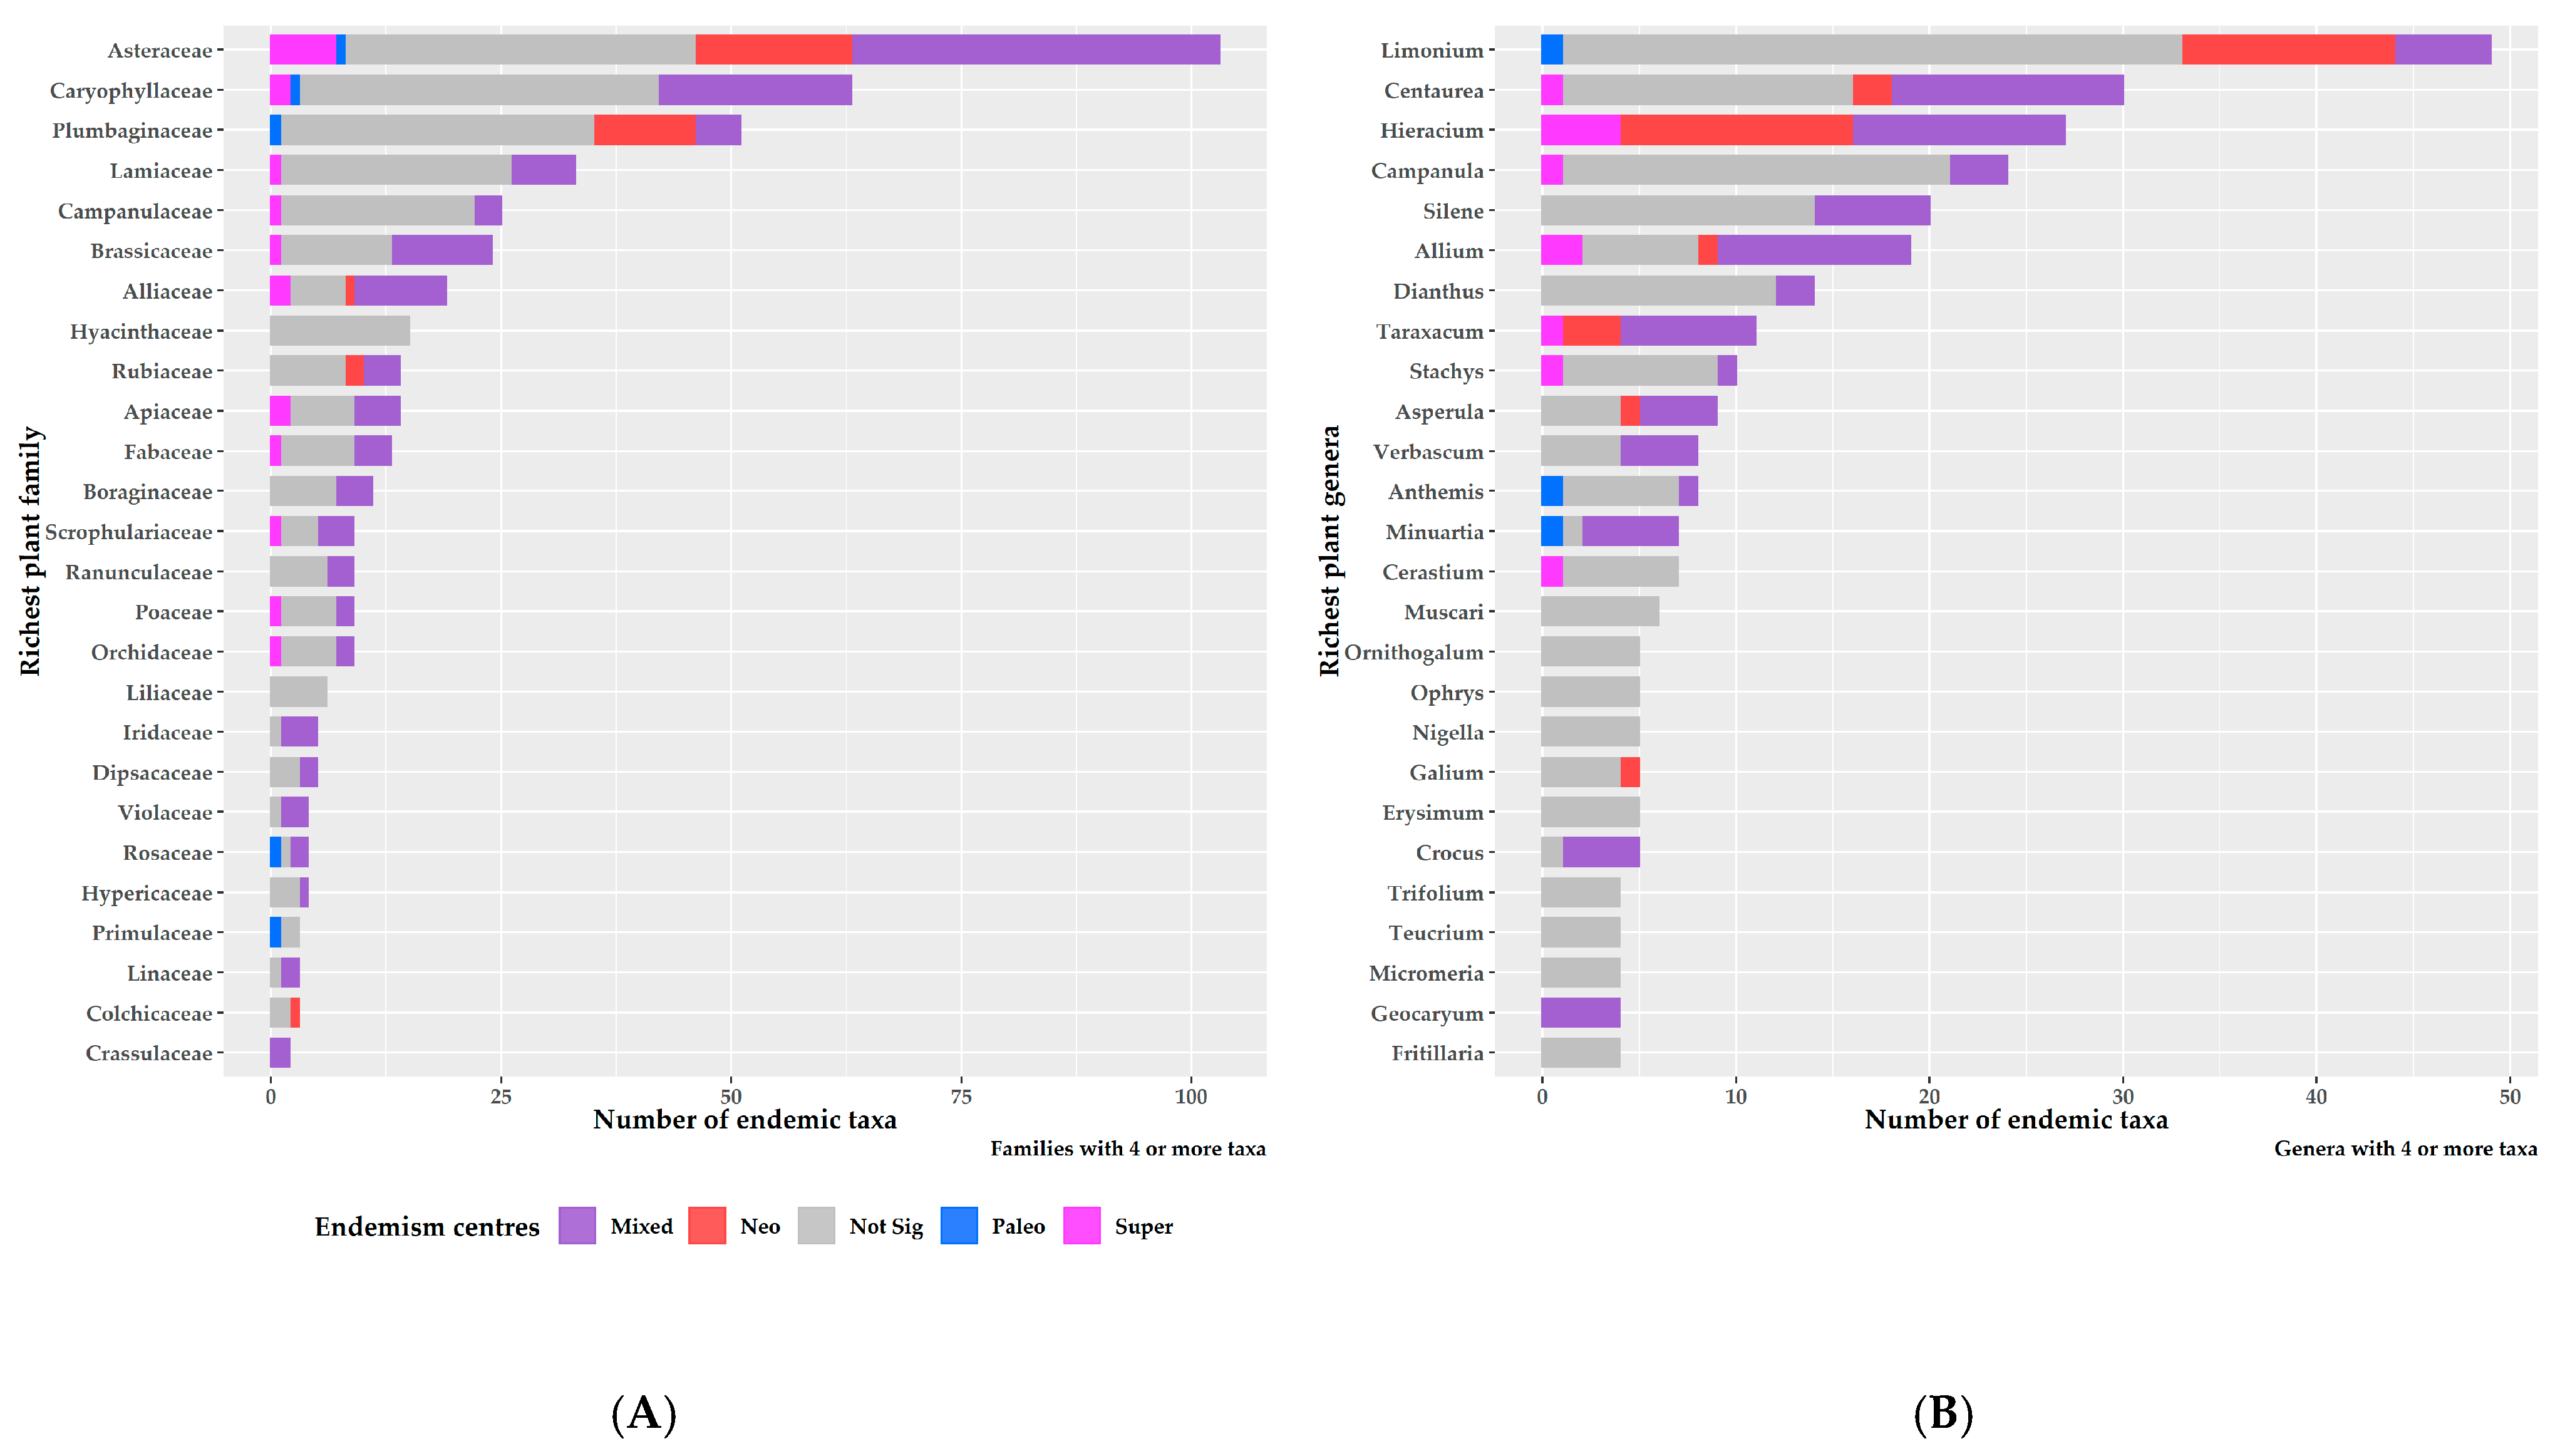
Table 1.
Best spatial autoregressive error models (SARerr) for the relationships among the number of native (SR) and endemic (ER) taxa, corrected weighted endemism of the native (CWENAT) and the endemic taxa (CWEEND), phylogenetic endemism (PE), relative phylogenetic endemism (RPE) and the predictor variables. GR2: Gelkerke pseudo-R-squared. AICc: Akaike Information criterion corrected for small samples. Asterisks denote: * p < 0.05, ** p < 0.001. AIT: Thornthwaite’s aridity index. CS: Climate stability. Iso: Isothermality. PETDRQ: potential evapotranspiration of the driest quarter. PETWETQ: potential evapotranspiration of the wettest quarter. TPI: topographic position index. Geology refers to whether a grid cell is classified as calcareous or not. Only the statistically significant variables are shown.
| Response | Predictor | Coefficients | GR2 | AICc |
|---|---|---|---|---|
| SR | AIT | 11.4 ** | 18.1 | 83671 |
| TPI | −43.02 ** | |||
| PETDRQ | −7.64 ** | |||
| PETWETQ | 8.25 ** | |||
| pH | 10.17 ** | |||
| Slope | 20.66 ** | |||
| Altitude | 43.37 ** | |||
| Iso | −19.78 ** | |||
| ER | AIT | 1.73 ** | 48.0 | 44316 |
| PETDRQ | −0.97 ** | |||
| pH | 0.71 ** | |||
| Slope | 0.73 ** | |||
| Altitude | 4.64 ** | |||
| Iso | −0.91 ** | |||
| CS | −1.52 ** | |||
| CWENAT | AIT | −0.14 ** | 28.5 | 24798 |
| TPI | −0.18 ** | |||
| PETDRQ | −0.37 ** | |||
| Altitude | 0.51 ** | |||
| CWEEND | AIT | 0.1 ** | 32.7 | 6262 |
| TPI | −0.06 ** | |||
| pH | 0.09 ** | |||
| Altitude | 0.39 ** | |||
| CS | −0.09 ** | |||
| PE | Geology | 0.25 * | 26.0 | 21959 |
| PETDRQ | −0.55 * | |||
| RPE | AIT | −0.14 ** | 28.5 | 24798 |
| TPI | −0.18 ** | |||
| PETDRQ | −0.37 ** | |||
| Altitude | 0.51 ** |
Publisher’s Note: MDPI stays neutral with regard to jurisdictional claims in published maps and institutional affiliations. |
© 2021 by the authors. Licensee MDPI, Basel, Switzerland. This article is an open access article distributed under the terms and conditions of the Creative Commons Attribution (CC BY) license (http://creativecommons.org/licenses/by/4.0/).
Share and Cite
MDPI and ACS Style
Kougioumoutzis, K.; Kokkoris, I.P.; Panitsa, M.; Kallimanis, A.; Strid, A.; Dimopoulos, P. Plant Endemism Centres and Biodiversity Hotspots in Greece. Biology 2021, 10, 72. https://0-doi-org.brum.beds.ac.uk/10.3390/biology10020072
AMA Style
Kougioumoutzis K, Kokkoris IP, Panitsa M, Kallimanis A, Strid A, Dimopoulos P. Plant Endemism Centres and Biodiversity Hotspots in Greece. Biology. 2021; 10(2):72. https://0-doi-org.brum.beds.ac.uk/10.3390/biology10020072
Chicago/Turabian StyleKougioumoutzis, Konstantinos, Ioannis P. Kokkoris, Maria Panitsa, Athanasios Kallimanis, Arne Strid, and Panayotis Dimopoulos. 2021. "Plant Endemism Centres and Biodiversity Hotspots in Greece" Biology 10, no. 2: 72. https://0-doi-org.brum.beds.ac.uk/10.3390/biology10020072
Note that from the first issue of 2016, this journal uses article numbers instead of page numbers. See further details here.