
High-Intensity Warm-Up Increases Anaerobic Energy Contribution during 100-m Sprint

 ,
, 


Abstract
:Simple Summary
Abstract
1. Introduction
2. Materials and Methods
2.1. Participants
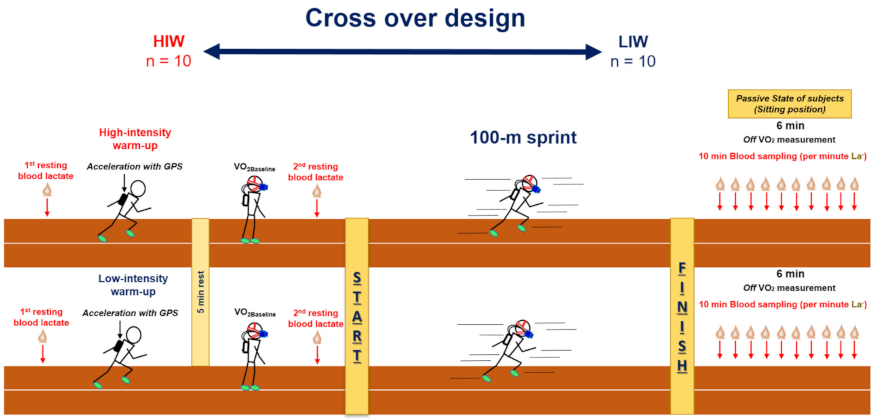
2.2. Study Design
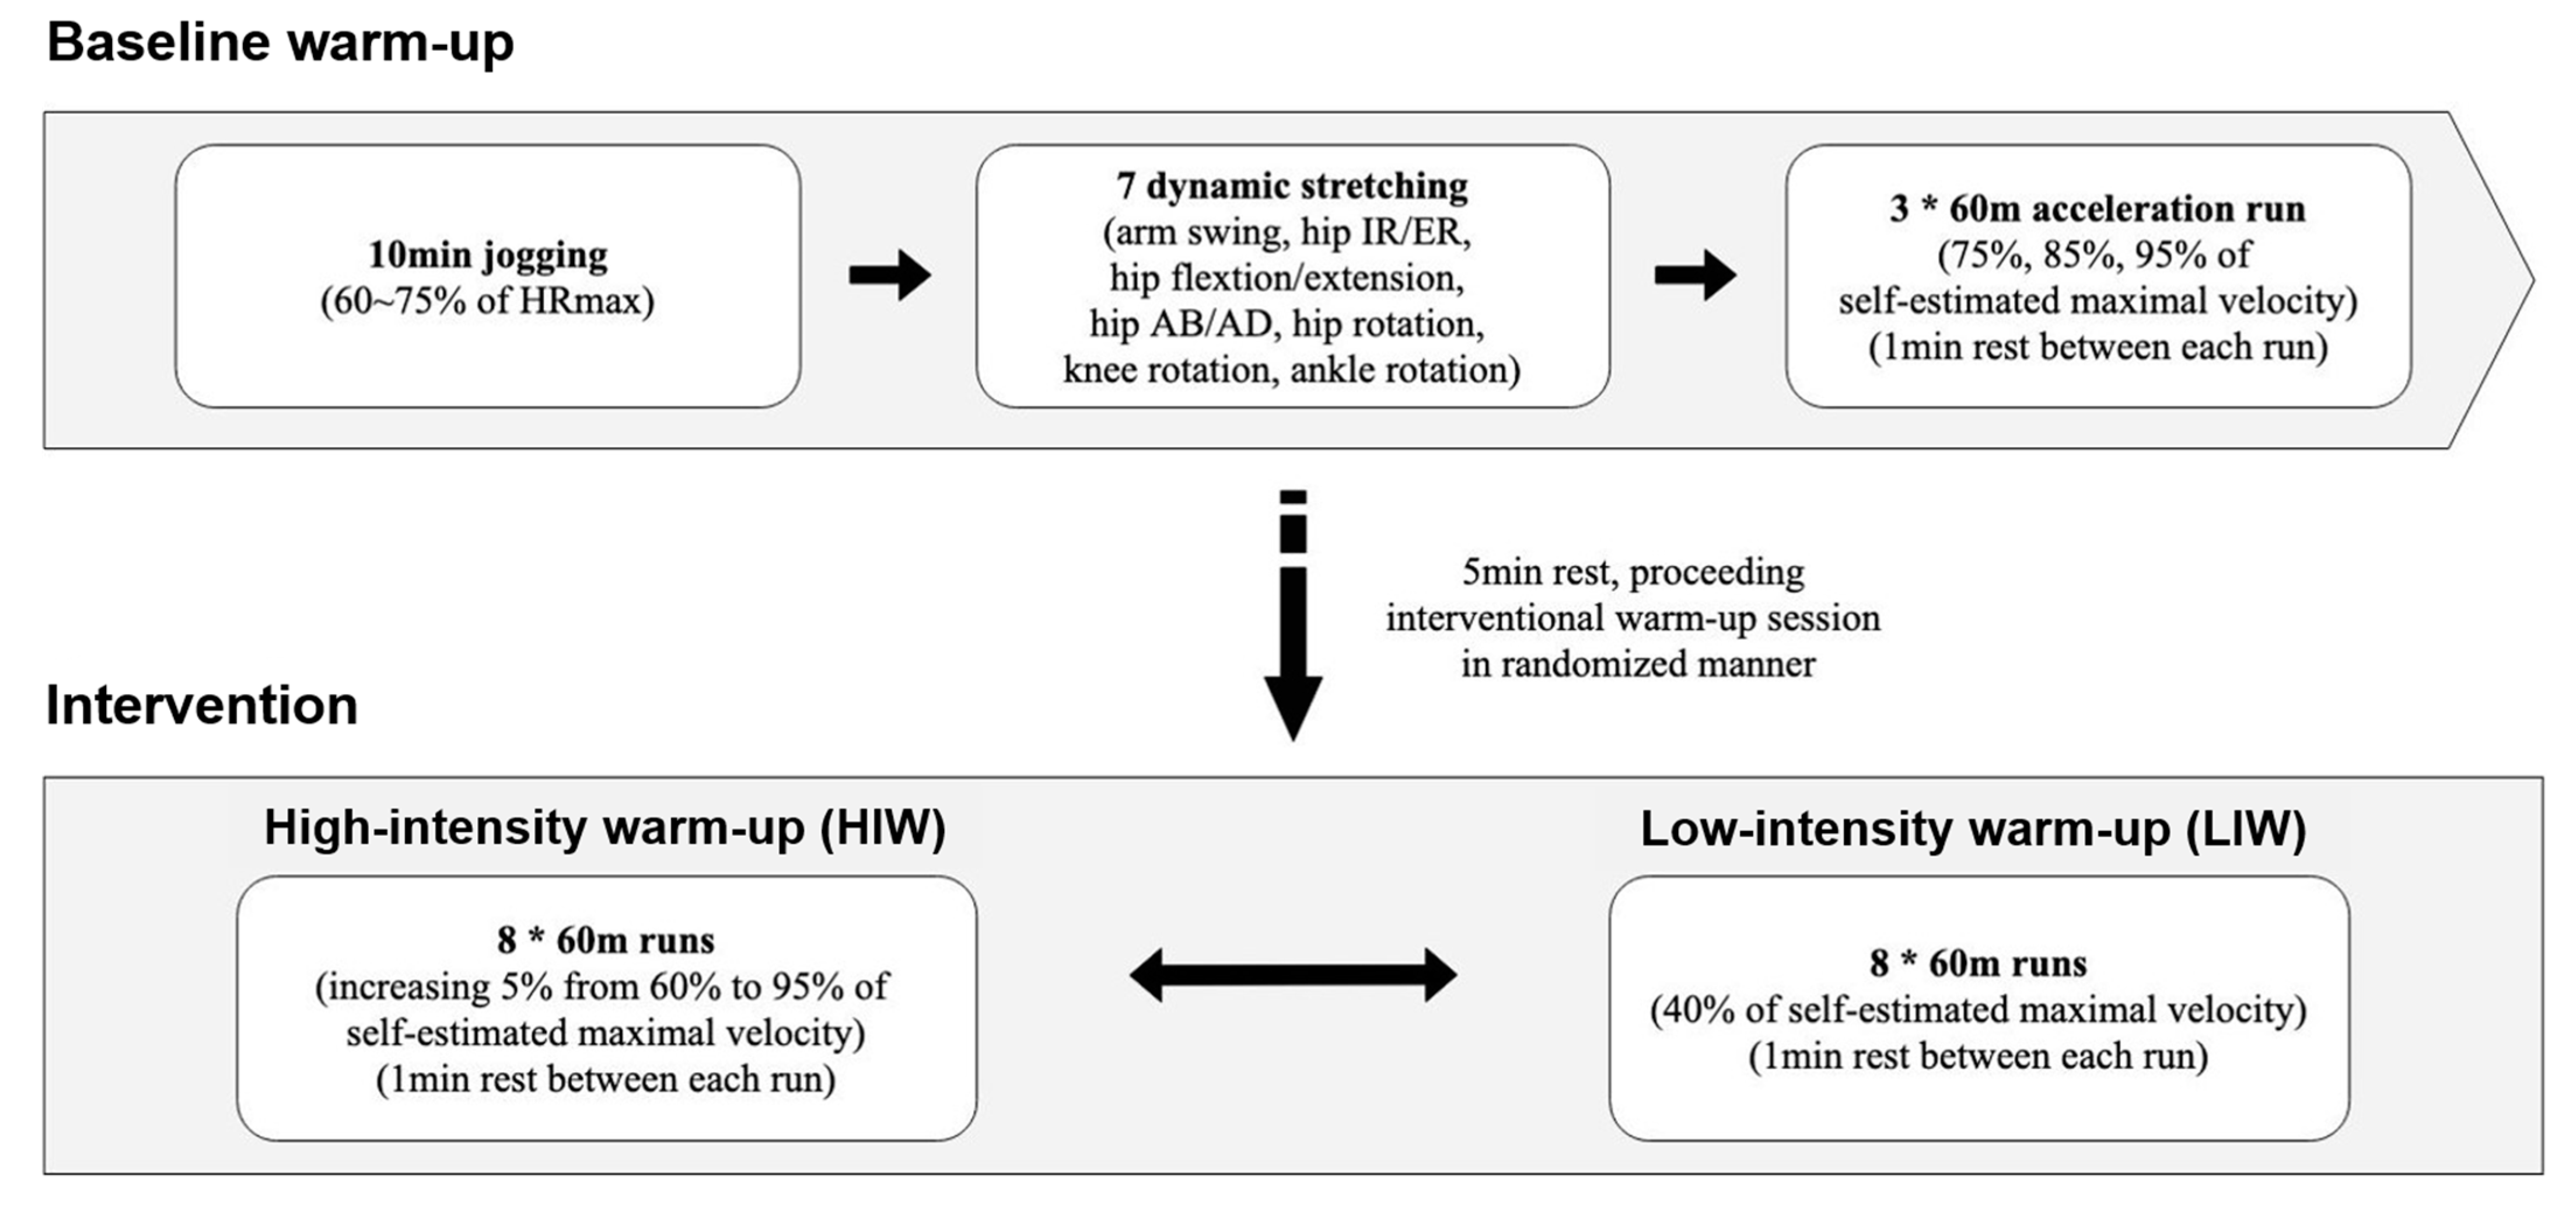
2.3. Warm-Up Protocol
2.4. Study Procedure
2.5. Calculating Energy System Contributions
2.6. Statistical Analysis
3. Results
3.1. Physiological Parameters
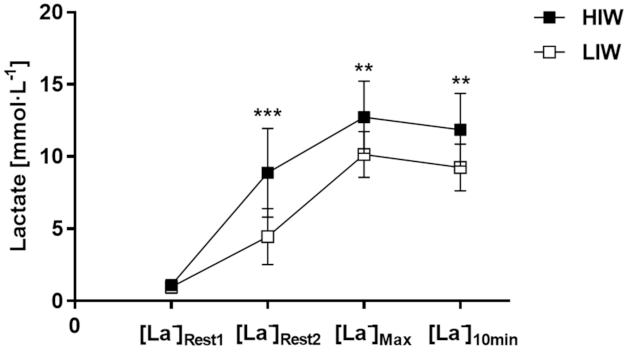
3.2. Blood Lactate Concentration
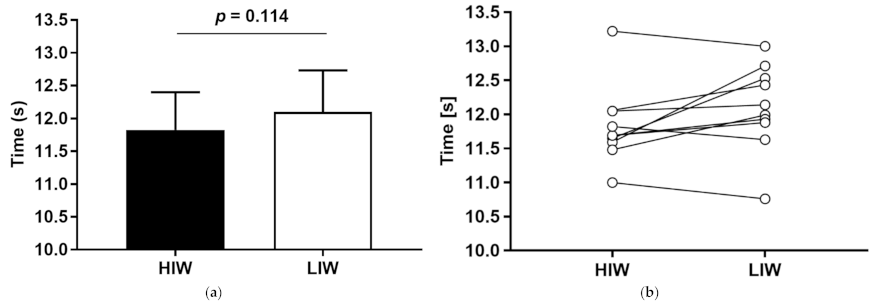
3.3. 100-m Time Sprint Trial
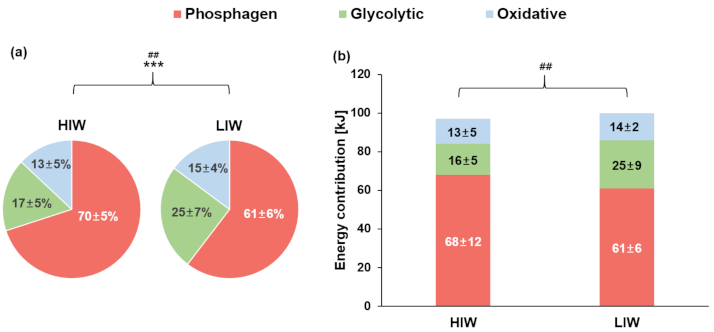
3.4. Energy System Contributions
4. Discussion
5. Conclusions
Supplementary Materials
Author Contributions
Funding
Institutional Review Board Statement
Informed Consent Statement
Data Availability Statement
Conflicts of Interest
References
- Ferguson, B.S.; Rogatzki, M.J.; Goodwin, M.L.; Kane, D.A.; Rightmire, Z.; Gladden, L.B. Lactate metabolism: Historical context, prior misinterpretations, and current understanding. Eur. J. Appl. Physiol. 2018, 118, 691–728. [Google Scholar] [CrossRef]
- Newsholme, E.A.; Leech, A.; Leech, T.; Duester, G. Keep on Running: The Science of Training and Performance; John Wiley & Sons Incorporated: Hoboken, NJ, USA, 1994. [Google Scholar]
- Duffield, R.; Dawson, B.; Goodman, C. Energy system contribution to 100-m and 200-m track running events. J. Sci. Med. Sport 2004, 7, 302–313. [Google Scholar] [CrossRef]
- Majumdar, A.S.; Robergs, R.A. The science of speed: Determinants of performance in the 100 m sprint. Int. J. Sports Sci. Coach. 2011, 6, 479–493. [Google Scholar] [CrossRef]
- Quittmann, O.J.; Appelhans, D.; Abel, T.; Strüder, H.K. Evaluation of a sport-specific field test to determine maximal lactate accumulation rate and sprint performance parameters in running. J. Sci. Med. Sport 2020, 23, 27–34. [Google Scholar] [CrossRef] [Green Version]
- Hauser, T.; Adam, J.; Schulz, H. Comparison of calculated and experimental power in maximal lactate-steady state during cycling. Theor. Biol. Med. Model. 2014, 11, 1. [Google Scholar] [CrossRef] [Green Version]
- Hirvonen, J.; Rehunen, S.; Rusko, H.; Härkönen, M. Breakdown of high-energy phosphate compounds and lactate accumulation during short supramaximal exercise. Eur. J. Appl. Physiol. Occup. Physiol. 1987, 56, 253–259. [Google Scholar] [CrossRef]
- Hargreaves, M.; Spriet, L.L. Skeletal muscle energy metabolism during exercise. Nat. Metab. 2020, 2, 817–828. [Google Scholar] [CrossRef]
- Sauer, U.; Schlattner, U. Inverse metabolic engineering with phosphagen kinase systems improves the cellular energy state. Metab. Eng. 2004, 6, 220–228. [Google Scholar] [CrossRef] [PubMed]
- Dawson, B.; Goodman, C.; Lawrence, S.; Preen, D.; Polglaze, T.; Fitzsimons, M.; Fournier, P. Muscle phosphocreatine repletion following single and repeated short sprint efforts. Scand. J. Med. Sci. Sports 1997, 7, 206–213. [Google Scholar] [CrossRef]
- Gaitanos, G.C.; Williams, C.; Boobis, L.H.; Brooks, S. Human muscle metabolism during intermittent maximal exercise. Appl. Physiol. 1993, 75, 712–719. [Google Scholar] [CrossRef] [Green Version]
- Gastin, P.B. Energy system interaction and relative contribution during maximal exercise. Sports Med. 2001, 31, 725–741. [Google Scholar] [CrossRef] [PubMed]
- Little, T.; Williams, A.G. Effects of sprint duration and exercise: Rest ratio on repeated sprint performance and physiological responses in professional soccer players. J. Strength Cond. Res. 2007, 21, 646–648. [Google Scholar] [CrossRef] [PubMed]
- Baker, J.S.; McCormick, M.C.; Robergs, R.A. Interaction among skeletal muscle metabolic energy systems during intense exercise. J. Nutr. Metab. 2010, 2010, 905612. [Google Scholar] [CrossRef] [Green Version]
- Korhonen, M.T.; Suominen, H.; Mero, A. Age and sex differences in blood lactate response to sprint running in elite master athletes. Can. J. Appl. Physiol. 2005, 30, 647–665. [Google Scholar] [CrossRef]
- Hautier, C.; Wouassi, D.; Arsac, L.; Bitanga, E.; Thiriet, P.; Lacour, J. Relationships between postcompetition blood lactate concentration and average running velocity over 100-m and 200-m races. Eur. J. Appl. Physiol. Occup. Physiol. 1994, 68, 508–513. [Google Scholar] [CrossRef]
- Heck, H.; Schulz, H.; Bartmus, U. Diagnostics of anaerobic power and capacity. Eur. J. Sport Sci. 2003, 3, 1–23. [Google Scholar] [CrossRef]
- Mader, A. Glycolysis and oxidative phosphorylation as a function of cytosolic phosphorylation state and power output of the muscle cell. Eur. J. Appl. Physiol. 2003, 88, 317–338. [Google Scholar] [CrossRef]
- Beneke, R.; Hütler, M.; Jung, M.; Leithäuser, R.M. Modeling the blood lactate kinetics at maximal short-term exercise conditions in children, adolescents, and adults. J. Appl. Physiol. 2005, 99, 499–504. [Google Scholar] [CrossRef] [PubMed]
- Hultman, E.; Greenhaff, P.L.; Ren, J.M.; Söderlund, K. Energy metabolism and fatigue during intense muscle contraction. Biochem. Soc. Trans. 1991, 19, 347–353. [Google Scholar] [CrossRef]
- Mookerjee, S.A.; Nicholls, D.G.; Brand, M.D. Determining Maximum Glycolytic Capacity Using Extracellular Flux Measurements. PLoS ONE 2016, 11, e0152016. [Google Scholar] [CrossRef] [PubMed] [Green Version]
- Quittmann, O.J.; Abel, T.; Zeller, S.; Foitschik, T.; Strüder, H.K. Lactate kinetics in handcycling under various exercise modalities and their relationship to performance measures in able-bodied participants. Eur. J. Appl. Physiol. 2018, 118, 1493–1505. [Google Scholar] [CrossRef]
- Burnley, M.; Doust, J.H.; Jones, A.M. Effects of prior warm-up regime on severe-intensity cycling performance. Sports Exerc. 2005, 37, 838–845. [Google Scholar] [CrossRef] [PubMed]
- Fujii, N.; Nishida, Y.; Ogawa, T.; Tanigawa, S.; Nishiyasu, T. Effects of work-matched moderate-and high-intensity warm-up on power output during 2-min supramaximal cycling. Biol. Sport 2018, 35, 223. [Google Scholar] [CrossRef] [PubMed]
- Mikołajec, K.; Poprzęcki, S.; Zając, A.; Cholewa, J. Effects of Warm-up Intensity on Anaerobic Performance. J. Hum. Kinet. 2007, 17, 41–52. [Google Scholar]
- Mujika, I.; de Txabarri, R.G.; Maldonado-Martín, S.; Pyne, D.B. Warm-up intensity and duration’s effect on traditional rowing time-trial performance. Int. J. Sports Physiol. Perform. 2012, 7, 186–188. [Google Scholar] [CrossRef] [PubMed]
- Howlett, R.A.; Parolin, M.L.; Dyck, D.J.; Hultman, E.; Jones, N.L.; Heigenhauser, G.J.; Spriet, L.L. Regulation of skeletal muscle glycogen phosphorylase and PDH at varying exercise power outputs. Am. J. Physiol. Regul. Integr. Comp. 1998, 275, R418–R425. [Google Scholar] [CrossRef] [PubMed] [Green Version]
- Coccimiglio, I.F.; Clarke, D.C. ADP is the dominant controller of AMP-activated protein kinase activity dynamics in skeletal muscle during exercise. PLoS Comput. Biol. 2020, 16, e1008079. [Google Scholar] [CrossRef]
- van den Tillaar, R.; Lerberg, E.; von Heimburg, E. Comparison of three types of warm-up upon sprint ability in experienced soccer players. J. Sport Health Sci. 2019, 8, 574–578. [Google Scholar] [CrossRef] [Green Version]
- Gellish, R.L.; Goslin, B.R.; Olson, R.E.; Mcdonald, A.; Russi, G.D.; Moudgil, V.K. Longitudinal modeling of the relationship between age and maximal heart rate. Med. Sci. Sports Exerc. 2007, 39, 822–829. [Google Scholar] [CrossRef]
- Halouani, J.; Ghattasi, K.; Bouzid, M.A.; Rosemann, T.; Nikolaidis, P.T.; Chtourou, H.; Knechtle, B. Physical and Physiological Responses during the Stop-Ball Rule During Small-Sided Games in Soccer Players. Sports 2019, 7, 117. [Google Scholar] [CrossRef] [Green Version]
- de Campos Mello, F.; de Moraes Bertuzzi, R.C.; Grangeiro, P.M.; Franchini, E. Energy systems contributions in 2,000 m race simulation: A comparison among rowing ergometers and water. Eur. J. Appl. Physiol. 2009, 107, 615–619. [Google Scholar] [CrossRef]
- Campos, F.A.; Bertuzzi, R.; Dourado, A.C.; Santos, V.G.; Franchini, E. Energy demands in taekwondo athletes during combat simulation. Eur. J. Appl. Physiol. 2012, 112, 1221–1228. [Google Scholar] [CrossRef]
- Park, S.B.; Kim, M.; Lee, E.; Lee, D.; Son, S.J.; Hong, J.; Yang, W.H. Energy System Contributions and Physical Activity in Specific Age Groups during Exergames. Int. J. Environ. Res. Public Health 2020, 17, 4905. [Google Scholar] [CrossRef]
- Yang, W.H.; Heine, O.; Grau, M. Rapid weight reduction does not impair athletic performance of Taekwondo athletes—A pilot study. PLoS ONE 2018, 13, e0196568. [Google Scholar] [CrossRef] [PubMed] [Green Version]
- di Prampero, P.E.; Ferretti, G. The energetics of anaerobic muscle metabolism: A reappraisal of older and recent concepts. Respir. Physiol. 1999, 118, 103–115. [Google Scholar] [CrossRef]
- Fritz, C.O.; Morris, P.E.; Richler, J.J. Effect size estimates: Current use, calculations, and interpretation. J. Exp. Psychol. Gen. 2012, 141, 2–18. [Google Scholar] [CrossRef] [Green Version]
- Wallimann, T.; Tokarska-Schlattner, M.; Schlattner, U. The creatine kinase system and pleiotropic effects of creatine. Amino Acids 2011, 40, 1271–1296. [Google Scholar] [CrossRef] [Green Version]
- Duffield, R.; Dawson, B. Energy system contribution in track running. New Stud. Athl. 2003, 18, 47–56. [Google Scholar]
- Cheetham, M.E.; Boobis, L.; Brooks, S.; Williams, C. Human muscle metabolism during sprint running. J. Appl. Physiol. 1986, 61, 54–60. [Google Scholar] [CrossRef]
- Robergs, R.A.; Ghiasvand, F.; Parker, D. Biochemistry of exercise-induced metabolic acidosis. Am. J. Physiol. Regul. Integr. Comp. 2004, 287, R502–R516. [Google Scholar] [CrossRef]
- Yaicharoen, P.; Wallman, K.; Morton, A.; Bishop, D. The effect of warm-up on intermittent sprint performance and selected thermoregulatory parameters. J. Sci. Med. 2012, 15, 451–456. [Google Scholar] [CrossRef] [PubMed]
- Wittekind, A.; Beneke, R. Metabolic and performance effects of warm-up intensity on sprint cycling. Scand. J. Med. Sci. Sports 2011, 21, e201–e207. [Google Scholar] [CrossRef] [PubMed]
- McGowan, C.J.; Pyne, D.B.; Thompson, K.G.; Rattray, B. Warm-up strategies for sport and exercise: Mechanisms and applications. Sports Med. 2015, 45, 1523–1546. [Google Scholar] [CrossRef] [PubMed]
- Gil, M.H.; Neiva, H.P.; Garrido, N.D.; Aidar, F.J.; Cirilo-Sousa, M.S.; Marques, M.C.; Marinho, D.A. The effect of ballistic exercise as pre-activation for 100 m sprints. Int. J. Environ. Res. Public Health 2019, 16, 1850. [Google Scholar] [CrossRef] [Green Version]
- Blazevich, A.J.; Babault, N. Post-activation potentiation (PAP) versus post-activation performance enhancement (PAPE) in humans: Historical perspective, underlying mechanisms, and current issues. Front. Physiol. 2019, 10, 1359. [Google Scholar] [CrossRef] [Green Version]
- Prieske, O.; Behrens, M.; Chaabene, H.; Granacher, U.; Maffiuletti, N.A. Time to Differentiate Postactivation “Potentiation” from “Performance Enhancement” in the Strength and Conditioning Community. Sports Med. 2020, 50, 1559–1565. [Google Scholar] [CrossRef]
- Wilson, J.M.; Duncan, N.M.; Marin, P.J.; Brown, L.E.; Loenneke, J.P.; Wilson, S.M.; Jo, E.; Lowery, R.P.; Ugrinowitsch, C. Meta-analysis of postactivation potentiation and power: Effects of conditioning activity, volume, gender, rest periods, and training status. J. Strength Cond. Res. 2013, 27, 854–859. [Google Scholar] [CrossRef]
- Heckman, C.; Enoka, R.M. Motor unit. Compr. Physiol. 2012, 2, 2629–2682. [Google Scholar] [PubMed]


| Parameters | HIW | LIW | Significance | Effect Size |
|---|---|---|---|---|
| (mean ± SD) | (mean ± SD) | p | r and d | |
| WPCR (kJ) | 67.63 ± 12.47 | 61 ± 6.29 | 0.232 | r = 0.285 |
| WGly (kJ) | 15.70 ± 5.30 | 24.88 ± 8.62 ** | 0.002 | r = −0.627 |
| WOxi (kJ) | 12.9 ± 5.13 | 14.25 ± 2.28 | 0.460 | d = 0.340 |
| WTotal (kJ) | 96.23 ± 13.78 | 100.2 ± 14.16 | 0.492 | r = −0.171 |
| WPCR (%) | 69.90 ± 4.80 *** | 61 ± 6.29 | 0.001 | d = 1.592 |
| WGly (%) | 16.50 ± 5.44 | 24.60 ± 7.43 ** | 0.004 | r = −0.597 |
| WOxi (%) | 13.3 ± 4.52 | 14.6 ± 3.53 | 0.488 | r = −0.160 |
| VO2Baseline (ml∙kg−1∙min−1) | 11.93 ± 3.42 | 12.51 ± 3.49 | 0.386 | r = −0.083 |
| VO2Sprint (ml∙kg−1∙min−1) | 8.41 ± 2.32 | 10.42 ± 1.84 * | 0.014 | d = −0.960 |
| Post-sprint VO2Peak (ml∙kg−1∙min−1) | 42.48 ± 3.06 | 44.08 ± 3.53 | 0.156 | d = −0.483 |
Publisher’s Note: MDPI stays neutral with regard to jurisdictional claims in published maps and institutional affiliations. |
© 2021 by the authors. Licensee MDPI, Basel, Switzerland. This article is an open access article distributed under the terms and conditions of the Creative Commons Attribution (CC BY) license (http://creativecommons.org/licenses/by/4.0/).
Share and Cite
Park, S.-B.; Park, D.-S.; Kim, M.; Lee, E.; Lee, D.; Jung, J.; Son, S.J.; Hong, J.; Yang, W.-H. High-Intensity Warm-Up Increases Anaerobic Energy Contribution during 100-m Sprint. Biology 2021, 10, 198. https://0-doi-org.brum.beds.ac.uk/10.3390/biology10030198
Park S-B, Park D-S, Kim M, Lee E, Lee D, Jung J, Son SJ, Hong J, Yang W-H. High-Intensity Warm-Up Increases Anaerobic Energy Contribution during 100-m Sprint. Biology. 2021; 10(3):198. https://0-doi-org.brum.beds.ac.uk/10.3390/biology10030198
Chicago/Turabian StylePark, Seung-Bo, Da-Sol Park, Minjun Kim, Eunseok Lee, Doowon Lee, Jaewoo Jung, Seong Jun Son, Junggi Hong, and Woo-Hwi Yang. 2021. "High-Intensity Warm-Up Increases Anaerobic Energy Contribution during 100-m Sprint" Biology 10, no. 3: 198. https://0-doi-org.brum.beds.ac.uk/10.3390/biology10030198