
Is the Secret in the Gut? SuperJump Activity Improves Bone Remodeling and Glucose Homeostasis by GLP-1 and GIP Peptides in Eumenorrheic Women


Abstract
:Simple Summary
Abstract
1. Introduction
2. Materials and Methods
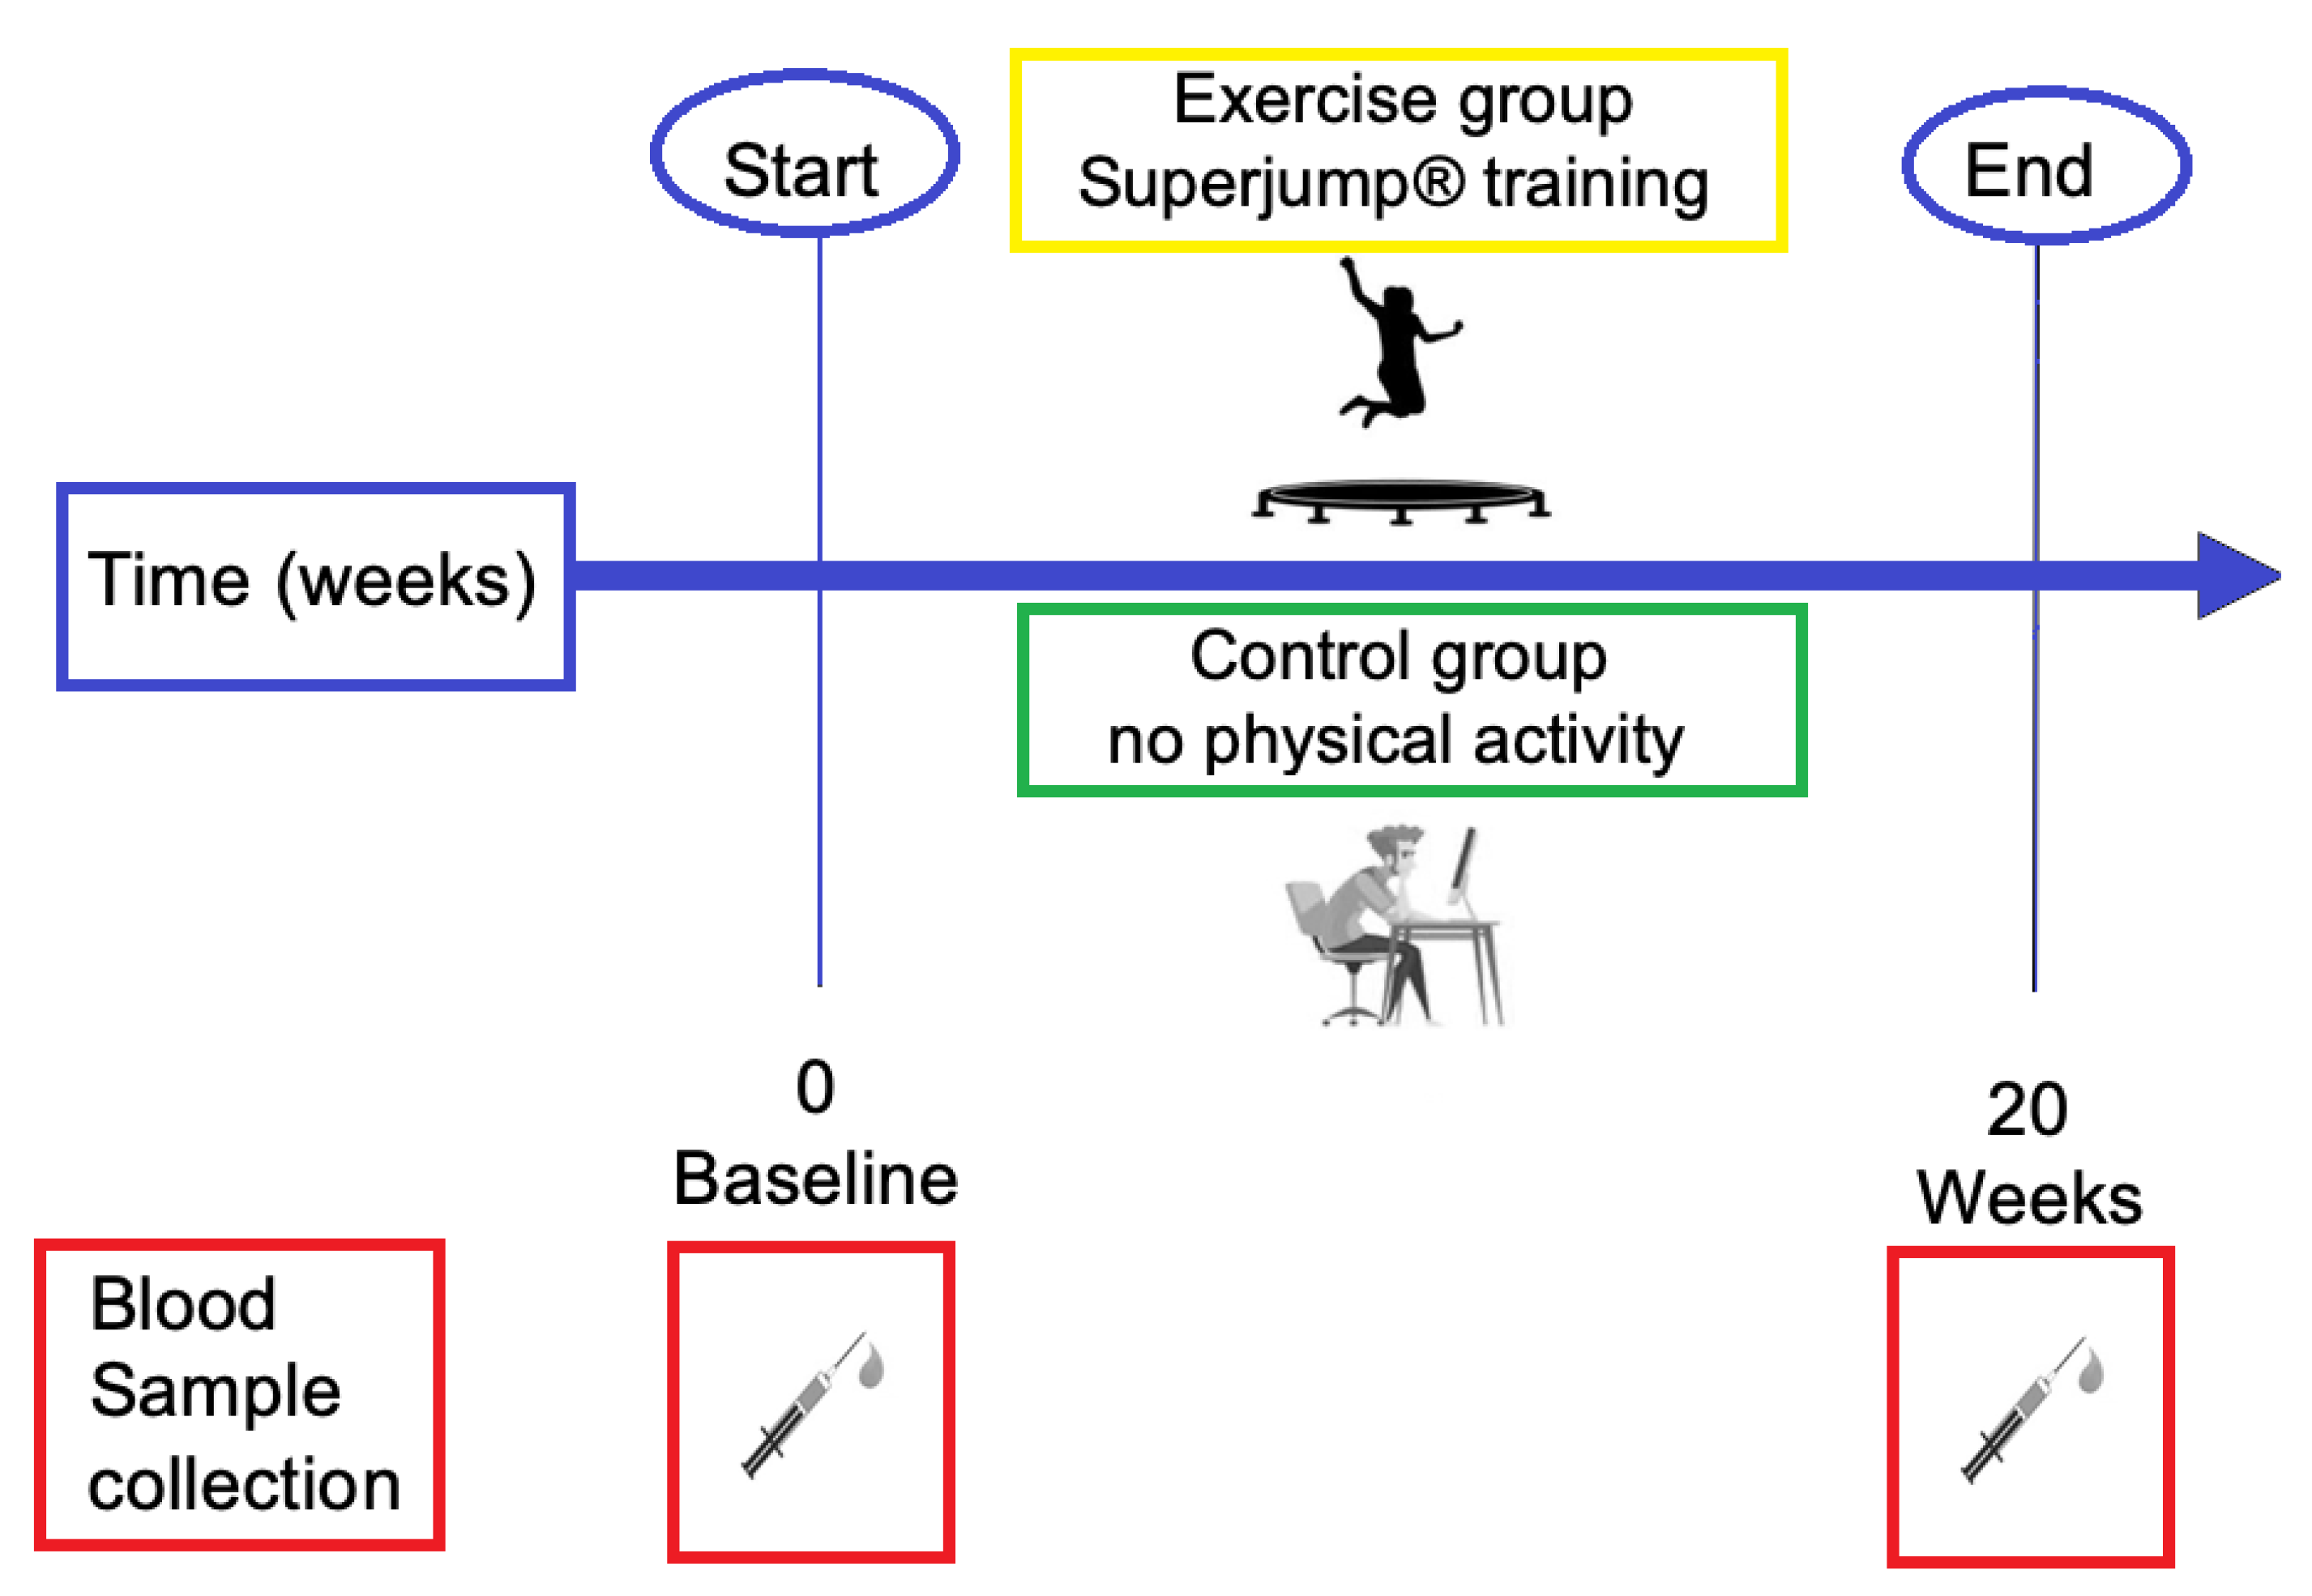
2.1. Subjects and Experimental Design
2.1.1. Workout Characteristic
2.1.2. Anthropometry
2.2. Blood Sample Collection
2.3. Assays
2.4. Ethics
2.5. Statistics
3. Results
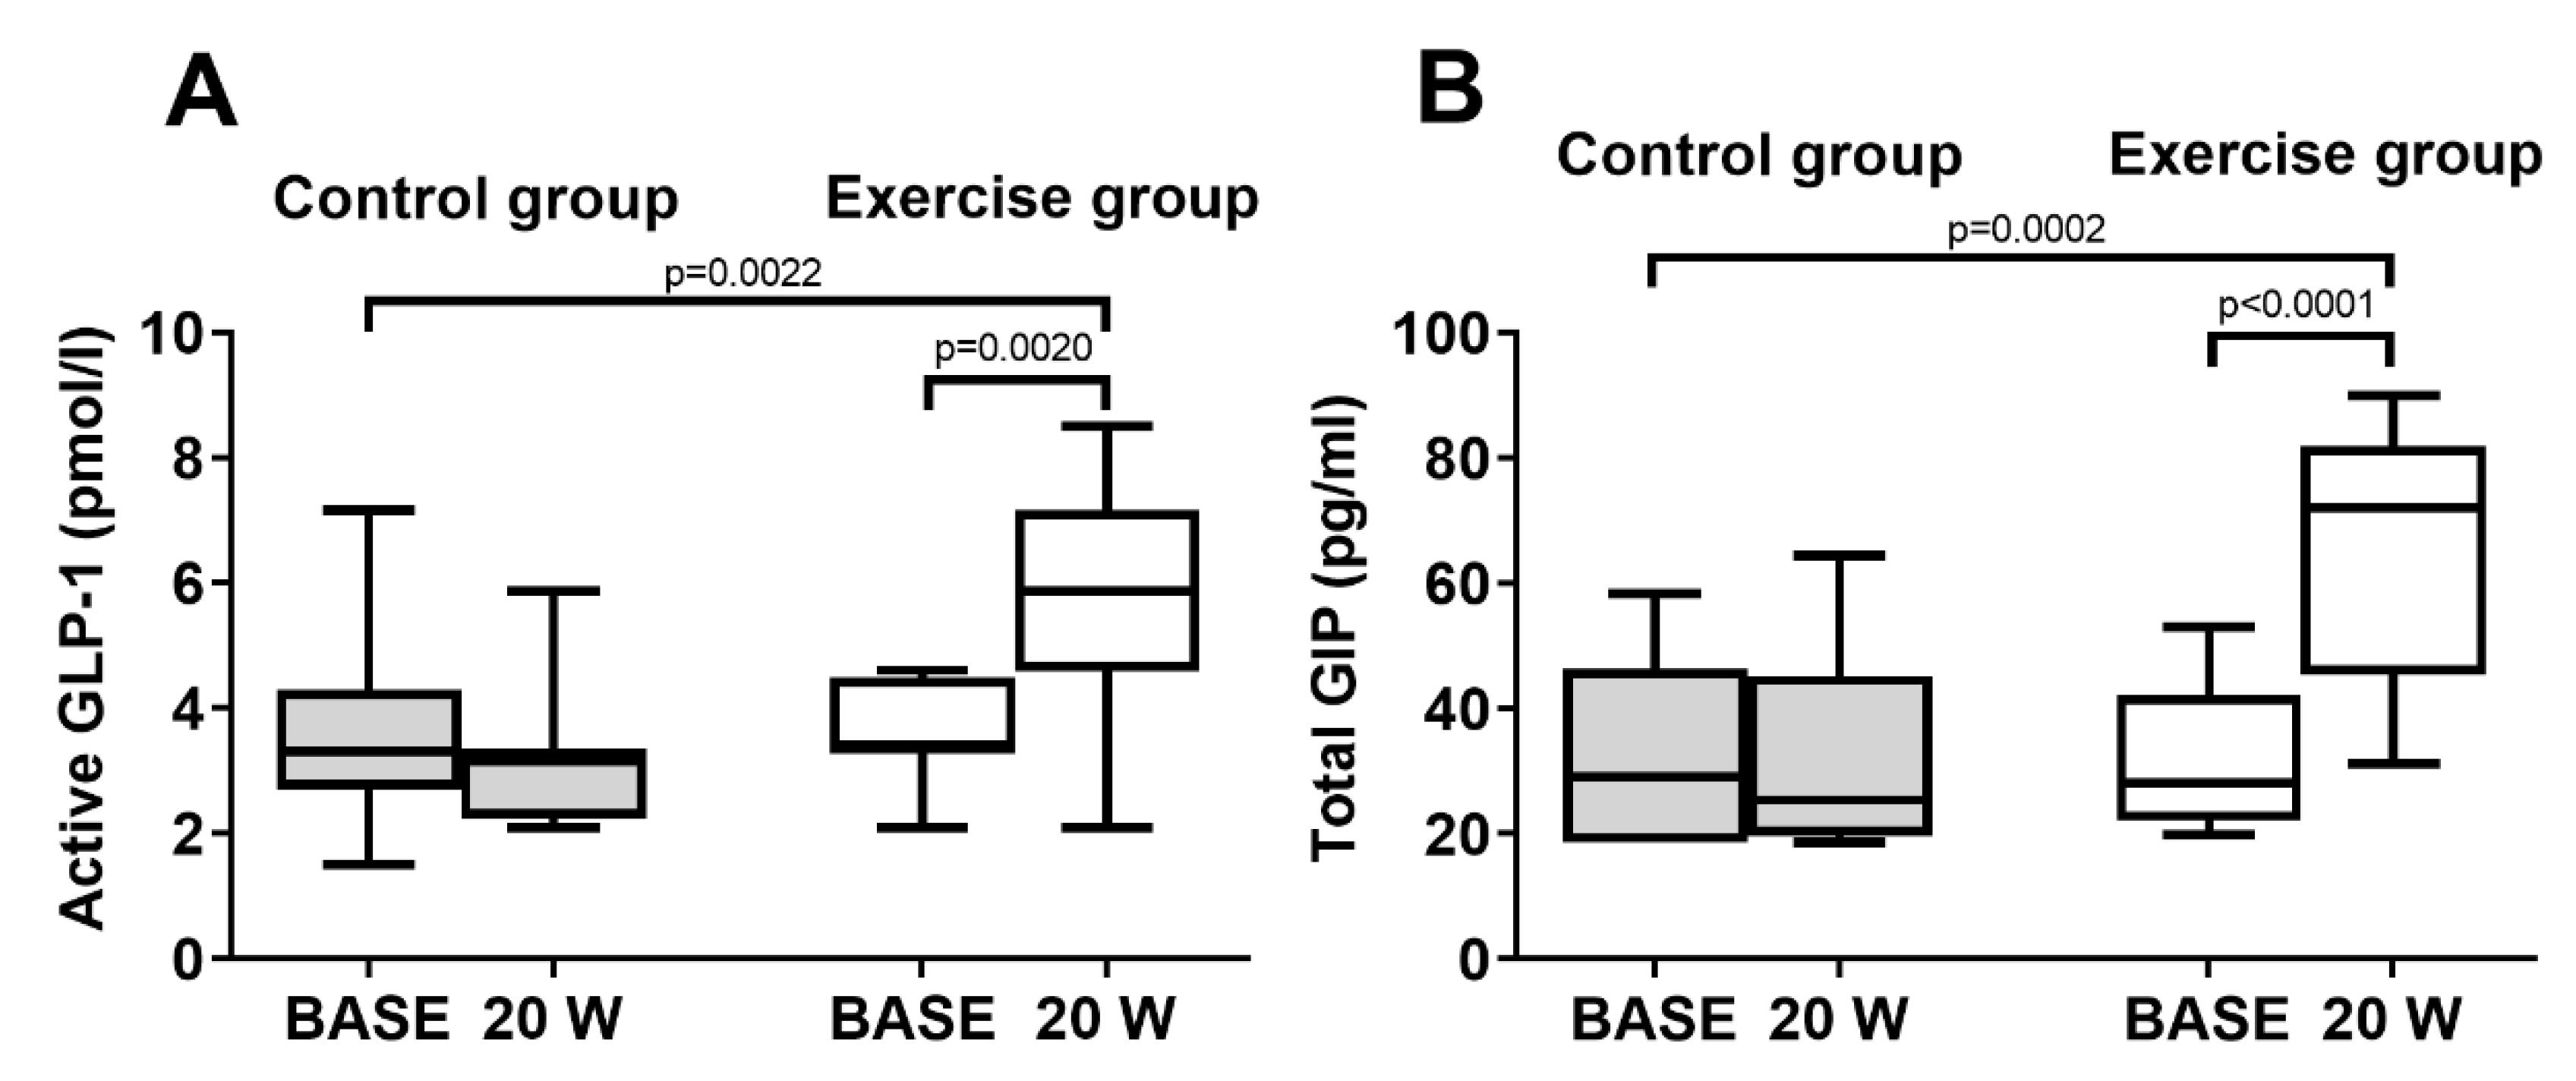
3.1. Incretins
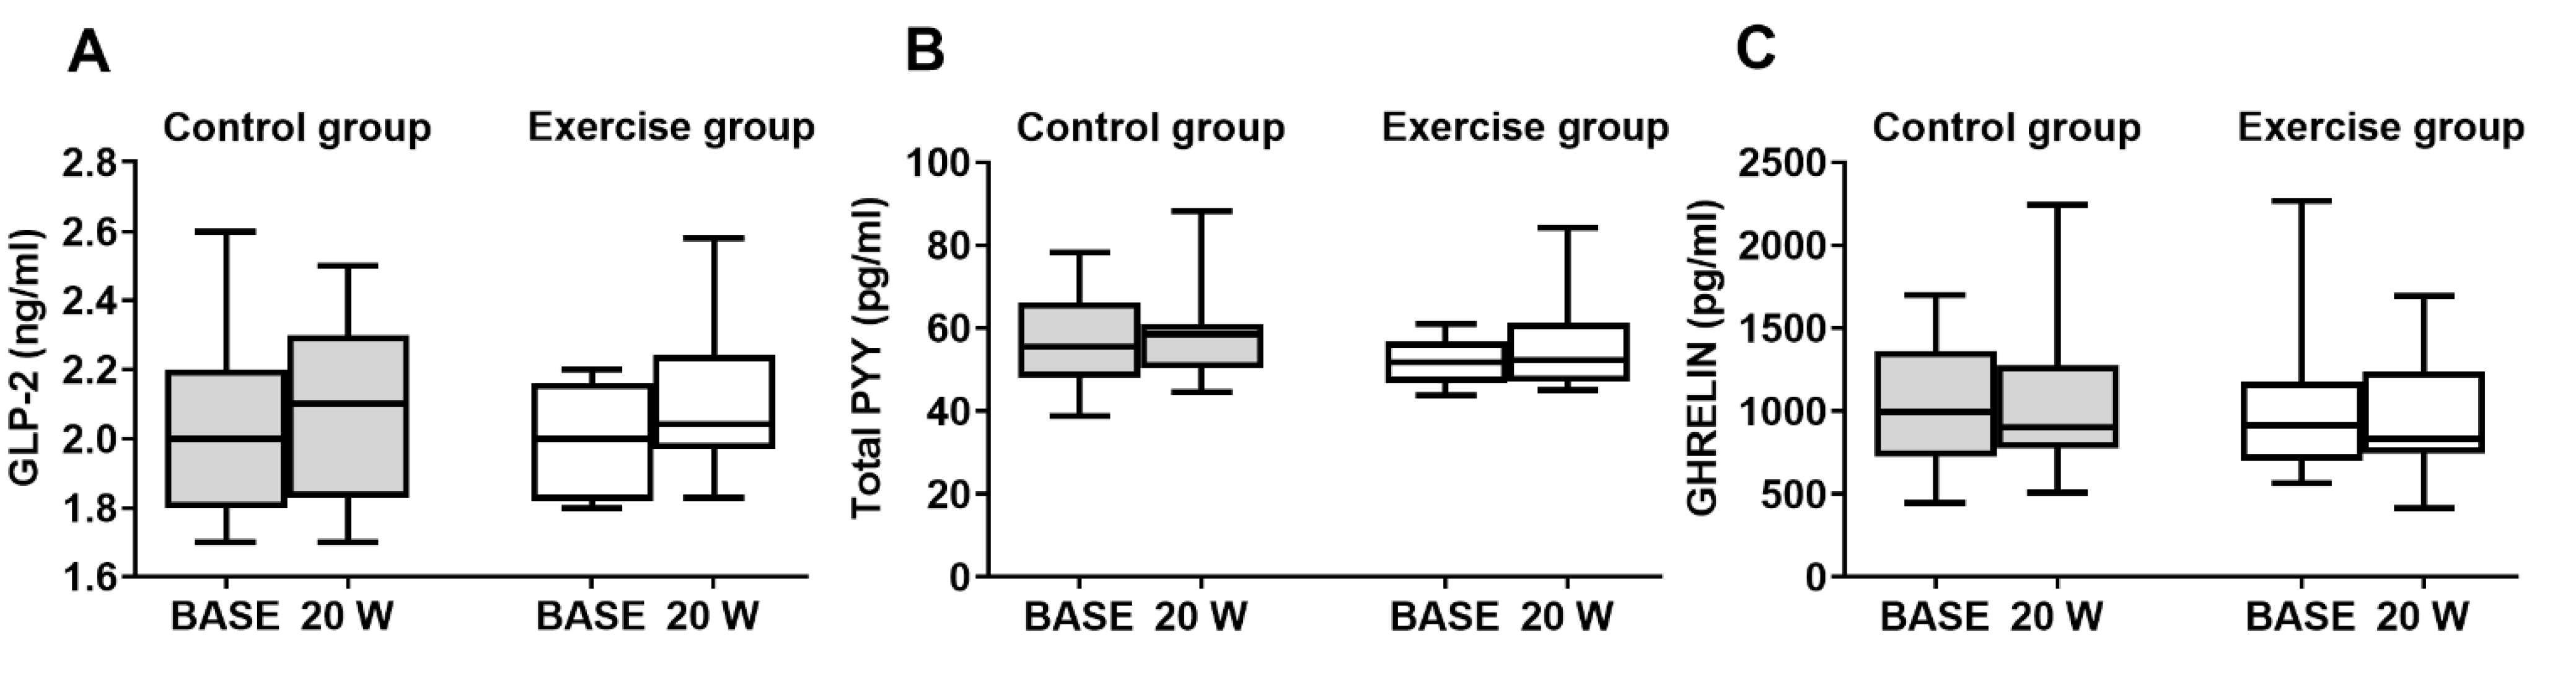
3.2. Other Gut Hormones
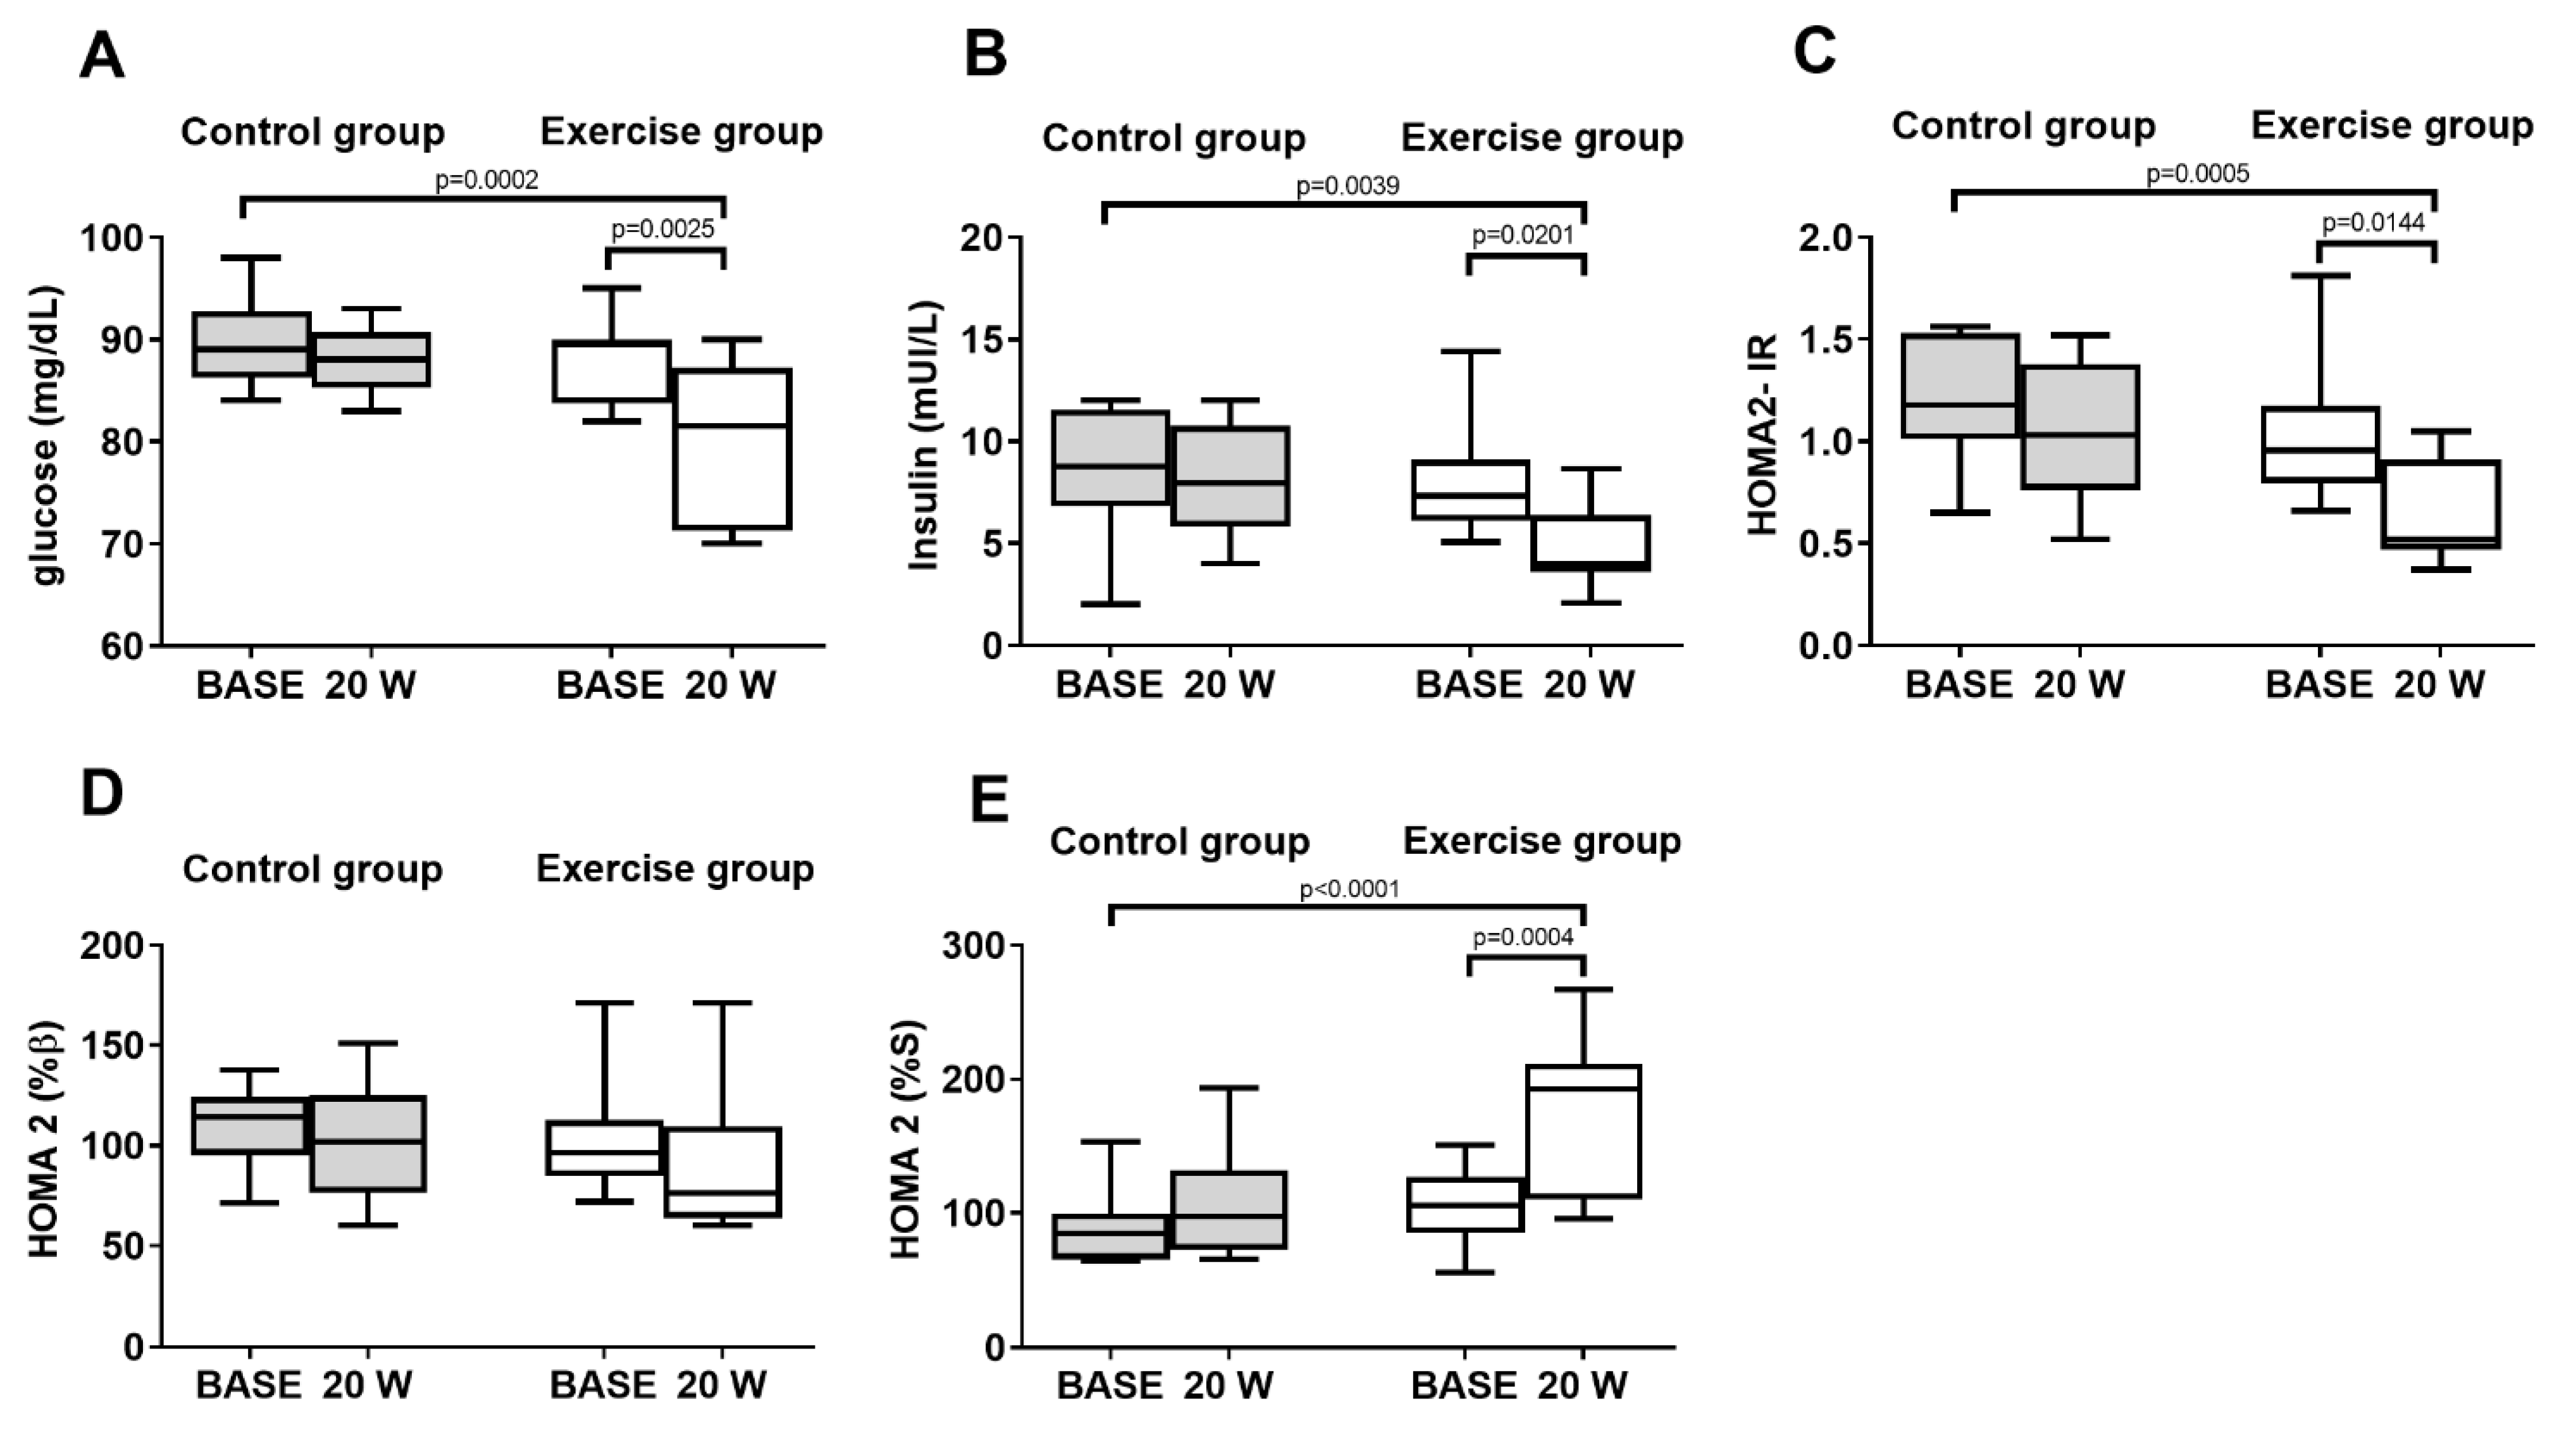
3.3. Markers of Glucose Homeostasis
4. Discussion
5. Conclusions
Author Contributions
Funding
Institutional Review Board Statement
Informed Consent Statement
Data Availability Statement
Acknowledgments
Conflicts of Interest
References
- Schiellerup, S.P.; Skov-Jeppesen, K.; Windeløv, J.A.; Svane, M.; Holst, J.; Hartmann, B.; Rosenkilde, M.M. Gut Hormones and Their Effect on Bone Metabolism. Potential Drug Therapies in Future Osteoporosis Treatment. Front. Endocrinol. 2019, 10, 75. [Google Scholar] [CrossRef] [PubMed]
- Zouhal, H.; Sellami, M.; Saeidi, A.; Slimani, M.; Abbassi-Daloii, A.; Khodamoradi, A.; El Hage, R.; Hackney, A.C.; Ben Abderrahman, A. Effect of physical exercise and training on gastrointestinal hormones in populations with different weight statuses. Nutr. Rev. 2019, 77, 455–477. [Google Scholar] [CrossRef] [PubMed]
- Martins, C.; Morgan, L.M.; Bloom, S.R.; Robertson, M.D. Effects of exercise on gut peptides, energy intake and appetite. J. Endocrinol. 2007, 193, 251–258. [Google Scholar] [CrossRef] [PubMed]
- Burns, S.F.; Broom, D.R.; Miyashita, M.; Mundy, C.; Stensel, D.J. A single session of treadmill running has no effect on plasma total ghrelin concentrations. J. Sports Sci. 2007, 25, 635–642. [Google Scholar] [CrossRef] [PubMed]
- Broom, D.R.; Batterham, R.L.; King, J.A.; Stensel, D.J. Influence of resistance and aerobic exercise on hunger, circulating levels of acylated ghrelin, and peptide YY in healthy males. Am. J. Physiol. Regul. Integr. Comp. Physiol. 2009, 296, R29–R35. [Google Scholar] [CrossRef] [PubMed] [Green Version]
- King, J.A.; Wasse, L.K.; Broom, D.R.; Stensel, D.J. Influence of brisk walking on appetite, energy intake, and plasma acylated ghrelin. Med. Sci. Sports Exerc. 2010, 42, 485–492. [Google Scholar] [CrossRef] [Green Version]
- Bjarnason, N.H.; Henriksen, E.E.G.; Alexandersen, P.; Christgau, S.; Henriksen, D.B.; Christiansen, C. Mechanism of Circadian Variation in Bone Resorption. Bone 2002, 30, 307–313. [Google Scholar] [CrossRef]
- Proia, P.; Amato, A.; Drid, P.; Korovljev, D.; Vasto, S.; Baldassano, S. The Impact of Diet and Physical Activity on Bone Health in Children and Adolescents. Front Endocrinol. 2021, 12, 704647. [Google Scholar] [CrossRef]
- Baldassano, S.; Amato, A. GLP-2: What do we know? What are we going to discover? Regul. Pept. 2014, 194–195, 6–10. [Google Scholar] [CrossRef] [Green Version]
- Baldassano, S.; Amato, A.; Caldara, G.F.; Mulè, F. Glucagon-like peptide-2 treatment improves glucose dysmetabolism in mice fed a high-fat diet. Endocrine 2016, 54, 648–656. [Google Scholar] [CrossRef]
- Baldassano, S.; Amato, A.; Terzo, S.; Caldara, G.; Lentini, L.; Mulè, F. Glucagon-like peptide-2 analog and inflammatory state in obese mice. Endocrine 2020, 68, 695–698. [Google Scholar] [CrossRef]
- Baldassano, S.; Gasbjerg, L.; Kizilkaya, H.; Rosenkilde, M.; Holst, J.; Hartmann, B. Increased Body Weight and Fat Mass After Subchronic GIP Receptor Antagonist, but Not GLP-2 Receptor Antagonist, Administration in Rats. Front. Endocrinol. 2019, 10, 492. [Google Scholar] [CrossRef] [PubMed] [Green Version]
- Baldassano, S.; Accardi, G.; Vasto, S. Beta-glucans and cancer: The influence of inflammation and gut peptide. Eur. J. Med. Chem. 2017, 142, 486–492. [Google Scholar] [CrossRef] [PubMed]
- Amato, A.; Baldassano, S.; Cortis, C.; Cooper, J.; Proia, P. Physical activity, nutrition, and bone health. Hum mov. 2018, 19, 1–10. [Google Scholar] [CrossRef]
- Amato, A.; Proia, P.; Caldara, G.F.; Alongi, A.; Ferrantelli, V.; Baldassano, S. Analysis of Body Perception, Preworkout Meal Habits and Bone Resorption in Child Gymnasts. Int. J. Environ. Res. Public Health 2021, 18, 2184. [Google Scholar] [CrossRef]
- Fäldt, J.; Wernstedt, I.; Fitzgerald, S.M.; Wallenius, K.; Bergström, G.; Jansson, J.O. Reduced exercise endurance in interleukin-6-deficient mice. Endocrinology 2004, 145, 2680–2686. [Google Scholar] [CrossRef] [PubMed] [Green Version]
- Færch, K.; Torekov, S.S.; Vistisen, D.; Johansen, N.B.; Witte, D.R.; Jonsson, A.; Pedersen, O.; Hansen, T.; Lauritzen, T.; Sandbæk, A.; et al. GLP-1 Response to Oral Glucose Is Reduced in Prediabetes, Screen-Detected Type 2 Diabetes, and Obesity and Influenced by Sex: The ADDITION-PRO Study. Diabetes 2015, 64, 2513–2525. [Google Scholar] [CrossRef] [PubMed] [Green Version]
- Iannaccone, A.; Fusco, A.; Jaime, S.J.; Baldassano, S.; Cooper, J.; Proia, P.; Cortis, C. Stay home, stay active with superjump®: A home-based activity to prevent sedentary lifestyle during COVID-19 outbreak. Sustainability 2020, 12, 135. [Google Scholar] [CrossRef]
- Vasto, S.; Amato, A.; Proia, P.; Caldarella, R.; Cortis, C.; Baldassano, S. Dare to Jump: The Effect of New High Impact Activity SuperJump on Bone Remodeling. A New Tool to Be Fit During COVID-19 Home Confinement. Biol. Sport 2022, 39, 1011–1019. [Google Scholar] [CrossRef]
- Baldassano, S.; Accardi, G.; Aiello, A.; Buscemi, S.; Di Miceli, G.; Galimberti, D.; Candore, G.; Ruisi, P.; Caruso, C.; Vasto, S. Fibres as functional foods and the effects on gut hormones: The example of β-glucans in a single arm pilot study. J. Funct. Foods 2018, 47, 264–269. [Google Scholar] [CrossRef]
- Gunter, K.; Almstedt, H.; Janz, K. Physical Activity in Childhood May Be the Key to Optimizing Lifespan Skeletal Health. Exerc. Sport Sci. Rev. 2012, 40, 13–21. [Google Scholar] [CrossRef] [PubMed] [Green Version]
- Hind, K.; Burrows, M. Weight-bearing exercise and bone mineral accrual in children and adolescents: A review of controlled trials. Bone 2007, 40, 14–27. [Google Scholar] [CrossRef] [PubMed]
- MacKelvie, K.J.; Khan, K.M.; Petit, M.A.; Janssen, P.A.; McKay, H.A. A school-based exercise intervention elicits substantial bone health benefits: A 2-year randomized controlled trial in girls. Pediatrics 2003, 112, e447. [Google Scholar] [CrossRef] [PubMed]
- MacKelvie, K.J.; Petit, M.A.; Khan, K.M.; Beck, T.J.; McKay, H.A. Bone mass and structure are enhanced following a 2-year randomized controlled trial of exercise in prepubertal boys. Bone 2004, 34, 755–764. [Google Scholar] [CrossRef] [PubMed]
- Wiebe, P.N.; Blimkie, C.J.; Farpour-Lambert, N.; Briody, J.; Marsh, D.; Kemp, A.; Cowell, C.; Howman-Giles, R. Effects of single-leg drop-landing exercise from different heights on skeletal adaptations in prepubertal girls: A randomized controlled study. Pediatr. Exerc. Sci. 2008, 20, 211–228. [Google Scholar] [CrossRef]
- Fuchs, R.K.; Bauer, J.J.; Snow, C.M. Jumping improves hip and lumbar spine bone mass in prepubescent children: A randomized controlled trial. J. Bone Miner. Res. 2001, 16, 148–156. [Google Scholar] [CrossRef] [PubMed]
- Gunter, K.; Baxter-Jones, A.D.; Mirwald, R.L.; Almstedt, H.; Fuller, A.; Durski, S.; Snow, C. Jump starting skeletal health: A 4-year longitudinal study assessing the effects of jumping on skeletal development in pre and circum pubertal children. Bone 2008, 42, 710–718. [Google Scholar] [CrossRef]
- Wallace, T.M.; Levy, J.C.; Matthews, D.R. Use and abuse of HOMA modeling. Diabetes Care 2004, 27, 1487–1495. [Google Scholar] [CrossRef] [Green Version]
- Ghasemi, A.; Tohidi, M.; Derakhshan, A.; Hasheminia, M.; Azizi, F.; Hadaegh, F. Cut-off points of homeostasis model assessment of insulin resistance, beta-cell function, and fasting serum insulin to identify future type 2 diabetes: Tehran Lipid and Glucose Study. Acta Diabetol. 2015, 52, 905–915. [Google Scholar] [CrossRef]
- Druce, M.R.; Wren, A.M.; Park, A.J.; Milton, J.E.; Patterson, M.; Frost, G.; Ghatei, M.A.; Small, C.; Bloom, S.R. Ghrelin increases food intake in obese as well as lean subjects. Int. J. Obes. 2005, 29, 1130–1136. [Google Scholar] [CrossRef] [Green Version]
- Iepsen, E.W.; Lundgren, J.R.; Hartmann, B.; Pedersen, O.; Hansen, T.; Jørgensen, N.R.; Jensen, J.E.; Holst, J.J.; Madsbad, S.; Torekov, S.S. GLP-1 Receptor Agonist Treatment Increases Bone Formation and Prevents Bone Loss in Weight-Reduced Obese Women. J. Clin. Endocrinol. Metab. 2015, 100, 2909–2917. [Google Scholar] [CrossRef] [PubMed]
- Lu, N.; Sun, H.; Yu, J.; Wang, X.; Liu, D.; Zhao, L.; Sun, L.; Zhao, H.; Tao, B.; Liu, J. Glucagon-like peptide-1 receptor agonist Liraglutide has anabolic bone effects in ovariectomized rats without diabetes. PLoS ONE 2015, 10, e0132744. [Google Scholar] [CrossRef] [PubMed]
- Yamada, C.; Yamada, Y.; Tsukiyama, K.; Yamada, K.; Udagawa, N.; Takahashi, N.; Tanaka, K.; Drucker, D.J.; Seino, Y.; Inagaki, N. The murine glucagon-like peptide-1 receptor is essential for control of bone resorption. Endocrinology 2008, 149, 574–579. [Google Scholar] [CrossRef] [Green Version]
- Pacheco-Pantoja, E.; Ranganath, L.; Gallagher, J.; Wilson, P.; Fraser, W. Receptors and effects of gut hormones in three osteoblastic cell lines. BMC Physiol. 2011, 11, 12. [Google Scholar] [CrossRef] [PubMed] [Green Version]
- Bollag, R.J.; Zhong, Q.; Phillips, P.; Min, L.; Zhong, L.; Cameron, R.; Mulloy, A.L.; Rasmussen, H.; Qin, F.; Ding, K.H.; et al. Osteoblast-derived cells express functional glucose-dependent insulinotropic peptide receptors. Endocrinology 2000, 141, 1228–1235. [Google Scholar] [CrossRef] [PubMed]
- Nissen, A.; Christensen, M.; Knop, F.K.; Vilsbøll, T.; Holst, J.J.; Hartmann, B. Glucose-dependent insulinotropic polypeptide inhibits bone resorption in humans. J. Clin. Endocrinol. Meta.b 2014, 99, E2325–E2329. [Google Scholar] [CrossRef]
- Torekov, S.S.; Harsløf, T.; Rejnmark, L.; Eiken, P.; Jensen, J.B.; Herman, A.P.; Hansen, T.; Pedersen, O.; Holst, J.J.; Langdahl, B.L. A Functional Amino Acid Substitution in the Glucose-Dependent Insulinotropic Polypeptide Receptor (GIPR) Gene is Associated With Lower Bone Mineral Density and Increased Fracture Risk. J. Clin. Endocrinol. Metab. 2014, 99, E729–E733. [Google Scholar] [CrossRef] [Green Version]
- Askov-Hansen, C.; Jeppesen, P.B.; Lund, P.; Hartmann, B.; Holst, J.J.; Henriksen, D.B. Effect of glucagon-like peptide-2 exposure on bone resorption: Effectiveness of high concentration versus prolonged exposure. Regul. Pept. 2013, 181, 4–8. [Google Scholar] [CrossRef]
- Utz, A.L.; Lawson, E.A.; Misra, M.; Mickley, D.; Gleysteen, S.; Herzog, D.B.; Klibanski, A.; Miller, K.K. Peptide YY (PYY) levels and bone mineral density (BMD) in women with anorexia nervosa. Bone 2008, 43, 135–139. [Google Scholar] [CrossRef] [Green Version]
- Russell, M.; Stark, J.; Nayak, S.; Miller, K.K.; Herzog, D.B.; Klibanski, A.; Misra, M. Peptide YY in adolescent athletes with amenorrhea, eumenorrheic athletes and non-athletic controls. Bone 2009, 45, 104–109. [Google Scholar] [CrossRef] [Green Version]
- Scheid, J.L.; Toombs, R.J.; Ducher, G.; Gibbs, J.C.; Williams, N.I.; de Souza, M.J. Estrogen and peptide YY are associated with bone mineral density in premenopausal exercising women. Bone 2011, 49, 194–201. [Google Scholar] [CrossRef] [PubMed]
- Ibrahim Abdalla, M.M. Ghrelin—Physiological Functions and Regulation. Eur. Endocrinol. 2015, 11, 90–95. [Google Scholar] [CrossRef] [PubMed] [Green Version]
- McLaughlin, T.; Abbasi, F.; Lamendola, C.; Frayo, R.S.; Cummings, D.E. Plasma ghrelin concentrations are decreased in insulin-resistant obese adults relative to equally obese insulin-sensitive controls. J. Clin. Endocrinol. Metab. 2004, 89, 1630–1635. [Google Scholar] [CrossRef] [PubMed]
- Koliaki, C.; Liatis, S.; Dalamaga, M.; Kokkinos, A. The Implication of Gut Hormones in the Regulation of Energy Homeostasis and Their Role in the Pathophysiology of Obesity. Curr. Obes. Rep. 2020, 9, 255–271. [Google Scholar] [CrossRef] [PubMed]
- Meloni, A.R.; DeYoung, M.B.; Lowe, C.; Parkes, D.G. GLP-1 receptor activated insulin secretion from pancreatic β-cells: Mechanism and glucose dependence. Diabetes Obes. Metab. 2013, 15, 15–27. [Google Scholar] [CrossRef] [Green Version]
- Schubert, M.M.; Sabapathy, S.; Leveritt, M.; Desbrow, B. Acute exercise and hormones related to appetite regulation: A meta-analysis. Sports Med. 2014, 44, 387–403. [Google Scholar] [CrossRef] [PubMed] [Green Version]
- Hallworth, J.R.; Copeland, J.L.; Doan, J.; Hazell, T.J. The Effect of Exercise Intensity on Total PYY and GLP-1 in Healthy Females: A Pilot Study. J. Nutr. Metab. 2017, 2017, 4823102. [Google Scholar] [CrossRef] [Green Version]
- Ueda, S.Y.; Miyamoto, T.; Nakahara, H.; Shishido, T.; Usui, T.; Katsura, Y.; Yoshikawa, T.; Fujimoto, S. Effects of exercise training on gut hormone levels after a single bout of exercise in middle-aged Japanese women. Springerplus 2013, 2, 83. [Google Scholar] [CrossRef] [Green Version]
- Howe, S.M.; Hand, T.M.; Larson-Meyer, D.E.; Austin, K.J.; Alexander, B.M.; Manore, M.M. No Effect of Exercise Intensity on Appetite in Highly-Trained Endurance Women. Nutrients 2016, 8, 223. [Google Scholar] [CrossRef]
- Larson-Meyer, D.E.; Palm, S.; Bansal, A.; Austin, K.J.; Hart, A.M.; Alexander, B.M. Influence of running and walking on hormonal regulators of appetite in women. J. Obes. 2012, 2012, 730409. [Google Scholar] [CrossRef]
- Unick, J.L.; Otto, A.D.; Goodpaster, B.H.; Helsel, D.L.; Pellegrini, C.A.; Jakicic, J.M. Acute effect of walking on energy intake in overweight/obese women. Appetite 2010, 55, 413–419. [Google Scholar] [CrossRef] [Green Version]
- Lund, M.T.; Taudorf, L.; Hartmann, B.; Helge, J.W.; Holst, J.J.; Dela, F. Meal induced gut hormone secretion is altered in aerobically trained compared to sedentary young healthy males. Eur. J. Appl. Physiol. 2013, 113, 2737–2747. [Google Scholar] [CrossRef] [PubMed] [Green Version]
- Martins, C.; Kulseng, B.; Rehfeld, J.F.; King, N.A.; Blundell, J.E. Effect of chronic exercise on appetite control in overweight and obese individuals. Med. Sci. Sports Exerc. 2013, 45, 805–812. [Google Scholar] [CrossRef] [Green Version]
- Kelly, K.R.; Brooks, L.M.; Solomon, T.P.; Kashyap, S.R.; O’Leary, V.B.; Kirwan, J.P. The glucose-dependent insulinotropic polypeptide and glucose-stimulated insulin response to exercise training and diet in obesity. Am. J. Physiol. Endocrinol. Metab. 2009, 296, E1269–E1274. [Google Scholar] [CrossRef] [PubMed] [Green Version]
- Larsen, P.S.; Donges, C.E.; Guelfi, K.J.; Smith, G.C.; Adams, D.R.; Duffield, R. Effects of Aerobic, Strength or Combined Exercise on Perceived Appetite and Appetite-Related Hormones in Inactive Middle-Aged Men. Int. J. Sport Nutr. Exerc. Metab. 2017, 27, 389–398. [Google Scholar] [CrossRef] [PubMed]


| Inclusion Criteria | Exclusion Criteria |
|---|---|
| Women living in Italy | Bone fracture within the previous year |
| Age: 18–40 years | Self-reported long (>35 days) or short (<24 days) or irregular menstrual cycles |
| Currently injury free | Use of medication or suffering from any condition known to affect bone metabolism |
| Body mass index between 18.5 and 28 kg/m2 | Pregnancy, breastfeeding |
| Menstrual cycle interval between 24 and 35 days | Current smokers |
| Use of any type of hormonal contraception within the past six months | |
| Calcium or vitamin D supplementation in the preceding six months | |
| Participation in moderate and high impact-activity for ≥3 h·week before enrolling in the study |
| Subjects Charact | Control Group | Exercise Group | ||||
|---|---|---|---|---|---|---|
| BASE | 20 W | BASE | 20 W | |||
| Mean ± SD | Mean ± SD | p-Value | Mean ± SD | Mean ± SD | p-Value | |
| BMI (kg/m2) | 22.5 ± 2.7 | 23.7 ± 2.9 | p > 0.05 | 22.8 ± 2.4 | 22.8 ± 2.8 | p > 0.05 |
| LM % | 74.4 ± 5.8 | 76.6 ± 5.2 | p > 0.05 | 73.2 ± 5.9 | 73.7 ± 7.2 | p > 0.05 |
| FM % | 25.6 ± 5.8 | 23.9 ± 6.2 | p > 0.05 | 26.8 ± 6 | 26.3 ± 7.2 | p > 0.05 |
| TRIG (mg/dL) | 91 ± 14 | 89 ± 26 | p > 0.05 | 80 ± 21 | 55 ±18 | p = 0.02 |
| Total Chol (mg/dL) | 182 ± 18 | 188 ± 27 | p > 0.05 | 182 ± 23 | 184 ± 24 | p > 0.05 |
| HDL-Chol (mg/dL) | 77 ± 12 | 75 ± 11 | p > 0.05 | 77 ± 15 | 80 ± 14 | p > 0.05 |
| LDL-Chol | 93 ± 24 | 98 ± 18 | p > 0.05 | 100 ± 14 | 89 ± 16 | p > 0.05 |
Publisher’s Note: MDPI stays neutral with regard to jurisdictional claims in published maps and institutional affiliations. |
© 2022 by the authors. Licensee MDPI, Basel, Switzerland. This article is an open access article distributed under the terms and conditions of the Creative Commons Attribution (CC BY) license (https://creativecommons.org/licenses/by/4.0/).
Share and Cite
Vasto, S.; Amato, A.; Proia, P.; Baldassano, S. Is the Secret in the Gut? SuperJump Activity Improves Bone Remodeling and Glucose Homeostasis by GLP-1 and GIP Peptides in Eumenorrheic Women. Biology 2022, 11, 296. https://0-doi-org.brum.beds.ac.uk/10.3390/biology11020296
Vasto S, Amato A, Proia P, Baldassano S. Is the Secret in the Gut? SuperJump Activity Improves Bone Remodeling and Glucose Homeostasis by GLP-1 and GIP Peptides in Eumenorrheic Women. Biology. 2022; 11(2):296. https://0-doi-org.brum.beds.ac.uk/10.3390/biology11020296
Chicago/Turabian StyleVasto, Sonya, Alessandra Amato, Patrizia Proia, and Sara Baldassano. 2022. "Is the Secret in the Gut? SuperJump Activity Improves Bone Remodeling and Glucose Homeostasis by GLP-1 and GIP Peptides in Eumenorrheic Women" Biology 11, no. 2: 296. https://0-doi-org.brum.beds.ac.uk/10.3390/biology11020296