
Evaluation of 10-Week Neuromuscular Training Program on Body Composition of Elite Female Soccer Players

 ,
,  ,
,  ,
,  and
and 
Abstract
:Simple Summary
Abstract
1. Introduction
2. Materials and Methods
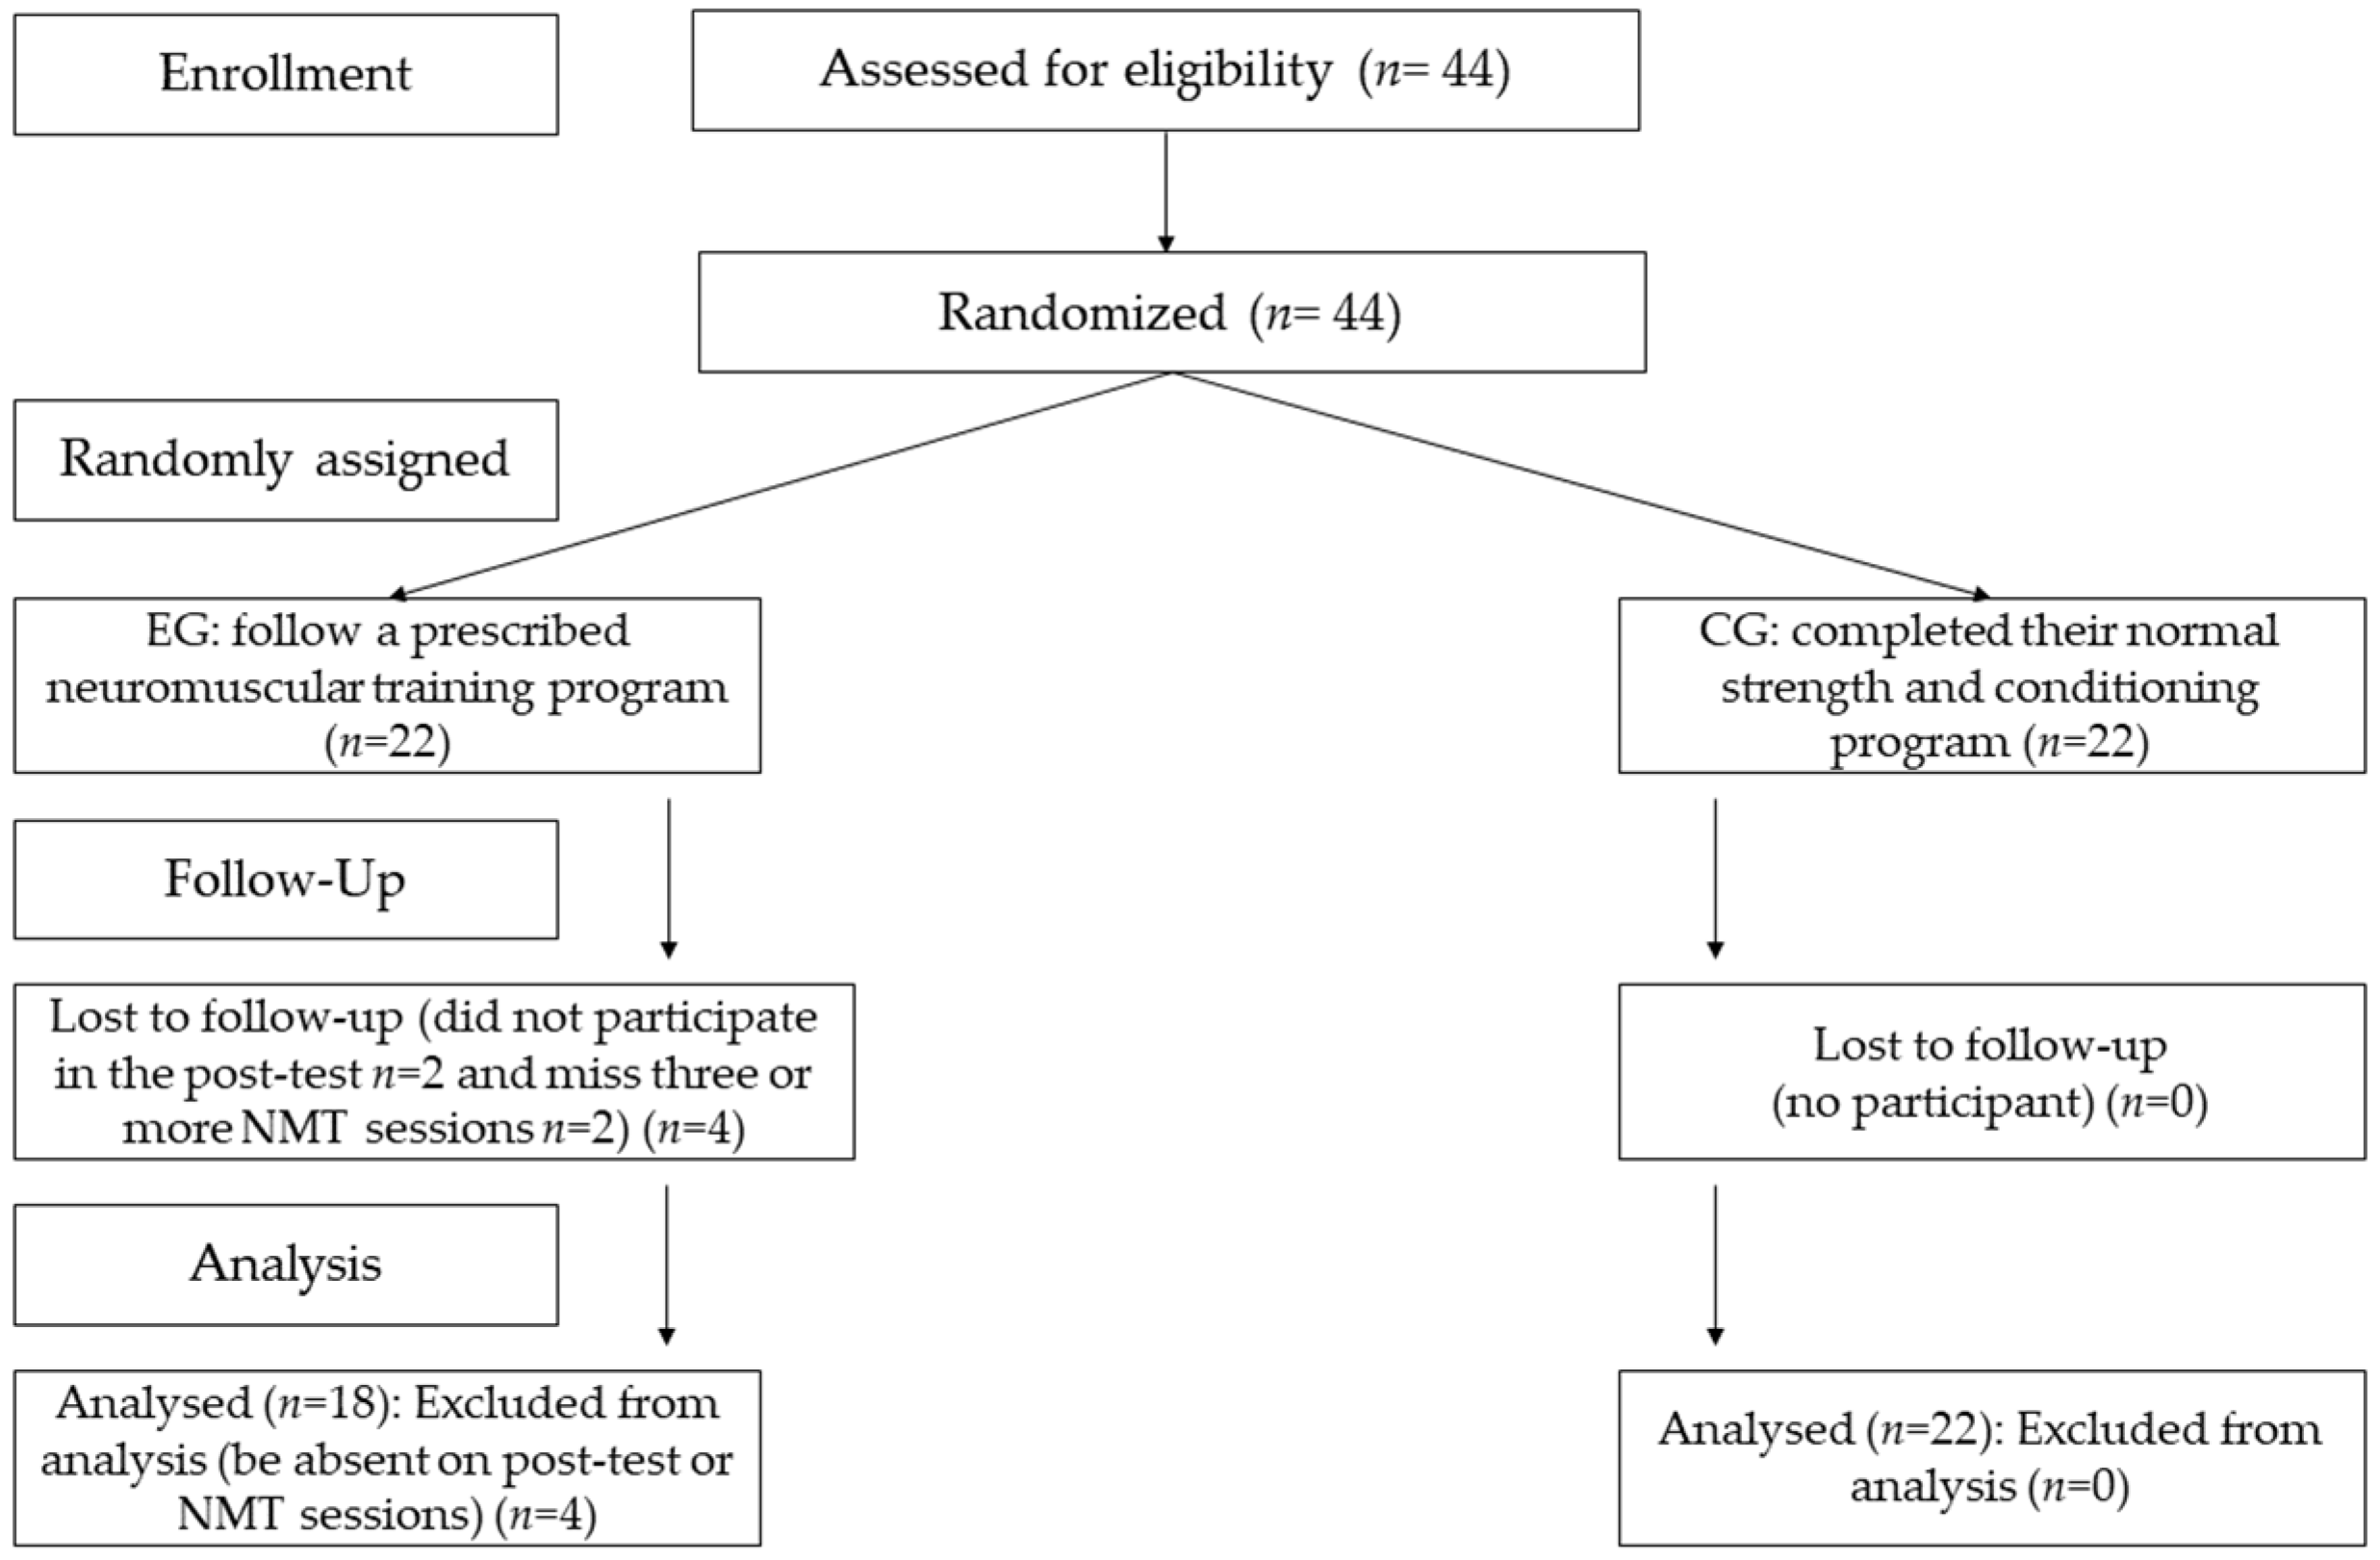
2.1. Participants
2.2. Measurement of Body Composition
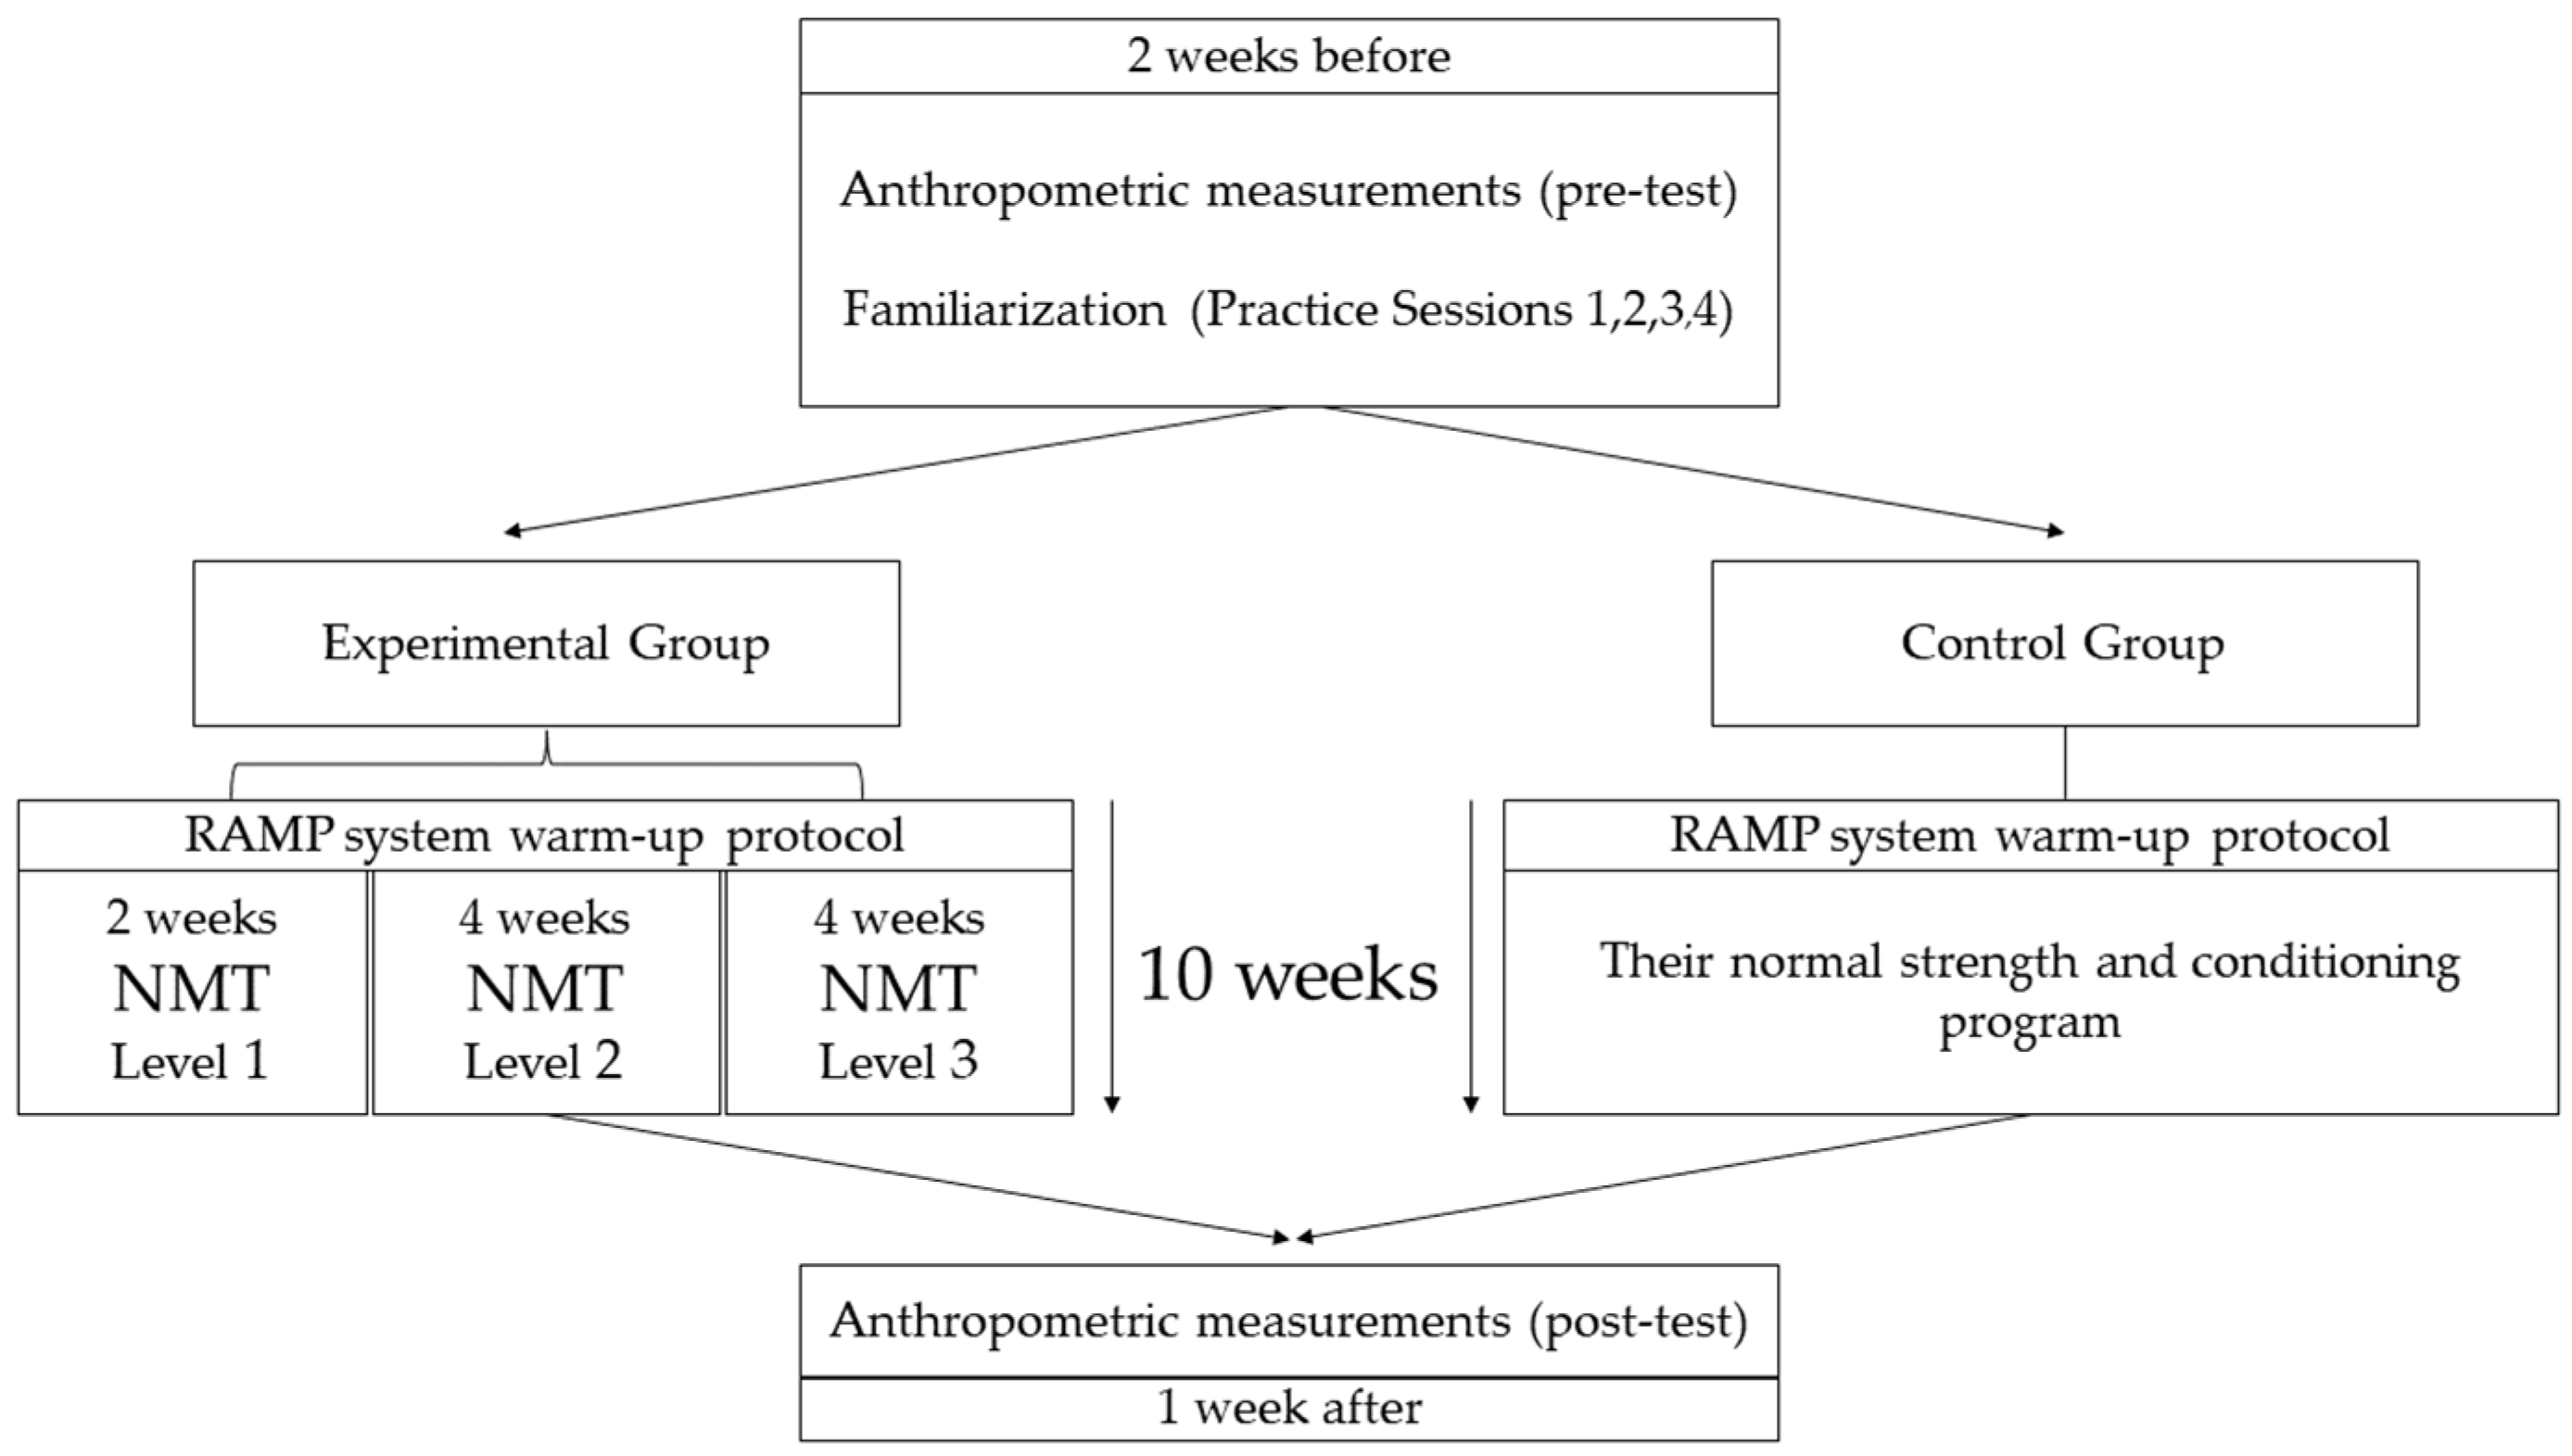
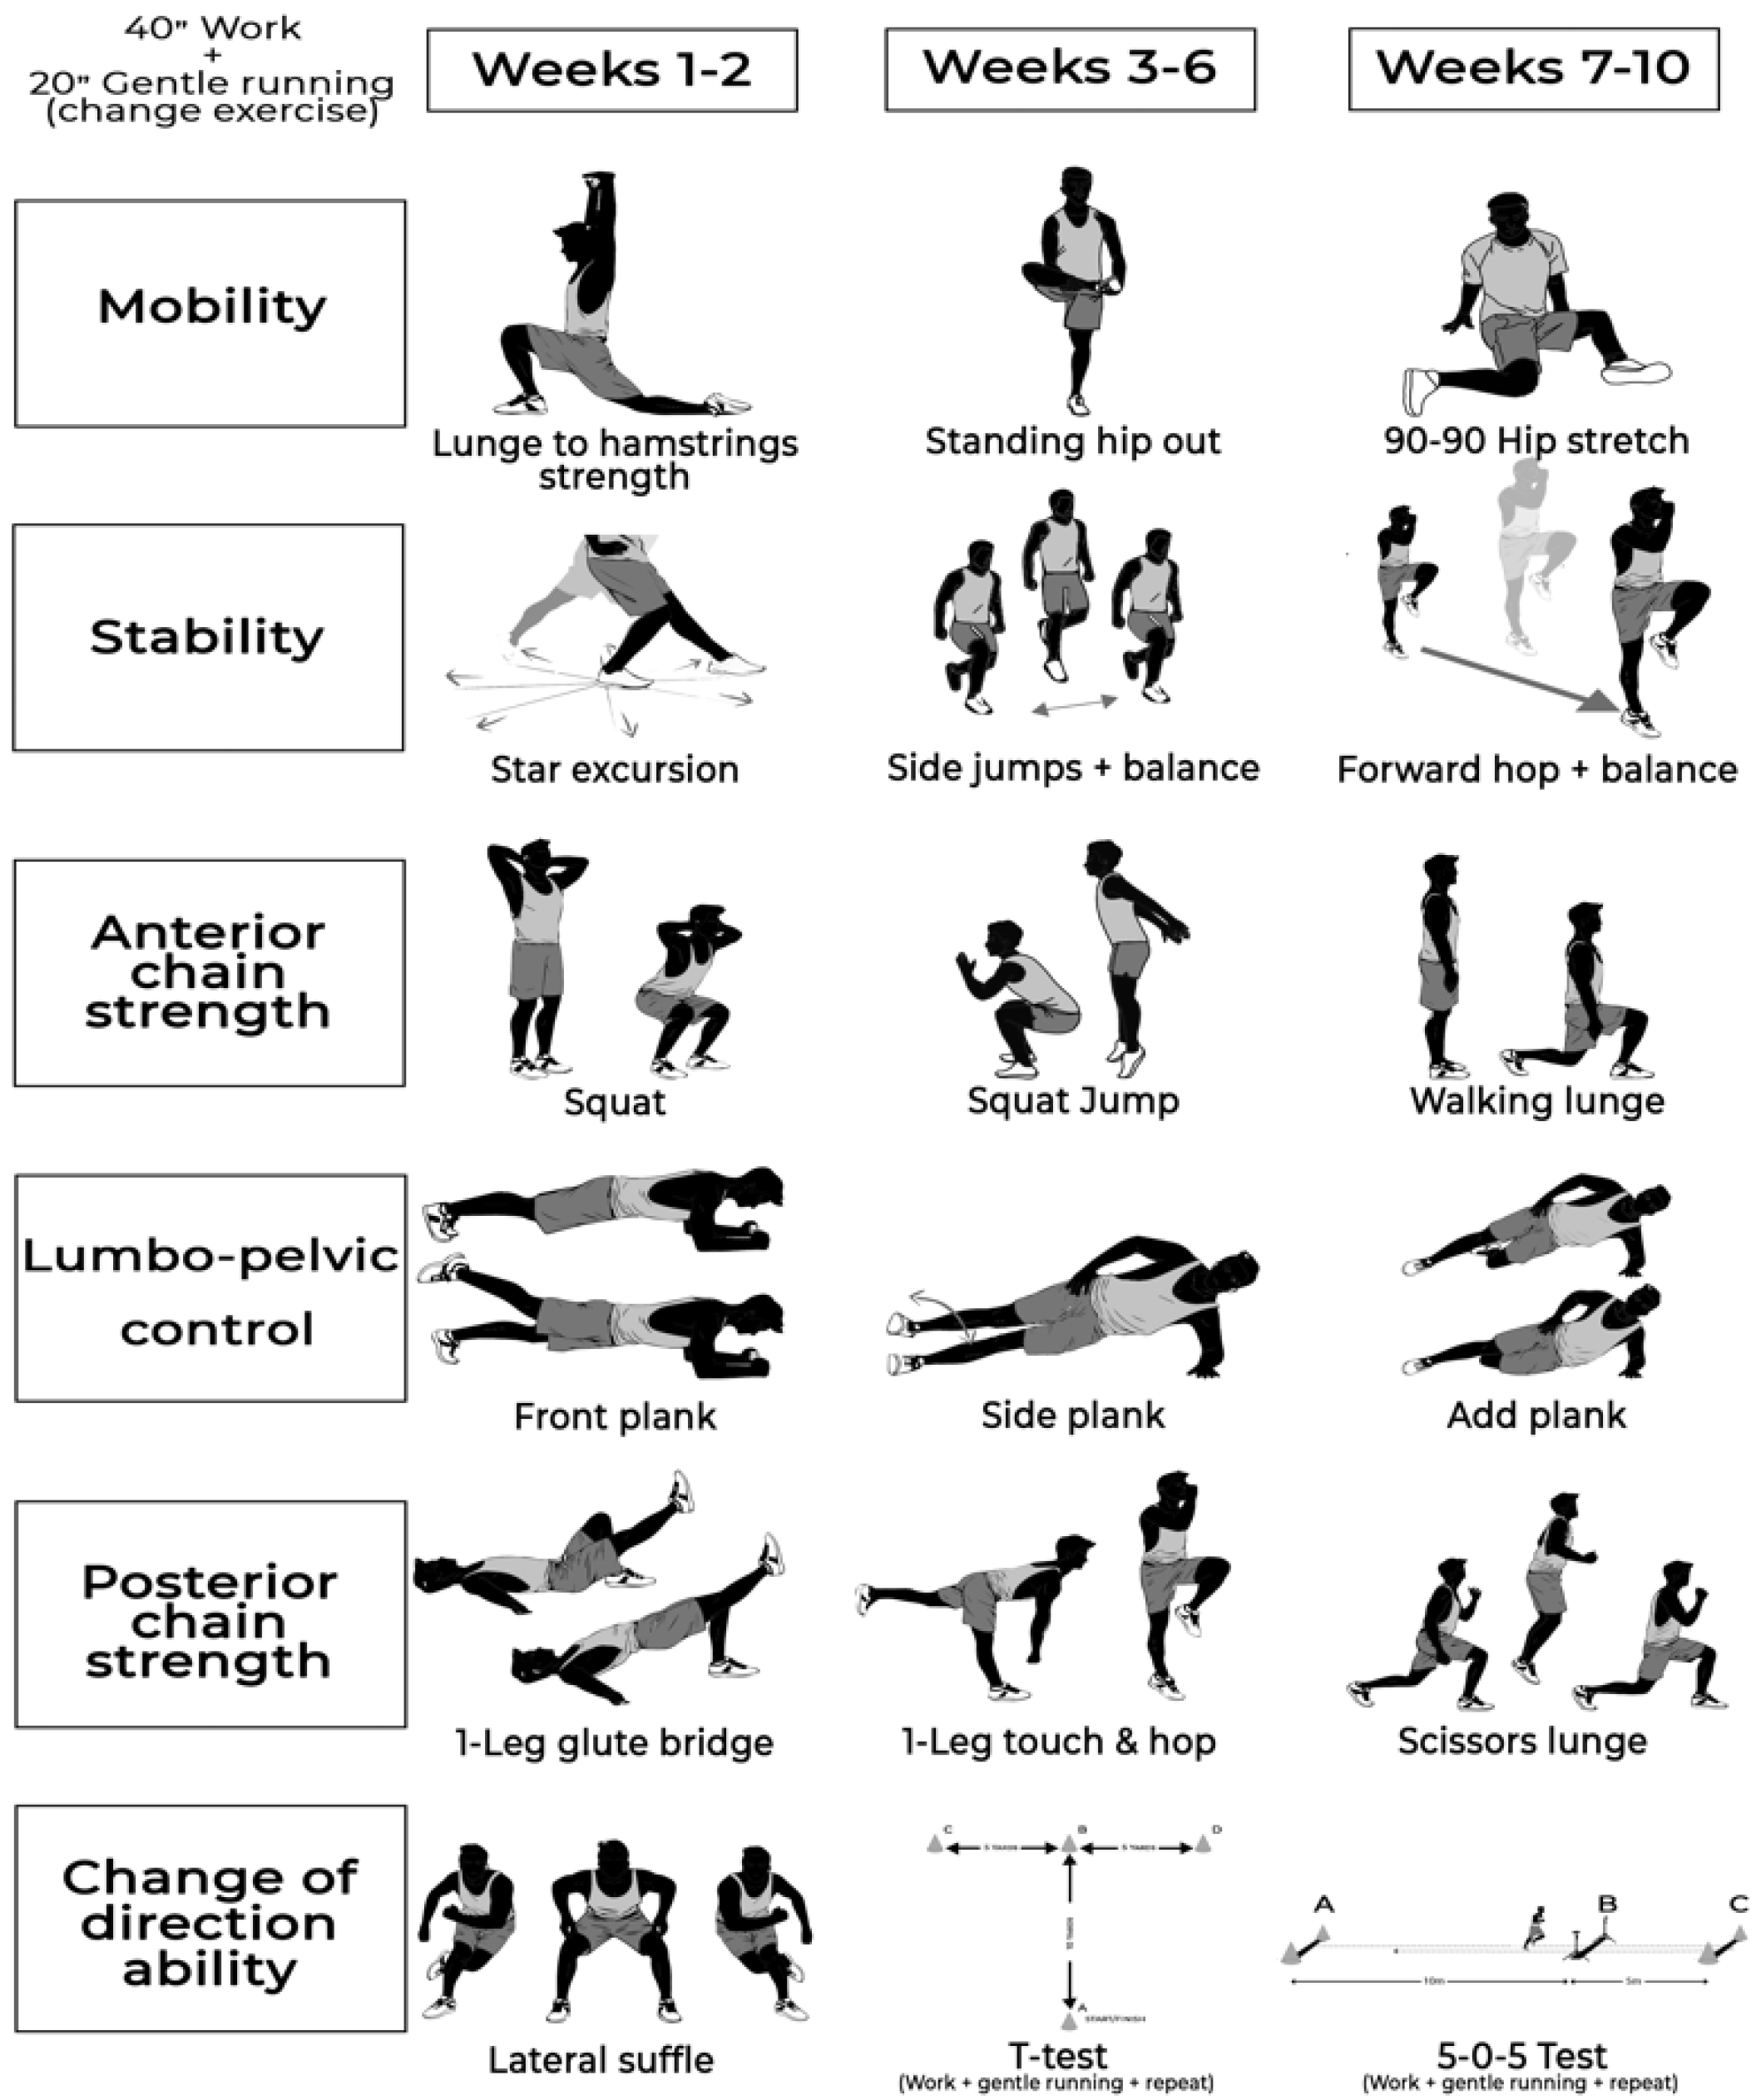
2.3. Exercise Protocol
2.4. Statistical Analysis
3. Results
4. Discussion
5. Conclusions
Author Contributions
Funding
Institutional Review Board Statement
Informed Consent Statement
Data Availability Statement
Acknowledgments
Conflicts of Interest
References
- Federation Internationale de Football Association. FIFA Big Count 2006: 270 Million People Active in Football. Available online: https://resources.fifa.com/image/upload/big-count-estadisticas-520058.pdf?cloudid=mzid0qmguixkcmruvema (accessed on 2 March 2022).
- Consejo Superior de Deportes. Estadística de Deporte Federado 2020. Available online: https://www.culturaydeporte.gob.es/dam/jcr:6b7e9a1a-e3e5-4b45-8ae5-6f187b50235f/estadistica-de-deporte-federado.pdf (accessed on 5 March 2022).
- Federation Internationale de Football Association. Estrategia de Fútbol Femenino. Available online: https://www.fifa.com/es/womens-football/strategy/strategy-details (accessed on 24 April 2022).
- Datson, N.; Drust, B.; Weston, M.; Jarman, I.H.; Lisboa, P.J.; Gregson, W. Match Physical Performance of Elite Female Soccer Players during International Competition. J. Strength Cond. Res. 2017, 31, 2379–2387. [Google Scholar] [CrossRef]
- Datson, N.; Hulton, A.; Andersson, H.; Lewis, T.; Weston, M.; Drust, B.; Gregson, W. Applied physiology of female soccer: An update. Sports Med. 2014, 44, 1225–1240. [Google Scholar] [CrossRef] [PubMed] [Green Version]
- Faude, O.; Koch, T.; Meyer, T. Straight sprinting is the most frequent action in goal situations in professional football. J. Sports Sci. 2012, 30, 625–631. [Google Scholar] [CrossRef] [PubMed]
- Salokun, S.O. Minimizing injury rates in soccer through preselection of players by somatotypes. J. Sports Med. Phys. Fit. 1994, 34, 64–69. [Google Scholar]
- Brocherie, F.; Girard, O.; Forchino, F.; Al Haddad, H.; Dos Santos, G.A.; Millet, G.P. Relationships between anthropometric measures and athletic performance, with special reference to repeated-sprint ability, in the Qatar national soccer team. J. Sports Sci. 2014, 32, 1243–1254. [Google Scholar] [CrossRef] [PubMed]
- Rebelo, A.; Brito, J.; Maia, J.; Coelho-e-Silva, M.J.; Figueiredo, A.J.; Bangsbo, J.; Malina, R.M.; Seabra, A. Anthropometric characteristics, physical fitness and technical performance of under-19 soccer players by competitive level and field position. Int. J. Sports Med. 2013, 34, 312–317. [Google Scholar] [CrossRef] [Green Version]
- Nobari, H.; Kargarfard, M.; Minasian, V.; Cholewa, J.M.; Pérez-Gómez, J. The effects of 14-week betaine supplementation on endocrine markers, body composition and anthropometrics in professional youth soccer players: A double blind, randomized, placebo-controlled trial. J. Int. Soc. Sports Nutr. 2021, 18, 20. [Google Scholar] [CrossRef]
- Nobari, H.; Pardos, E.M.; Adsuar, J.C.; García, J.M.F.; Ramos, J.R.; Bolaños, M.A.C.; Alul, L.U.; Gómez, J.P. Association between Endocrine Markers, Accumulated Workload, and Fitness Parameters during a Season in Elite Young Soccer Players. Front. Psychol. 2021, 12, 702454. [Google Scholar] [CrossRef]
- Comfort, P.; Stewart, A.; Bloom, L.; Clarkson, B. Relationships between strength, sprint, and jump performance in well-trained youth soccer players. J. Strength Cond. Res. 2014, 28, 173–177. [Google Scholar] [CrossRef]
- Oliveira, R.; Francisco, R.; Fernandes, R.; Martins, A.; Nobari, H.; Clemente, F.M.; Brito, J.P. In-Season Body Composition Effects in Professional Women Soccer Players. Int. J. Environ. Res. Public Health 2021, 18, 12023. [Google Scholar] [CrossRef]
- Slimani, M.; Nikolaidis, P.T. Anthropometric and physiological characteristics of male soccer players according to their competitive level, playing position and age group: A systematic review. J. Sports Med. Phys. Fit. 2019, 59, 141–163. [Google Scholar] [CrossRef] [PubMed]
- Radzimiński, Ł.; Szwarc, A.; Cabo, A.P.; Jastrzębski, Z. Correlations between body composition, aerobic capacity, speed and distance covered among professional soccer players during official matches. J. Sports Med. Phys. Fit. 2020, 60, 257–262. [Google Scholar] [CrossRef]
- Nobari, H.; Oliveira, R.; Clemente, F.M.; Pérez-Gómez, J.; Pardos-Mainer, E.; Ardigò, L.P. Somatotype, Accumulated Workload, and Fitness Parameters in Elite Youth Players: Associations with Playing Position. Children 2021, 8, 375. [Google Scholar] [CrossRef] [PubMed]
- Gonçalves, L.; Clemente, F.M.; Barrera, J.I.; Sarmento, H.; Fernández, F.T.G.; Vieira, L.H.P.; Figueiredo, A.J.; Clark, C.C.T.; Carral, J.M.C. Relationships between Fitness Status and Match Running Performance in Adult Women Soccer Players: A Cohort Study. Medicina 2021, 57, 617. [Google Scholar] [CrossRef] [PubMed]
- Villa-Vicente, J.G.; García - López, J.; Moreno-Pascual, C. Influence of a Preparation Period in the Kinantropometry Profile of Soccer-Players. Arch Med Deporte 2000, 17, 9–20. [Google Scholar]
- Chamari, K.; Hachana, Y.; Ahmed, Y.B.; Galy, O.; Sghaïer, F.; Chatard, J.C.; Hue, O.; Wisløff, U. Field and laboratory testing in young elite soccer players. Br. J. Sports Med. 2004, 38, 191–196. [Google Scholar] [CrossRef]
- Mujika, I.; Santisteban, J.; Impellizzeri, F.; Castagna, C. Fitness determinants of success in men’s and women’s football. J. Sports Sci. 2009, 27, 107–114. [Google Scholar] [CrossRef]
- Canda, A.S. Variables Antropométricas de la Población Deportista Española; Consejo Superior de Deportes, Servicio de Documentación y Publicaciones: Madrid, Spain, 2012. [Google Scholar]
- Meyer, N.L.; Borgen, J.S.; Lohman, T.G.; Ackland, T.R.; Stewart, A.D.; Maughan, R.J.; Smith, S.; Müller, W. Body composition for health and performance: A survey of body composition assessment practice carried out by the Ad Hoc Research Working Group on Body Composition, Health and Performance under the auspices of the IOC Medical Commission. Br. J. Sports Med. 2013, 47, 1044–1053. [Google Scholar] [CrossRef]
- Casajús, J.A.; Aragonés, M.T. Estudio morfológico del futbolista de alto nivel. Composición corporal y somatotipo (Parte 1). Arch Med Deporte. 1991, 8, 147–151. [Google Scholar]
- Randell, R.K.; Clifford, T.; Drust, B.; Moss, S.L.; Unnithan, V.B.; Croix, M.B.A.D.S.; Datson, N.; Martin, D.; Mayho, H.; Carter, J.M.; et al. Physiological Characteristics of Female Soccer Players and Health and Performance Considerations: A Narrative Review. Sports Med. 2021, 51, 1377–1399. [Google Scholar] [CrossRef]
- Steffl, M.; Kinkorova, I.; Kokstejn, J.; Petr, M. Macronutrient Intake in Soccer Players—A Meta-Analysis. Nutrients 2019, 11, 1305. [Google Scholar] [CrossRef] [PubMed] [Green Version]
- Rasulovna, R.M. The Effectiveness of the Program for Determining the Composition of the Body and Neurophysiological Characteristics of Athletes Juniors and Cadets. Am. J. Med. Med. Sci. 2021, 11, 665–668. [Google Scholar]
- Sánchez, M.; Sanchez, J.S.; Nakamura, F.Y.; Clemente, F.M.; Moraleda, B.R.; Campillo, R.R. Effects of Plyometric Jump Training in Female Soccer Player’s Physical Fitness: A Systematic Review with Meta-Analysis. Int. J. Environ. Res. Public Health 2020, 17, 8911. [Google Scholar] [CrossRef] [PubMed]
- Mainer, E.P.; Casajús, J.A.; Skok, O.G. Adolescent female soccer players’ soccer-specific warm-up effects on performance and inter-limb asymmetries. Biol. Sport 2019, 36, 199–207. [Google Scholar] [CrossRef]
- Myer, G.D.; Faigenbaum, A.D.; Ford, K.R.; Best, T.M.; Bergeron, M.F.; Hewett, T.E. When to initiate integrative neuromuscular training to reduce sports-related injuries and enhance health in youth? Curr. Sports Med. Rep. 2011, 10, 155–166. [Google Scholar] [CrossRef] [PubMed]
- Grandstrand, S.L.; Pfeiffer, R.P.; Sabick, M.B.; DeBeliso, M.; Shea, K.G. The effects of a commercially available warm-up program on landing mechanics in female youth soccer players. J. Strength Cond. Res. 2006, 20, 331–335. [Google Scholar] [PubMed]
- Noyes, F.R.; Westin, S.D.B.; Smith, S.T.T.; Campbell, T. A training program to improve neuromuscular and performance indices in female high school soccer players. J. Strength Cond. Res. 2013, 27, 340–351. [Google Scholar] [CrossRef] [Green Version]
- Gilchrist, J.; Mandelbaum, B.R.; Melancon, H.; Ryan, G.W.; Silvers, H.J.; Griffin, L.Y.; Watanabe, D.S.; Dick, R.W.; Dvorak, J. A randomized controlled trial to prevent noncontact anterior cruciate ligament injury in female collegiate soccer players. Am. J. Sports Med. 2008, 36, 1476–1483. [Google Scholar] [CrossRef]
- Mandelbaum, B.R.; Silvers, H.J.; Watanabe, D.S.; Knarr, J.F.; Thomas, S.D.; Griffin, L.Y.; Kirkendall, D.T.; Garrett, W., Jr. Effectiveness of a neuromuscular and proprioceptive training program in preventing anterior cruciate ligament injuries in female athletes: 2-year follow-up. Am. J. Sports Med. 2005, 33, 1003–1010. [Google Scholar] [CrossRef]
- Bizzini, M.; Dvorak, J. FIFA 11+: An effective programme to prevent football injuries in various player groups worldwide—A narrative review. Br. J. Sports Med. 2015, 49, 577–579. [Google Scholar] [CrossRef]
- Kiani, A.; Hellquist, E.; Ahlqvist, K.; Gedeborg, R.; Michaëlsson, K.; Byberg, L. Prevention of soccer-related knee injuries in teenaged girls. Arch. Intern. Med. 2010, 170, 43–49. [Google Scholar] [CrossRef] [PubMed] [Green Version]
- Liu, R.; Liu, J.; Ma, X.; Li, Q.; An, R. Effect of FIFA 11+ intervention on change of direction performance in soccer and futsal players: A systematic review and meta-analysis. Int. J. Sports Sci. Coach. 2021, 16, 862–872. [Google Scholar] [CrossRef]
- Rohmansyah, N.A.; Hiruntrakul, A.J.S.M. Do Lipid Profiles, Body Composition, and Physical Fitness Improve after a FIFA 11+ Training Programme from Obese Women? Sport Mont 2021, 19, 51–57. [Google Scholar]
- Simões, R.; Salles, G.; Gonelli, P.; Leite, G.; Dias, R.; Cavaglieri, C.; Pellegrinotti, Í.; Borin, J.; Verlengia, R.; Alves, S.; et al. Effects of the Neuromuscular Training in the Cardiorespiratory Fitness and Body Composition of Female Volleyball Athletes. Rev. Bras. Med. Esporte 2009, 15, 295–298. [Google Scholar] [CrossRef]
- Falces-Prieto, M.; de Villarreal-Sáez, E.S.; Raya-González, J.; González-Fernández, F.T.; Clemente, F.M.; Badicu, G.; Murawska-Ciałowicz, E. The Differentiate Effects of Resistance Training with or without External Load on Young Soccer Players’ Performance and Body Composition. Front. Physiol. 2021, 12, 771684. [Google Scholar] [CrossRef]
- Suarez-Arrones, L.; de Villarreal, E.S.; Núñez, F.J.; Di Salvo, V.; Petri, C.; Buccolini, A.; Maldonado, R.A.; Torreno, N.; Mendez-Villanueva, A. In-season eccentric-overload training in elite soccer players: Effects on body composition, strength and sprint performance. PLoS ONE 2018, 13, e0205332. [Google Scholar] [CrossRef]
- Peitz, M.; Behringer, M.; Granacher, U. A systematic review on the effects of resistance and plyometric training on physical fitness in youth—What do comparative studies tell us? PLoS ONE 2018, 13, e0205525. [Google Scholar]
- Ros, F.E.; Cristóbal, R.V.; Marfell-Jones, M. Protocolo Internacional para la Valoración Antropométrica; Universidad Católica de Murcia Ed.; Univ, U., Ed.; Publicado por Sociedad Internacional para el Avance de la Cineantropometría: Murcia, Spain, 2019. [Google Scholar]
- Burgos, M.A.M.; Martínez-Victoria, I.; Milá, R.; Farrán, A.; Farré, R.; Ros, G.; Yago, M.D.; Audi, N.; Santana, C.; Millán, M.B.L.; et al. Building a unified Spanish food database according to EuroFIR specifications. Food Chem. 2009, 113, 784–788. [Google Scholar] [CrossRef]
- Keys, A.; Fidanza, F.; Karvonen, M.J.; Kimura, N.; Taylor, H.L. Indices of relative weight and obesity. J. Chronic Dis. 1972, 25, 329–343. [Google Scholar] [CrossRef]
- Withers, R.T.; Whittingham, N.O.; Norton, K.I.; La Forgia, J.; Ellis, M.W.; Crockett, A. Relative body fat and anthropometric prediction of body density of female athletes. Eur. J. Appl. Physiol. Occup. Physiol. 1987, 56, 169–180. [Google Scholar] [CrossRef]
- Siri, W.E. The gross composition of the body. Adv. Biol. Med. Phys. 1956, 4, 239–280. [Google Scholar] [PubMed]
- Lee, R.C.; Wang, Z.; Heo, M.; Ross, R.; Janssen, I.; Heymsfield, S.B. Total-body skeletal muscle mass: Development and cross-validation of anthropometric prediction models. Am. J. Clin. Nutr. 2000, 72, 796–803. [Google Scholar] [CrossRef] [PubMed]
- Jeffreys, I.J.U.J. Warm up revisited—the ‘ramp’method of optimising performance preparation. UKSCA J. 2006, 6, 15–19. [Google Scholar]
- Zamunér, A.R.; Moreno, M.A.; Camargo, T.M.; Graetz, J.P.; Rebelo, A.C.; Tamburús, N.Y.; da Silva, E. Assessment of Subjective Perceived Exertion at the Anaerobic Threshold with the Borg CR-10 Scale. J. Sports Sci. Med. 2011, 10, 130–136. [Google Scholar] [PubMed]
- Haddad, M.; Stylianides, G.; Djaoui, L.; Dellal, A.; Chamari, K. Session-RPE Method for Training Load Monitoring: Validity, Ecological Usefulness, and Influencing Factors. Front. Neurosci. 2017, 11, 612. [Google Scholar] [CrossRef] [Green Version]
- Sudha, K.; Maniazhagu, D. Effects of Circuit Training Combined with Different Neuromuscular Activities on Muscular Endurance and Body Composition of School Girls. Indian J. Public Health Res. Dev. 2019, 10, 30. [Google Scholar] [CrossRef]
- Polman, R.; Walsh, D.; Bloomfield, J.; Nesti, M. Effective conditioning of female soccer players. J. Sports Sci. 2004, 22, 191–203. [Google Scholar] [CrossRef]
- Campo, S.S.; Vaeyens, R.; Philippaerts, R.; Redondo, J.C.; de Benito, A.T.; Cuadrado, G. Effects of Lower-Limb Plyometric Training on Body Composition, Explosive Strength, and Kicking Speed in Female Soccer Players. J. Strength Cond. Res. 2009, 23, 1714–1722. [Google Scholar] [CrossRef]
- Sánchez Pérez, F.J.; Carranque Chaves, G.Á. Efectos del entrenamiento Tabata en la composición corporal del futbolista. Kronos 2015, 14, 7. [Google Scholar]
- Falces, M.; Fernández, F.T.G.; Morales, S.B.; Jiménez, A.B.; Barrero, A.; Conde, L.; Arronez, L.S.; de Villarreal, E.S. Effects of a strength training program with self loading on countermovement jump performance and body composition in young soccer players. J. Sport Health Res. 2020, 1, 112–125. [Google Scholar]
- Suarez-Arrones, L.; Lara-Lopez, P.; Torreño, N.; de Villarreal, E.S.; Di Salvo, V.; Mendez-Villanueva, A. Effects of Strength Training on Body Composition in Young Male Professional Soccer Players. Sports 2019, 7, 104. [Google Scholar] [CrossRef] [PubMed] [Green Version]
- Haghighi, A.; Moghadasi, M.; Nikseresht, A.; Torkfar, A.; Haghighi, M. Effects of plyometric versus resistance training on sprint and skill performance in young soccer players. Eur. J. Exp. Biol. 2012, 2, 2348–2351. [Google Scholar]
- Perez-Gomez, J.; Olmedillas, H.; Delgado-Guerra, S.; Ara, I.; Vicente-Rodríguez, G.; Arteaga-Ortiz, R.; Javier, C.; Calbet, J. Effects of weight lifting training combined with plyometric exercises on physical fitness, body composition, and knee extension velocity during kicking in football. Appl. Physiol. Nutr. Metab. 2008, 33, 501–510. [Google Scholar] [CrossRef] [PubMed]
- Cigerci, A.E.; Genc, H. The Effect of Calisthenics Exercises on Body Composition in Soccer Players. Prog. Nutr. 2020, 22, 94–102. [Google Scholar]
- Staron, R.S.; Leonardi, M.J.; Karapondo, D.L.; Malicky, E.S.; Falkel, J.E.; Hagerman, F.C.; Hikida, R.S. Strength and skeletal muscle adaptations in heavy-resistance-trained women after detraining and retraining. J. Appl. Physiol. 1991, 70, 631–640. [Google Scholar] [CrossRef]
- Sánchez, J.; Pérez, S.; Yagüe, J.M.; Royo, J.M.; Martín, J.L. Aplicación de un programa de entrenamiento de fuerza en futbolistas jóvenes. Rev. Int. Med. Cienc. Act. Fis. Deporte 2015, 15, 45–59. [Google Scholar]
- Häkkinen, K.; Pakarinen, A.; Kallinen, M. Neuromuscular adaptations and serum hormones in women during short-term intensive strength training. Eur. J. Appl. Physiol. Occup. Physiol. 1992, 64, 106–111. [Google Scholar] [CrossRef]
- Stanforth, P.R.; Crim, B.N.; Stanforth, D.; Stults-Kolehmainen, M.A. Body composition changes among female NCAA division 1 athletes across the competitive season and over a multiyear time frame. J. Strength Cond. Res. 2014, 28, 300–307. [Google Scholar] [CrossRef] [Green Version]


| Variable | Control Group (n = 22) | Experimental Group (n = 18) | p |
|---|---|---|---|
| Mean ± SD | Mean ± SD | ||
| Age (years) | 24.61± 4.30 | 23.24 ± 4 | 0.31 |
| Height (cm) | 162.29 ± 5.90 | 166.09 ± 4.65 | 0.07 |
| Body Mass (kg) | 59.46 ± 6.22 | 61.61 ± 4.43 | 0.23 |
| BMI (kg/m2) | 22.46 ± 2.54 | 22.37 ± 1.85 | 0.89 |
| Variable | Control Group (n = 22) | Experimental Group (n = 18) | p | ||
|---|---|---|---|---|---|
| 1st Registration Mean ± SD | 2nd Registration Mean ± SD | 1st Registration Mean ± SD | 2nd Registration Mean ± SD | ||
| Kilocalories (kcal/day) | 2206 ± 377 | 2222 ± 346 | 2266 ± 198 | 2285 ± 189.1 | 0.48 |
| Carbohydrates (g) | 311.9 ± 56.4 | 315.9 ± 47.9 | 336.9 ± 29.7 | 328.8 ± 29.1 | 0.13 |
| Proteins (g) | 92.9 ± 18.2 | 89.3 ± 13.2 | 90.8 ± 9.07 | 90.5 ± 10.6 | 0.56 |
| Fats (g) | 65.1 ± 12.1 | 66.8 ± 12.8 | 66.1 ± 6.79 | 67.8 ± 7.02 | 0.39 |
| Group | Experimental (n = 18) | Control (n = 22) | Sum | ||
|---|---|---|---|---|---|
| Training Program | NMT (6 Exercises) | Mobility (3 Exercises) | Strength (3 Exercises) | RT (3 Exercises) | 9 Exercises |
| Training Details | Sets: 4 Work: 40 s Rest: 20 s Duration: 24 min | Sets: 2 Work: 30 s Rest: 20 s Duration: 5 min | Sets: 4 Work: 40 s Rest: 20 s Duration: 12 min | Sets: 3 (4 reps) Work: ~10 s Rest: ~20 s Duration: 7 min | Sets: 2–4 Work: 10–40 s Rest: 20 s Duration: 24 min |
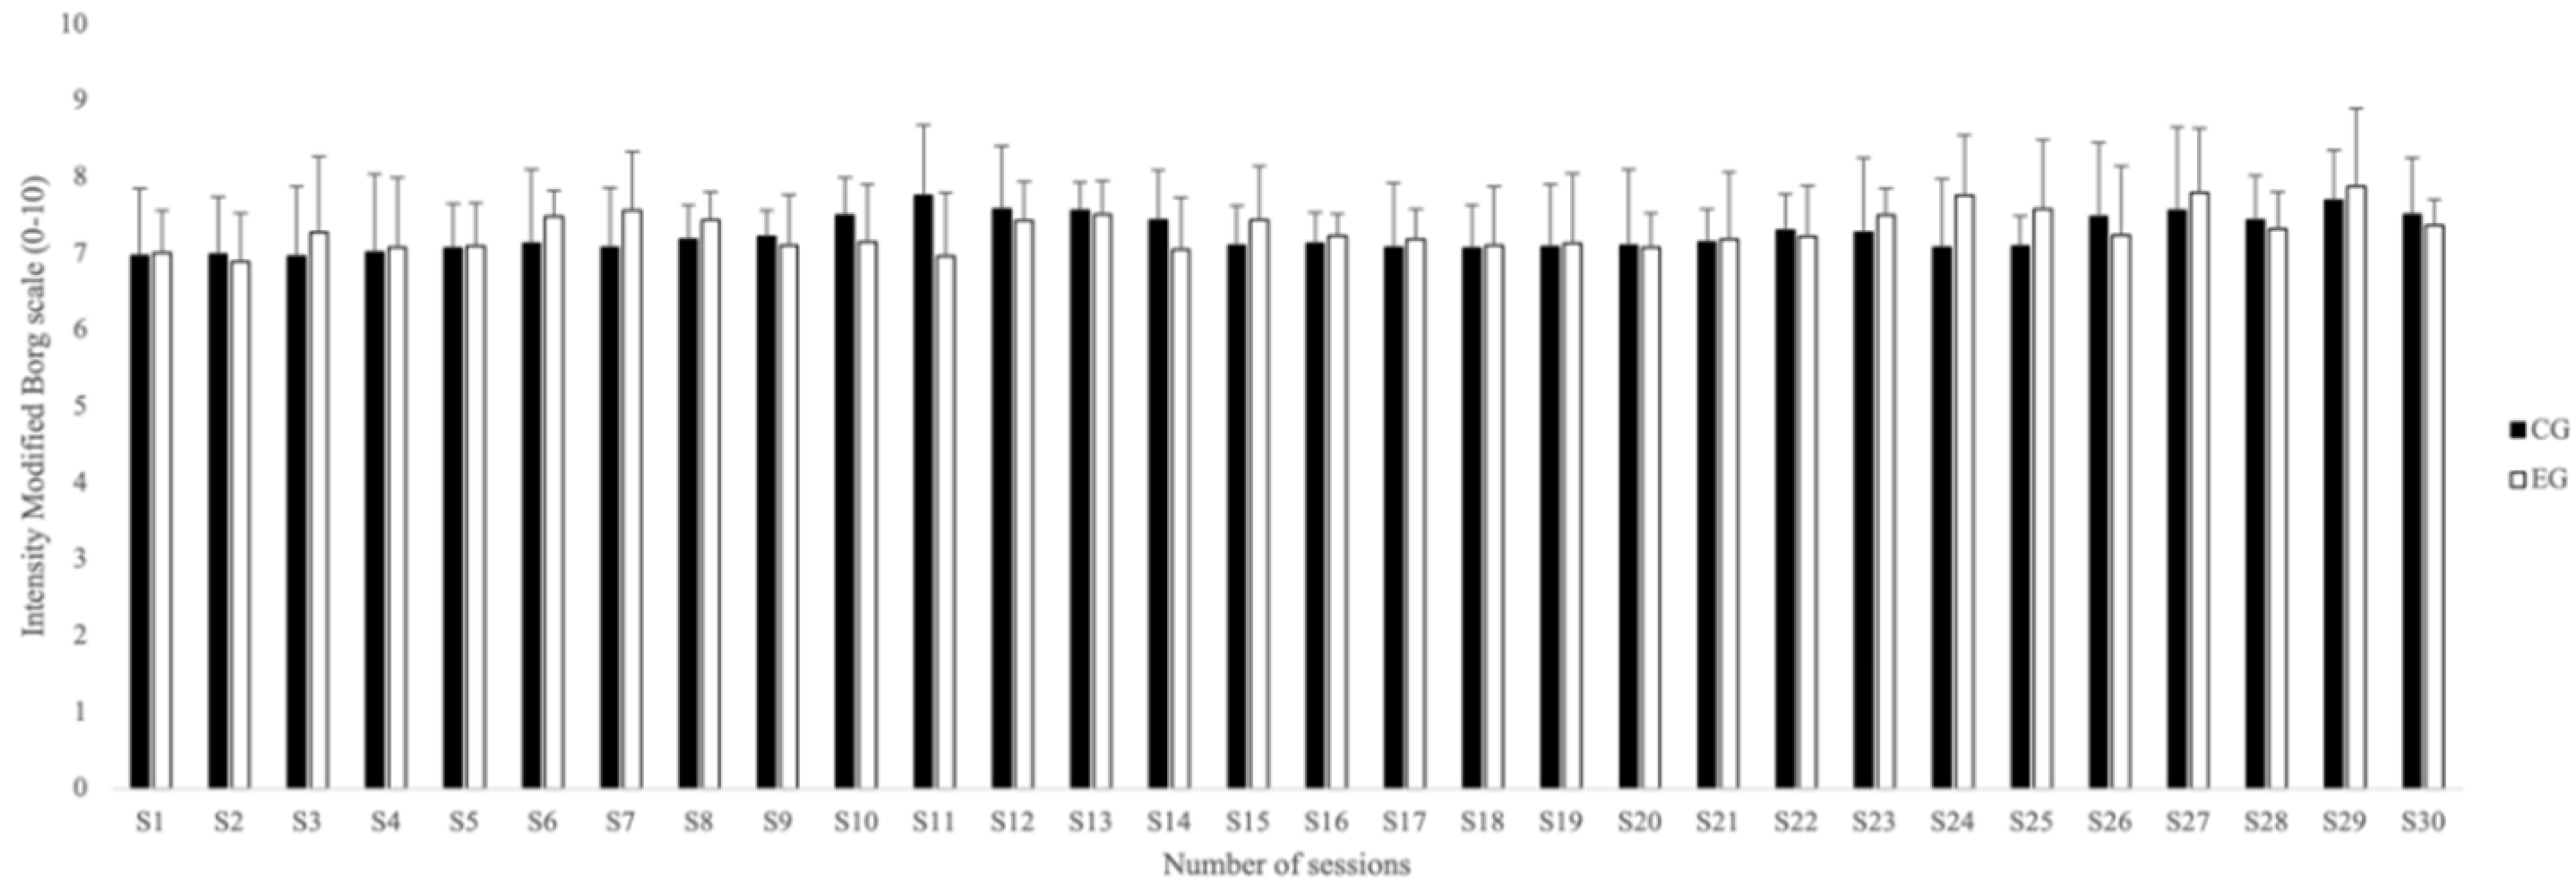
| Work Intensity (RPE) | 7.3 ± 0.25 | 7.26 ± 0.23 | p = 0.45 | ||
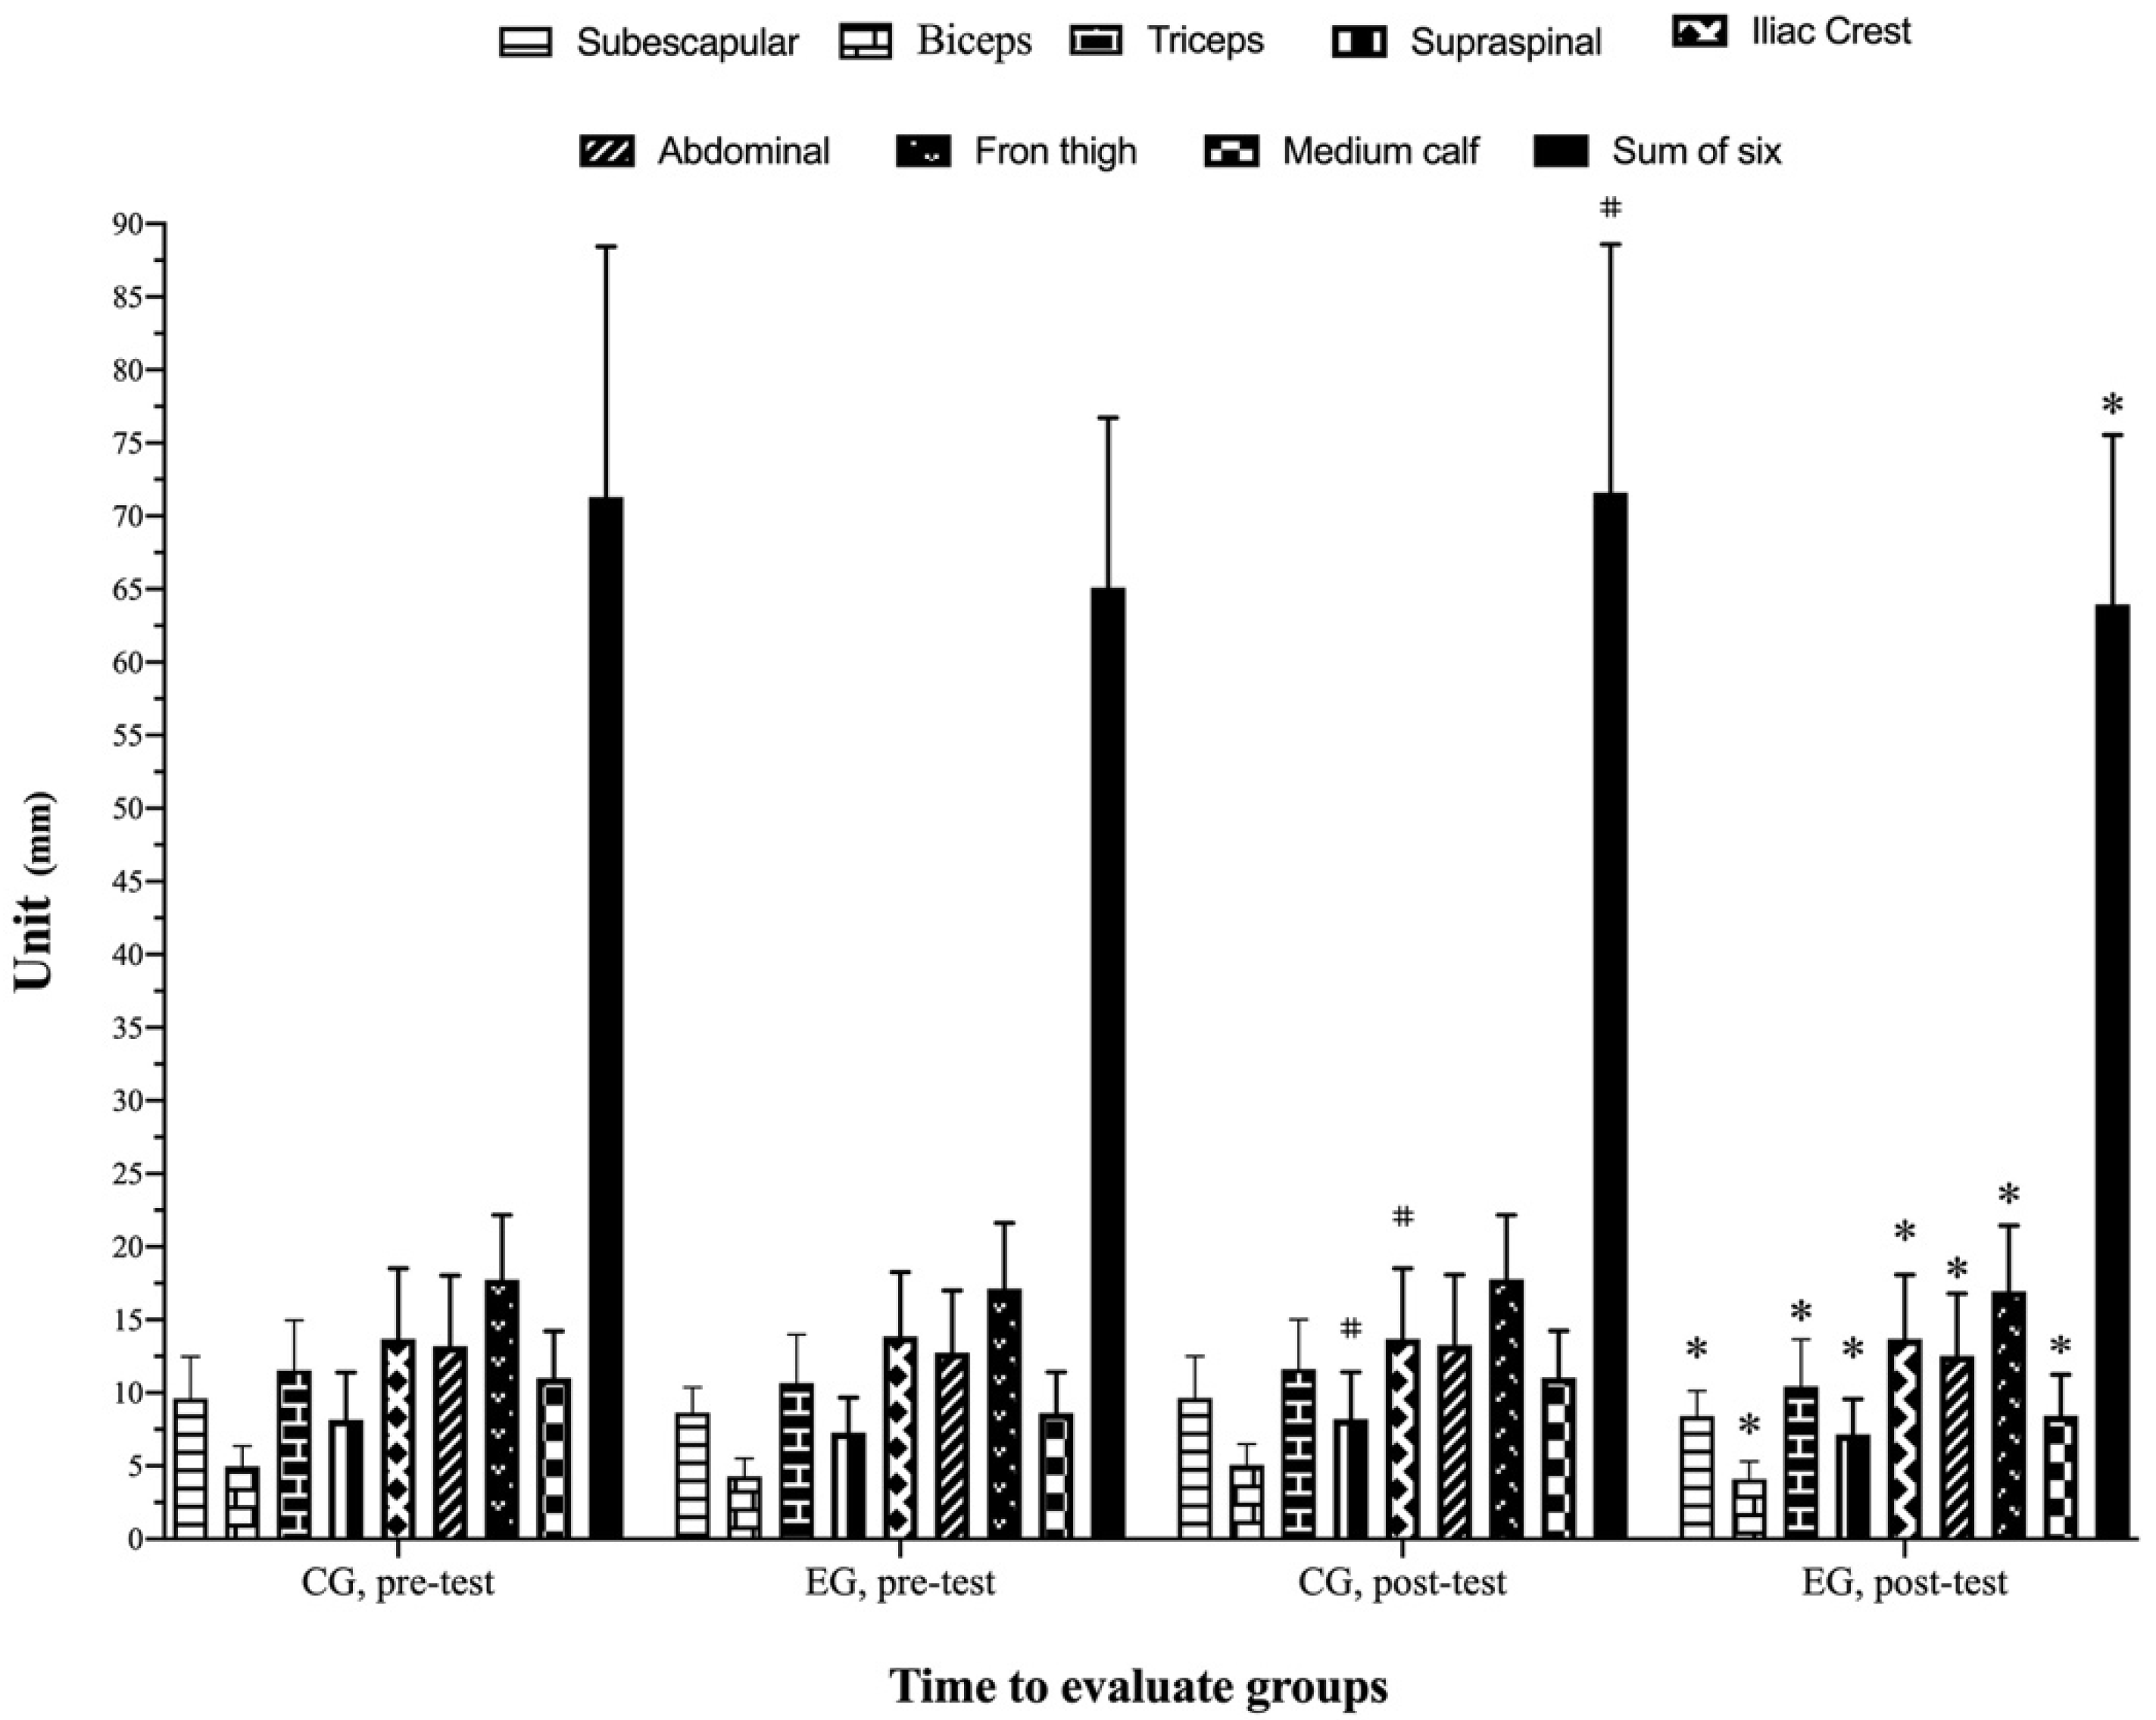
| Skinfolds (mm) | Control Group (n = 22) | Experimental Group (n = 18) | ||||||||
|---|---|---|---|---|---|---|---|---|---|---|
| Pre-Test Mean ± SD | Post-Test Mean ± SD | Pre-Post (%) | p | ES (95% CI) | Pre-Test Mean ± SD | Post-Test Mean ± SD | Pre-Post (%) | p | ES (95% CI) | |
| Subscapular | 9.62 ± 286 | 9.66 ± 2.85 | 0.41 | 0.143 | 0.01 (−0.64; 0.66) T | 8.64 ± 1.71 | 8.42± 1.73 | −2.54 | ≤0.001 * | −0.12 (−0.77; 0,53) T |
| Biceps | 4.97 ± 1.40 | 5.07 ± 1.41 | 2.01 | 0.008 * | 0.06 (−0.58; 0,72) T | 4.27 ± 1.23 | 4.10 ± 1.21 | −3.98 | 0.001 * | −0.13 (−0.78; 0.52) T |
| Triceps | 11.55 ± 3.42 | 11.63 ± 3.39 | 0,69 | 0.144 | 0.02 (−0.63; 0.67) T | 10.67 ± 3.34 | 10.45 ± 3.21 | −2.06 | 0.018 * | −0.06 (−0.71; 0.59) T |
| Supraspinal | 8.15 ± 3.24 | 8.22 ± 3.21 | 0.85 | 0.046 | 0.01 (−0.63; 0.67) T | 7.29 ± 2.38 | 7.16 ± 2.40 | −1.78 | ≤0.001 * | −0.05 (−0.70; 0.60) T |
| Iliac crest | 13.61 ± 4.84 | 13.69 ± 4.84 | 0.58 | 0.002 * | 0.02 (−0.64; 0.67) T | 13.86 ± 4.39 | 13.68 ± 4.41 | −1.29 | ≤0.001 * | −0.04 (−0.69; 0.61) T |
| Abdominal | 13.21 ± 4.84 | 13.27 ± 4.81 | 0.45 | 0.110 | 0.01 (−0.66; 0.67) T | 12.77 ± 4.23 | 12.54 ± 4.25 | −1.80 | 0.001 * | −0.06 (−0.70; 0.60) T |
| Front thigh | 17.76 ± 4.42 | 17.77 ± 4.42 | 0.05 | 0.181 | 0.01 (−0.65; 0.65) T | 17.14 ± 4.48 | 16.95 ± 4.49 | −1.10 | ≤0.001 * | −0.09 (−0.69; 0.61) T |
| Medial calf | 11.03 ± 3.21 | 11.05 ± 3.20 | 0.18 | 0.137 | 0.01 (−0.65; 0.65) T | 8.61 ± 2.82 | 8.43 ± 2.82 | −2.09 | ≤0.001 * | −0.06 (−0.71; 0,59) T |
| Σ6S | 71.32 ± 17.14 | 71.61 ± 16.99 | 0.40 | 0.019 * | 0.01 (−0.64; 0.67) T | 65.12 ± 11.61 | 63.95 ± 11.60 | −1.79 | ≤0.001 * | −0.09 (0.74; 0.55) T |
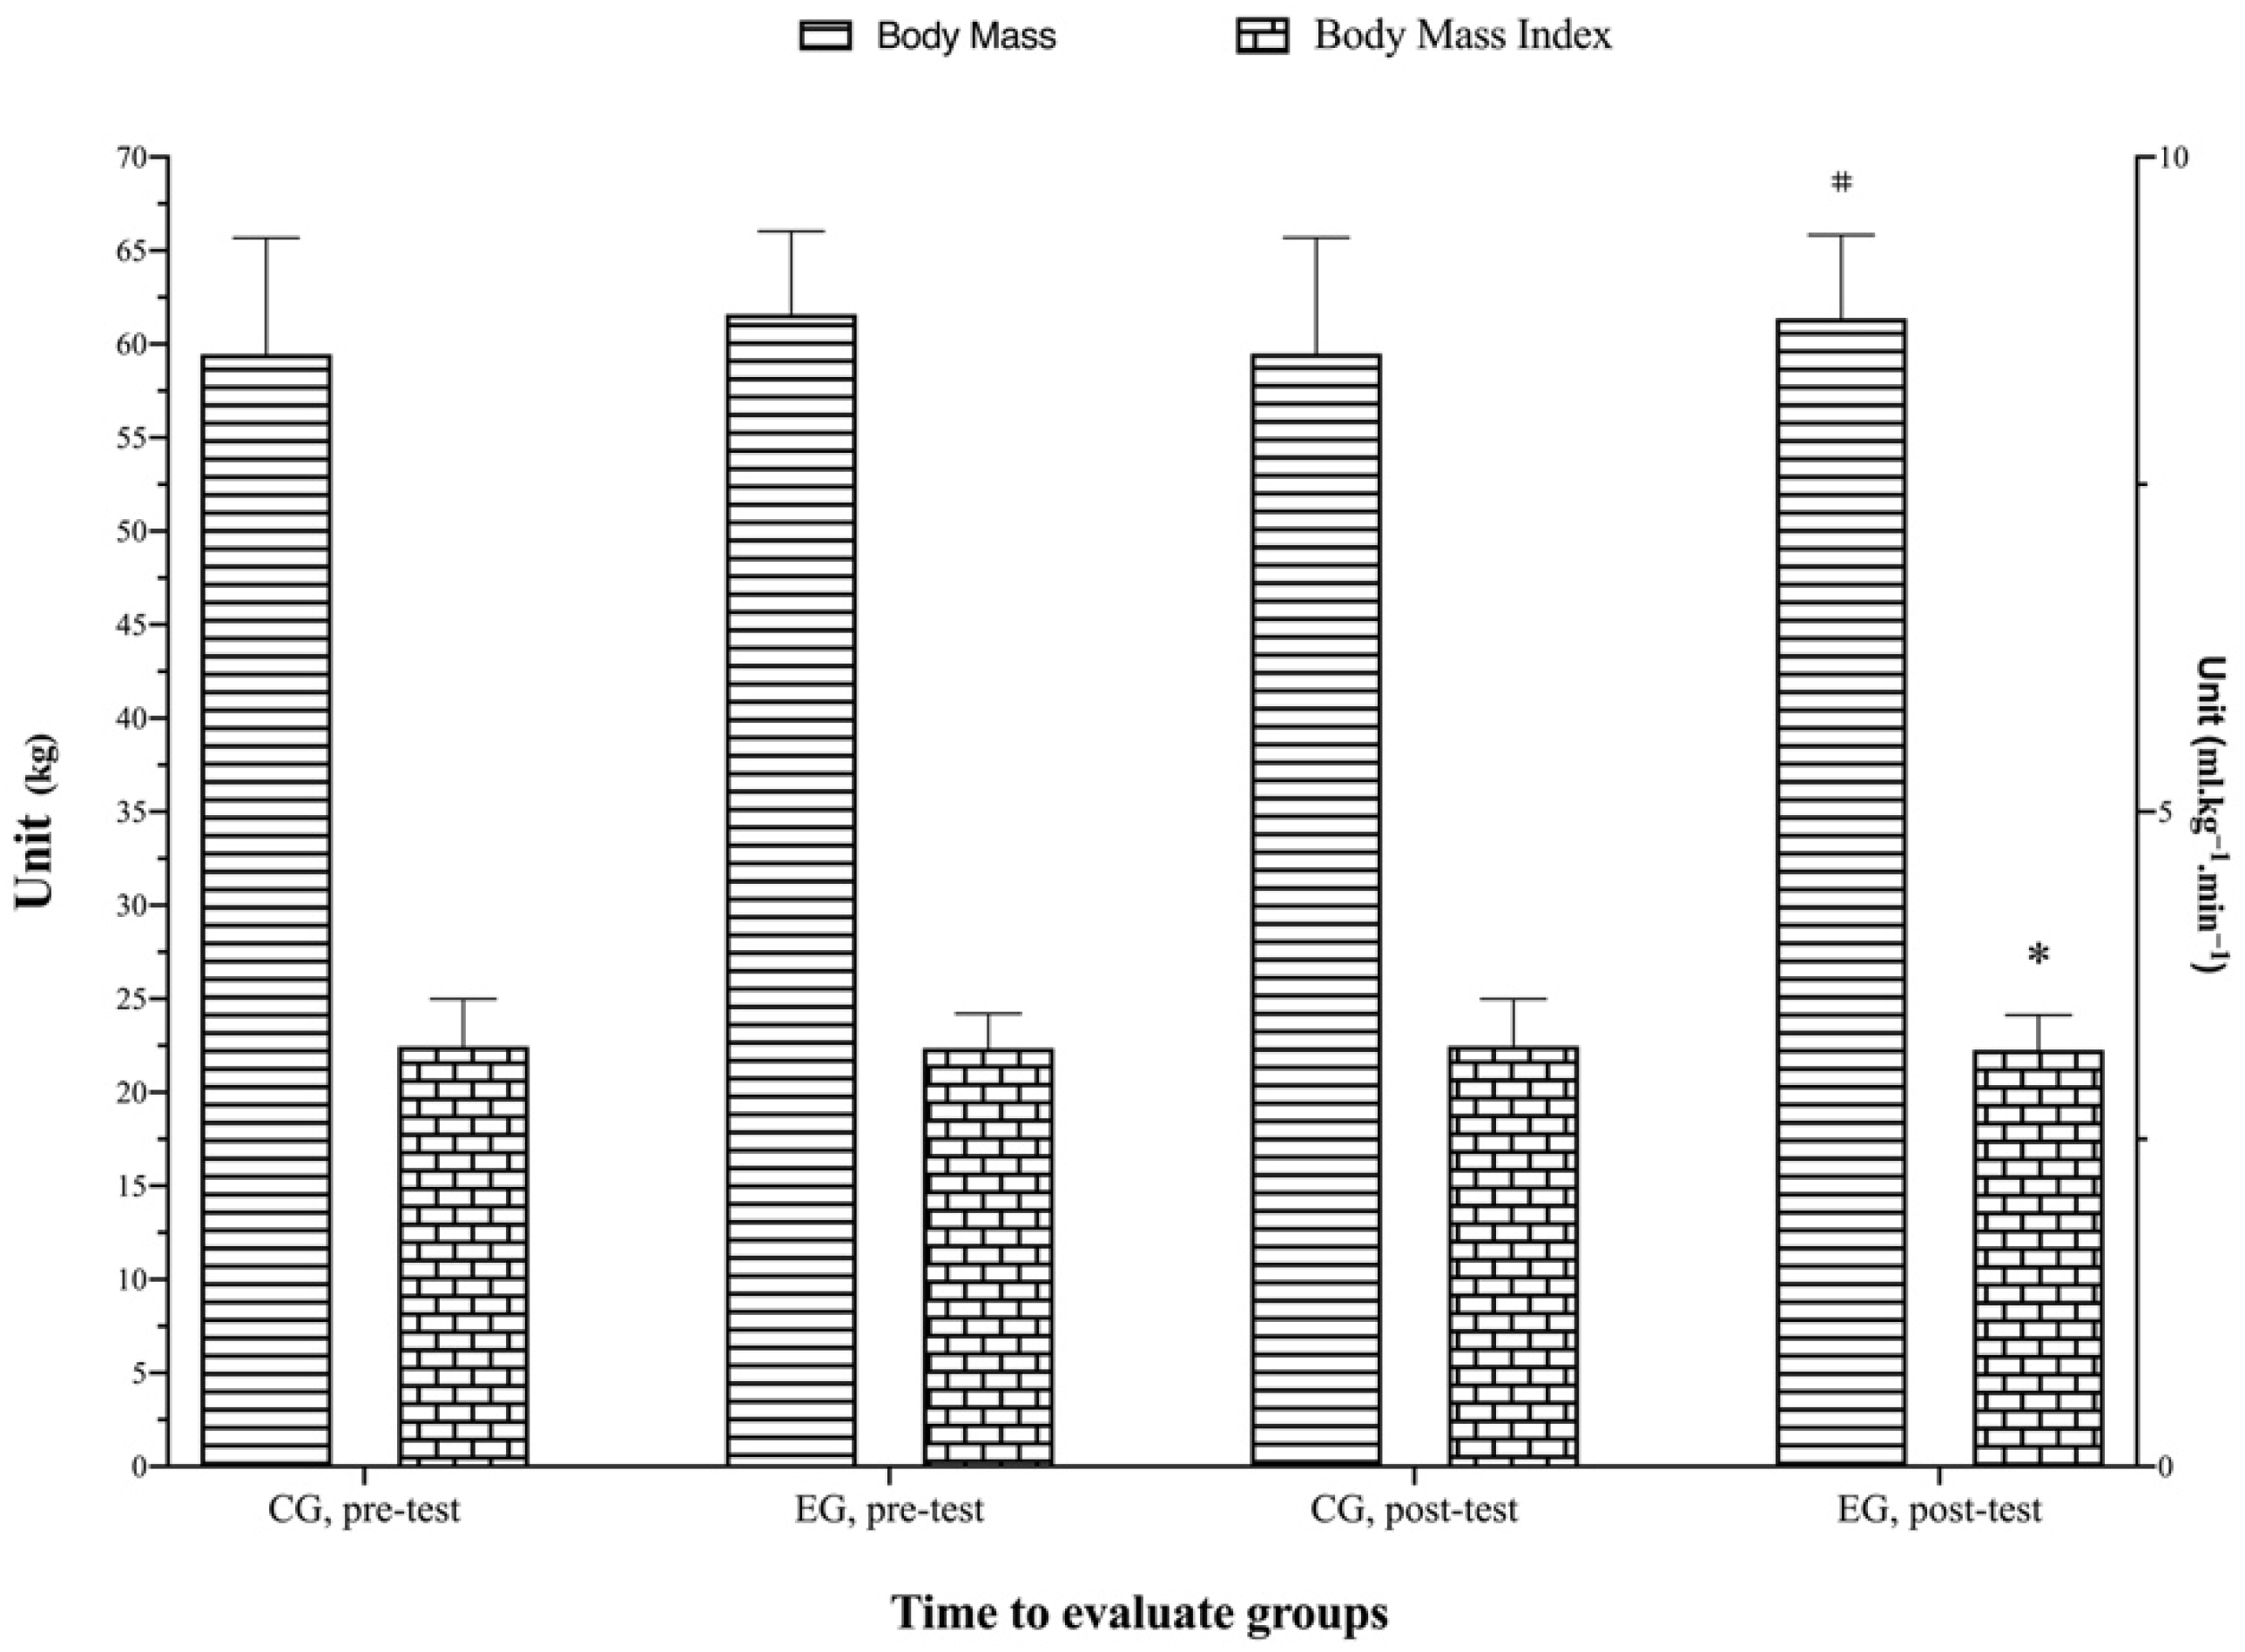
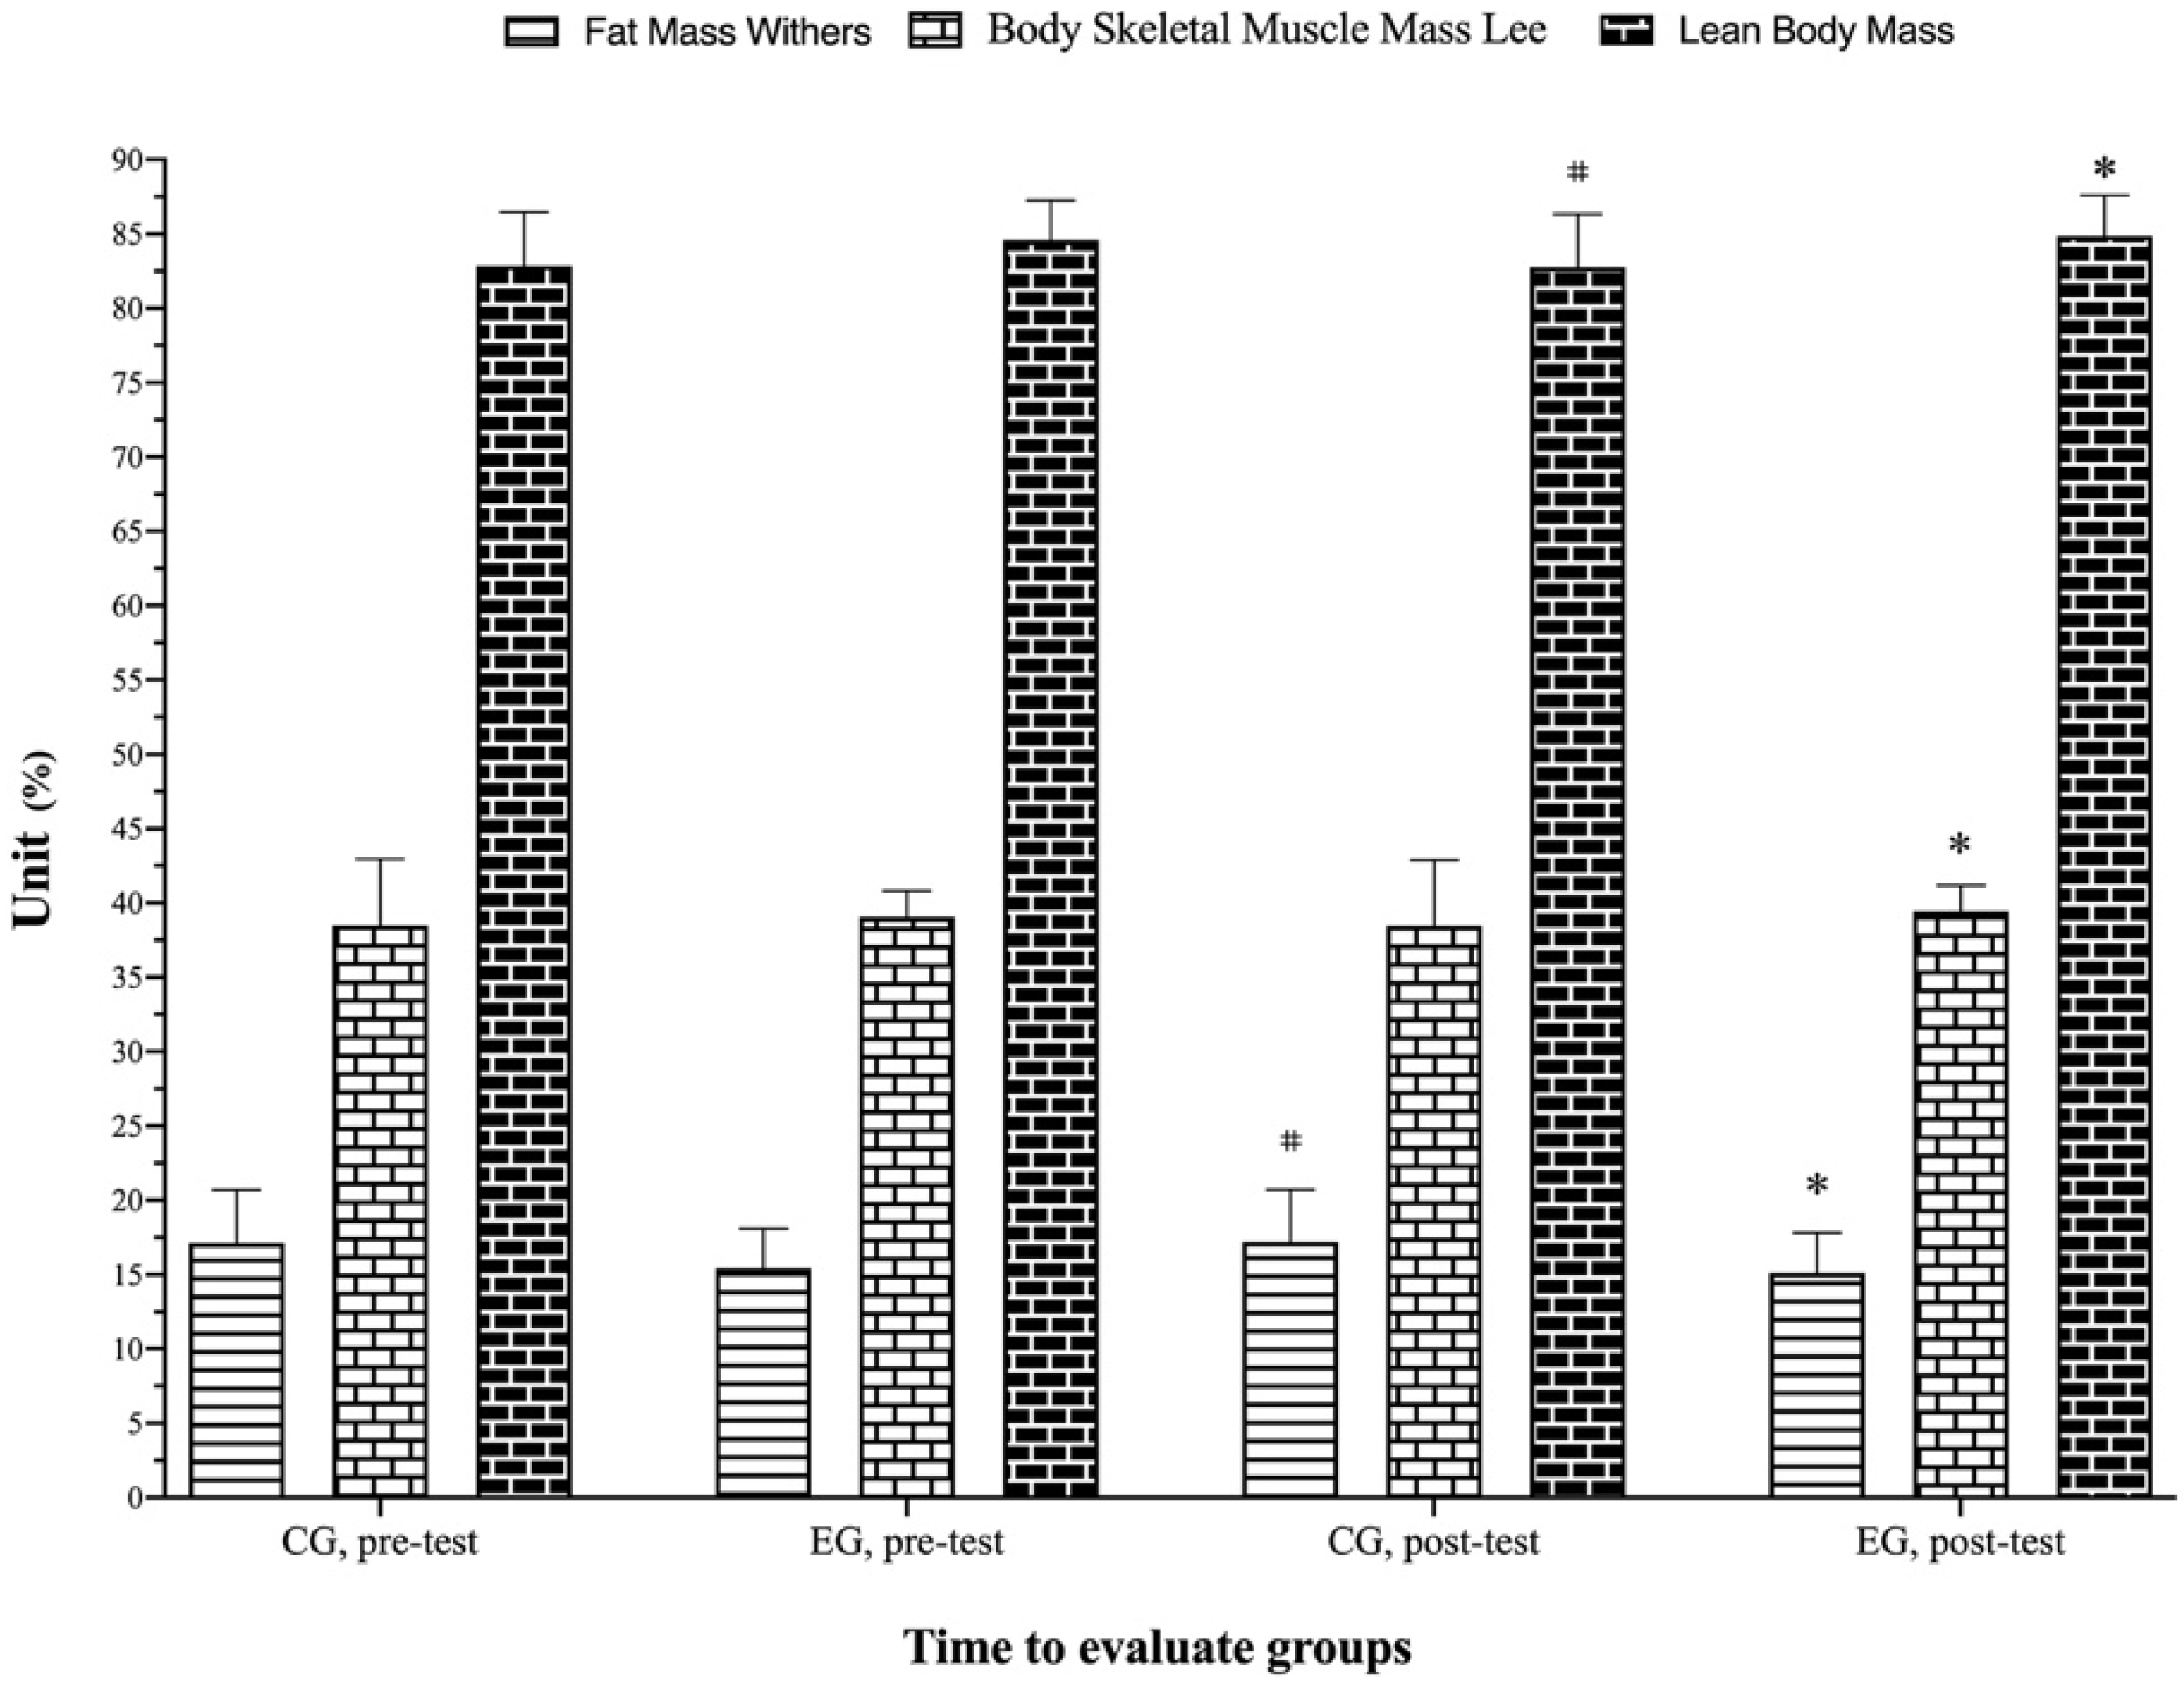
| Variable | Control Group (n = 22) | Experimental Group (n = 18) | ||||||||
|---|---|---|---|---|---|---|---|---|---|---|
| Pre-Test Mean ± SD | Post-Test Mean ± SD | Pre-Post (%) | p | ES (95% CI4) | Pre-Test Mean ± SD | Post-Test Mean ± SD | Pre-Post (%) | p | ES (95% CI) | |
| Body mass (kg) | 59.46 ± 6.22 | 59.49 ± 6.21 | 0.05 | 0.468 | 0.01 (−0.65; 0.65) T | 61.59 ± 4.44 | 61.37 ± 4.45 | −0.35 | ≤0.001 * | −0.04 (−0.70; 0.60) T |
| BMI (kg/m2) | 22.46 ± 2.54 | 22.47 ± 2.53 | 0.04 | 0.497 | 0.01 (−0.65; 0.66) T | 22.36 ± 1.85 | 22.28 ± 1.81 | −0.35 | ≤0.001 * | −0.04 (−0.69; 0,61) T |
| Fat mass Withers (%) | 17.13 ± 3.57 | 17.21 ± 3.53 | 0.52 | 0.029 * | 0.02 (−0.64; 0.68) T | 15.42 ± 2.68 | 15.12 ± 2.71 | −1.94 | ≤0.001 * | −0.10 (−0.75; 0.54) T |
| Body skeletal muscle mass Lee (%) | 38.50 ± 4.47 | 38.45 ± 4.43 | −0.10 | 0.309 | 0.01 (−0.66; 0.64) T | 39.03 ± 1.78 | 39.46 ±1.75 | 1.10 | ≤0.001 * | 0.23 (−0.42; 0,88) S |
| Lean body mass (%) | 82.87 ± 3.57 | 82.79 ± 3.53 | −0.10 | 0.029 * | −0.02 (−0,67; 0.63) T | 84.58 ± 2.68 | 85.88 ± 2.71 | 1.53 | <0.001 * | 0.45 (−0.20; 1,12) S |
Publisher’s Note: MDPI stays neutral with regard to jurisdictional claims in published maps and institutional affiliations. |
© 2022 by the authors. Licensee MDPI, Basel, Switzerland. This article is an open access article distributed under the terms and conditions of the Creative Commons Attribution (CC BY) license (https://creativecommons.org/licenses/by/4.0/).
Share and Cite
Roso-Moliner, A.; Mainer-Pardos, E.; Arjol-Serrano, J.L.; Cartón-Llorente, A.; Nobari, H.; Lozano, D. Evaluation of 10-Week Neuromuscular Training Program on Body Composition of Elite Female Soccer Players. Biology 2022, 11, 1062. https://0-doi-org.brum.beds.ac.uk/10.3390/biology11071062
Roso-Moliner A, Mainer-Pardos E, Arjol-Serrano JL, Cartón-Llorente A, Nobari H, Lozano D. Evaluation of 10-Week Neuromuscular Training Program on Body Composition of Elite Female Soccer Players. Biology. 2022; 11(7):1062. https://0-doi-org.brum.beds.ac.uk/10.3390/biology11071062
Chicago/Turabian StyleRoso-Moliner, Alberto, Elena Mainer-Pardos, José Luis Arjol-Serrano, Antonio Cartón-Llorente, Hadi Nobari, and Demetrio Lozano. 2022. "Evaluation of 10-Week Neuromuscular Training Program on Body Composition of Elite Female Soccer Players" Biology 11, no. 7: 1062. https://0-doi-org.brum.beds.ac.uk/10.3390/biology11071062