
A Metabolomic Approach and Traditional Physical Assessments to Compare U22 Soccer Players According to Their Competitive Level

 , , and
Abstract
:Simple Summary
Abstract
1. Introduction
2. Methods
2.1. Participants
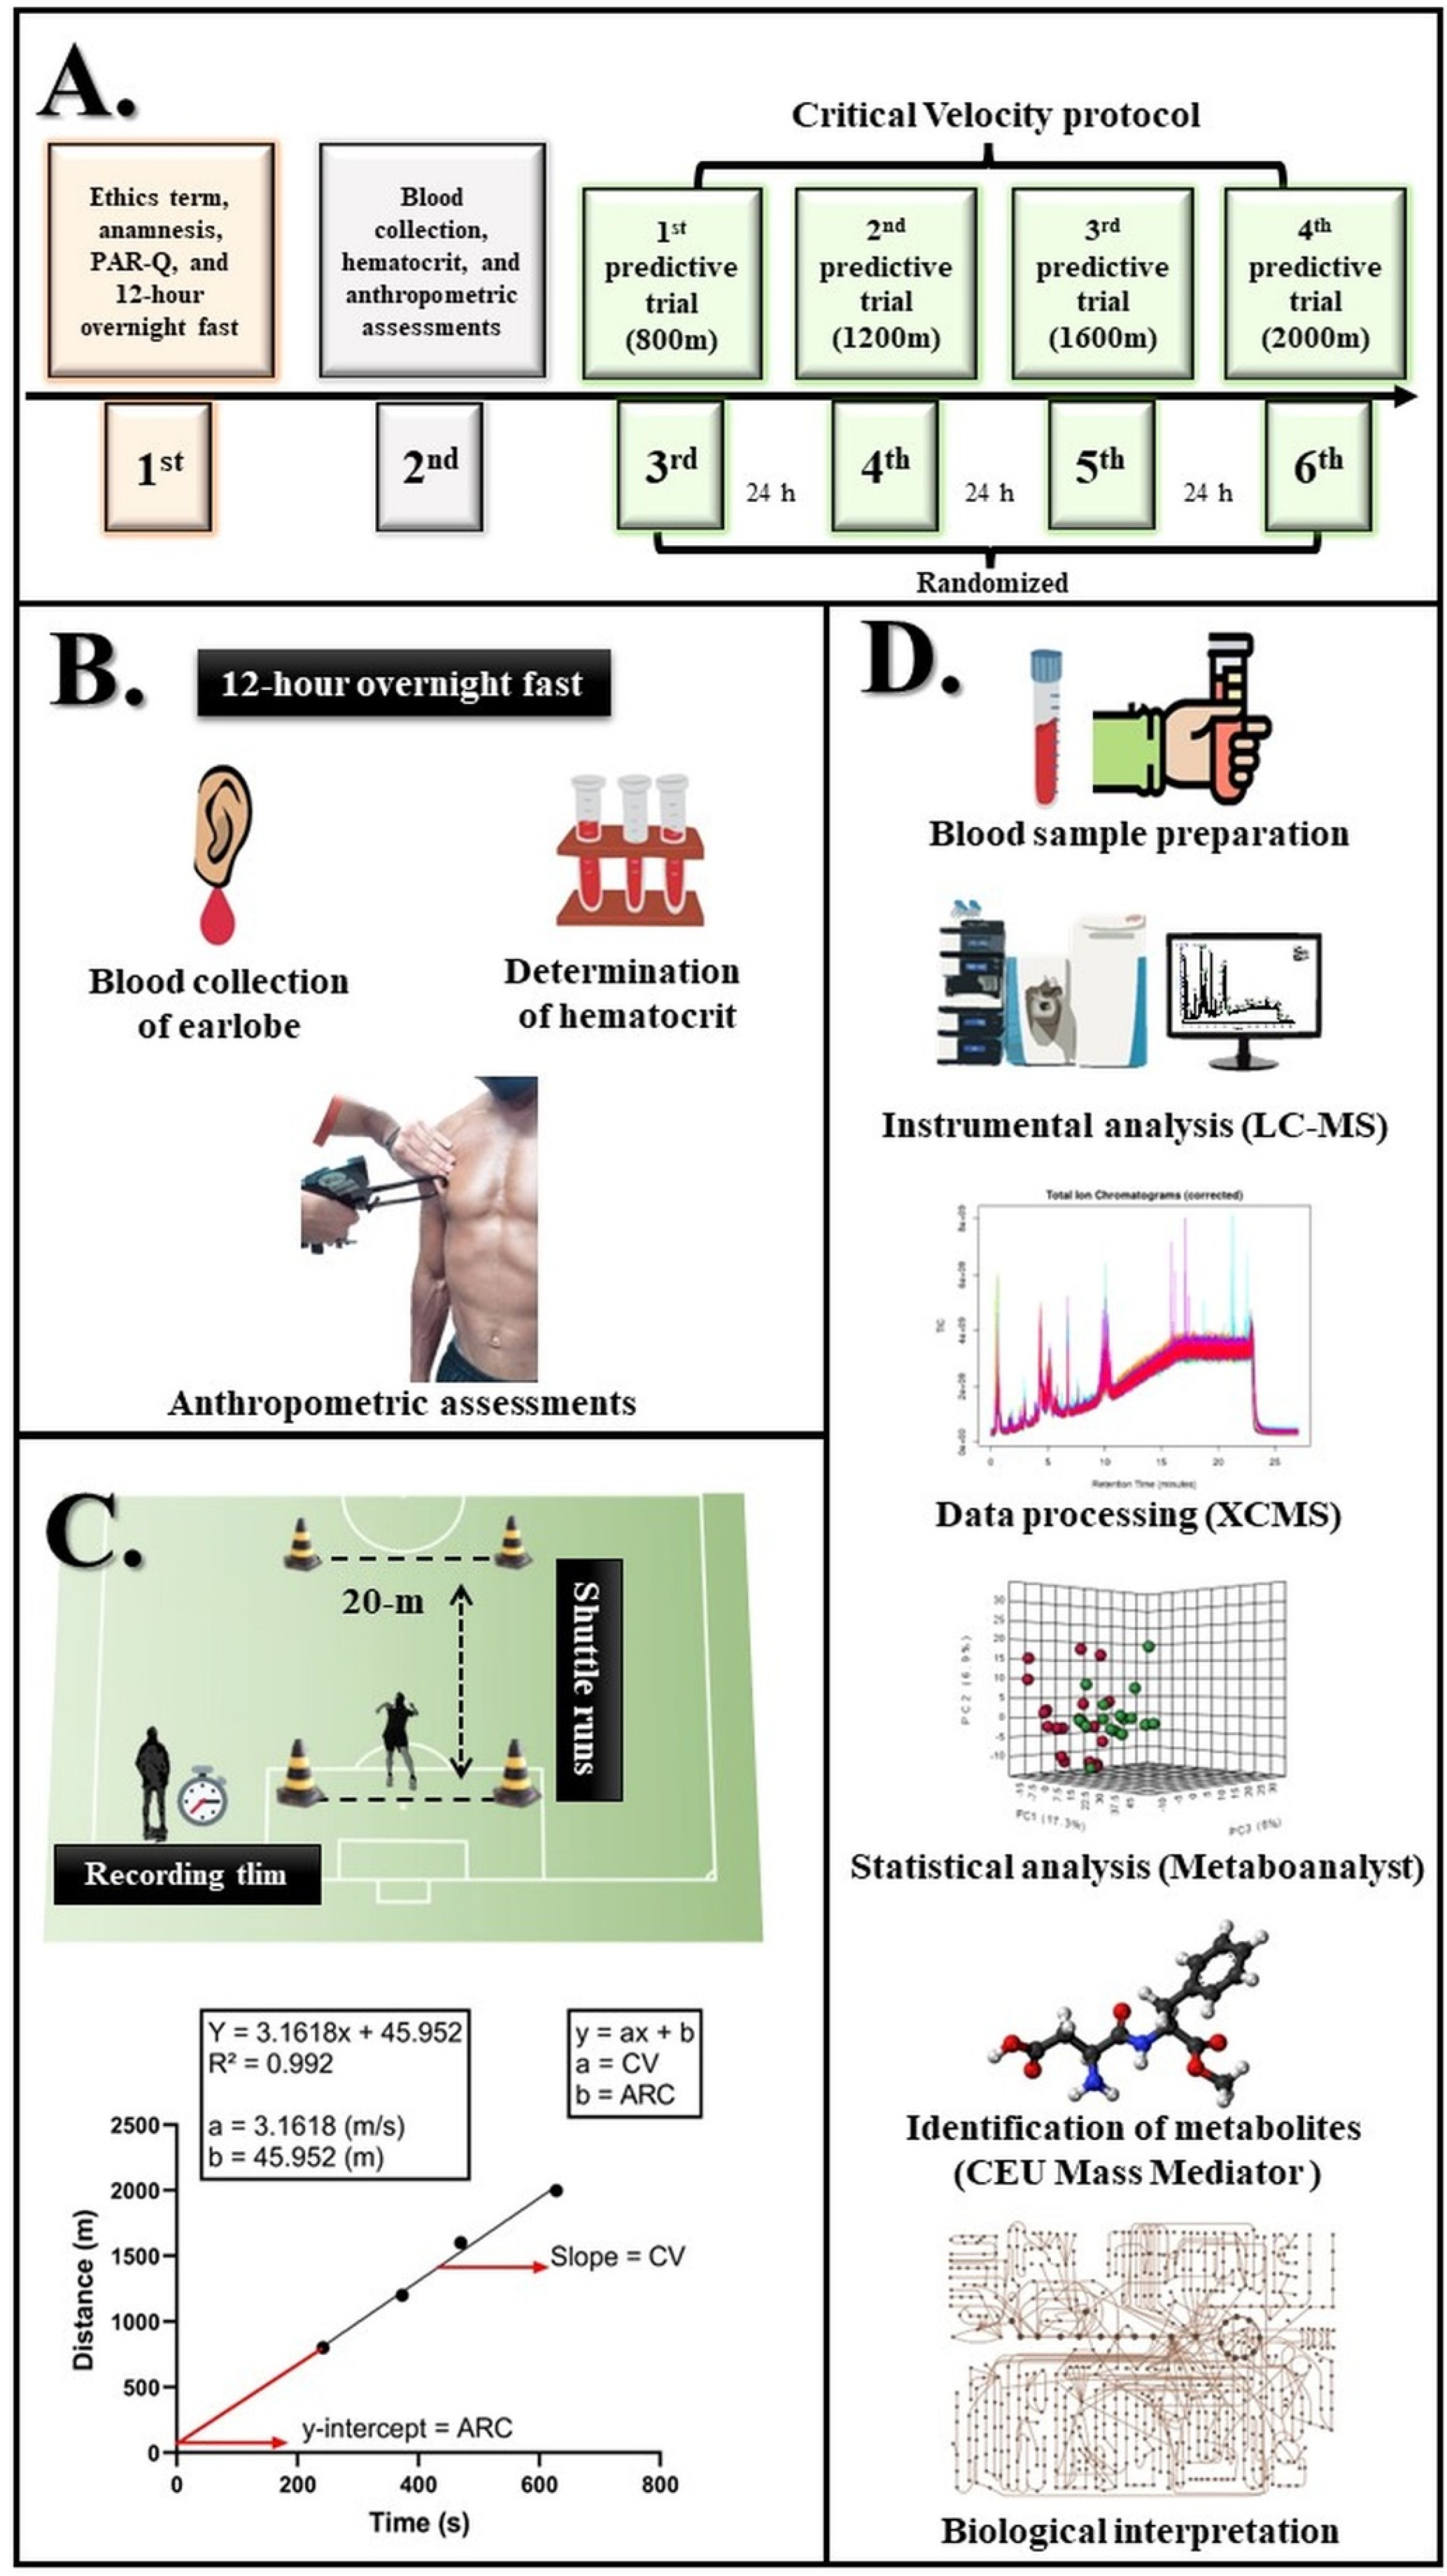
2.2. Design
2.3. Blood Collection
2.4. Anthropometric Assessments
2.5. Physical Fitness Level Assessment
2.6. Serum Samples Preparation for Metabolomics
2.7. LC-MS Data Acquisition and Metabolite Identification
2.8. Univariate and Multivariate Statistical Analysis
3. Results
3.1. Anthropometric, Body Composition, Aerobic and Anaerobic Characteristics
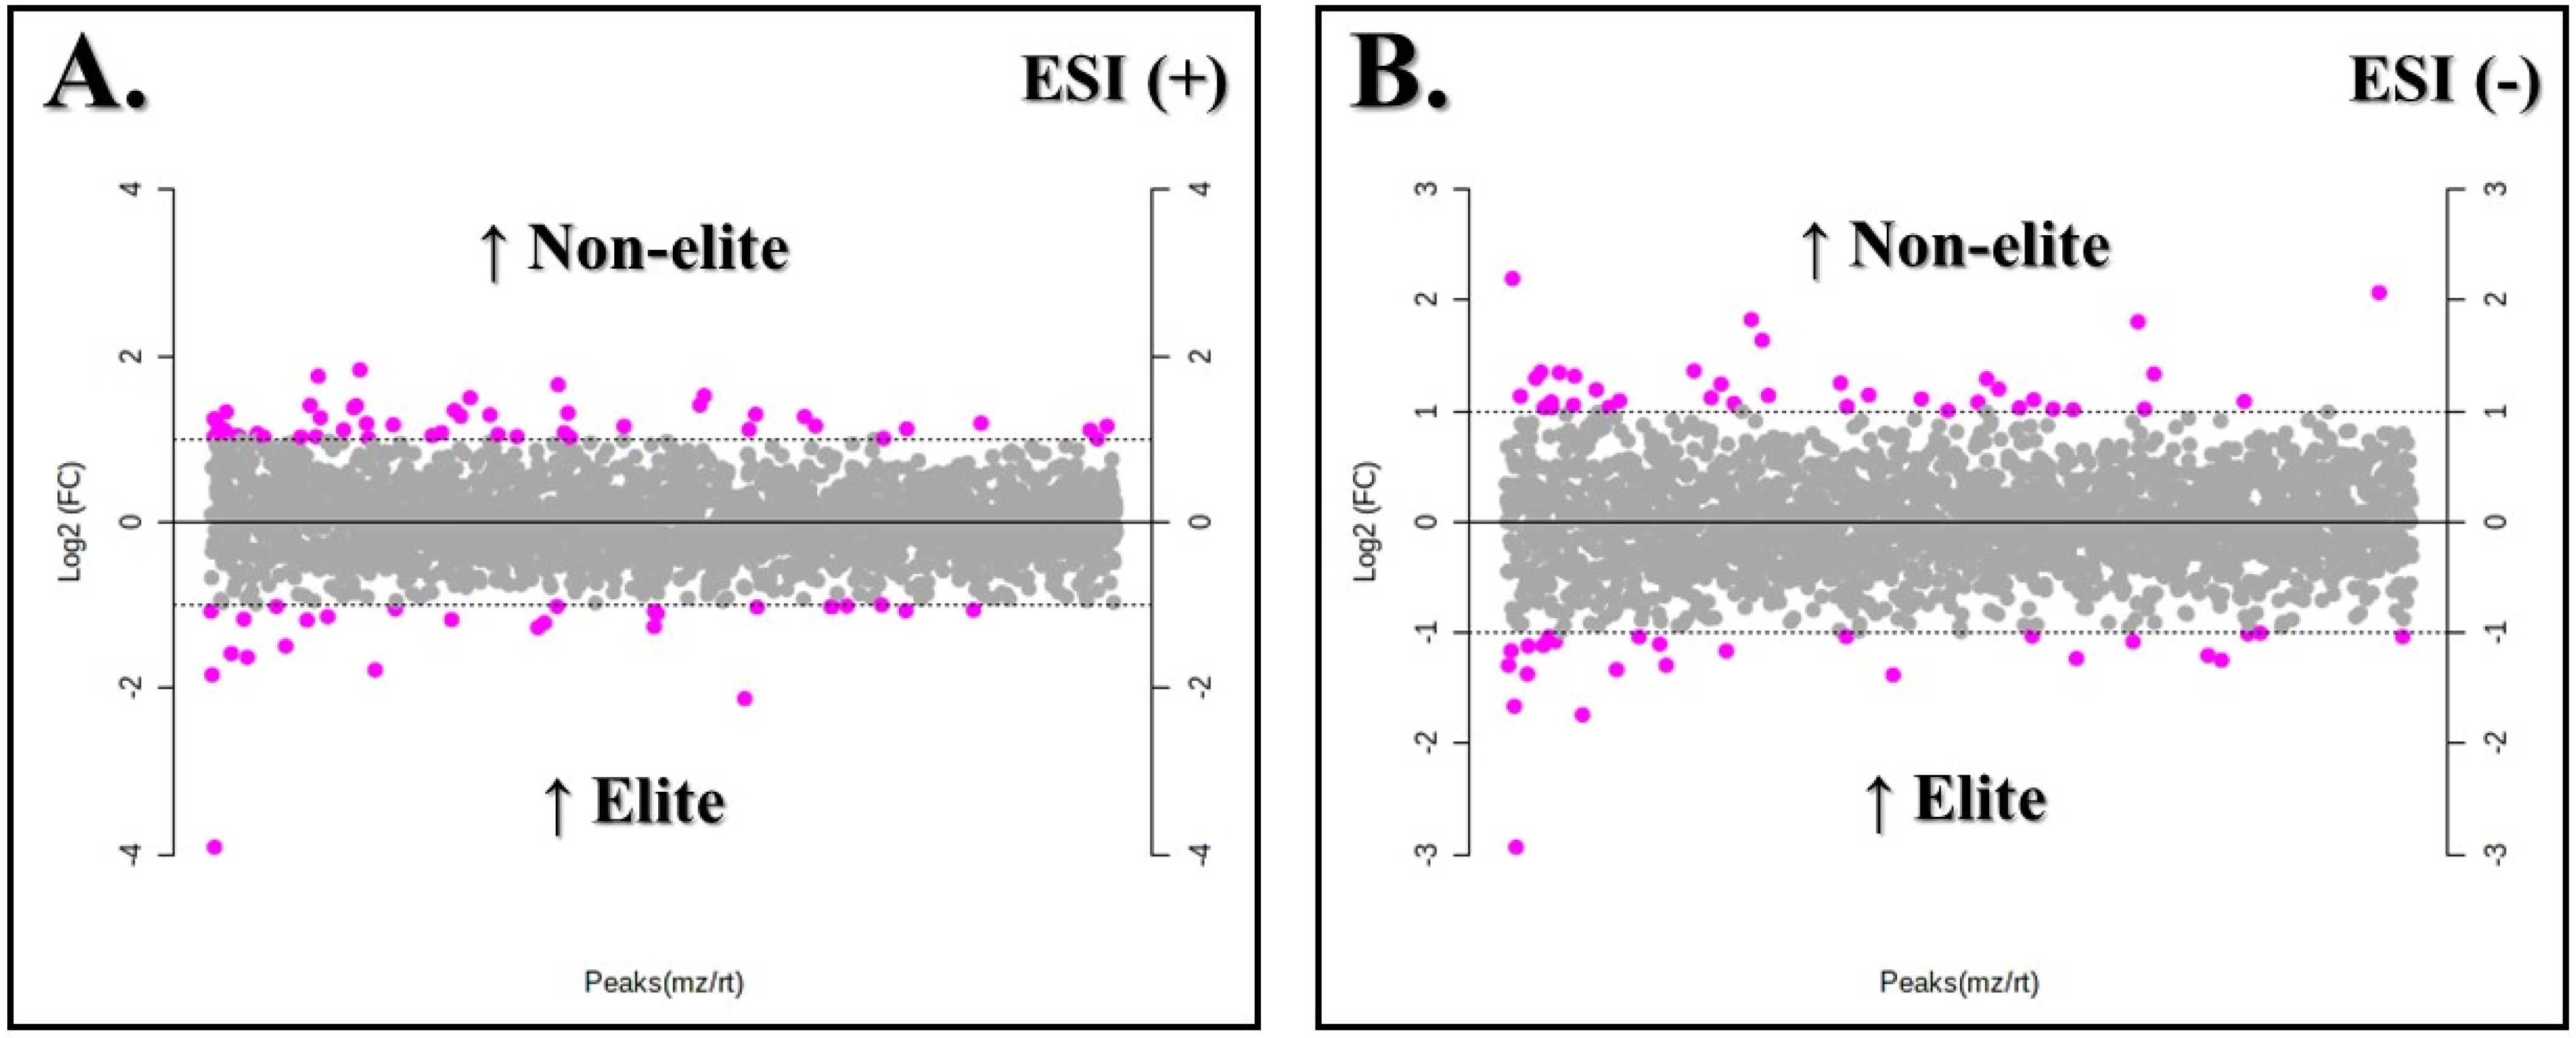
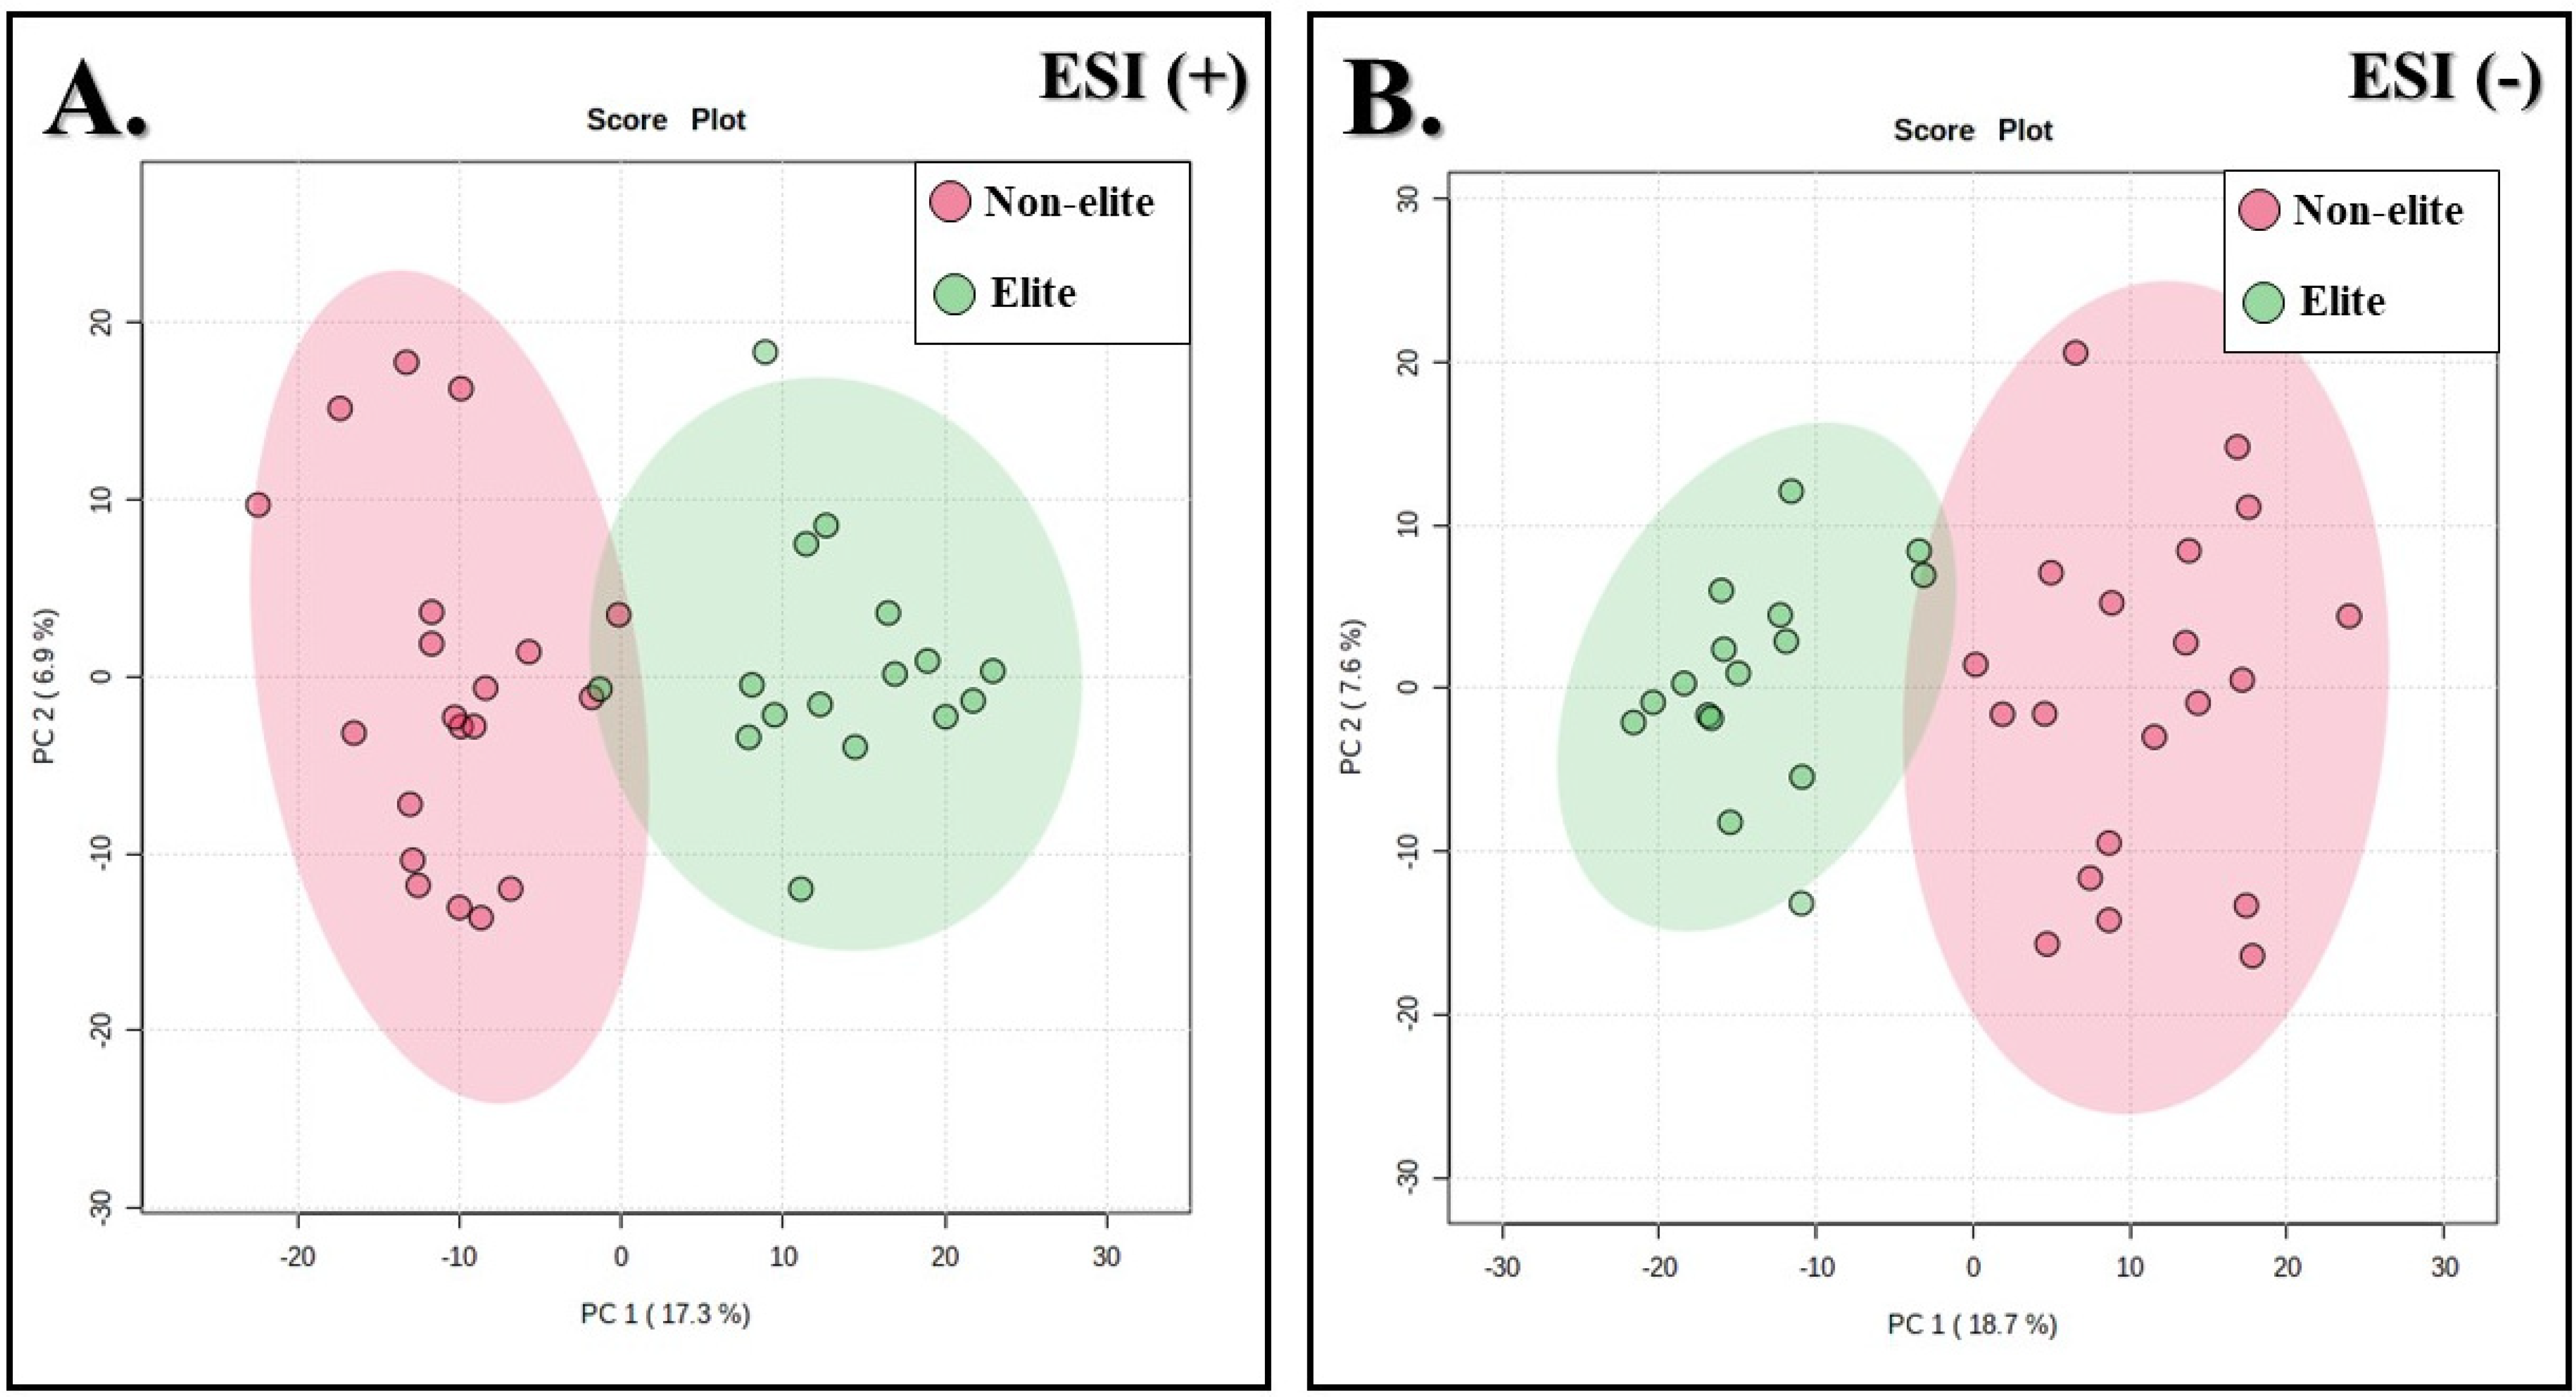
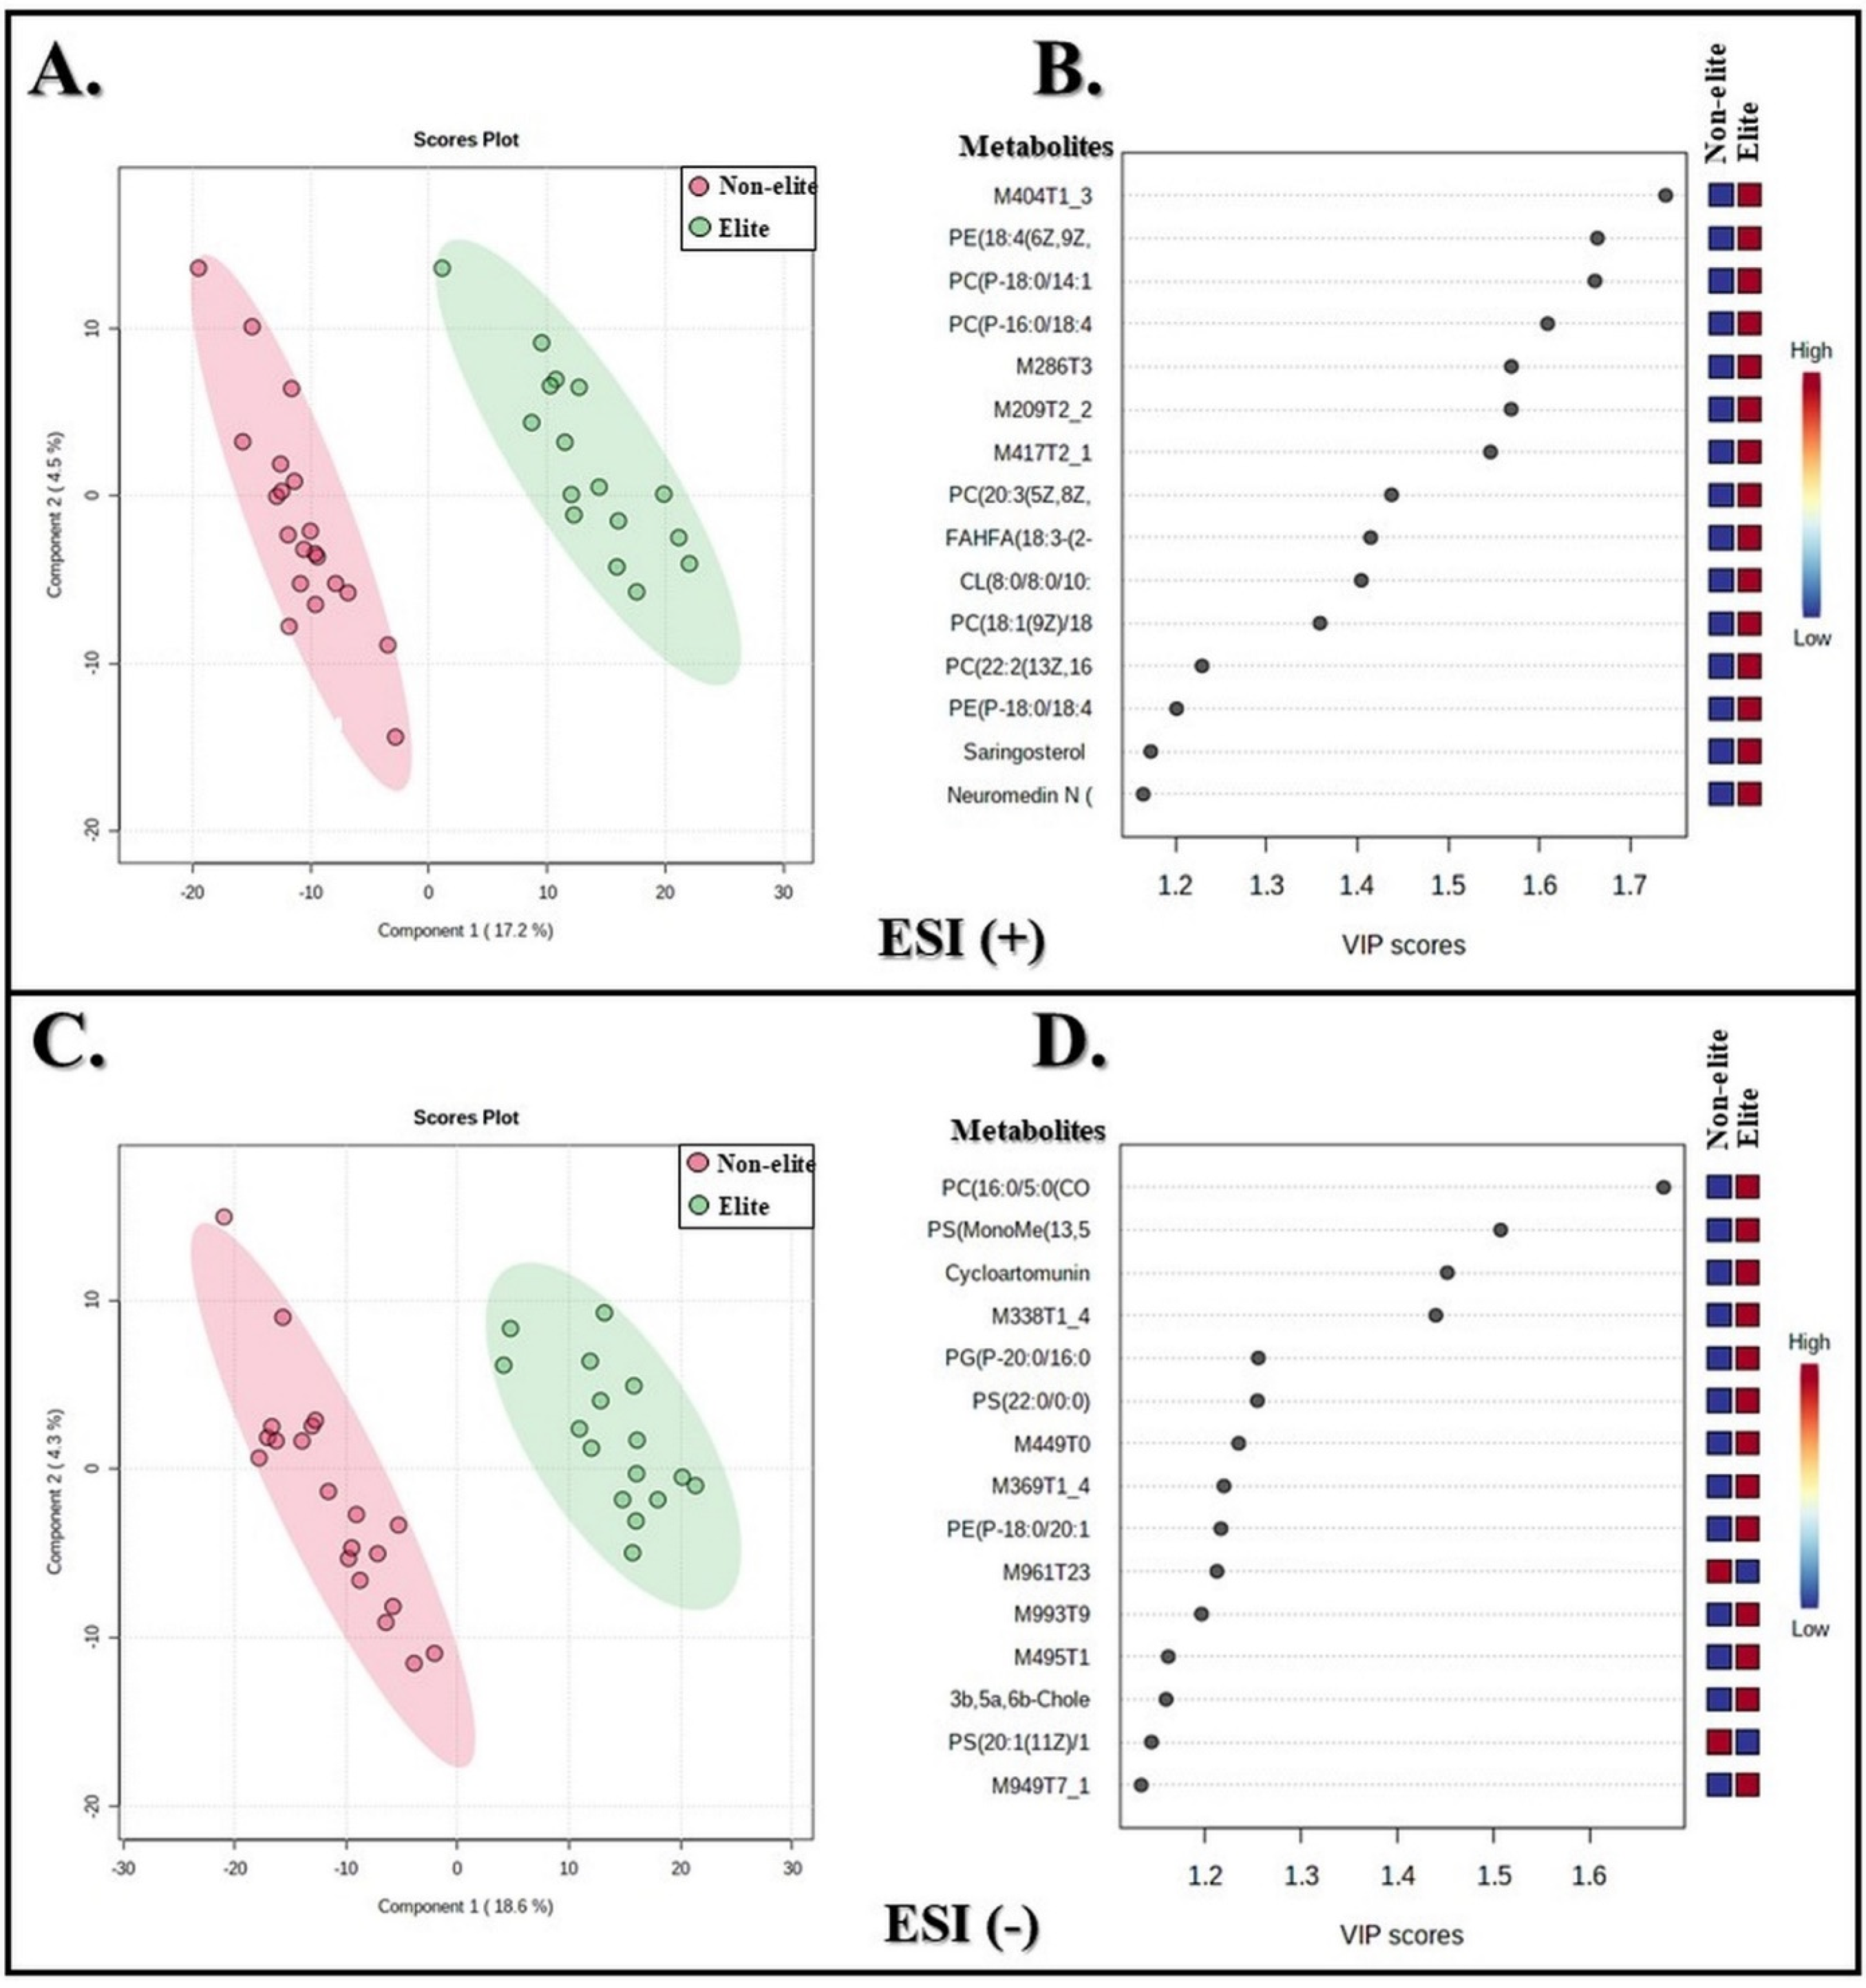
3.2. Metabolites with Differences between the Soccer Teams
3.3. Annotation of Metabolites
4. Discussion
5. Conclusions
Supplementary Materials
Author Contributions
Funding
Institutional Review Board Statement
Informed Consent Statement
Data Availability Statement
Acknowledgments
Conflicts of Interest
References
- Slimani, M.; Nikolaidis, P.T. Anthropometric and physiological characteristics of male Soccer players according to their competitive level, playing position and age group: A systematic review. Sports Med. Phys. Fit. 2017, 59, 141–163. [Google Scholar] [CrossRef] [PubMed]
- Reilly, T.; Bangsbo, J.; Franks, A. Anthropometric and physiological predispositions for elite soccer. J. Sports Sci. 2000, 18, 669–683. [Google Scholar] [CrossRef] [PubMed]
- Reilly, T.; Williams, A.M.; Nevill, A.; Franks, A. A multidisciplinary approach to talent identification in soccer. J. Sports Sci. 2000, 18, 695–702. [Google Scholar] [CrossRef]
- Silva, A.; Bonette, A.; Santhiago, V.; Gobatto, C. Effect of soccer training on the running speed and the blood lactate concentration at the lactate minimum test. Biol. Sport 2007, 24, 105–114. [Google Scholar]
- Loures, J.P.; Chamari, K.; Ferreira, E.C.; Campos, E.Z.; Zagatto, A.M.; Milioni, F.; Da Silva, A.S.; Papoti, M. Specific determination of maximal lactate steady state in soccer players. J. Strength Cond. Res. 2015, 29, 101–106. [Google Scholar] [CrossRef]
- Andrade, V.; Zagatto, A.; Kalva-Filho, C.; Mendes, O.; Gobatto, C.; Campos, E.; Papoti, M. Running-based anaerobic sprint test as a procedure to evaluate anaerobic power. Int. J. Sports Med. 2015, 36, 1156–1162. [Google Scholar] [CrossRef] [PubMed] [Green Version]
- Wakayoshi, K.; Ikuta, K.; Yoshida, T.; Udo, M.; Moritani, T.; Mutoh, Y.; Miyashita, M. Determination and validity of critical velocity as an index of swimming performance in the competitive swimmer. Eur. J. Appl. Physiol. Occup. Physiol. 1992, 64, 153–157. [Google Scholar] [CrossRef]
- Karsten, B.; Larumbe-Zabala, E.; Kandemir, G.; Hazir, T.; Klose, A.; Naclerio, F. The effects of a 6-week strength training on critical velocity, anaerobic running distance, 30-M sprint and Yo-Yo intermittent running test performances in male soccer players. PLoS ONE 2016, 11, e0151448. [Google Scholar] [CrossRef]
- Djaoui, L.; Haddad, M.; Chamari, K.; Dellal, A. Monitoring training load and fatigue in soccer players with physiological markers. Physiol. Behav. 2017, 181, 86–94. [Google Scholar] [CrossRef]
- Meyer, T.; Meister, S. Routine blood parameters in elite soccer players. Int. J. Sports Med. 2011, 32, 875–881. [Google Scholar] [CrossRef]
- Hoang, G.; Udupa, S.; Le, A. Application of metabolomics technologies toward cancer prognosis and therapy. In International Review of Cell and Molecular Biology; Elsevier: Amsterdam, The Netherlands, 2019; Volume 347, pp. 191–223. [Google Scholar]
- Klassen, A.; Faccio, A.T.; Canuto, G.A.B.; Cruz, P.L.R.d.; Ribeiro, H.C.; Tavares, M.F.M.; Sussulini, A. Metabolomics: Definitions and significance in systems biology. Metab. Fundam. Clin. Appl. 2017, 965, 3–17. [Google Scholar]
- Zhang, A.; Sun, H.; Wang, P.; Han, Y.; Wang, X. Recent and potential developments of biofluid analyses in metabolomics. J. Proteom. 2012, 75, 1079–1088. [Google Scholar] [CrossRef] [PubMed]
- Heaney, L.M.; Deighton, K.; Suzuki, T. Non-targeted metabolomics in sport and exercise science. J. Sports Sci. 2019, 37, 959–967. [Google Scholar] [CrossRef]
- Al-Khelaifi, F.; Diboun, I.; Donati, F.; Botrè, F.; Alsayrafi, M.; Georgakopoulos, C.; Yousri, N.A.; Suhre, K.; Elrayess, M.A. Metabolomics profiling of xenobiotics in elite athletes: Relevance to supplement consumption. J. Int. Soc. Sports Nutr. 2018, 15, 48. [Google Scholar] [CrossRef] [PubMed] [Green Version]
- Ra, S.-G.; Maeda, S.; Higashino, R.; Imai, T.; Miyakawa, S. Metabolomics of salivary fatigue markers in soccer players after consecutive games. Appl. Physiol. Nutr. Metab. 2014, 39, 1120–1126. [Google Scholar] [CrossRef] [PubMed]
- Prado, E.; Souza, G.H.; Pegurier, M.; Vieira, C.; Lima-Neto, A.B.M.; Assis, M.; Guedes, M.I.F.; Koblitz, M.G.B.; Ferreira, M.S.L.; Macedo, A.F. Non-targeted sportomics analyses by mass spectrometry to understand exercise-induced metabolic stress in soccer players. Int. J. Mass Spectrom. 2017, 418, 1–5. [Google Scholar] [CrossRef]
- Pitti, E.; Petrella, G.; Di Marino, S.; Summa, V.; Perrone, M.; D’Ottavio, S.; Bernardini, A.; Cicero, D.O. Salivary metabolome and soccer match: Challenges for understanding exercise induced changes. Metabolites 2019, 9, 141. [Google Scholar] [CrossRef] [Green Version]
- Zhao, J.; Wang, Y.; Zhao, D.; Zhang, L.; Chen, P.; Xu, X. Integration of metabolomics and proteomics to reveal the metabolic characteristics of high-intensity interval training. Analyst 2020, 145, 6500–6510. [Google Scholar] [CrossRef]
- Marinho, A.H.; Sousa, F.A.d.B.; Vilela, R.d.A.M.P.; Balikian, P.; de Souza Bento, E.; de Mendonça Aquino, T.; Crispim, A.; Ataide-Silva, T.; de Araujo, G.G. The rating of perceived exertion is able to differentiate the post-matches metabolomic profile of elite U-20 soccer players. Eur. J. Appl. Physiol. Occup. Physiol. 2022, 122, 371–382. [Google Scholar] [CrossRef]
- Cicero, D.; Di Marino, S.; Dinallo, V.; Pieri, M.; Summa, V.; Desideri, A.; Bernardini, A.; Perondi, F.; D’Ottavio, S. A small sided game session affects salivary metabolite levels in young soccer players. Biomed. Spectrosc. Imaging 2016, 5, 55–70. [Google Scholar] [CrossRef]
- Pintus, R.; Bongiovanni, T.; Corbu, S.; Francavilla, V.C.; Dessí, A.; Noto, A.; Corsello, G.; Finco, G.; Fanos, V.; Marincola, F.C. Sportomics in professional soccer players: Metabolomics results during preseason. J. Sports Med. Phys. Fit. 2020, 61, 324–330. [Google Scholar] [CrossRef]
- Quintas, G.; Reche, X.; Sanjuan-Herráez, J.D.; Martínez, H.; Herrero, M.; Valle, X.; Masa, M.; Rodas, G. Urine metabolomic analysis for monitoring internal load in professional football players. Metabolomics 2020, 16, 45. [Google Scholar] [CrossRef] [PubMed]
- Cao, B.; Liu, S.; Yang, L.; Chi, A. Changes of differential urinary metabolites after high-intensive training in teenage football players. BioMed Res. Int. 2020, 2020, 2073803. [Google Scholar] [CrossRef] [PubMed] [Green Version]
- Santone, C.; Dinallo, V.; Paci, M.; D’Ottavio, S.; Barbato, G.; Bernardini, S. Saliva metabolomics by NMR for the evaluation of sport performance. J. Pharm. Biomed. Anal. 2014, 88, 441–446. [Google Scholar] [CrossRef] [PubMed]
- Thomas, S.; Reading, J.; Shephard, R.J. Revision of the physical activity readiness questionnaire (PAR-Q). J Can. J. Sport Sci. 1992, 17, 338–345. [Google Scholar] [PubMed]
- Ferreira, F.G.; Alves, K.; Costa, N.M.B.; Santana, Â.M.C.; Marins, J.C.B. Efeito do nível de condicionamento físico e da hidratação oral sobre a homeostase hídrica em exercício aeróbico. Rev. Bras. De Med. Do Esporte 2010, 16, 166–170. [Google Scholar] [CrossRef] [Green Version]
- Stewart, A.; Marfell-Jones, M.; Olds, T. ISAK. International Standards for Anthropometric Assessment; ISAK Manual: Lower Hutt, New Zealand, 2011. [Google Scholar]
- Heath, B.H.; Carter, J.L. A modified somatotype method. J. Am. J. Phys. Anthropol. 1967, 27, 57–74. [Google Scholar] [CrossRef]
- Faulkner, J.A. Physiology of swimming. Res. Q. Am. Assoc. Health Phys. Educ. Recreat. 1966, 37, 41–54. [Google Scholar] [CrossRef]
- Matyash, V.; Liebisch, G.; Kurzchalia, T.V.; Shevchenko, A.; Schwudke, D. Lipid extraction by methyl-tert-butyl ether for high-throughput lipidomics. J. Lipid Res. 2008, 49, 1137–1146. [Google Scholar] [CrossRef] [Green Version]
- Cajka, T.; Fiehn, O. Increasing lipidomic coverage by selecting optimal mobile-phase modifiers in LC–MS of blood plasma. Metabolomics 2016, 12, 34. [Google Scholar] [CrossRef]
- Smith, C.A.; Want, E.J.; O’Maille, G.; Abagyan, R.; Siuzdak, G. XCMS: Processing mass spectrometry data for metabolite profiling using nonlinear peak alignment, matching, and identification. Anal. Chem. 2006, 78, 779–787. [Google Scholar] [CrossRef]
- Blaženović, I.; Kind, T.; Ji, J.; Fiehn, O. Software tools and approaches for compound identification of LC-MS/MS data in metabolomics. Metabolites 2018, 8, 31. [Google Scholar] [CrossRef] [Green Version]
- Gil-de-la-Fuente, A.; Godzien, J.; Saugar, S.; Garcia-Carmona, R.; Badran, H.; Wishart, D.S.; Barbas, C.; Otero, A. CEU mass mediator 3.0: A metabolite annotation tool. J. Proteome Res. 2018, 18, 797–802. [Google Scholar] [CrossRef]
- Cohen, J. The earth is round (p < 0.05). Am. Psychol. 1994, 49, 997. [Google Scholar]
- Pang, Z.; Chong, J.; Zhou, G.; de Lima Morais, D.A.; Chang, L.; Barrette, M.; Gauthier, C.; Jacques, P.-É.; Li, S.; Xia, J. MetaboAnalyst 5.0: Narrowing the gap between raw spectra and functional insights. Nucleic Acids Res. 2021, 49, W388–W396. [Google Scholar] [CrossRef]
- Stølen, T.; Chamari, K.; Castagna, C.; Wisløff, U. Physiology of soccer. Sports Med. 2005, 35, 501–536. [Google Scholar] [CrossRef]
- Rienzi, E.; Drust, B.; Reilly, T.; Carter, J.E.L.; Martin, A. Investigation of anthropometric and work-rate profiles of elite South American international soccer players. J. Sports Med. 2000, 40, 162. [Google Scholar]
- Ribeiro, R.; Dias, D.; Claudino, J.; Gonçalves, R. Analysis of the somatotype and physical conditioning between soccer player under-20. Mot. Rer. Educ. Fis. 2007, 13, 280–287. [Google Scholar]
- Perroni, F.; Vetrano, M.; Camolese, G.; Guidetti, L.; Baldari, C. Anthropometric and somatotype characteristics of young soccer players: Differences among categories, subcategories, and playing position. J. Strength Cond. Res. 2015, 29, 2097–2104. [Google Scholar] [CrossRef]
- Ostojic, S.M. Characteristics of elite and non-elite Yugoslav soccer players: Correlates of success. J. Sports Sci. Med. 2003, 2, 34–35. [Google Scholar]
- Arnason, A.; Sigurdsson, S.B.; Gudmundsson, A.; Holme, I.; Engebretsen, L.; Bahr, R. Physical fitness, injuries, and team performance in soccer. Med. Sci. Sports Exerc. 2004, 36, 278–285. [Google Scholar] [CrossRef]
- Silva, A.; Santhiago, V.; Papoti, M.; Gobatto, C. Hematological parameters and anaerobic threshold in Brazilian soccer players throughout a training program. Int. J. Lab. Hematol. 2008, 30, 158–166. [Google Scholar] [CrossRef]
- Ostojic, S.M. Elite and nonelite soccer players: Preseasonal physical and physiological characteristics. Res. Sports Med. 2004, 12, 143–150. [Google Scholar] [CrossRef]
- Clark, I.E.; West, B.M.; Reynolds, S.K.; Murray, S.R.; Pettitt, R.W. Applying the critical velocity model for an off-season interval training program. J. Strength Cond. Res. 2013, 27, 3335–3341. [Google Scholar] [CrossRef]
- Fairman, C.M.; Kendall, K.L.; Hyde, P.N.; Yarbrough, M.B.; Rossi, S.; Sherman, M.; Fukuda, D. Estimating and Tracking Changes in VO2max From a Field-Based Critical Velocity Test in Collegiate Soccer Players. J. Sport Hum. Perform. 2015, 47, 964. [Google Scholar] [CrossRef]
- Knab, A.M.; Nieman, D.C.; Gillitt, N.D.; Shanely, R.A.; Cialdella-Kam, L.; Henson, D.A.; Sha, W. Effects of a flavonoid-rich juice on inflammation, oxidative stress, and immunity in elite swimmers: A metabolomics-based approach. Int. J. Sport Nutr. Exerc. Metab. 2013, 23, 150–160. [Google Scholar] [CrossRef]
- Nieman, D.; Stear, S.; Castell, L.; Burke, L. A–Z of nutritional supplements: Dietary supplements, sports nutrition foods and ergogenic aids for health and performance: Part 15. Br. J. Sports Med. 2010, 44, 1202–1205. [Google Scholar] [CrossRef] [Green Version]
- Castro-Gómez, P.; Garcia-Serrano, A.; Visioli, F.; Fontecha, J. Relevance of dietary glycerophospholipids and sphingolipids to human health. Prostaglandins Leukot. Essent. Fat. Acids 2015, 101, 41–51. [Google Scholar] [CrossRef]
- Kingsley, M.I.; Miller, M.; Kilduff, L.P.; McENENY, J.; Benton, D. Effects of phosphatidylserine on exercise capacity during cycling in active males. Med. Sci. Sports Exerc. 2006, 38, 64. [Google Scholar] [CrossRef]
- Starks, M.A.; Starks, S.L.; Kingsley, M.; Purpura, M.; Jäger, R. The effects of phosphatidylserine on endocrine response to moderate intensity exercise. J. Int. Soc. Sports Nutr. 2008, 5, 11. [Google Scholar] [CrossRef] [Green Version]
- Carter, J.; Greenwood, M. Phosphatidylserine for the Athlete. Strength Cond. J. 2015, 37, 61–68. [Google Scholar] [CrossRef]
- Bye, A.; Vettukattil, R.; Aspenes, S.T.; Giskeødegård, G.F.; Gribbestad, I.S.; Wisløff, U.; Bathen, T.F. Serum levels of choline-containing compounds are associated with aerobic fitness level: The HUNT-study. PLoS ONE 2012, 7, e42330. [Google Scholar] [CrossRef] [PubMed] [Green Version]
- Morris, C.; O’Grada, C.M.; Ryan, M.F.; Gibney, M.J.; Roche, H.M.; Gibney, E.R.; Brennan, L. Modulation of the lipidomic profile due to a lipid challenge and fitness level: A postprandial study. Lipids Health Dis. 2015, 14, 65. [Google Scholar] [CrossRef] [Green Version]
- Steenbergen, R.; Nanowski, T.S.; Beigneux, A.; Kulinski, A.; Young, S.G.; Vance, J.E. Disruption of the phosphatidylserine decarboxylase gene in mice causes embryonic lethality and mitochondrial defects. J. Biol. Chem. 2005, 280, 40032–40040. [Google Scholar] [CrossRef] [Green Version]
- Hailey, D.W.; Rambold, A.S.; Satpute-Krishnan, P.; Mitra, K.; Sougrat, R.; Kim, P.K.; Lippincott-Schwartz, J. Mitochondria supply membranes for autophagosome biogenesis during starvation. Cell 2010, 141, 656–667. [Google Scholar] [CrossRef] [Green Version]
- Vance, J.E.; Tasseva, G. Formation and function of phosphatidylserine and phosphatidylethanolamine in mammalian cells. Biochim. Et Biophys. Acta -Mol. Cell Biol. Lipids 2013, 1831, 543–554. [Google Scholar] [CrossRef]
- Houtkooper, R.; Vaz, F. Cardiolipin, the heart of mitochondrial metabolism. Cell. Mol. Life Sci. 2008, 65, 2493–2506. [Google Scholar] [CrossRef]
- Castro, A.; Duft, R.G.; Silva, L.M.; Ferreira, M.L.; Andrade, A.L.; Bernardes, C.F.; Cavaglieri, C.R.; Chacon-Mikahil, M.P. Understanding the relationship between intrinsic cardiorespiratory fitness and serum and skeletal muscle metabolomics profile. J. Proteome Res. 2021, 20, 2397–2409. [Google Scholar] [CrossRef]
- Catala, A.; Culp-Hill, R.; Nemkov, T.; D’Alessandro, A.J.M. Quantitative metabolomics comparison of traditional blood draws and TAP capillary blood collection. Metabolites 2018, 14, 100. [Google Scholar] [CrossRef]
- Wang, X.; Sun, H.; Zhang, A.; Wang, P.; Han, Y. Ultra-performance liquid chromatography coupled to mass spectrometry as a sensitive and powerful technology for metabolomic studies. J. Sep. Sci. 2011, 34, 3451–3459. [Google Scholar] [CrossRef]
- Hoffman, N.J. Omics and exercise: Global approaches for mapping exercise biological networks. Cold Spring Harb. Perspect. Med. 2017, 7, a029884. [Google Scholar] [CrossRef] [PubMed]


| Statistical Analysis | ||||
|---|---|---|---|---|
| Non-Elite (n = 20) Mean ± SD (CI) | Elite (n = 16) Mean ± SD (CI) | Comparison | ES | |
| Height (cm) | 174.4 ± 7.0 (5.1–10.8) | 176.5 ± 7.0 (5.3–10.2) | t = −0.95 p = 0.348 | 0.30 |
| BMI (kg/m2) | 22.1 ± 2.4 (1.7–3.7) | 21.9 ± 2.3 (1.7–3.3) | t = 0.16 p = 0.870 | 0.09 |
| Body mass (kg) | 67.1 ± 8.8 (6.5–13.6) | 68.5 ± 10.1 (7.6–14.7) | t = −0.45 p = 0.654 | 0.15 |
| Lean body mass (kg) | 59.3 ± 7.1 (5.2–10.9) | 61.1 ± 7.9 (6.0–11.5) | t = −0.74 p = 0.462 | 0.24 |
| Body fat (kg) | 7.8 ± 2.4 (1.7–3.7) | 7.3 ± 2.4 (1.8–3.5) | t = 0.53 p = 0.597 | 0.21 |
| BF (%) | 11.4 ± 2.4 (1.7–3.7) | 10.5 ± 1.7 (1.2–2.4) | t = 1.28 p = 0.207 | 0.44 |
| Hematocrit (%) | 50.2 ± 4.0 (2.9–6.1) | 51.0 ± 4.0 (3.0–5.8) | t = −0.58 p = 0.563 | 0.20 |
| Statistical Analysis | ||||
|---|---|---|---|---|
| Non-Elite (n = 20) Mean ± SD (CI) | Elite (n = 16) Mean ± SD (CI) | Comparison | ES | |
| 1st predictive trial (s) | 232.0 ± 15.0 (11.1–23.2) | 232.0 ± 16.0 (12.1–23.3) | t = 0.08 p = 0.933 | 0.01 |
| 2nd predictive trial (s) | 371.0 ± 26.0 (19.2–40.2) | 366.0 ± 26.0 (19.7–37.9) | t = 0.50 p = 0.616 | 0.19 |
| 3rd predictive trial (s) | 495.0 ± 33.0 (24.3–51.1) | 497.0 ± 20.0 (15.2–29.2) | t = −0.20 p = 0.841 | 0.08 |
| 4th predictive trial (s) | 627.0 ± 56.0 (41.3–86.6) | 656.0 ± 43.0 (32.7–62.8) | t = −1.69 p = 0.099 | 0.59 |
| CV (m/s) | 3.1 ± 0.4 (0.3–0.6) | 3.0 ± 0.2 (0.1–0.3) | t = 1.98 p = 0.06 | 0.33 |
| ARC (m) | 129.6 ± 55.7 (41.1–86.21) | 161.5 ± 61.0 (46.3–89.1) | t = −1.63 p = 0.110 | 0.55 |
| R2 | 0.98 ± 0.02 (0.01–0.03) | 0.99 ± 0.01 (0.01–0.02) | t = −0.57 p = 0.569 | 0.67 |
| Feature | m/z | RT (min) | Putative Metabolite | Mode | Chemical Formula | Error ppm | VIP Score |
|---|---|---|---|---|---|---|---|
| Glycerophospholipids | |||||||
| Phosphatidylserines | |||||||
| M889T7 | 888.53 | 6.75 | PS(MonoMe(13,5)/DiMe(9,5)) | − | C49H82NO12P | 5 | 1.50 |
| M580T1_3 | 580.36 | 1.42 | PS(22:0/0:0) | − | C28H56NO9P | 2 | 1.25 |
| M789T6_2 | 788.54 | 5.83 | PS(20:1(11Z)/16:0) | − | C42H80NO10P | 2 | 1.14 |
| Glycerophosphoglycerols | |||||||
| M798T6 | 797.55 | 6.10 | PG(P-20:0/16:0) | − | C42H83O9P | 7 | 1.25 |
| Phosphatidylethanolamines | |||||||
| M740T4 | 739.54 | 3.76 | PE(18:4(6Z,9Z,12Z,15Z)/P-18:1(11Z)) | + | C41H72NO7P | 10 | 1.66 |
| M803T7_1 | 802.59 | 6.98 | PE(P-18:0/20:1(11Z)) | − | C43H84NO7P | 6 | 1.21 |
| M747T4_1 | 746.51 | 3.62 | PE(P-18:0/18:4(6Z,9Z,12Z,15Z)) | + | C41H74NO7P | 2 | 1.20 |
| Phosphatidylcholines | |||||||
| M608T1_3 | 608.35 | 0.91 | PC(16:0/5:0(COOH)) | − | C29H56NO10P | 3 | 1.67 |
| M755T3 | 754.52 | 2.81 | PC(P-18:0/14:1(9Z)) | + | C40H78NO7P | 10 | 1.66 |
| M721T2 | 720.53 | 2.34 | PC(P-16:0/18:4(6Z,9Z,12Z,15Z)) | + | C42H76NO7P | 1 | 1.61 |
| M856T7_1 | 855.66 | 6.55 | PC(20:3(5Z,8Z,11Z)/20:1(11Z)) | + | C48H88NO8P | 2 | 1.43 |
| M787T9 | 786.60 | 9.04 | PC(18:1(9Z)/18:1(9Z)) | + | C44H84NO8P | 9 | 1.35 |
| M909T2 | 908.61 | 2.33 | PC(22:2(13Z,16Z)/22:6(4Z,7Z,10Z,13Z,16Z,19Z)) | + | C52H88NO8P | 2 | 1.22 |
| Cardiolipins | |||||||
| M1087T1_1 | 1086.65 | 0.63 | CL(8:0/8:0/10:0/18:2(9Z,11Z)) | + | C53H98O17P2 | 5 | 1.40 |
| Glycerolipids | |||||||
| M591T1 | 591.42 | 0.86 | Saringosterol 3-glucoside | + | C35H58O7 | 6 | 1.17 |
| Flavonoids | |||||||
| M447T1_1 | 447.14 | 0.79 | Cycloartomunin | − | C26H24O7 | 6 | 1.45 |
| Sterol Lipids | |||||||
| M465T3_2 | 465.35 | 3.45 | 3b,5a,6b-Cholestanetriol | − | C27H48O3 | 8 | 1.15 |
| Fatty Acyls | |||||||
| M527T1_2 | 527.28 | 0.52 | Neuromedin N (1-4) | + | C26H40N4O6 | 6 | 1.16 |
| Other metabolites | |||||||
| M628T7 | 627.56 | 6.86 | FAHFA(18:3-(2-O-24:0)) | + | C42H76O4 | 6 | 1.41 |
Publisher’s Note: MDPI stays neutral with regard to jurisdictional claims in published maps and institutional affiliations. |
© 2022 by the authors. Licensee MDPI, Basel, Switzerland. This article is an open access article distributed under the terms and conditions of the Creative Commons Attribution (CC BY) license (https://creativecommons.org/licenses/by/4.0/).
Share and Cite
da Cruz, J.P.; dos Santos, F.N.; Rasteiro, F.M.; Marostegan, A.B.; Manchado-Gobatto, F.B.; Gobatto, C.A. A Metabolomic Approach and Traditional Physical Assessments to Compare U22 Soccer Players According to Their Competitive Level. Biology 2022, 11, 1103. https://0-doi-org.brum.beds.ac.uk/10.3390/biology11081103
da Cruz JP, dos Santos FN, Rasteiro FM, Marostegan AB, Manchado-Gobatto FB, Gobatto CA. A Metabolomic Approach and Traditional Physical Assessments to Compare U22 Soccer Players According to Their Competitive Level. Biology. 2022; 11(8):1103. https://0-doi-org.brum.beds.ac.uk/10.3390/biology11081103
Chicago/Turabian Styleda Cruz, João Pedro, Fábio Neves dos Santos, Felipe Marroni Rasteiro, Anita Brum Marostegan, Fúlvia Barros Manchado-Gobatto, and Claudio Alexandre Gobatto. 2022. "A Metabolomic Approach and Traditional Physical Assessments to Compare U22 Soccer Players According to Their Competitive Level" Biology 11, no. 8: 1103. https://0-doi-org.brum.beds.ac.uk/10.3390/biology11081103