3.1. Effect of Substrate on Production of β-Mannanase
In the solid-state fermentations, evaluation was made of the use of coffee waste (CW) as the sole solid substrate, as well as in combination with wheat bran (WB) or sugarcane bagasse (SB), for the production of β-mannanase and β-glycosidase. The most appropriate solid substrate was considered to be the one that provided the highest production of these enzymes.
Table 1 presents the enzymatic activities obtained for cultivation of
A. niger F12 under SSF in flasks, at different times (72, 96, and 120 h), for all the solid substrates.
The use of a mixture of coffee waste and wheat bran as solid substrate during the SSF using
A. niger F12 resulted in higher activities for both β-mannanase and β-glycosidase (
Table 1). Wheat bran is considered a suitable waste for fermentation processes [
29], with excellent industrial potential due to its high water retention capacity [
30], good heat dissipation, and air circulation between the particles, allowing effective penetration of the fungal mycelium. It is also a complex substrate, acting as a source of carbon and nitrogen, in addition to being inexpensive [
31,
32]. These characteristics were observed in this work, since the wheat bran provided the fungus with an ideal environment for its growth, while the coffee waste served as an inducer for β-mannanase production, due to its high content of galactomannans.
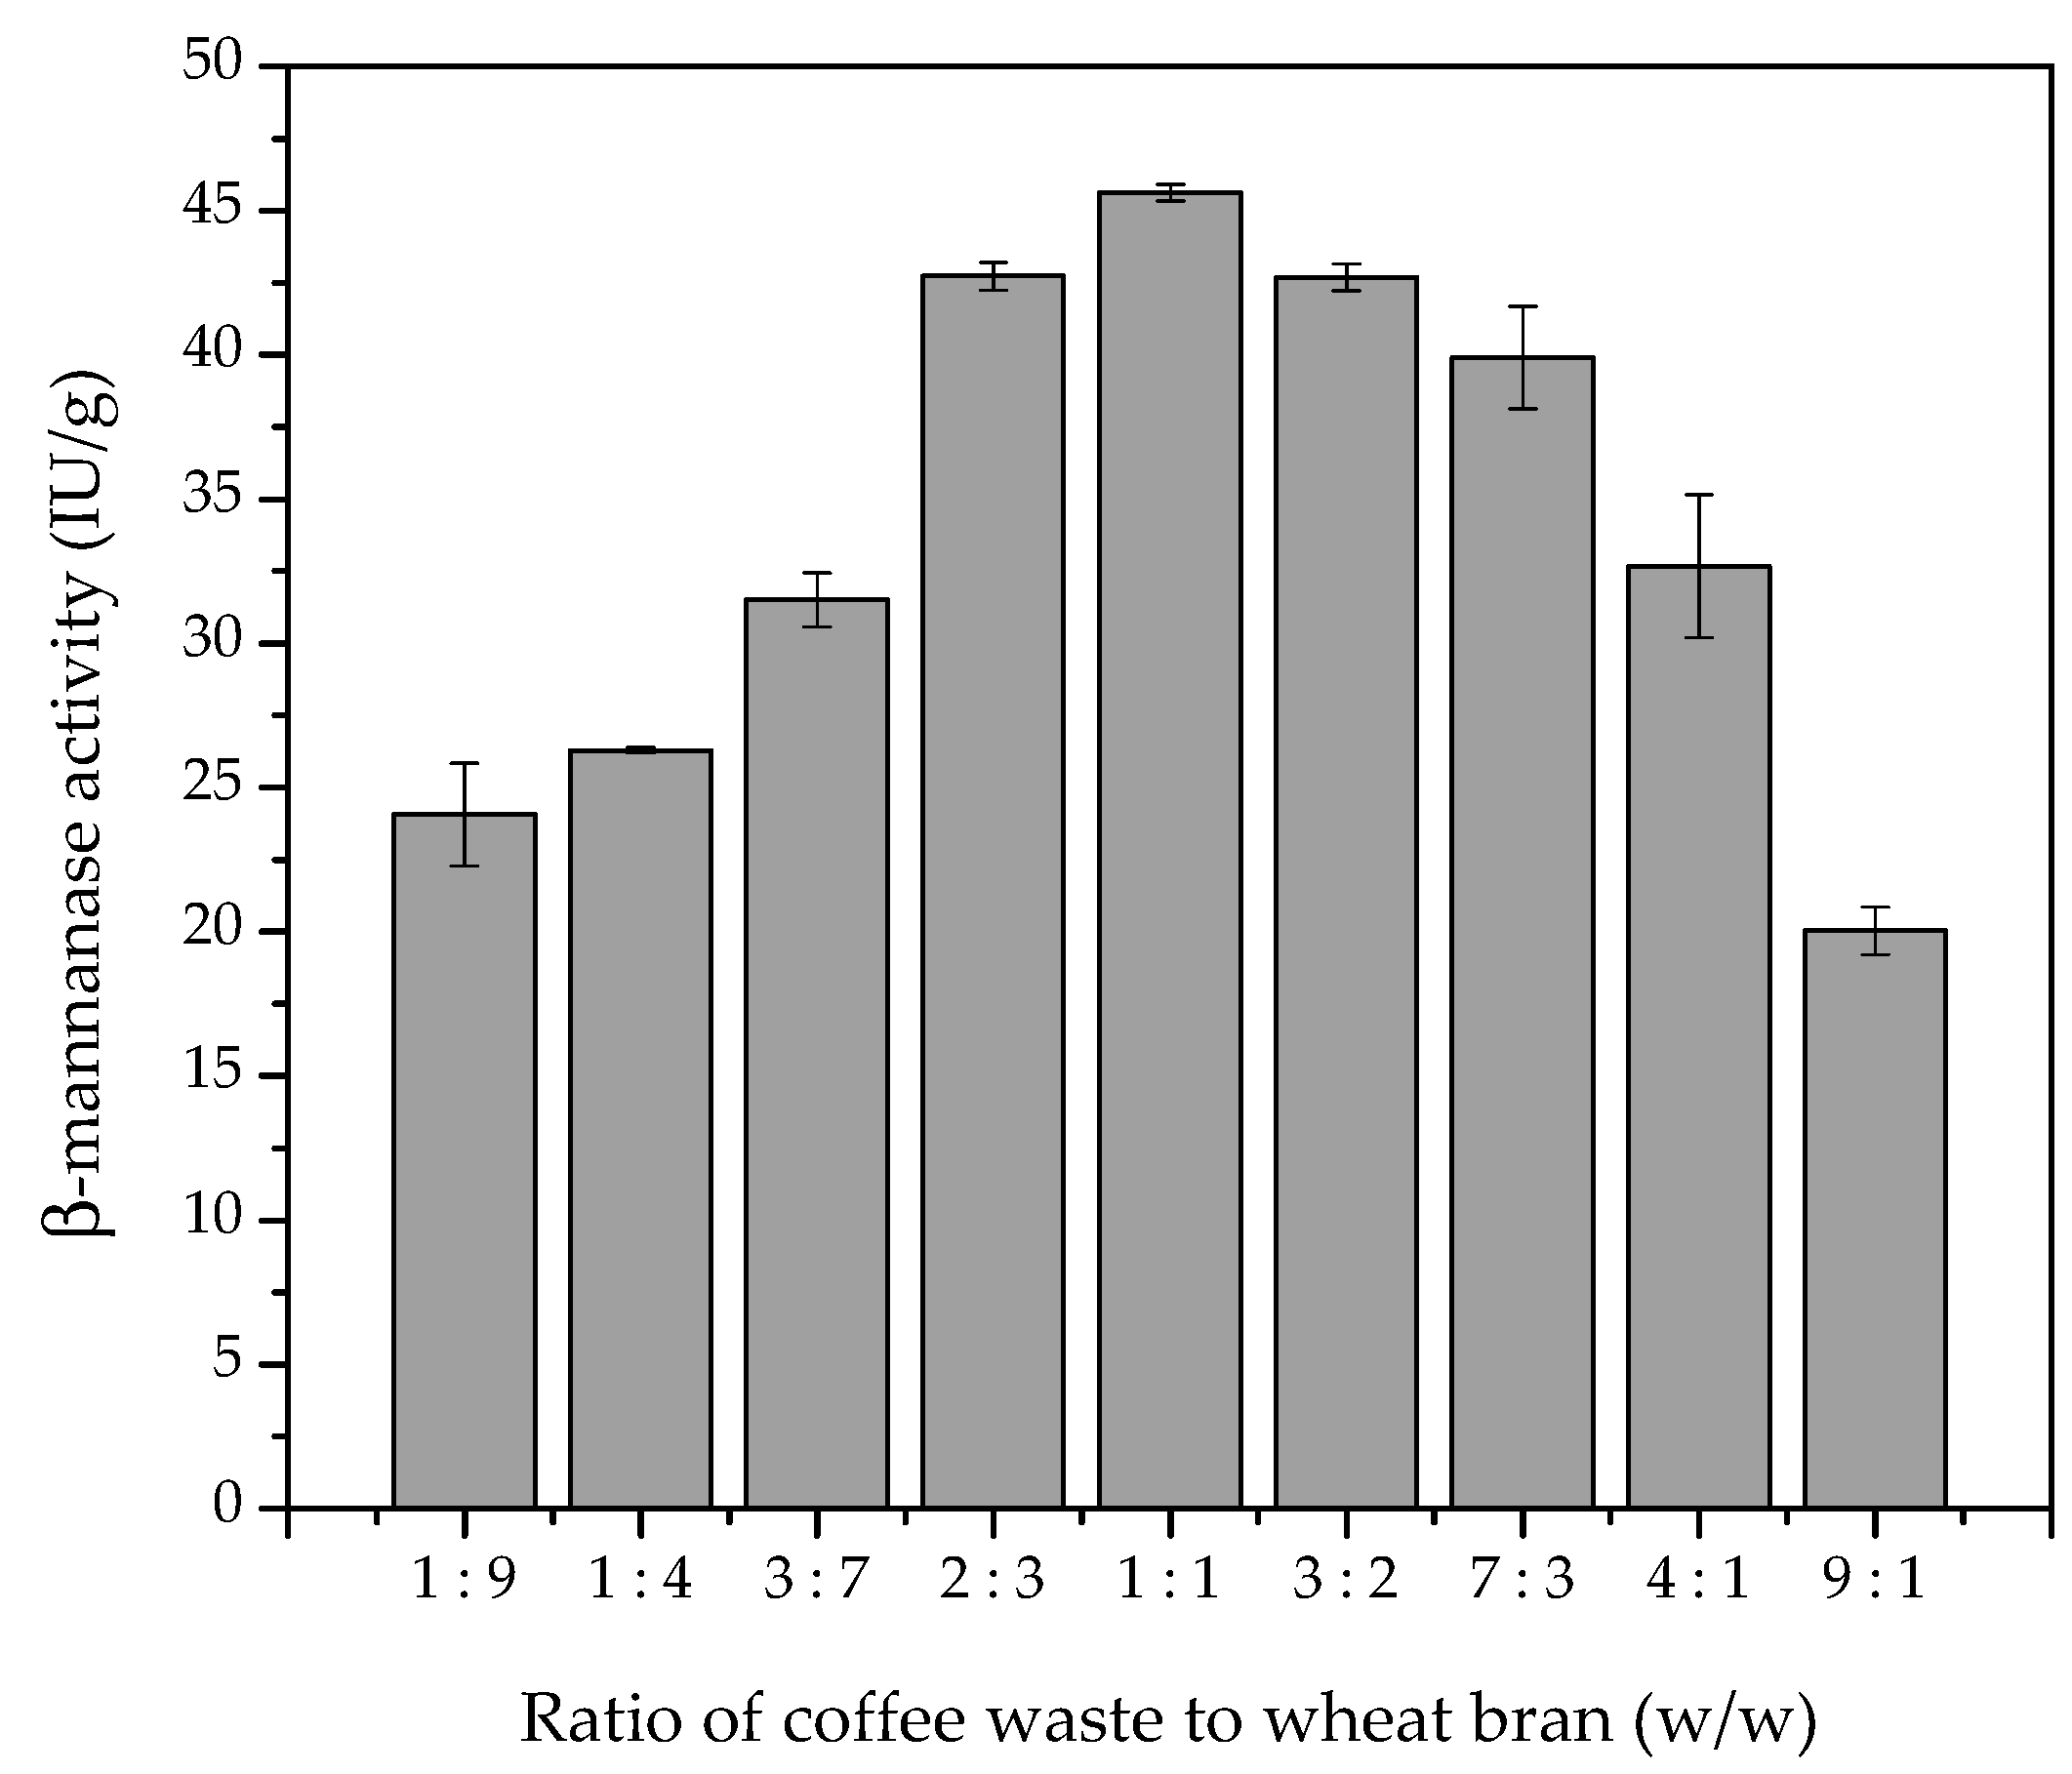
In order to further evaluate the use of a combination of coffee waste and wheat bran as substrate for enzyme production, different ratios of these substrates were used during SSF (
Figure 1). The ratio of coffee waste to wheat bran in the medium had a crucial effect on fungal growth and β-mannanase production. The data presented in
Figure 1 show that the β-mannanase activity increased as the ratio of CW to WB increased, with the highest value reached at a ratio of 1:1 (
w/
w), followed by a decrease as the ratio was increased further. The statistical model identified the point of maximum enzymatic activity at a 1:1 ratio of coffee waste and wheat bran (R
2 = 0.84), with small variations between ratios of 2:3 and 3:2 not affecting the enzyme production. Therefore, the 1:1 (
w/
w) ratio was chosen as the optimum for enzyme production in the subsequent experiments. These results indicate that the coffee residue is important to favor the production of β-mannanase, while the wheat bran acted as a nutrient source, providing the physical and chemical characteristics necessary for growth of the microorganism.
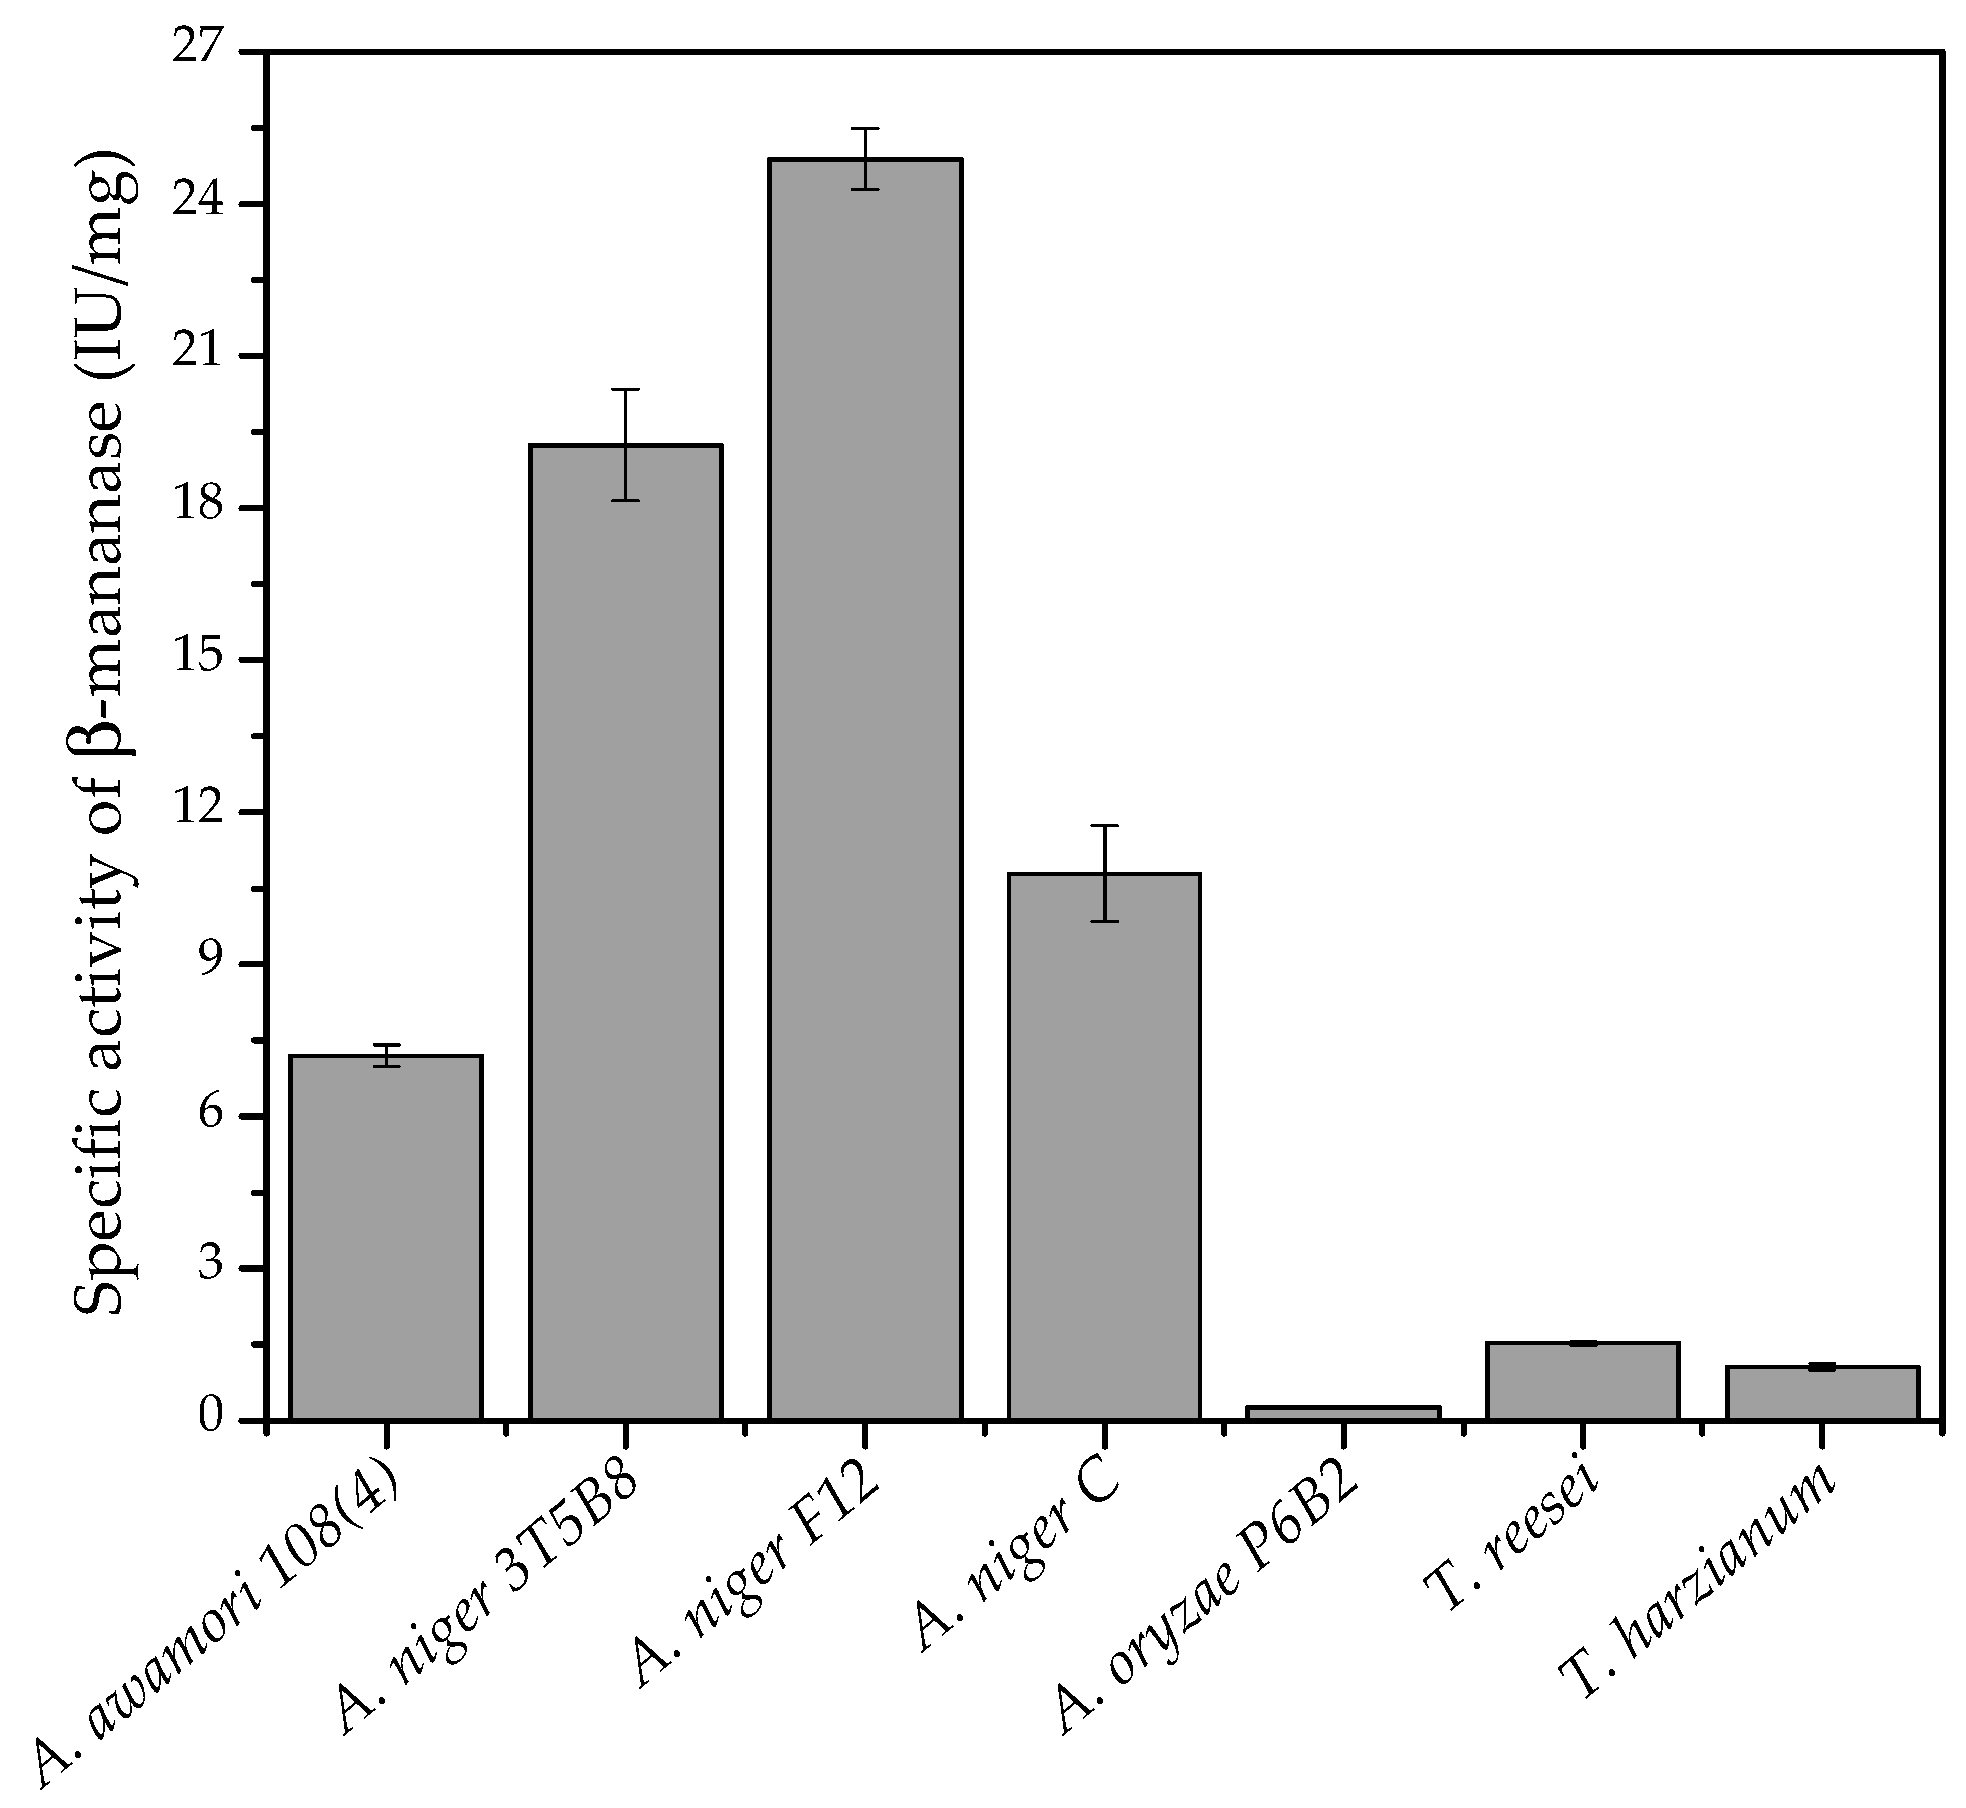
3.2. Effect of Different Fungi on Enzyme Production
Different filamentous fungi were studied for the production of β-mannanase under SSF, using the combination of coffee waste and wheat bran (1:1,
w/
v) as solid substrate.
Figure 2 shows the specific activity of β-mannanase produced by each fungus, after 120 h of cultivation. The highest production of β-mannanase was obtained using
A. niger F12, followed by
A. niger 3T5B8.
According to De Vries and Visser [
33], strains of
Aspergillus ssp. are the most important decomposers of hemicelluloses and celluloses in nature, having the capacity to produce several enzymes that degrade plant cell wall components. Ferreira and Filho [
34] evaluated the production of β-mannanase by submerged fermentation using
T. harzianum T4 and observed that the enzyme started to be produced on the sixth day of cultivation, reaching a peak on the eighth day, with activity of approximately 9 IU/mL. In the present work, β-mannanase production by
A. niger F12 reached 8.6 IU/mL in five days, indicating better productivity of the enzyme under solid-state cultivation and with the use of this fungus.
3.3. Comparison of the Types of Cultivation Under SSF
The main advantage of SSF is the ability to use raw materials from agroindustry waste, but this technology has some drawbacks related to scale-up and the extraction of desired products in the downstream steps [
35]. At the laboratory scale, flasks are usually used. In this case, the process occurs without forced aeration, is low cost, and is easy to handle, but it is difficult to control the operational parameters. The packed-bed bioreactor with glass columns (the Raimbault system) is provided with forced aeration through the static bed of particles, which helps to replenish O
2 and water, while at the same time avoiding the accumulation of heat and CO
2. In this work, both cultivation systems were evaluated.
Table 2 shows the β-mannanase and β-glucosidase productivities obtained using flasks and the SSF column bioreactor. The β-mannanase activity on the third day of cultivation in the column bioreactor (52.6 ± 1.6 IU/g) was statistically equal to the activity achieved on the fifth day of cultivation in the Erlenmeyer flasks (51.9 ± 0.7 IU/g). The production of β-glucosidase was also higher using the column bioreactor. For both enzymes, cultivation in the bioreactor resulted in the highest productivity values after 72 h of cultivation. For β-mannanase, the productivity after 72 h was 50.7% higher when the bioreactor was used, rather than the flasks. Therefore, the results obtained for SSF in the bioreactor were promising, since there were higher production and productivity values for both enzymes, achieved in a shorter cultivation time, which would be favorable for improving the economic feasibility of the process.
Cerda et al. [
20] used a solid-state fermentation bioreactor for the production of cellulase and xylanase, using coffee husks combined with other non-sterile residues as substrates. It was observed that the microorganisms acted synergistically in the production of the enzymes, with low gaseous emissions and reduced energy requirements making the bioprocess more environmentally friendly. García et al. [
36] cultivated
Penicillium purpurogenum in plastic bags, using coffee husks and coffee pulp as substrates, with the addition of sterilized cheese whey as a supplementary source of fermentable sugars (4.5–5.0% lactose), aiming at the extraction of total phenolic compounds. The coffee industry wastes supplemented with cheese whey were appropriate substrates for the growth of the microorganism and for obtaining phenolic compounds by the action of the enzymes produced during the process. In agreement with the earlier studies, the present findings showed that it was possible to create an environment that provided sufficient nutrients for both fungal growth and production of the desired enzymes.
3.4. Optimization of β-Mannanase and β-Glucosidase Production in Bioreactor Fermentation
The important SSF variables analyzed for the optimization of enzymes production were temperature, initial pH, and initial moisture content.
Table 3 presents the matrix of the assays, showing the real and coded values, together with the means and standard errors for the activities of β-mannanase and β-glucosidase (IU/g), determined in triplicate. The highest activities of the enzymes were found for the central point condition.
Considering the effects of the significant variables (99% confidence level), the largest and most significant effect was the curvature effect. This indicated that the production of these enzymes was optimized at the levels of the central point (tests 9, 10, and 11 in
Table 3).
Therefore, the experimental conditions of the central point were selected to produce the enzymatic extract to be characterized in terms of thermostability and the optimal conditions of pH and temperature for enzymatic activity. This extract was also used in the hydrolysis of the coffee polysaccharides. The optimum temperature for enzymes production by fermentation is usually close to the ideal temperature for growth of the microorganism, especially when the enzymes are products associated with growth, as in the case of the β-mannanase and β-glucosidase investigated here.
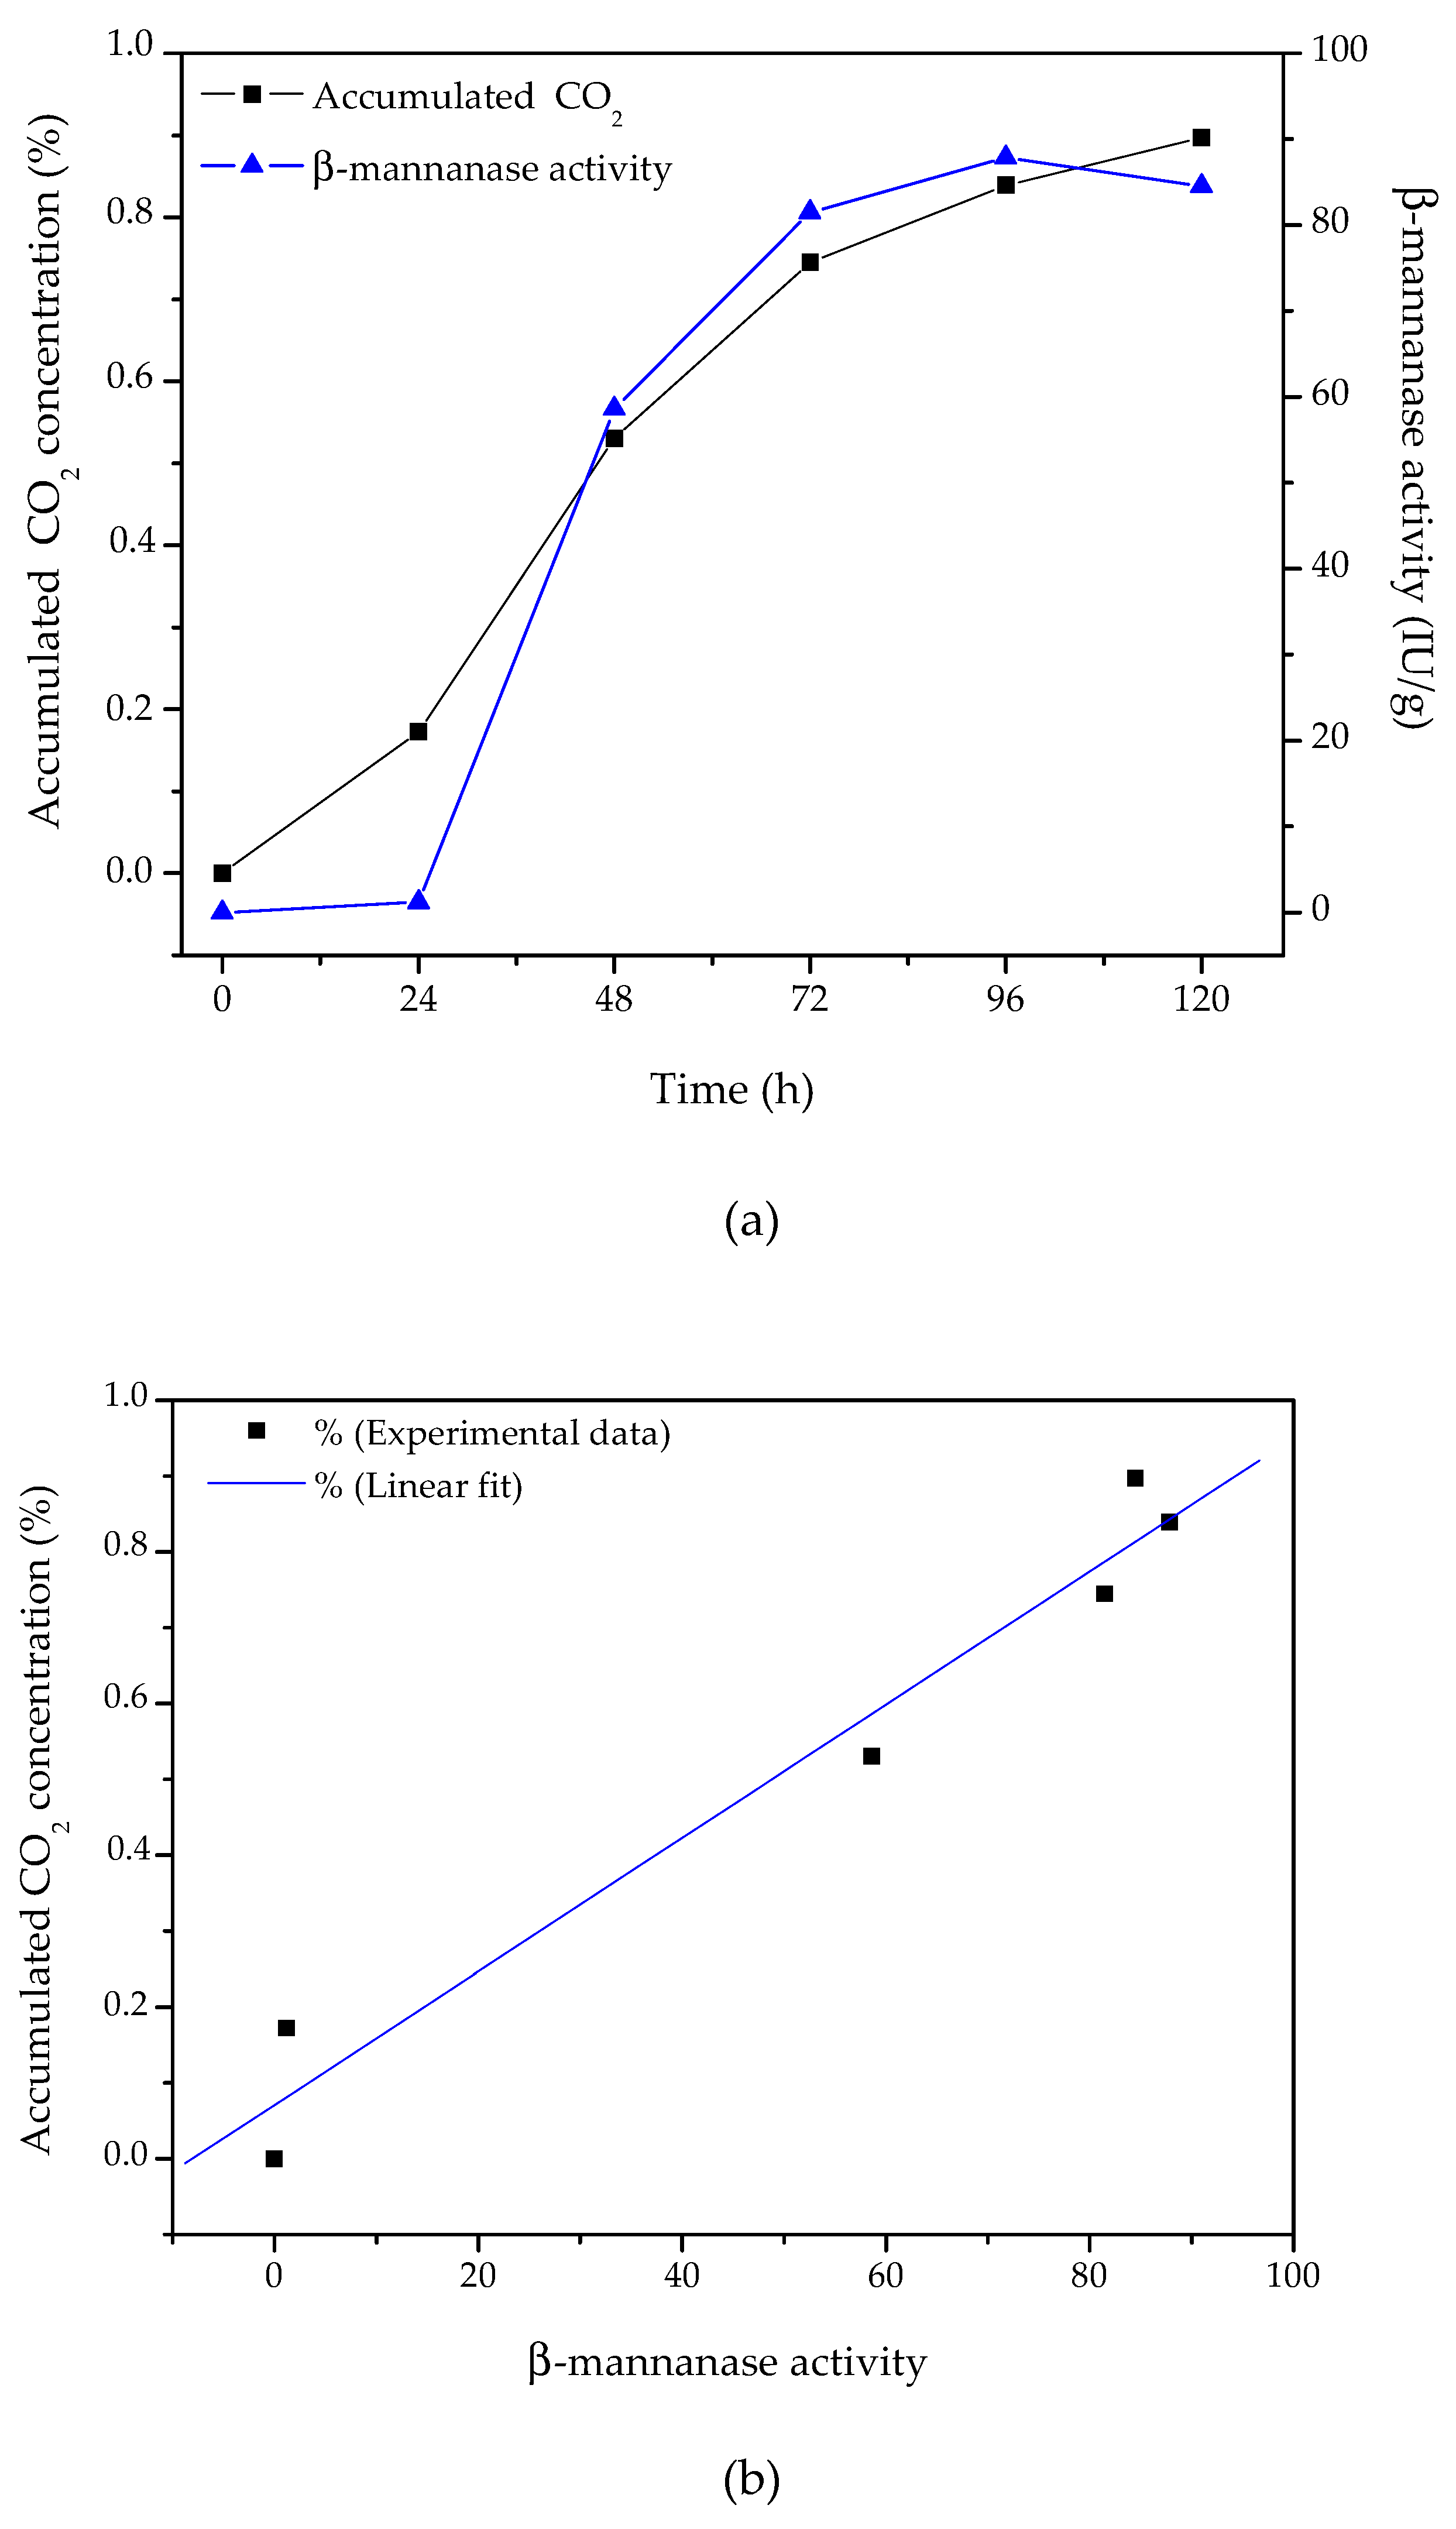
3.5. Time Profile of β-Mannanase Production
In SSF, the microbial biomass grows entangled in the solid substrate, which makes direct measurement of the microbial biomass concentration almost impossible. An indirect way to estimate fungal growth in SSF is by monitoring the behavior of respiratory gases (either the oxygen consumed or the CO
2 produced by metabolism) [
37]. A comparison of the β-mannanase produced and the CO
2 accumulated during cultivation of
A. niger F12 using an inlet air relative humidity of 80% and an air flow rate of 20 mL/min is presented in
Figure 3.
The total amount of CO2 produced showed a good correlation with β-mannanase production (R2 = 0.963), especially after the first 24 h of cultivation. These results evidenced that the production of carbon dioxide during the cultivation period could provide valuable information about the progress of enzyme production.
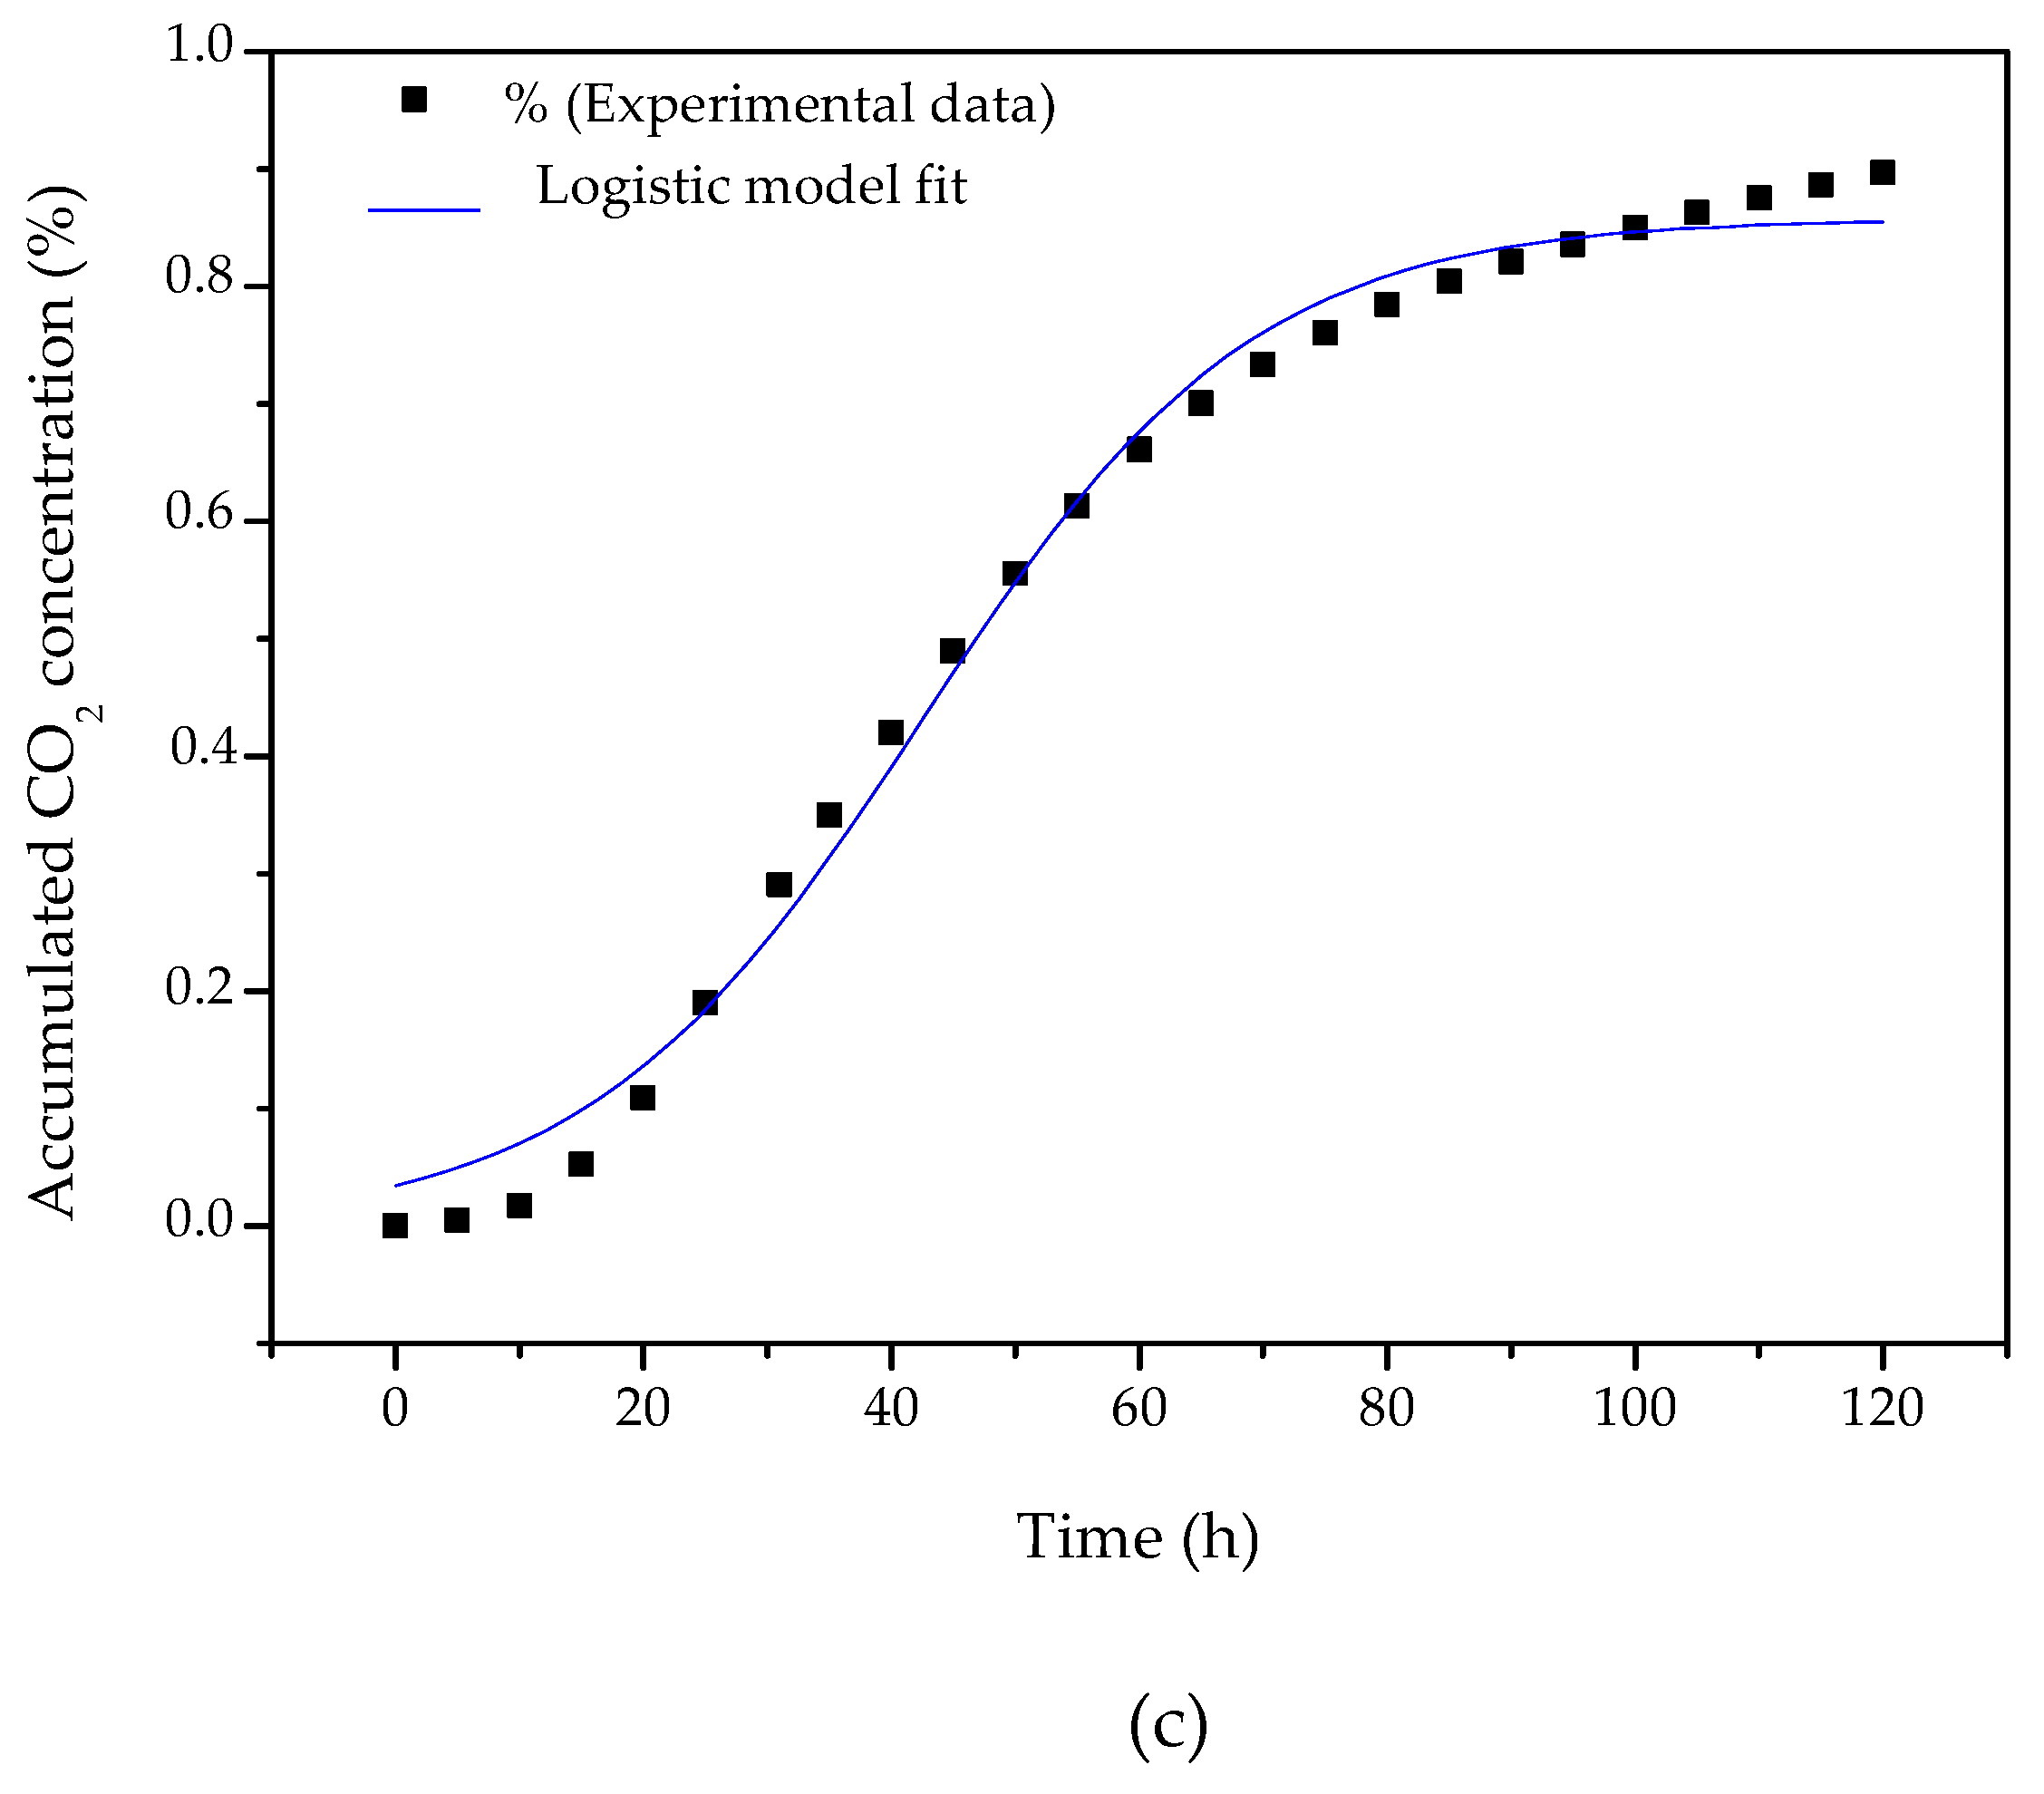
According to Viccini et al. [
38], who fitted kinetic models to a range of experimental results for microbial growth under SSF available in the literature, the logistic model provided a good fit to the results of most of the studies considered. Despite its mathematical simplicity, the logistic model can provide an adequate approximation of the complete growth curve, using a single equation, allowing visualization of the lag, fast growth, and stationary phases. The logistic model Equation (2) is an unstructured empirical model based on experimental observations:
where b is the fraction of microbial biomass in the fermented material, b
m is its maximum value, and µ is the specific growth rate. The initial condition adopted to solve Equation (2) was b = b
0 (the fraction of biomass inoculated at the beginning of the process) at t = 0. The integrated form of the logistic model is given by:
When all conditions are optimal for growth, μ = μ
max (maximum specific growth rate). Fitting Equation (3) to the full curve of the experimental data for the accumulated CO
2 concentration resulted in μ
max = 0.075 (± 0.004) h
−1 (R² = 0.992,
Figure 3c) for the bioprocess studied here. It should be noted that this parameter is specific for each combination of microorganism, substrate, and product, hence requiring specific experimental measurements of growth in the system of interest.
Mathematical modeling is a valuable tool for guiding the design, operation, and scale-up of SSF bioreactors, so the value of μ
max was used as an input for further simulation studies of the bioprocess studied here. Since metabolic heat generation is directly proportional to fungal growth, growth kinetics sub-models are commonly coupled with heat and mass transfer balance equations. The kinetics sub-models are usually empirical relations (in which μ
max appears as a parameter) that take account of the effects of parameters such as temperature and moisture content on microbial growth (expressed by the actual μ value) and, consequently, on the yields of growth-related enzymes [
39,
40,
41,
42,
43].
3.6. Thermostability and Optimum Temperature and pH of β-Mannanase
Thermostability can be defined as the activity retained after heating an enzyme extract at a selected temperature for a prolonged period of time [
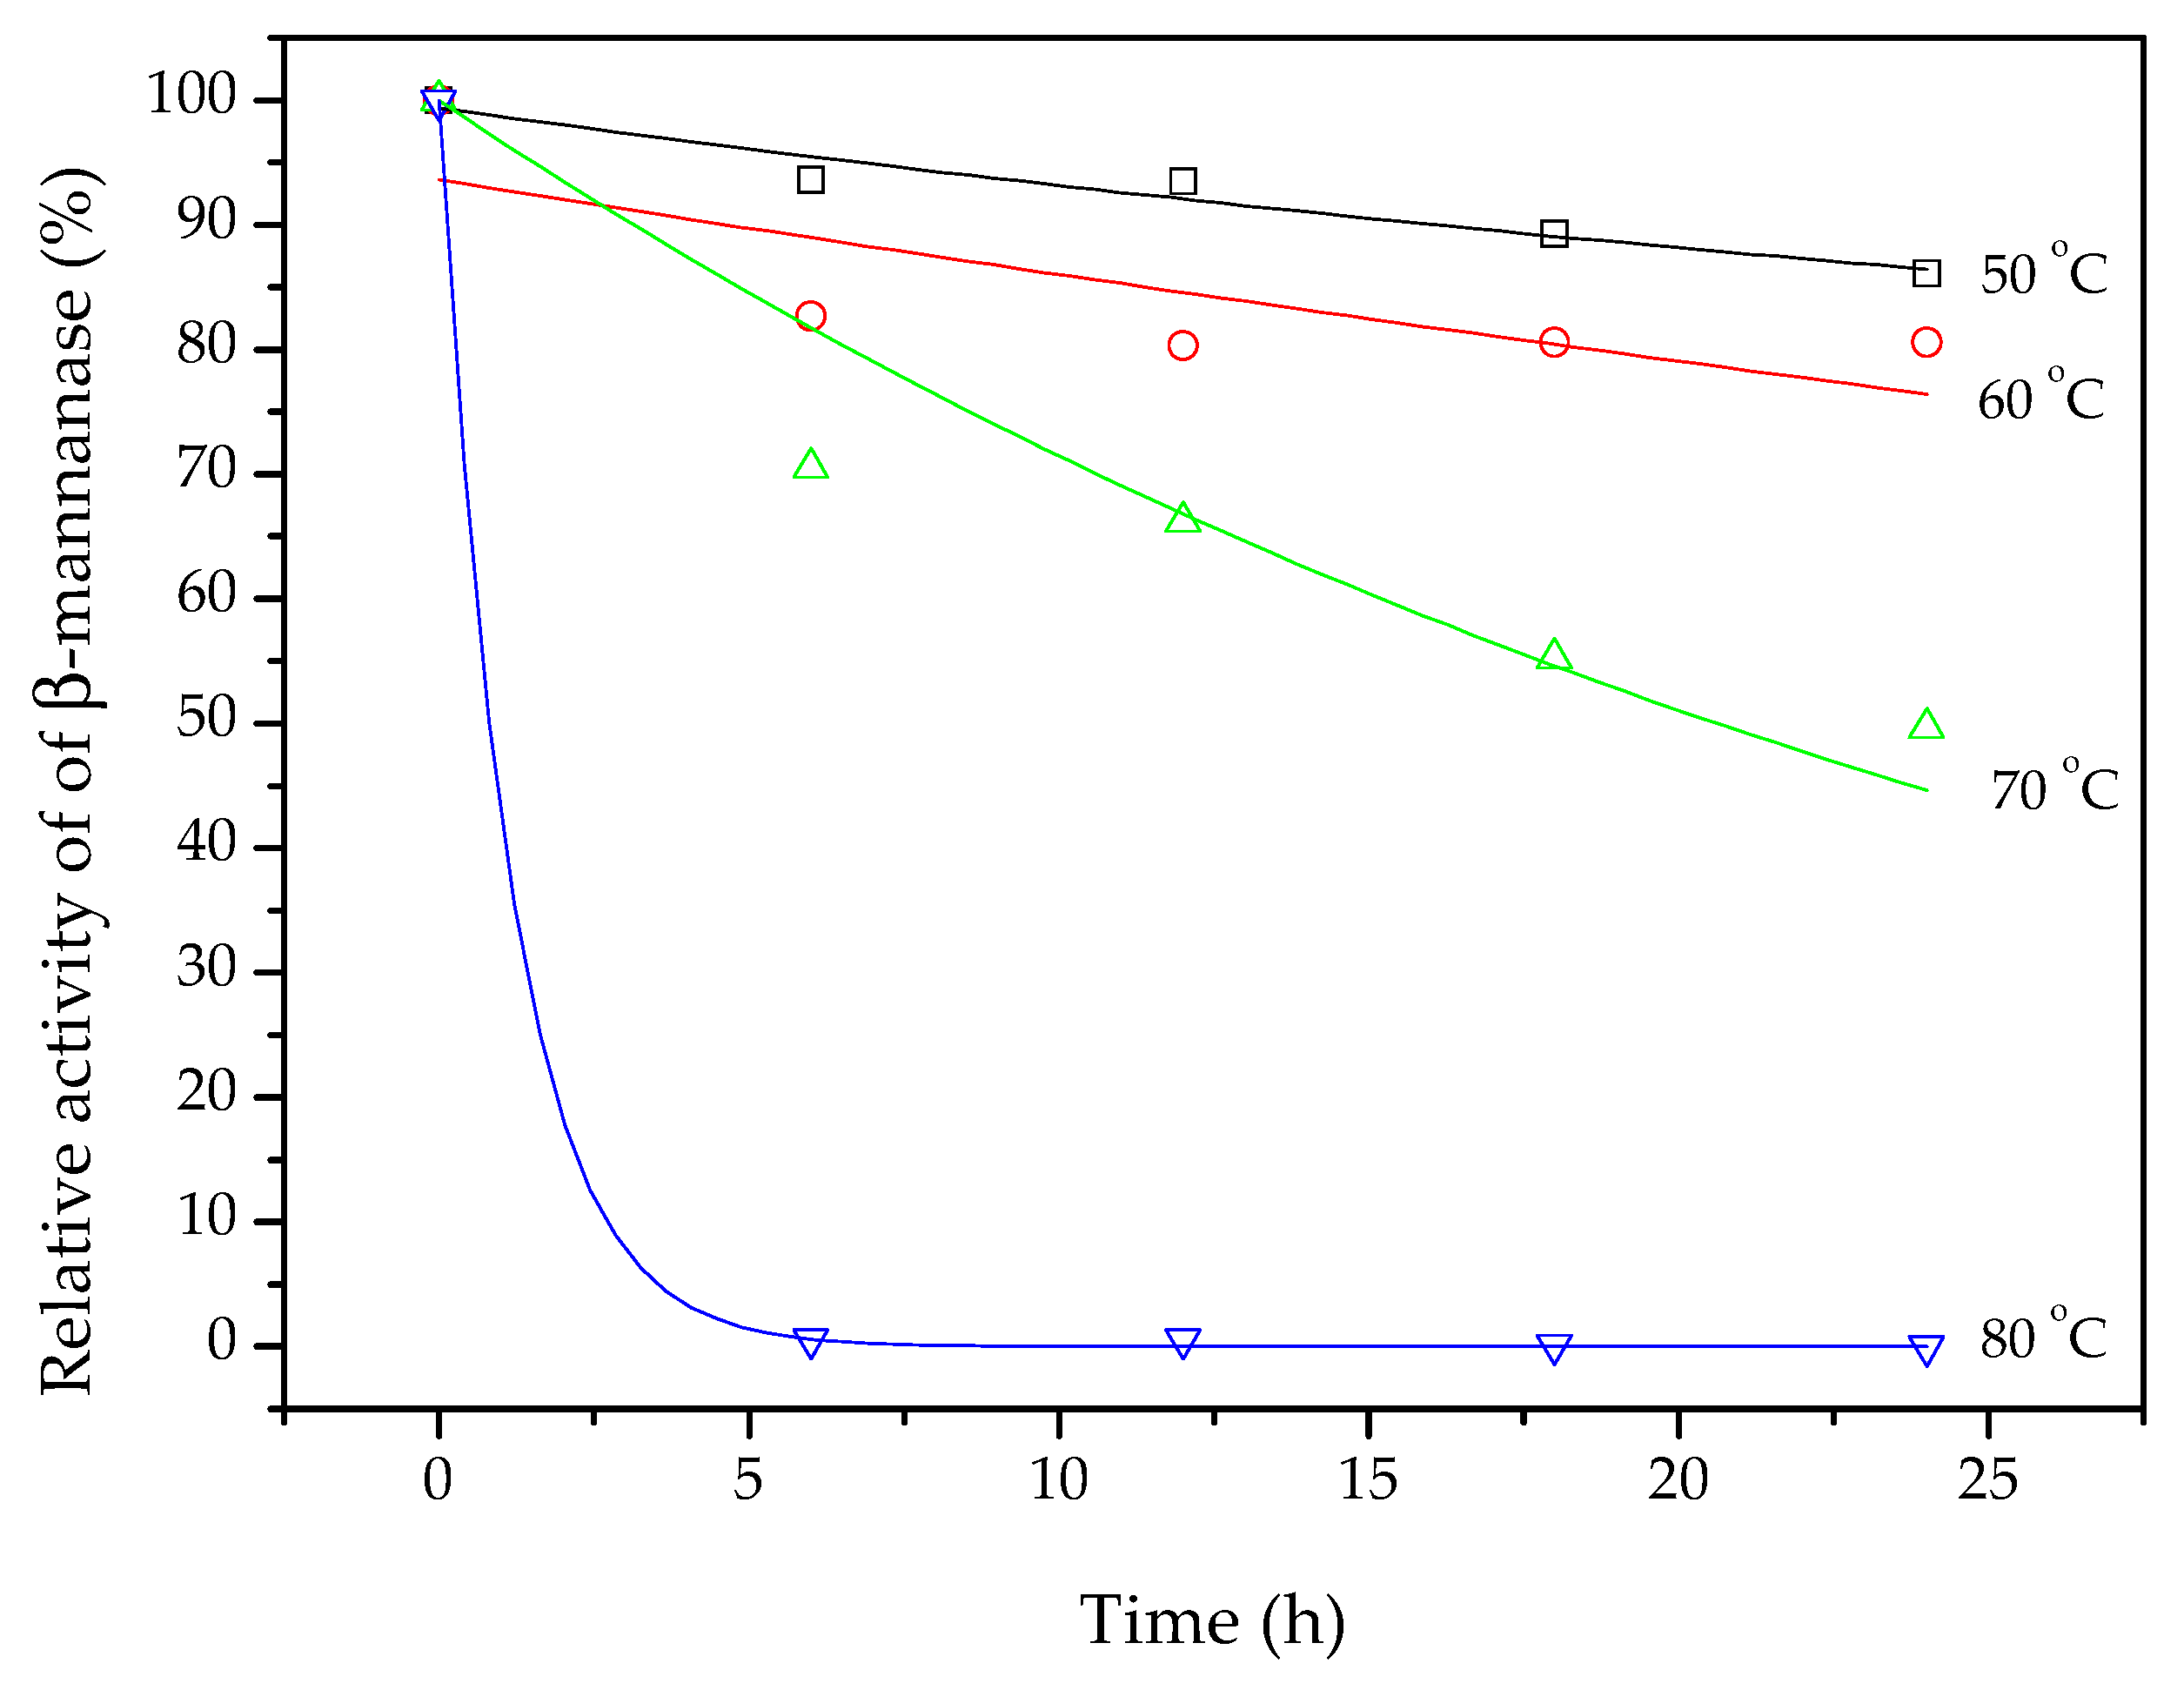
44]. After 24 h at 50 °C, the β-mannanase still had 87% of its original activity (
Figure 4). After 12 h exposure at 50 °C, the enzyme retained 95% of its activity, while 80% was retained after 12 h at 60 °C. Soni et al. [
45] produced β-mannanase using
A. terreus FBCC 1369 under SSF, with coconut pulp flour as substrate, and evaluated the stability of the enzyme at 50, 60, 70, and 80 °C, during 60 h. After 24 h at 50 °C, the enzymatic extract had lost more than 10% of its activity, similar to the present findings. However, at temperatures from 60 to 80 °C, the extract lost 40% or more of its activity after 24 h. In the present work, around 80% of the β-mannanase activity was still retained after 24 h at 60 °C, showing that the enzyme produced under the conditions employed here was quite stable.
Since the amount of active enzyme can decline considerably following prolonged exposure to high temperatures, in many industrial applications the kinetics of enzyme deactivation can be as important as the kinetics of the reaction itself [
46]. The simplest model of enzyme deactivation expresses the active enzyme concentration as a function of time, considering exponential decay (first order kinetics):
where Ea is the active enzyme concentration, equal to Ea
0 at time (t) zero, and k
d is the deactivation rate constant. According to Equation (4), the concentration of active enzyme (and consequently the enzyme activity) decreases exponentially with time.
The strong dependence of the rate of enzyme deactivation on the temperature can usually be satisfactorily described using the Arrhenius equation:
where A is the Arrhenius constant (or frequency factor), E
d is the activation energy for enzyme deactivation, R
g is the ideal gas constant (8.3145 J mol
−1 K
−1), and T is the absolute temperature. According to Equation (5), as T increases, the rate of enzyme deactivation increases exponentially.
The experimental data for the relative β-mannanase activity (Ea/Ea
0, %) retained during 24 h at 50, 60, 70, and 80 °C were fitted using exponential decay curves (continuous lines in
Figure 4). The model fit was only unsatisfactory for the data obtained at 60 °C (R² = 0.39). The values of k
d and R² obtained for the different temperatures are presented in
Table 4. In addition, Equation (5) was fitted to the data of k
d as a function of temperature (in Kelvin). The Arrhenius model parameter values are shown in
Table 4.
The deactivation energy for the β-mannanase was slightly lower, but of the same order of magnitude, compared to the usual range for many enzymes (170–400 kJ/mol) [
47], so the Arrhenius model fitting confirmed the thermostability of the enzymatic extract produced in the present work. According to the kd values, a temperature increase of 10 °C, from 50 to 60 °C, doubled the rate of enzyme deactivation, while an increase from 70 to 80 °C increased the rate of deactivation 25-fold. Hence, it is clear that temperature has a critical effect on enzyme kinetics, so knowledge of the deactivation rate constant, as well as the Arrhenius model parameters, is essential in the design of successful applications for enzymes.
The effects of pH and temperature on the activity of the β-mannanase present in the enzyme complex produced by the filamentous fungus
A. niger F12 grown on coffee waste and wheat bran, under SSF, were evaluated using statistical design of experiments and response surface methodology analyses.
Table 5 presents the results of the full factorial design for β-mannanase activity under the different conditions of temperature and pH evaluated.
Table 6 shows the coefficients of the mathematical model and the statistical parameters.
The analysis of variance (ANOVA) for β-mannanase showed a correlation coefficient (R²) of 0.925 and F
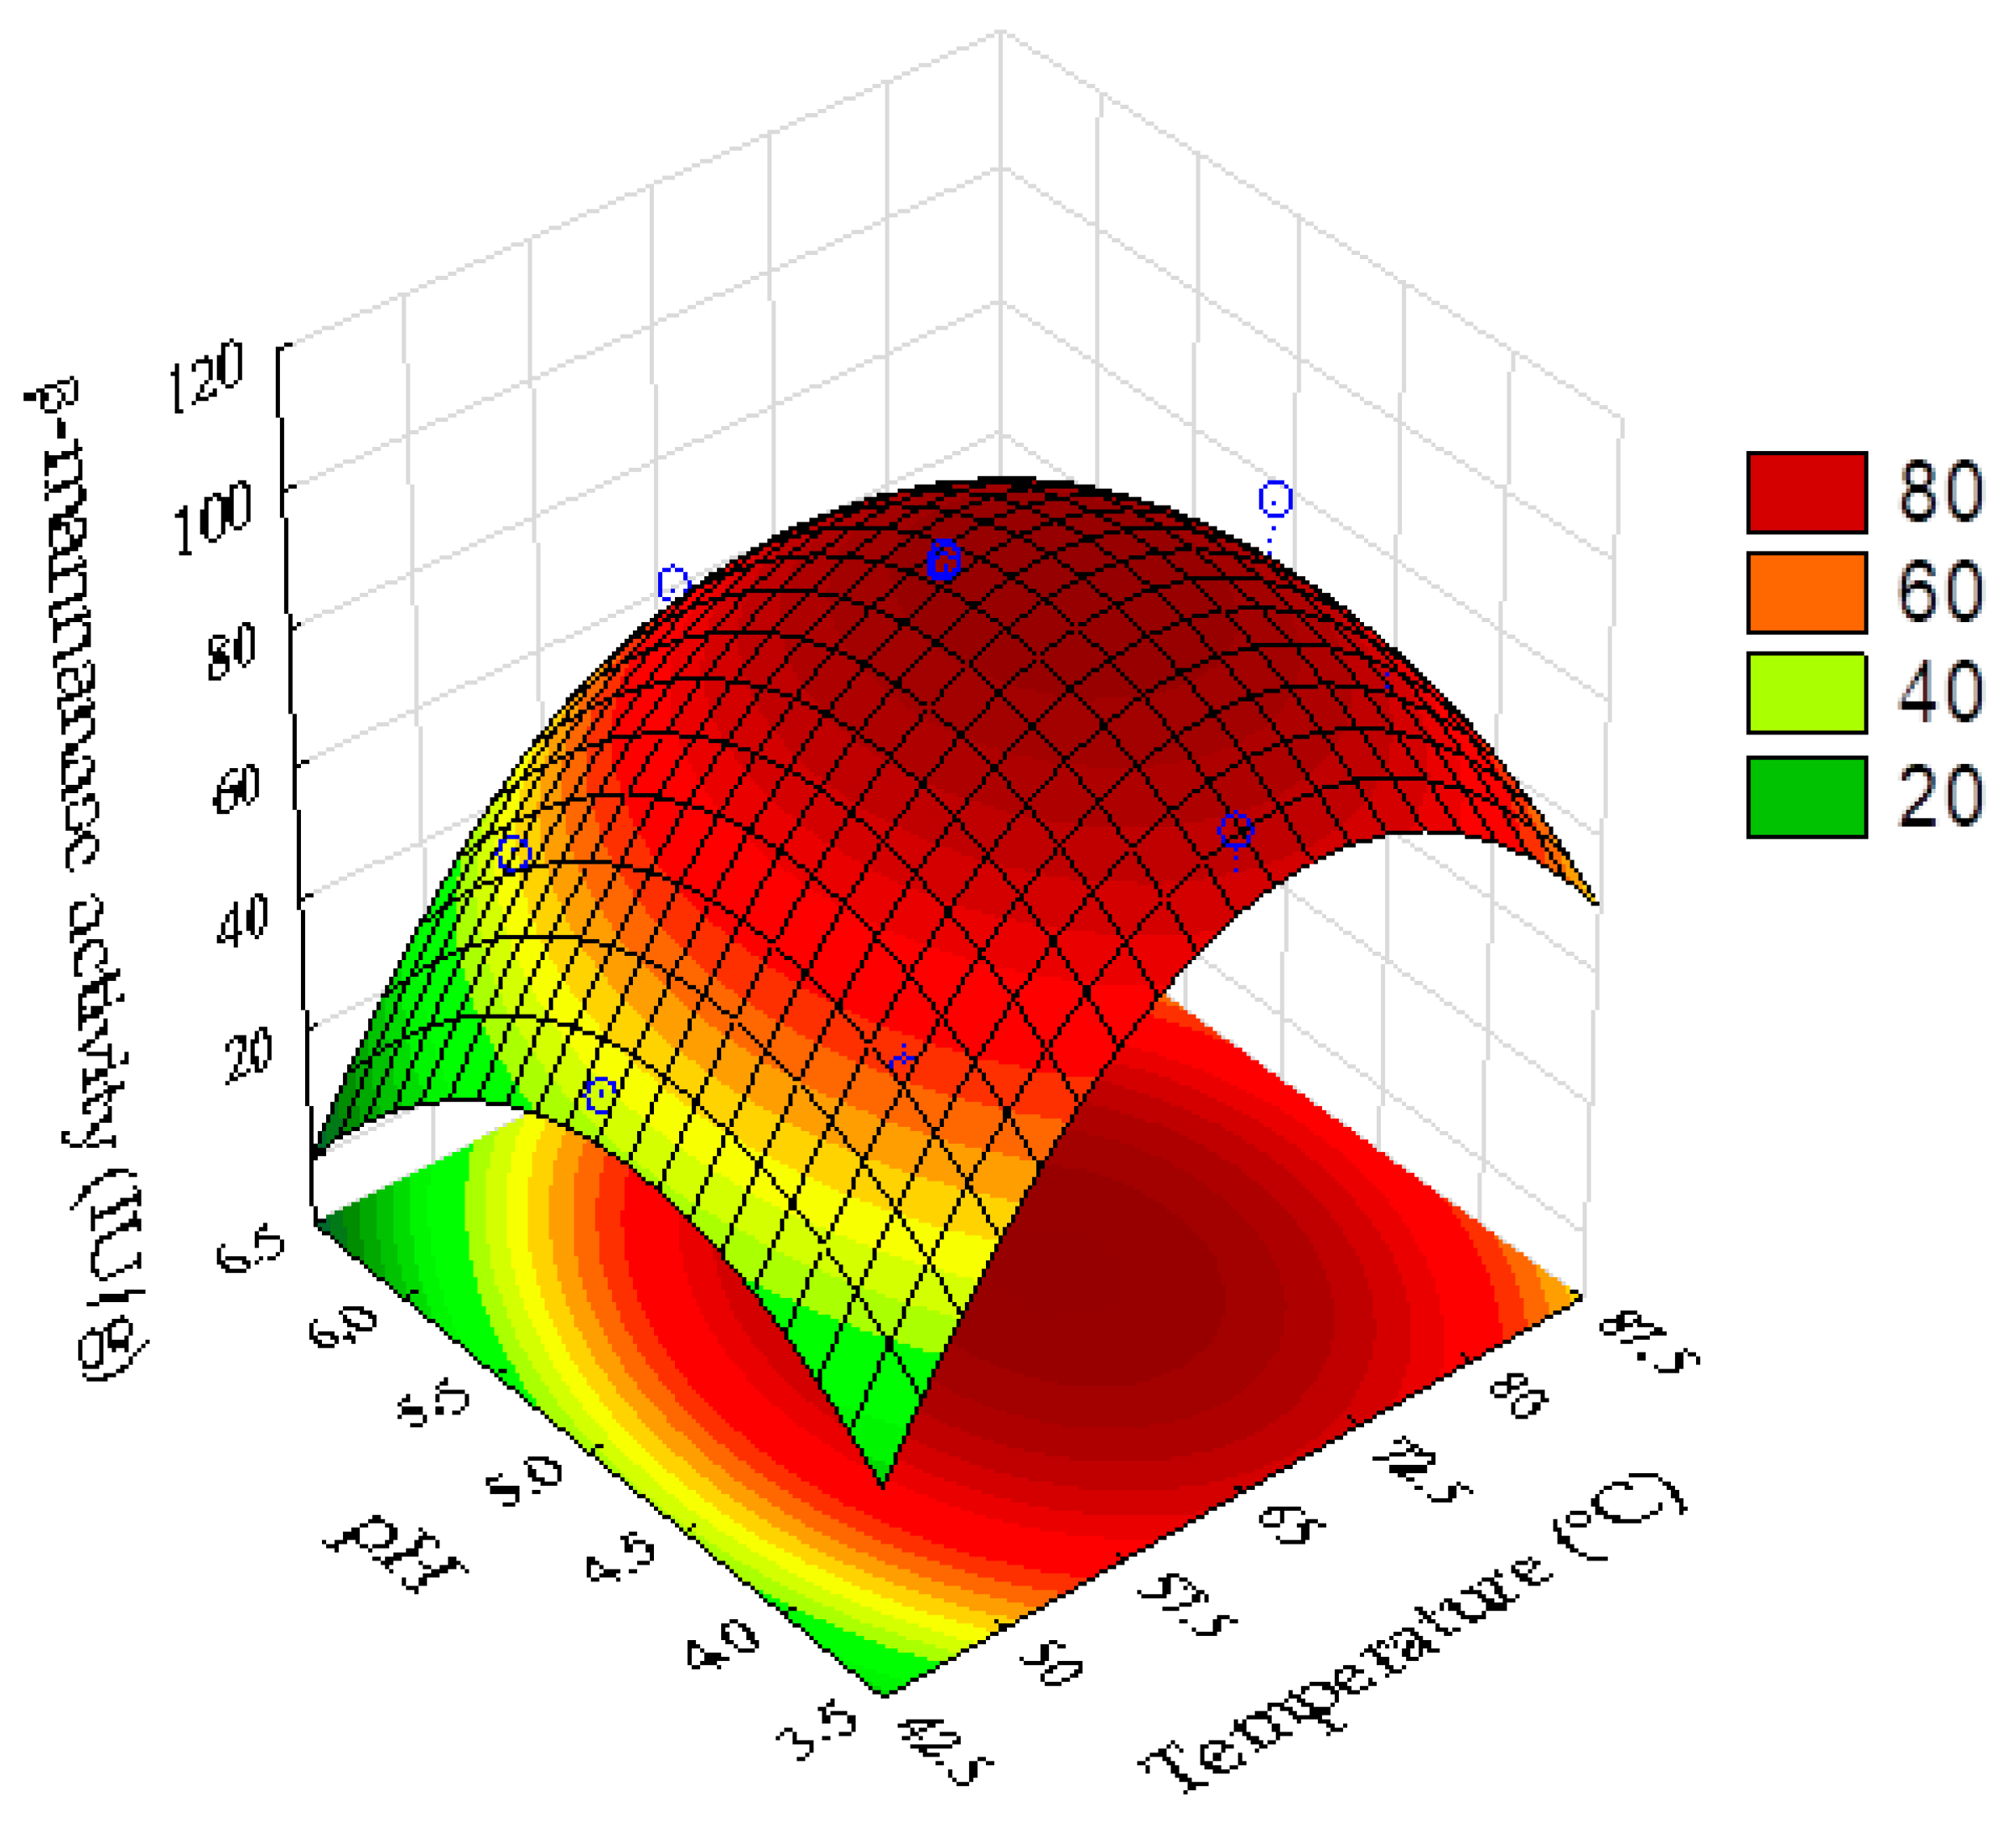
calc 4.06 times higher than the tabulated F value (95% confidence level). Hence, the statistical indexes were satisfactory for the prediction of the model used to describe the response surface plot of the enzyme activity as a function of pH and temperature (
Figure 5). Equation (6) shows the quadratic model of the real β-mannanase activity as a function of pH and temperature:
where X
1 and X
2 are the uncoded values of temperature and pH, respectively. The non-significant term (synergistic effect between temperature and pH) was incorporated into the residuals for the ANOVA analysis.
The optimum temperature range for β-mannanase activity was between approximately 60 and 75 °C (
Figure 5). The optimum pH range was between approximately 4.1 and 5.3. The best enzyme activity was at pH 4.8 and temperature of 69 °C. Under the optimal condition, the model predicted a β-mannanase activity of 96.7 UI/g. The model was successfully validated by experimental determination of the β-mannanase activity under the optimum point conditions, with a value of 96.4 ± 0.8 UI/g obtained.
3.7. Enzymatic Hydrolysis of Coffee Residue
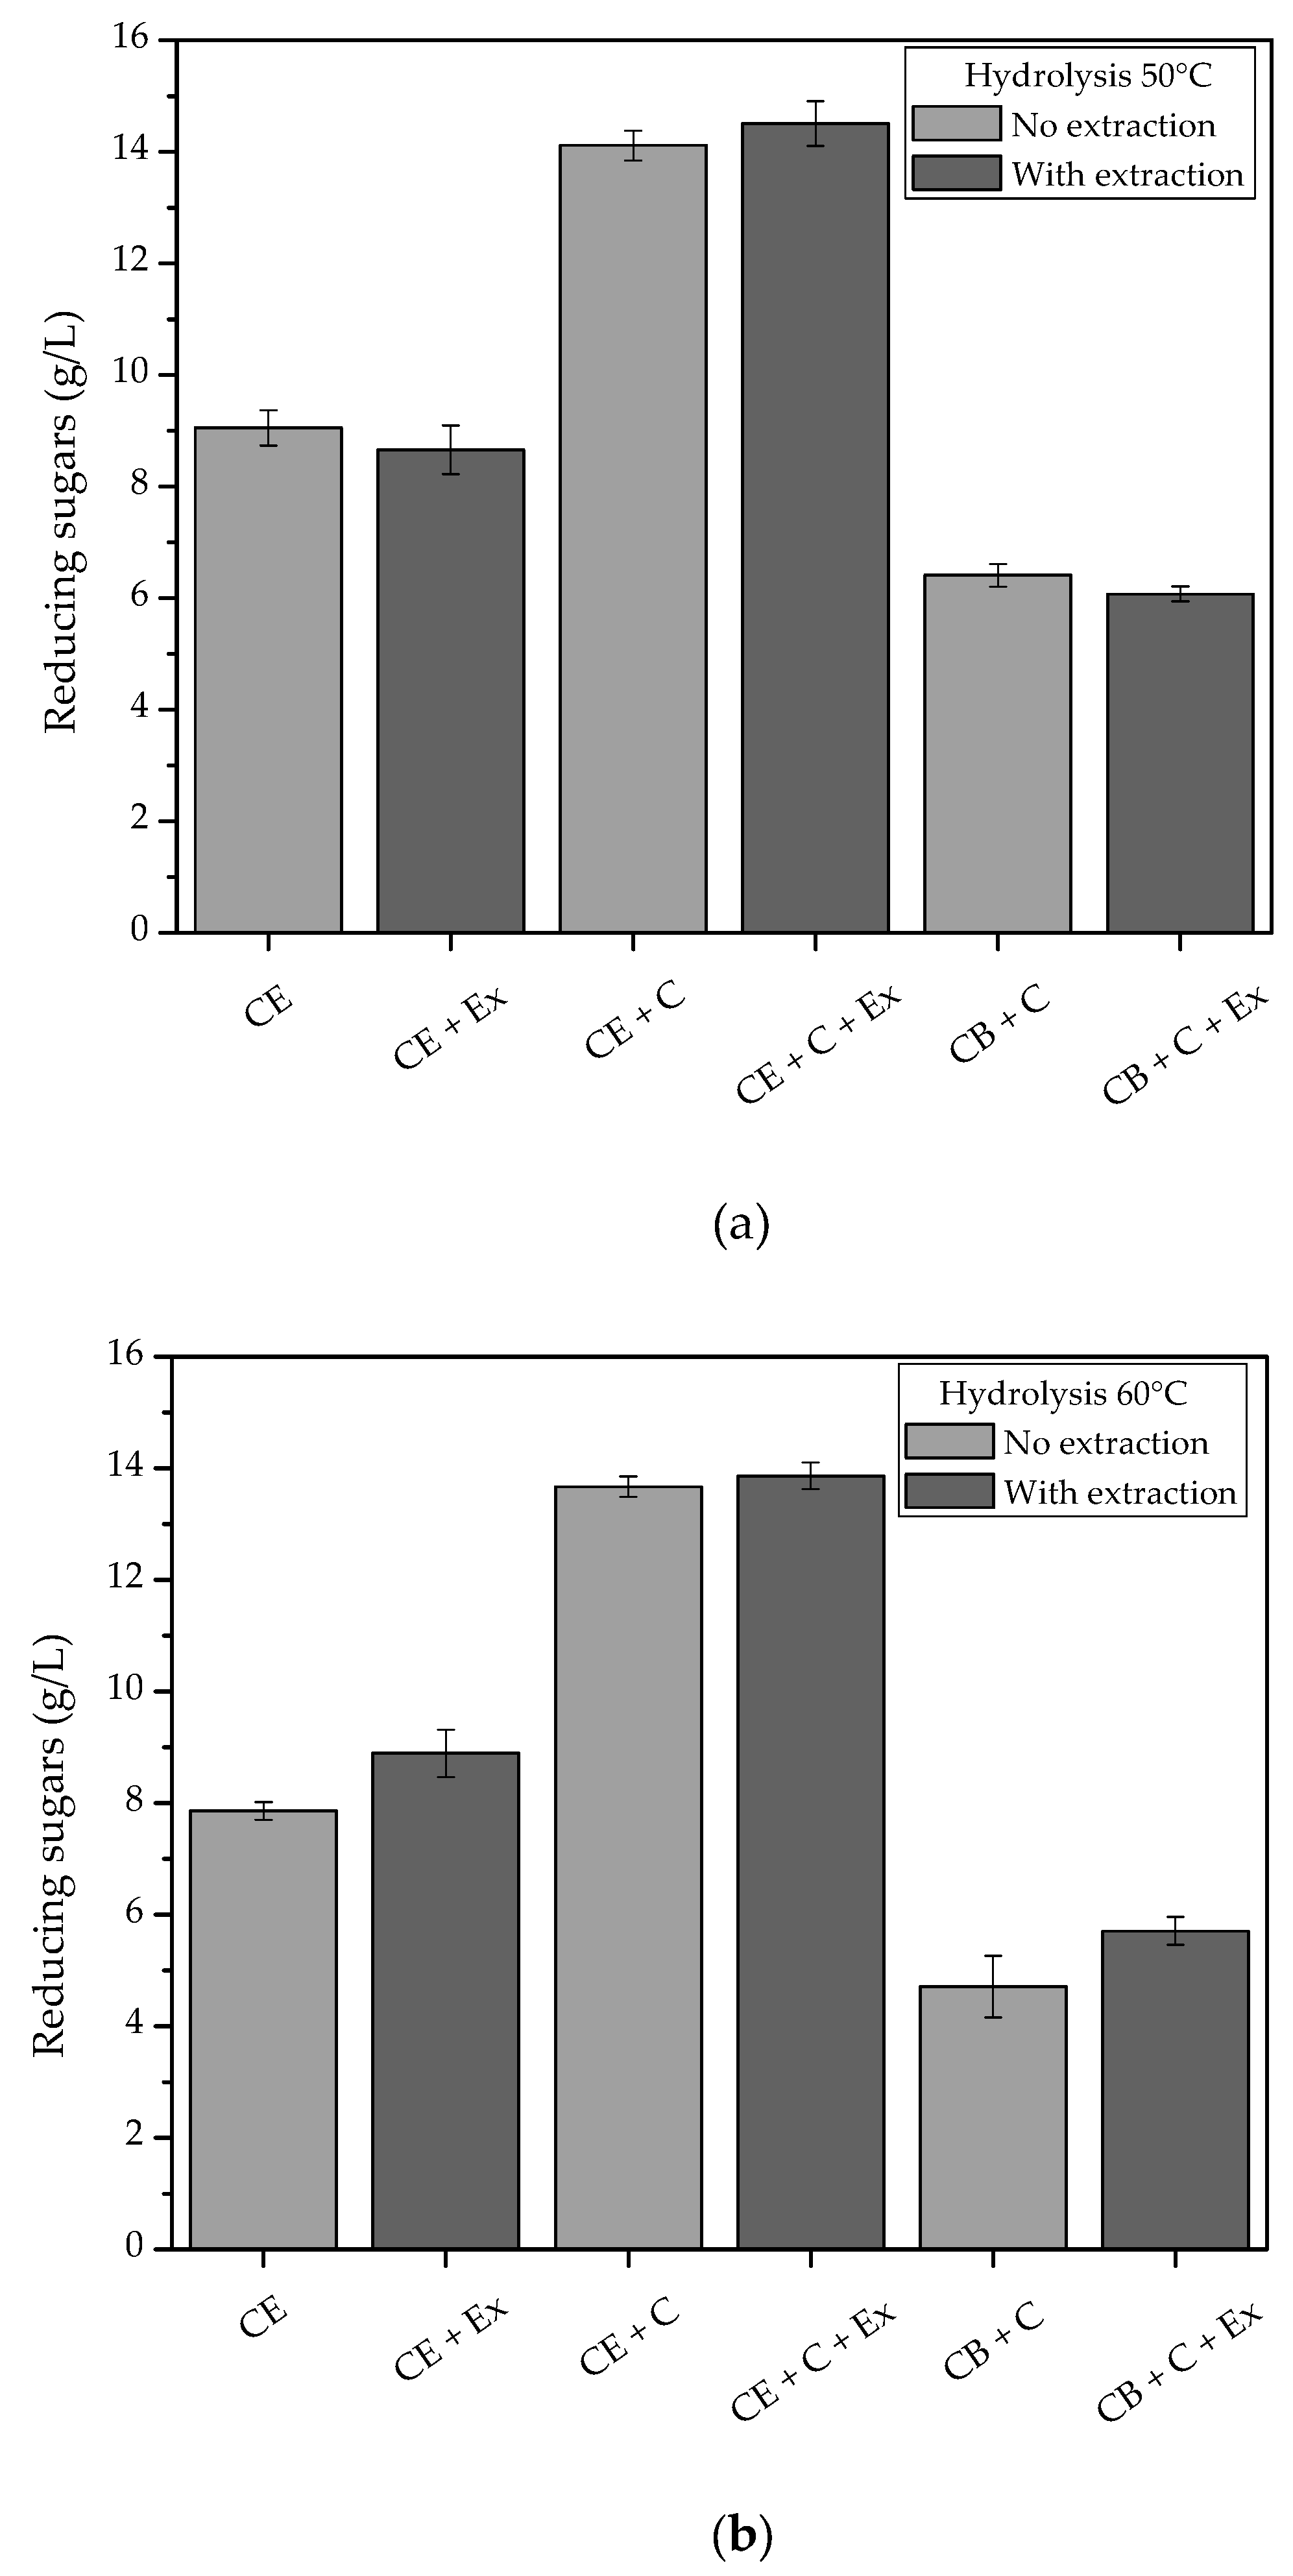
In order to determine the best conditions for enzymatic hydrolysis using the crude extract produced by A. niger F12, solids loadings of 5, 10, and 20% were studied, aiming at maximizing the release of reducing sugars from the coffee waste. The results showed that the release of reducing sugars from the hydrolyzed solids increased linearly up to a loading of 20%. It is important to use high concentrations of solids, in order to obtain high concentrations of products. However, high solids concentrations can hinder agitation and mass transfer, leading to process losses. In this case, a 20% solids loading was chosen, since it provided a reducing sugars concentration of approximately 9 g/L when hydrolyzed with the crude extract (CE).
The enzymatic extract produced by SSF was also used in combination with the commercial Cellic CTec3 enzymatic cocktail at 5 FPU/g, for the purpose of comparison. The combination of the crude extract with the commercial enzymes resulted in a 56% increase in hydrolysis, compared to the reaction using only the crude extract (
Figure 6). The addition of an extraction step 15 min after the enzymatic hydrolysis did not significantly increase the release of reducing sugars. The results indicated the potential for further studies of enzyme production by SSF with coffee waste and the use of these enzymes in enzymatic hydrolysis applications in the soluble coffee industry.
Baraldi et al. [
5] performed enzymatic hydrolysis with the fine extraction residue, using a commercial enzyme mixture for hydrolysis in a micro-reactor at 50 °C and pH 5.0. The time profile of reducing sugars release was very similar to that obtained here (data not shown). At 71 h of hydrolysis, Baraldi et al. [
5] obtained approximately 9 g/L of reducing sugars in hydrolysis using a solids loading of 10%, with release of nearly 70% of the reducing sugars after around 25 h of reaction. In this work, 13.6 ± 0.4 g/L of reducing sugars was released after 72 h of hydrolysis, when a solids loading of 20% was used. After 24 h of reaction, the release of the reducing sugars reached around 70%, showing the potential of the enzyme cocktail produced in this study for hydrolyzing coffee polysaccharides, despite being in the form of an unpurified crude extract.
In a recent study of the environmental impacts related to the recovery of cellulase produced in SSF with coffee husks [
48], comprising evaluation of the fermentation, extraction, and purification stages of the process, it was observed that the main environmental impact was related to the high energy consumption in the downstream steps after fermentation, especially in the operations for enzyme purification. In the present work, the results showed that the enzymes produced by SSF using coffee waste as substrate were able to hydrolyze coffee polysaccharides, despite the fact that the enzymes were in the form of a crude extract. Although further studies should be performed concerning the concentration and isolation of enzymes, together with evaluation of their specificities, the above evidence suggests that the β-mannanase enzymatic extract produced here from soluble coffee processing waste may be promising for applications in the soluble coffee industry.

 ,
, 


