Toolbox Accelerating Glycomics (TAG): Glycan Annotation from MALDI-TOF MS Spectra and Mapping Expression Variation to Biosynthetic Pathways

 , and
, and
Abstract
:1. Introduction
2. Materials and Methods
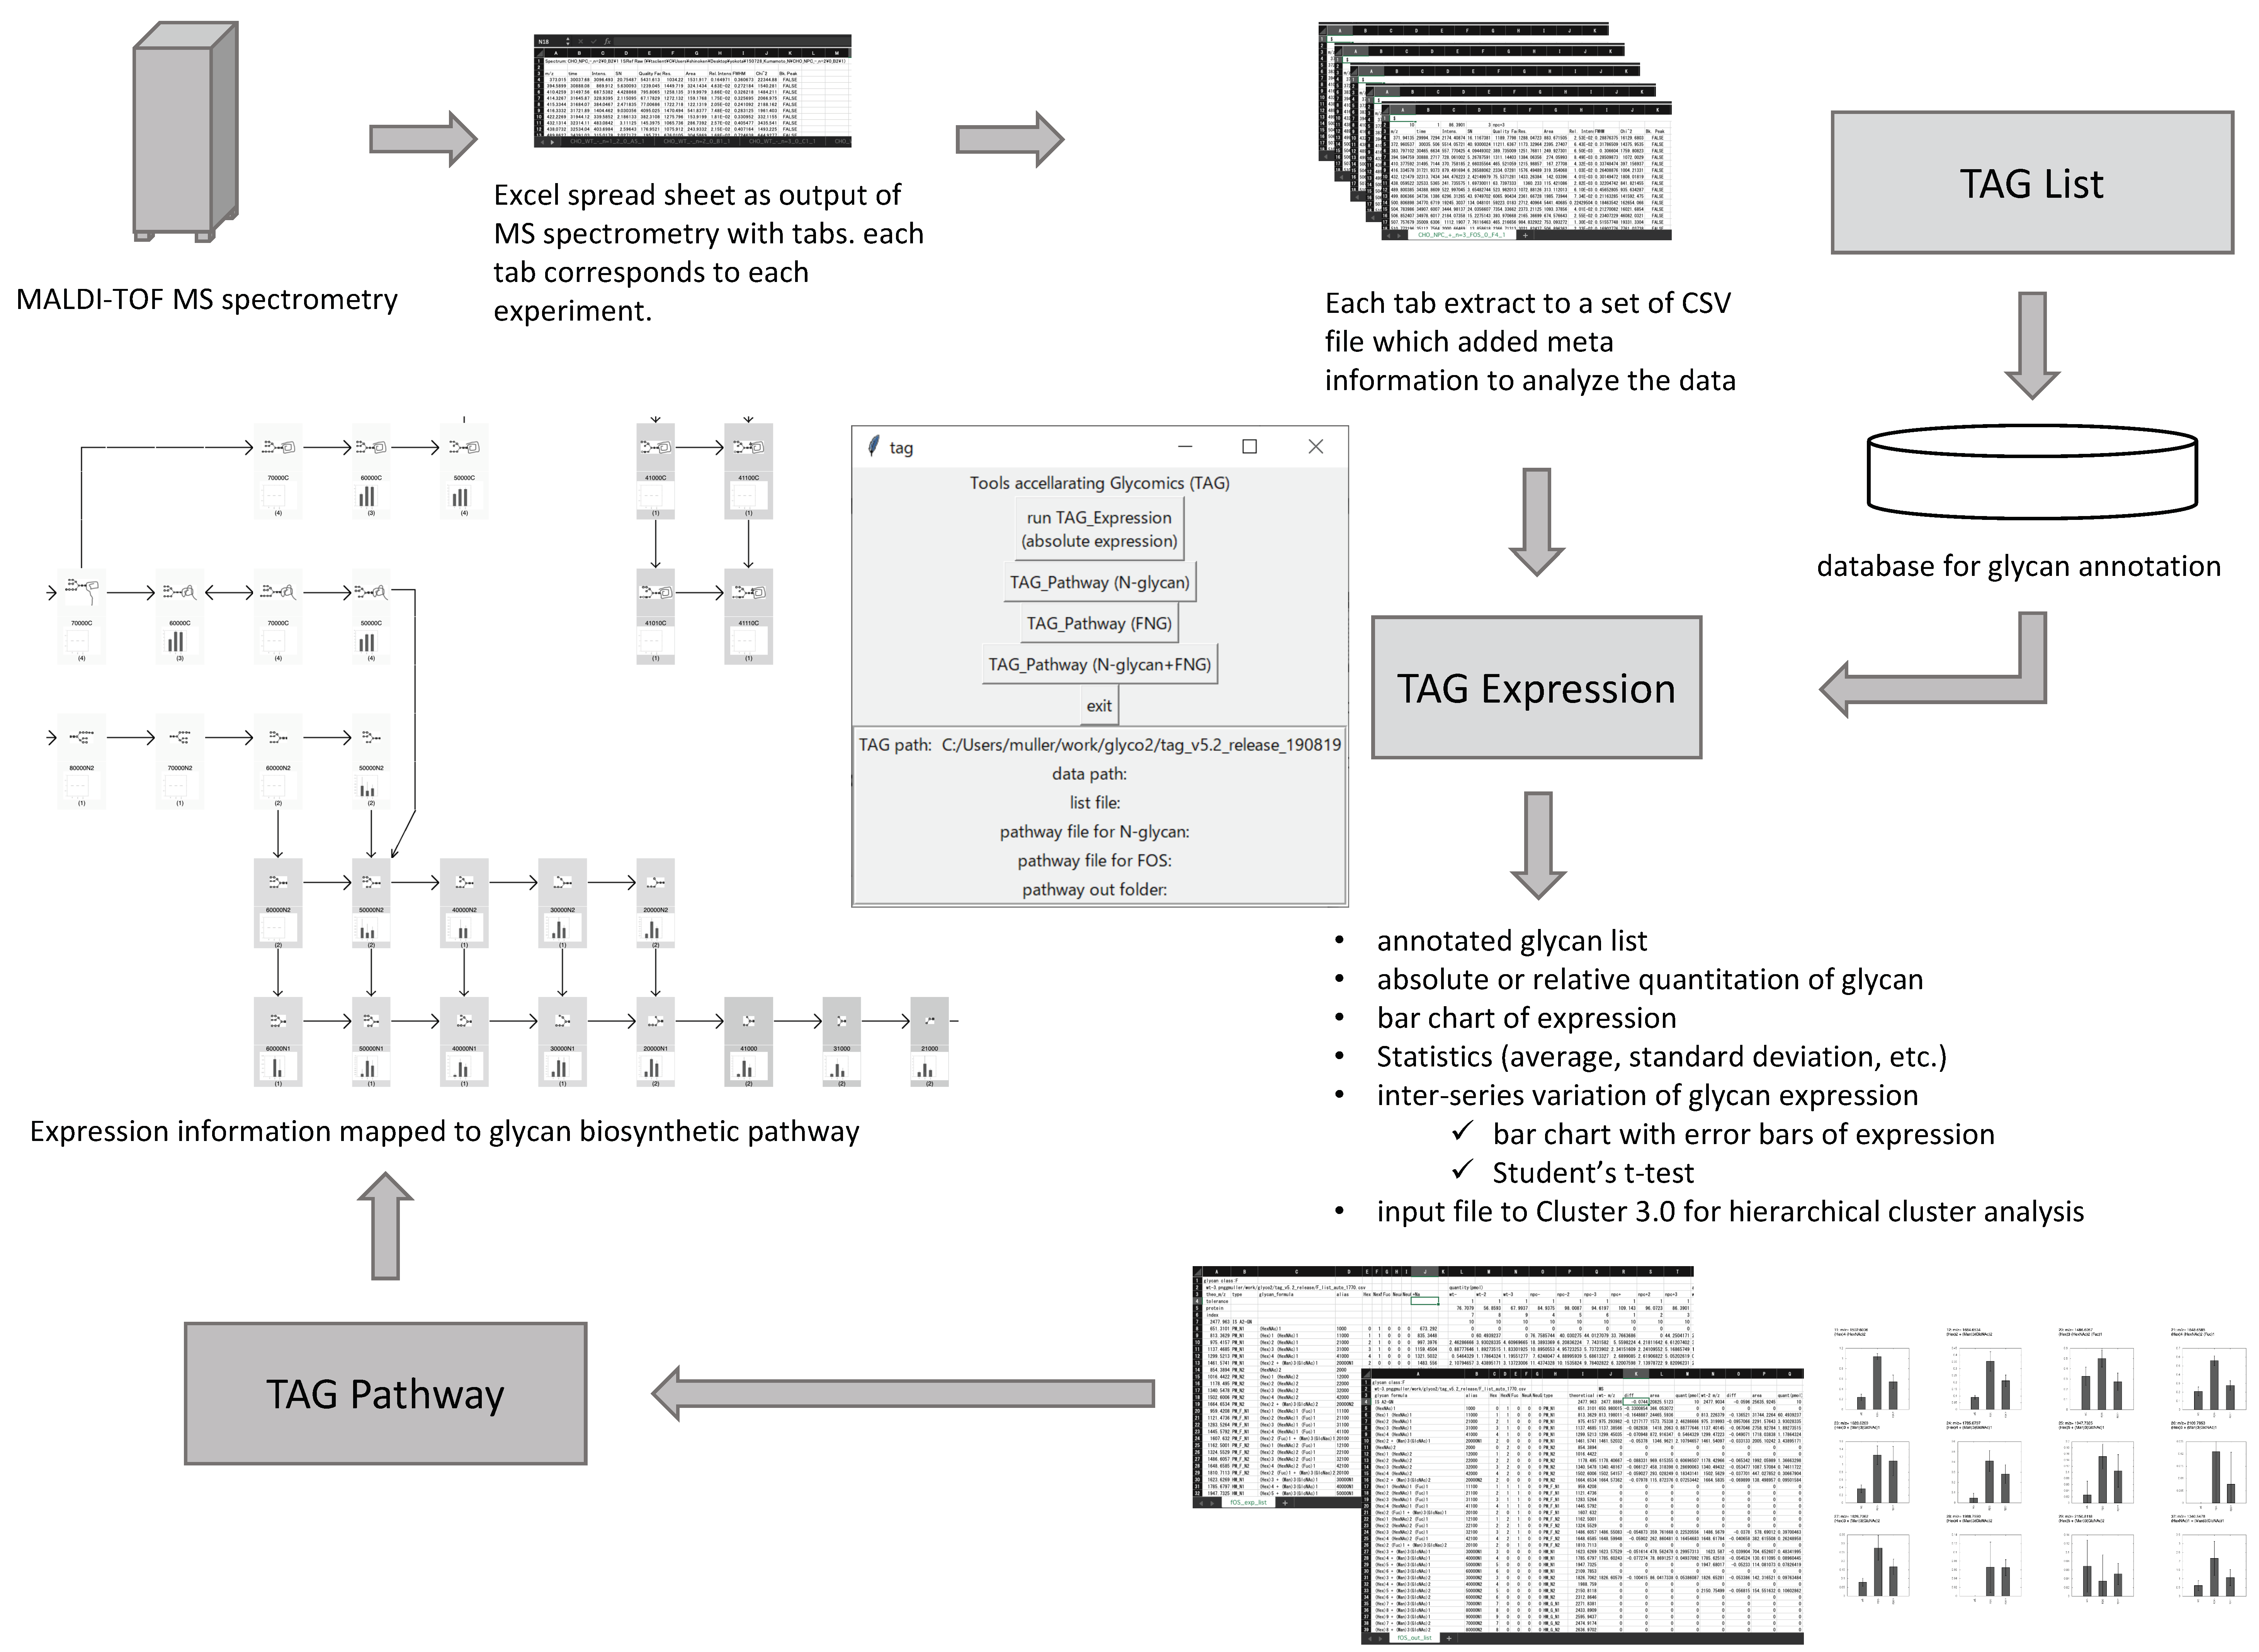
2.1. Overview of Toolbox Accelerating Glycomics (TAG)
2.2. Implementation of TAG
2.2.1. Interface
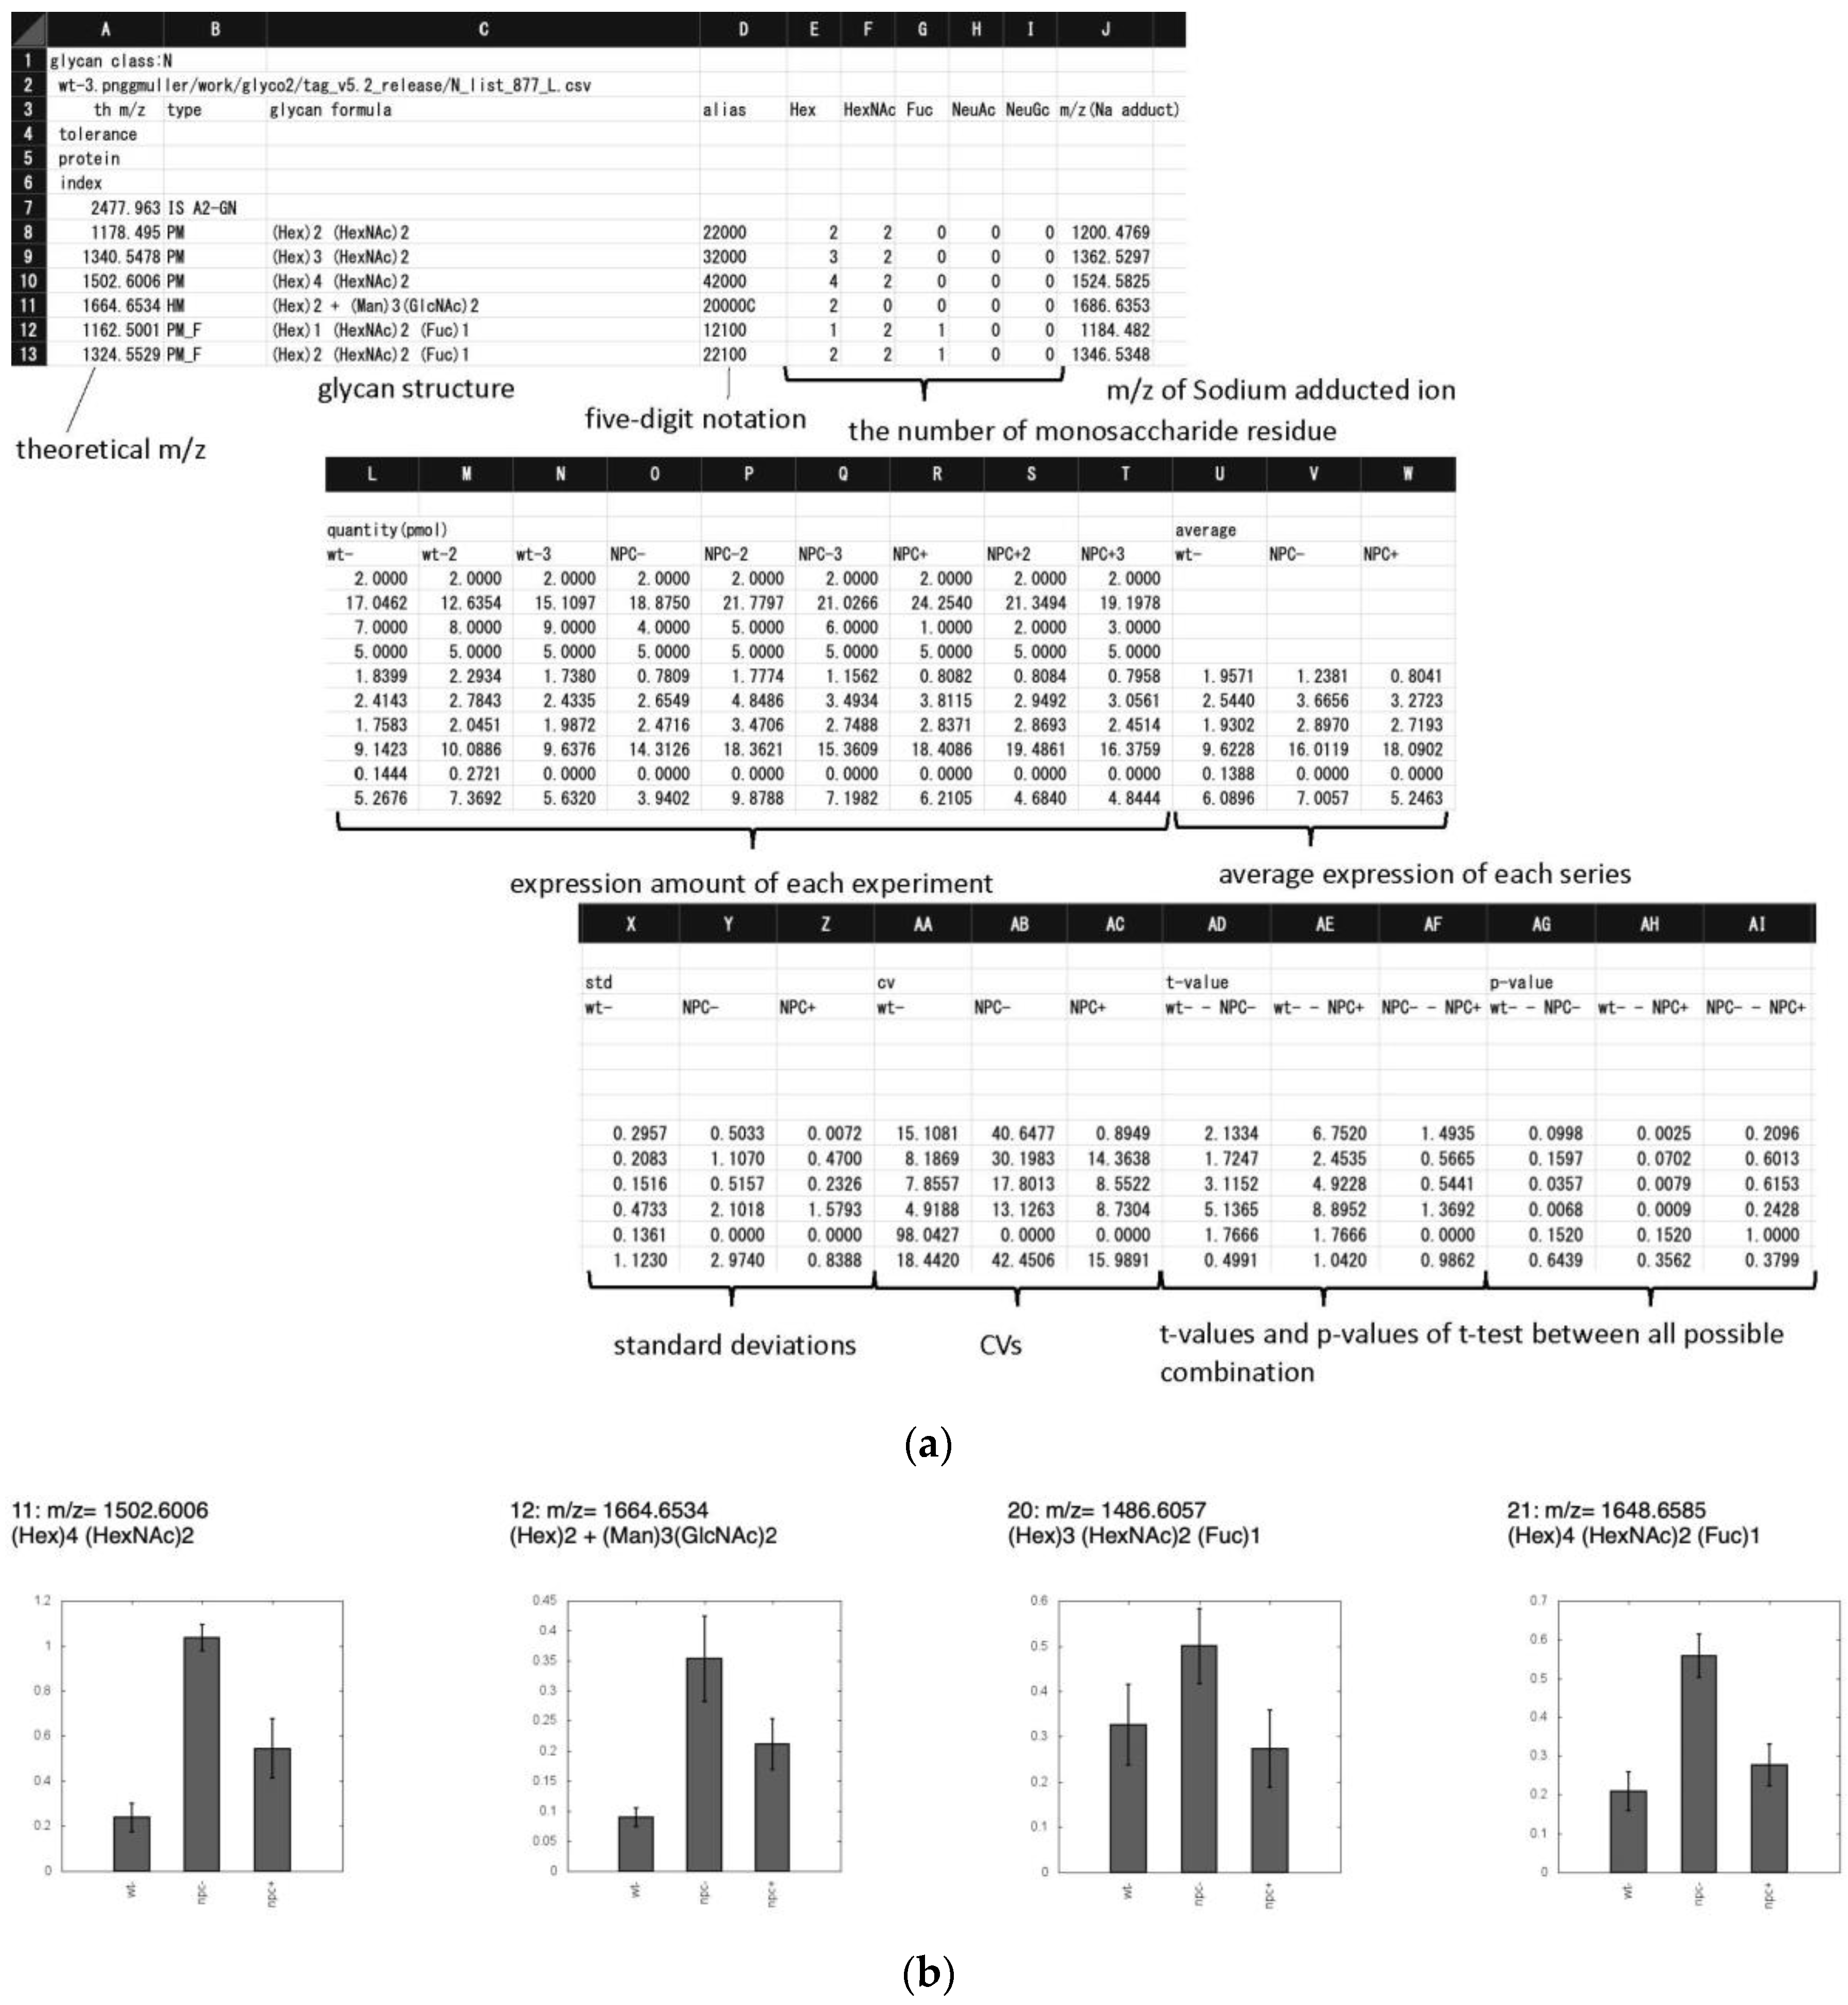
2.2.2. TAG List
2.2.3. TAG Expression
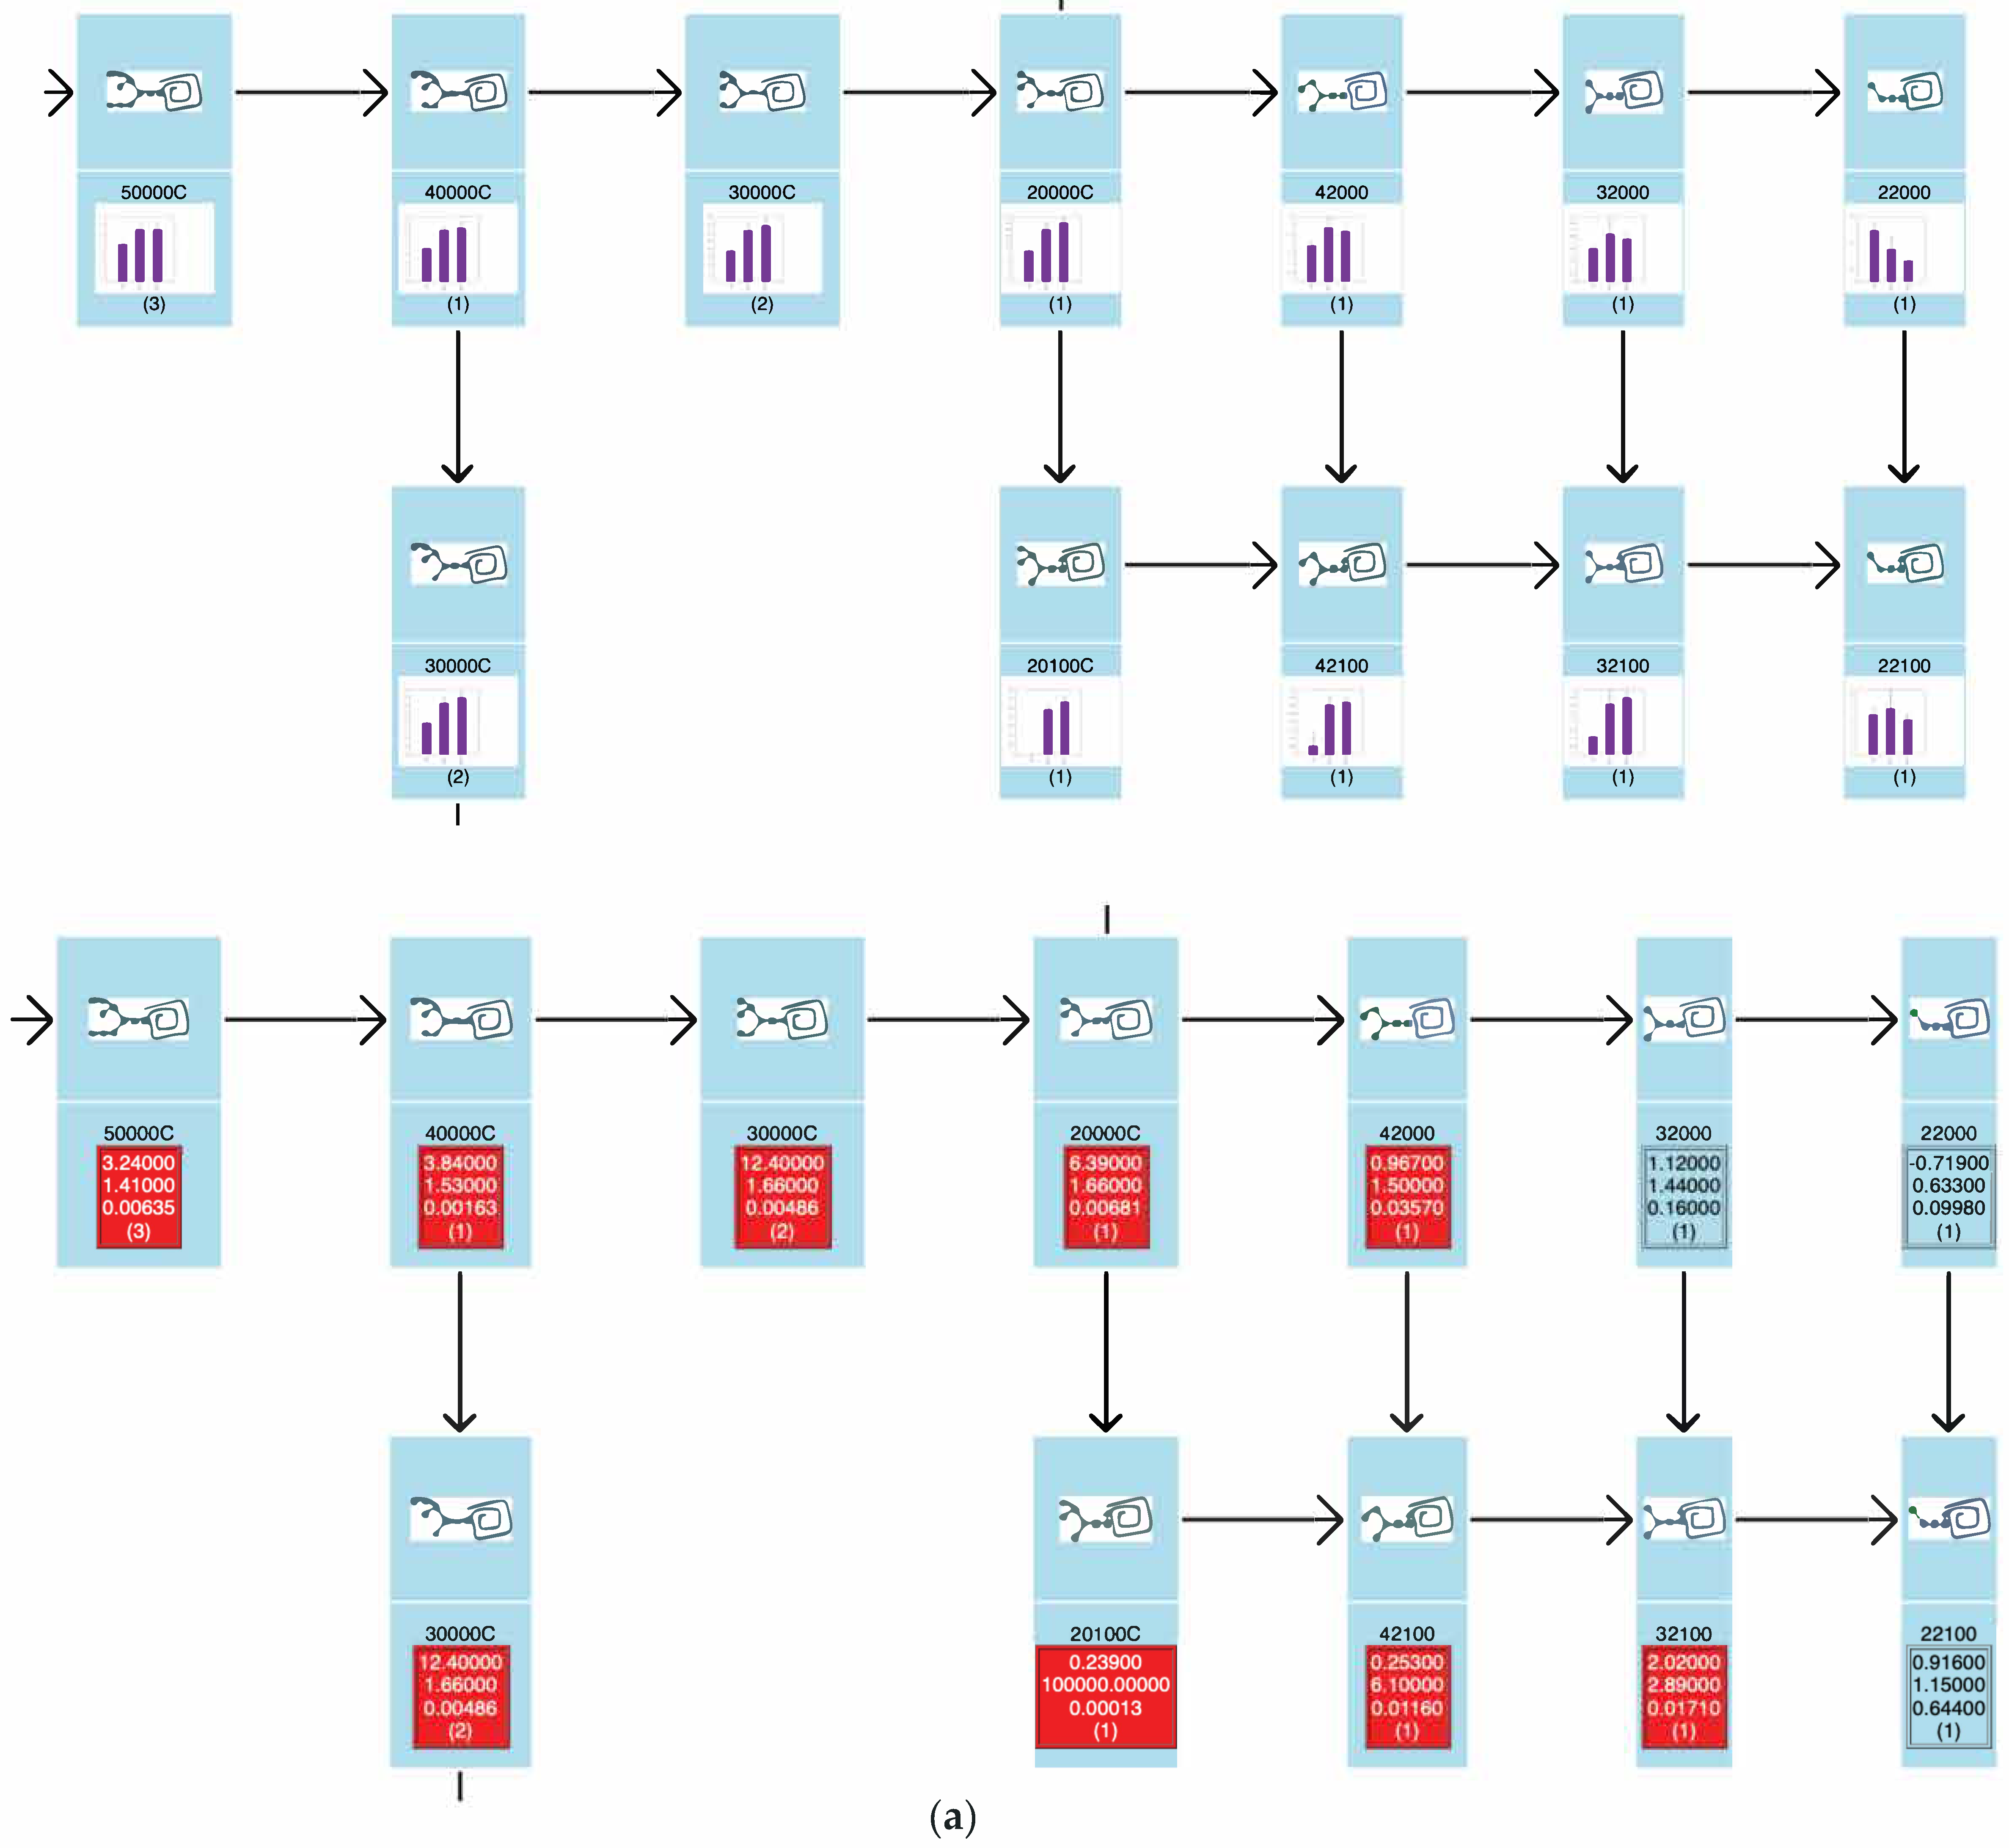
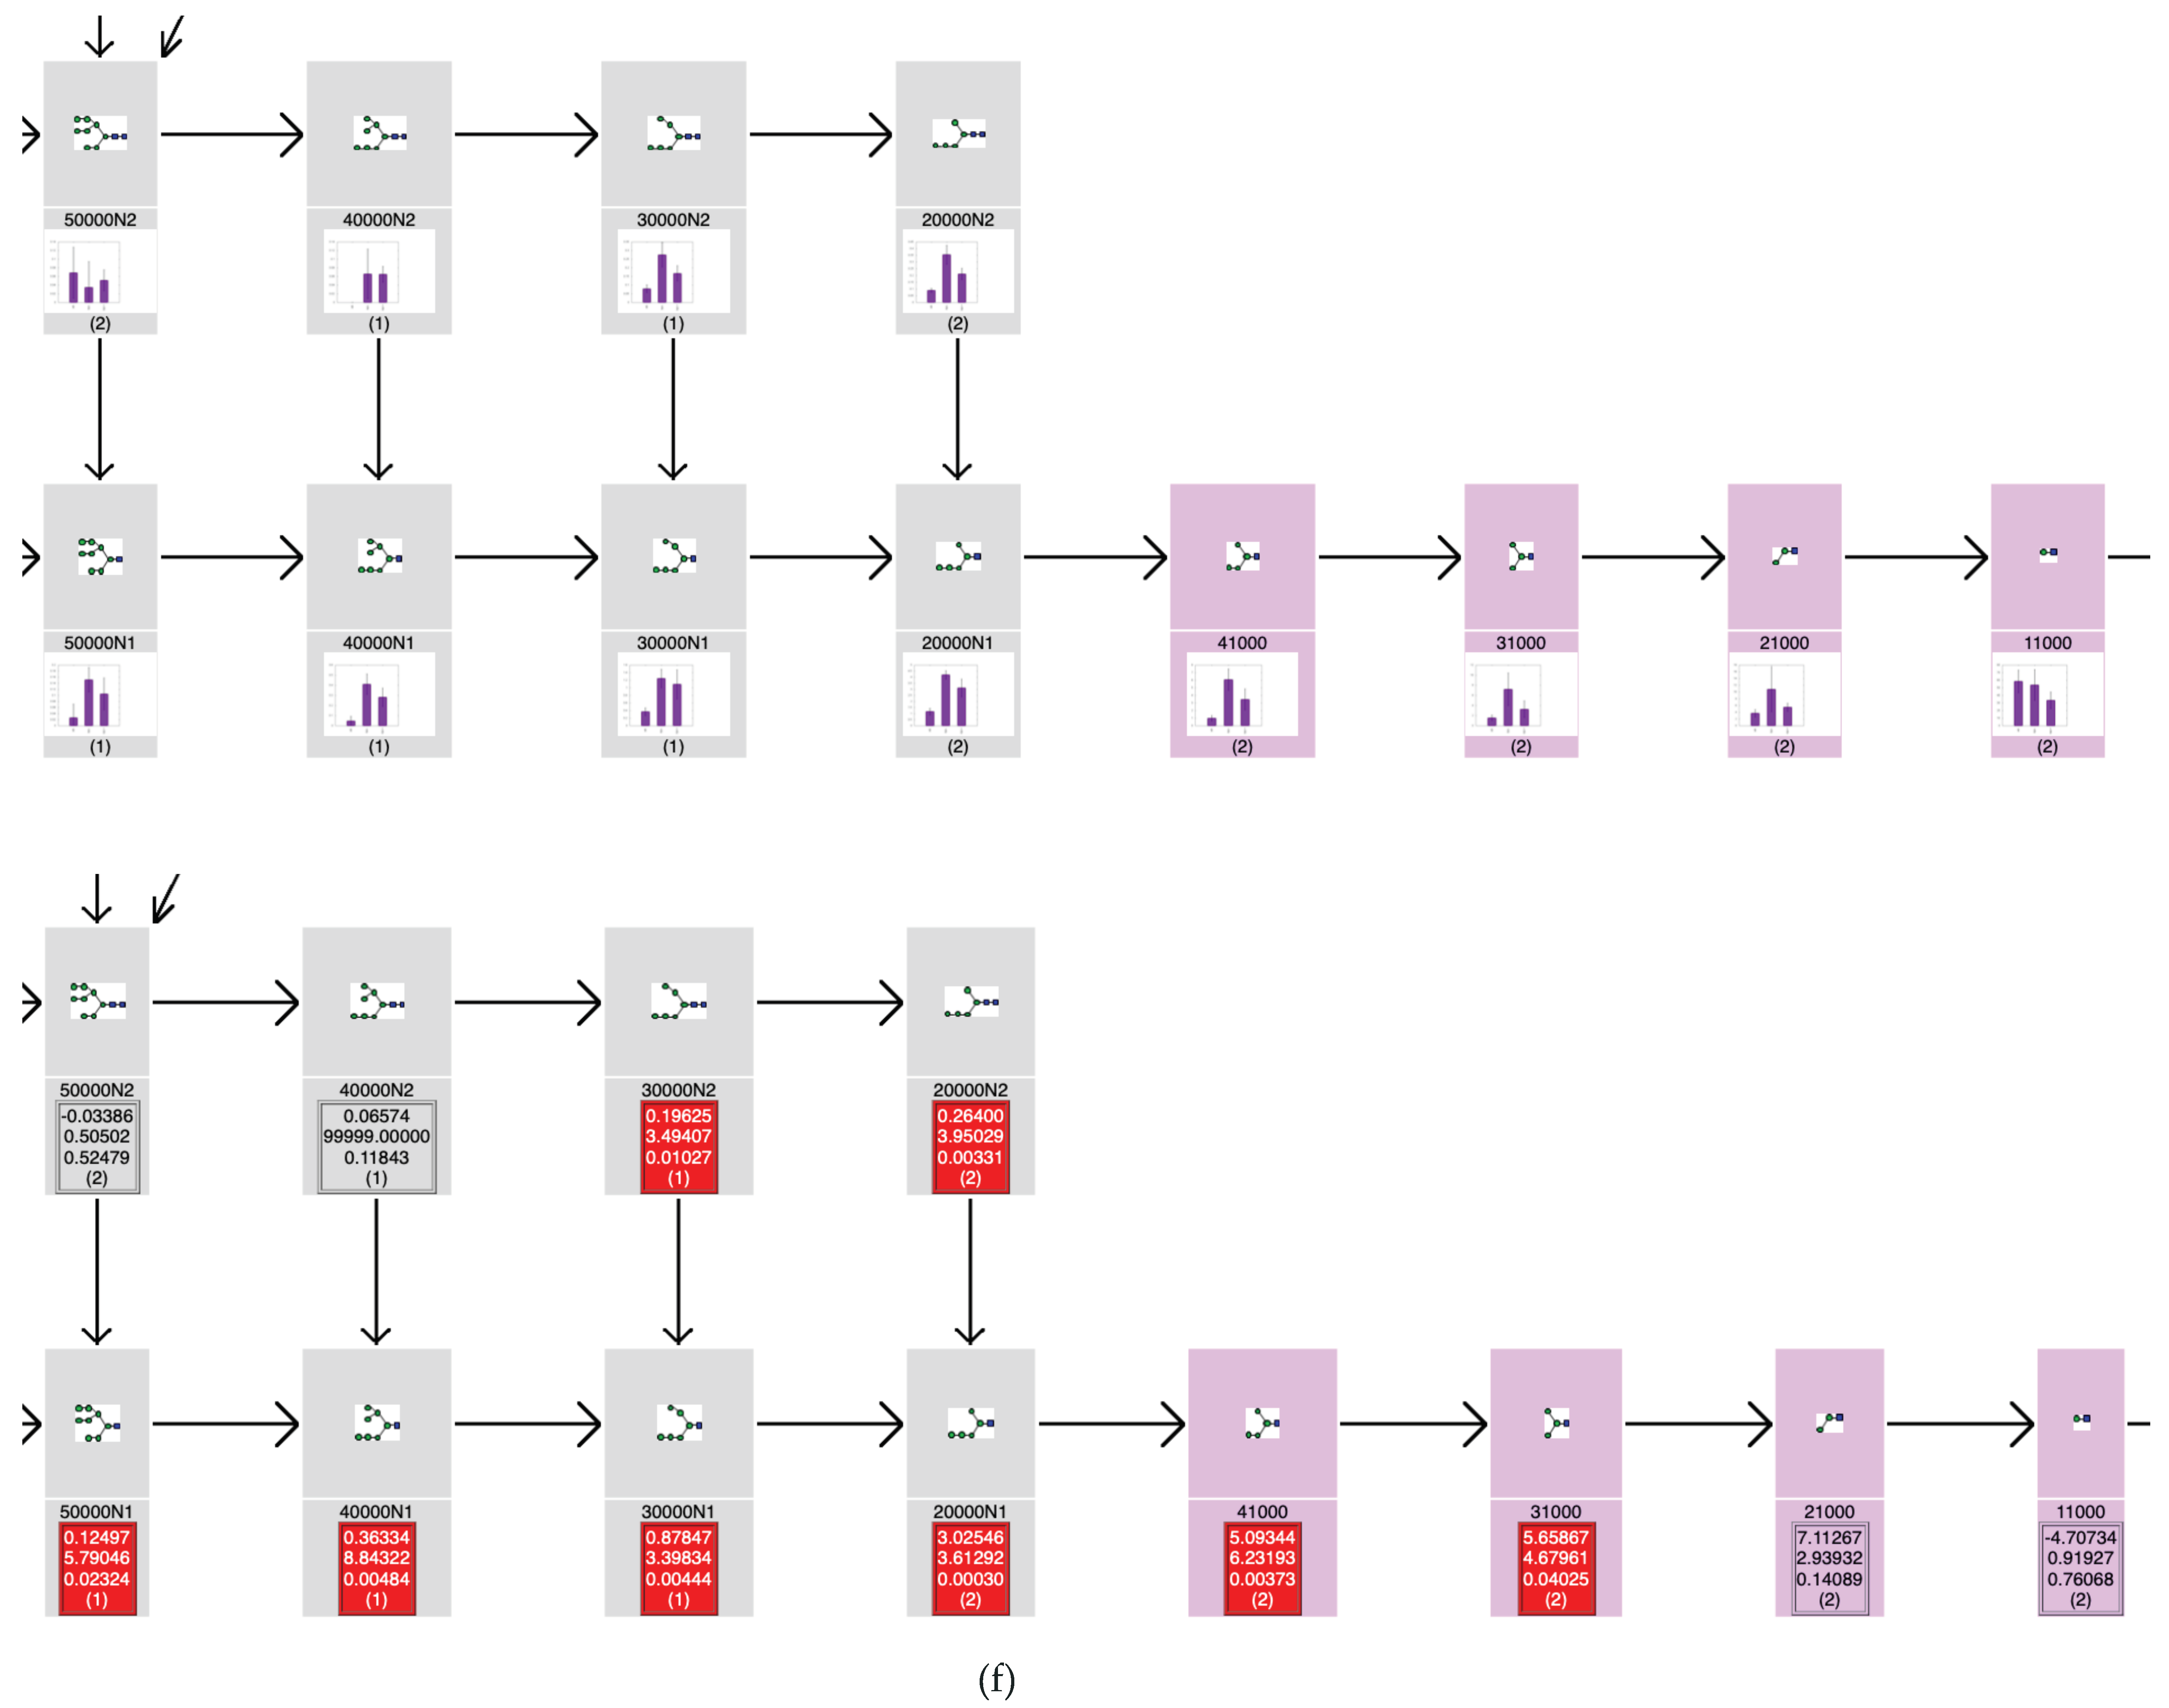
2.2.4. TAG Pathway
2.3. Experimental Glycomic Analysis of N-glycans and FNGs for Npc1 KO CHO Cells
2.3.1. Extraction of Cellular Glycoproteins and Free Oligosaccharides
2.3.2. Glycoblotting Procedure and MALDI-TOF/TOF MS Analysis
3. Results and Discussion
3.1. Glycan Expression Analysis of Npc1 KO CHO Cells
3.2. Glycan Expression Variation Mapped to Biosynthetic Pathways
4. Conclusions
Supplementary Materials
Author Contributions
Funding
Acknowledgments
Conflicts of Interest
References
- Varki, A. Biological roles of glycans. Glycobilogy 2017, 27, 3–49. [Google Scholar] [CrossRef] [Green Version]
- Varki, A. (Ed.) Essentials of Glycobiology, 3rd ed.; Cold Spring Harbor Laboratory Press: Cold Spring Harbor, NY, USA, 2017. [Google Scholar]
- Costa-Silva, J.; Domingues, D.; Lopes, F.M. RNA-seq differential expression analysis: An extended review and software tool. PLoS ONE 2017, 12, e0190152. [Google Scholar] [CrossRef] [PubMed] [Green Version]
- Tyanova, S.; Temu, T.; Cox, J. The MaxQuant Computational platform for mass spectrometry-based shotgun proteomics. Nat. Protoc. 2016, 11, 2301–2319. [Google Scholar] [CrossRef] [PubMed]
- Perkins, D.N.; Pappin, D.J.; Creasy, D.M.; Cottrell, J.S. Probability-based protein identification by searching sequence databases using mass spectrometry data. Electrophoresis 1999, 20, 3551–3567. [Google Scholar] [CrossRef]
- Craig, R.; Beavis, R.C. TANDEM: Matching proteins with tandem mass spectra. Bioinformatics 2004, 20, 1466–1467. [Google Scholar] [CrossRef]
- Ceroni, A.; Maass, K.; Ceyer, H.; Geyer, R.; Dell, A.; Haslam, S.M. GlycoWorkbench: A tool for the compueter-assisted annotation of mass spector of glycans. J. Proteome Res. 2008, 7, 1650–1659. [Google Scholar] [CrossRef] [Green Version]
- Svarovsky, S.A.; Joshi, L. Cancer glycan biomarkers and their detection—Past, present and future. Anal. Methods 2014, 6, 3918–3936. [Google Scholar] [CrossRef] [Green Version]
- Kanehisa, M.; Goto, S.; Furumichi, M.; Tanabe, M.; Hirakawa, M. KEGG for representation and analysis of molecular networks involving diseases and drugs. Nucleic Acids Res. 2010, 38, D355–D360. [Google Scholar] [CrossRef] [Green Version]
- Roche Biochemical Pathways. Available online: https://www.roche.com/sustainability/philanthropy/science_education/pathways.htm (accessed on 27 September 2020).
- Croft, D.; Mundo, A.F.; Haw, R.; Milacic, M.; Weiser, J.; Wu, G.; Caudy, M.; Garapati, P.; Gillespie, M.; Kamdar, M.R.; et al. The reactome pathway knowledgebase. Nucleic Acids Res. 2014, 42, D472–D477. [Google Scholar] [CrossRef]
- Eisen, M.B.; Spellman, P.T.; Brown, P.O.; Botstein, D. Cluster analysis and display of genome-wide expression patterns. Proc. Natl. Acad. Sci. USA 1998, 95, 14863–14868. [Google Scholar] [CrossRef] [Green Version]
- De Hoon, M.J.L.; Imoto, S.; Nolan, J.; Miyano, S. Open source clustering software. Bioinformatics 2004, 20, 1453–1454. [Google Scholar] [CrossRef] [PubMed] [Green Version]
- Saldanha, A.J. Java Treeview—Extensible visualization of microarray data. Bioinformatics 2004, 20, 3246–3248. [Google Scholar] [CrossRef] [PubMed] [Green Version]
- Gnuplot Homepage. Available online: http://www.gnuplot.info (accessed on 28 September 2020).
- Gawk—GNU Project—Free Software Foundation (FSF). Available online: https://www.gnu.org/software/gawk/ (accessed on 27 September 2020).
- Fujitani, N.; Furukawa, J.-I.; Araki, K.; Fujioka, T.; Takegawa, Y.; Piao, J.; Nishoka, T.; Tamura, T.; Nikaido, T.; Ito, M.; et al. Total cellular glycomics allows characterizing cells and streamlining the discovery process for cellular biomarkers. Porc. Nat. Am. Soc. 2013, 110, 2105–2110. [Google Scholar] [CrossRef] [Green Version]
- Furukawa, J.-I.; Sakei, S.; Yokota, I.; Okada, K.; Hanamatsu, H.; Kobayashi, T.; Yoshida, Y.; Higashino, K.; Tamura, T.; Igarashi, Y.; et al. Quantitative GSL-glycome analysis of human whole serum based on an EGCase digestion and glycoblotting method. J. Lipid Res. 2015, 56, 2399–2407. [Google Scholar] [CrossRef] [Green Version]
- Naven, T.J.; Harvey, D.J. Effect of structure on the signal strength of oligosaccharides in matrix-assisted laser desorption/ionization mass spectrometry on time-of-flight and magnetic sector instruments. Rapid Commun. Mass Spectrom. 1996, 10, 1361–1366. [Google Scholar] [CrossRef]
- Harada, Y.; Buser, R.; Ngwa, E.M.; Hirayama, H.; Aebi, M.; Suzuki, T. Eukaryotic oligosaccharyltransferase generates free oligosaccharides during N-glycosylation. J. Biol. Chem. 2013, 288, 32673–32684. [Google Scholar] [CrossRef] [PubMed] [Green Version]
- Harada, Y.; Masahara-Negishi, Y.; Suzuki, T. Cytosolic-free oligosaccharides are predominantly generated by the degradation of dolichol-linked oligosaccharides in mammalian cells. Glycobiology 2015, 25, 1196–1205. [Google Scholar] [CrossRef] [Green Version]
- Harada, Y.; Nakajima, K.; Masahara-Negishi, Y.; Freeze, H.H.; Angata, T.; Taniguchi, N.; Suzuki, T. Metabolically programmed quality control system for dolichol-linked oligosaccharides. Proc. Natl. Acad. Sci. USA 2013, 110, 19366–19371. [Google Scholar] [CrossRef] [Green Version]
- Harada, Y.; Huang, C.; Yamaki, S.; Dohmae, N.; Suzuki, T. Non-lysosomal degradation of phophorylated oligosaccharides is initiated by the cytosolic endo-β-N-acetylglucosaminidase. J. Biol. Chem. 2016, 291, 8048–8058. [Google Scholar] [CrossRef] [Green Version]
- Suzuki, T.; Huang, C.; Fujihira, H. The cytoplasmic peptide:N-glycanase (NGLY1); structure, expression and cellular functions. Gene 2016, 577, 1–7. [Google Scholar] [CrossRef] [Green Version]
- Suzuki, T. The cytoplasmic peptide:N-glycanase (PNGase)—Basic science encounters a human genetic disorder. J. Biochem. 2015, 157, 23–34. [Google Scholar] [CrossRef] [PubMed] [Green Version]
- Furukawa, J.-I.; Soga, M.; Okada, K.; Yokota, I.; Piao, J.; Irie, T.; Era, T.; Shinohara, Y. Impact of the Niemann-Pick c1 gene mutation on the total cellular glycomics of CHO cells. J. Proteome Res. 2017, 16, 2802–2810. [Google Scholar] [CrossRef] [PubMed]
- Furukawa, J.-I.; Shinohara, Y.; Kuramoto, H.; Miura, Y.; Shimaoka, H.; Kurogochi, M.; Nakano, M.; Nishimura, S. Comprehensive approach to structural and functional glycomics based on chemoselective glycoblotting and sequential tag conversion. Anal. Chem. 2008, 80, 1094–1101. [Google Scholar] [CrossRef] [PubMed]
- Fan, M.; Sidhu, R.; Fujiwara, H.; Tortelli, B.; Zhang, J.; Davidson, C.; Walkley, S.U.; Bagel, J.H.; Vite, C.; Yanjanin, N.M.; et al. Identification of Niemann-Pick C1 disease biomarkers through sphingolipid profiling. J. Lipid Res. 2013, 54, 2800–2814. [Google Scholar] [CrossRef] [Green Version]
- Hashimoto, N.; Matsumoto, I.; Takahashi, H.; Ashikawa, H.; Nakamura, H.; Murayama, T. Cholesterol-dependent increases in glucosylceramide synthase activity in Niemann-Pick disease type C model cells: Abnormal trafficking of endogenously formed ceramide metabolites by inhibition of the enzyme. Neuropharmacology 2016, 110, 458–469. [Google Scholar] [CrossRef]
- Mbua, N.E.; Flanagan-Steet, H.; Johnson, S.; Wolfert, M.A. Abnormal accumulation and recycling of glycoproteins visualized in Niemann-Pick type C cells using the chemical reporter strategy. Proc. Natl. Acad. Sci. USA 2013, 110, 10207–10212. [Google Scholar] [CrossRef] [Green Version]
- Biggle, J.C.; Patel, T.P.; Bruce, J.A.; Goulding, P.N.; Charles, S.M.; Parekh, R.B. Nonselective and Efficient Fluorescent Labeling of Glycans Using 2-Amino Benzamide and Anthranilic Acid. Anal. Bicochem. 1995, 230, 229–238. [Google Scholar] [CrossRef]
- Kaser, T.; Pavić, T.; Lauc, G.; Gornik, O. Comparison of 2-Aminobenzamide, Procainamide and RapiFluor-MS as Derivatizing Agents for High-Throughput HILIC-UPLC-FLR-MS N-glycan Analysis. Front. Chem. 2018, 6, 324. [Google Scholar] [CrossRef]
- Nishikaze, T.; Tsumoto, H.; Sekiya, S.; Iwamoto, S.; Miura, Y.; Tanaka, K. Differentiation of Sialyl Linkage Isomers by One-Pot Sialic Acid Derivatization for Mass Spectrometry-Based Glycan Profiling. Anal. Chem. 2017, 89, 2353–2360. [Google Scholar] [CrossRef]
- Hanamatsu, H.; Nishikaze, T.; Miura, N.; Piao, J.; Okada, K.; Sekiya, S.; Iwamoto, S.; Sakamoto, N.; Tanaka, K.; Furukawa, J.-I. Sialic Acid Linkage-Specific Derivatization of GlycoSphingolipid Glycans by Ring-Opening Aminolysis of Lactones. Anal. Chem. 2018, 90, 13193–13199. [Google Scholar] [CrossRef]


| Button Name | Function |
|---|---|
| TAG List | Generating a glycan list to be employed in TAG Expression. TAG List is a separate program written in the awk script language. |
| TAG Expression | Glycan annotation, quantitation, statistical analysis, graphing. |
| TAG Pathway (N-glycan) | Visualizing variation in N-glycan expression based on N-glycan biosynthetic pathways. |
| TAG Pathway (FOS) | Visualizing variation in FNG expression based on FNG biosynthetic pathways. |
| TAG Pathway (N-glycan + FOS) | Visualizing variation in both N-glycans and FNGs based on N-glycan and FNG biosynthetic pathways. |
| Cell Position | Data Type | Data |
|---|---|---|
| A2 | Real number | Quantity of internal standard. |
| B2 | Real number | Error tolerance for precursor m/z. |
| C2 | Real number | Total quantity (µg) of protein. |
| D2 | Integer | Number to distinguish experimental groups. For example, in the case of the current analysis (see text), wt(−) 1 is 1, NPC(−) is 2, and NPC(+) 1 is 3. |
| E2 | Strings | Short name of the experiment. For example, in the case of the current analysis (see text), wt(−), NPC(−), and NPC(+) fall under this category. |
© 2020 by the authors. Licensee MDPI, Basel, Switzerland. This article is an open access article distributed under the terms and conditions of the Creative Commons Attribution (CC BY) license (http://creativecommons.org/licenses/by/4.0/).
Share and Cite
Miura, N.; Hanamatsu, H.; Yokota, I.; Okada, K.; Furukawa, J.-I.; Shinohara, Y. Toolbox Accelerating Glycomics (TAG): Glycan Annotation from MALDI-TOF MS Spectra and Mapping Expression Variation to Biosynthetic Pathways. Biomolecules 2020, 10, 1383. https://0-doi-org.brum.beds.ac.uk/10.3390/biom10101383
Miura N, Hanamatsu H, Yokota I, Okada K, Furukawa J-I, Shinohara Y. Toolbox Accelerating Glycomics (TAG): Glycan Annotation from MALDI-TOF MS Spectra and Mapping Expression Variation to Biosynthetic Pathways. Biomolecules. 2020; 10(10):1383. https://0-doi-org.brum.beds.ac.uk/10.3390/biom10101383
Chicago/Turabian StyleMiura, Nobuaki, Hisatoshi Hanamatsu, Ikuko Yokota, Kazue Okada, Jun-Ichi Furukawa, and Yasuro Shinohara. 2020. "Toolbox Accelerating Glycomics (TAG): Glycan Annotation from MALDI-TOF MS Spectra and Mapping Expression Variation to Biosynthetic Pathways" Biomolecules 10, no. 10: 1383. https://0-doi-org.brum.beds.ac.uk/10.3390/biom10101383