
ECMpy, a Simplified Workflow for Constructing Enzymatic Constrained Metabolic Network Model


Biodesign Center, Key Laboratory of Systems Microbial Biotechnology, Tianjin Institute of Industrial Biotechnology, Chinese Academy of Sciences, Tianjin 300308, China
*
Author to whom correspondence should be addressed.
†
These authors contributed equally to this work.
Biomolecules 2022, 12(1), 65; https://0-doi-org.brum.beds.ac.uk/10.3390/biom12010065
Submission received: 30 November 2021
/
Revised: 25 December 2021
/
Accepted: 30 December 2021
/
Published: 2 January 2022
(This article belongs to the Special Issue Computational Biology for Metabolic Modelling and Pathway Design)
Abstract
:Genome-scale metabolic models (GEMs) have been widely used for the phenotypic prediction of microorganisms. However, the lack of other constraints in the stoichiometric model often leads to a large metabolic solution space being inaccessible. Inspired by previous studies that take an allocation of macromolecule resources into account, we developed a simplified Python-based workflow for constructing enzymatic constrained metabolic network model (ECMpy) and constructed an enzyme-constrained model for Escherichia coli (eciML1515) by directly adding a total enzyme amount constraint in the latest version of GEM for E. coli (iML1515), considering the protein subunit composition in the reaction, and automated calibration of enzyme kinetic parameters. Using eciML1515, we predicted the overflow metabolism of E. coli and revealed that redox balance was the key reason for the difference between E. coli and Saccharomyces cerevisiae in overflow metabolism. The growth rate predictions on 24 single-carbon sources were improved significantly when compared with other enzyme-constrained models of E. coli. Finally, we revealed the tradeoff between enzyme usage efficiency and biomass yield by exploring the metabolic behaviours under different substrate consumption rates. Enzyme-constrained models can improve simulation accuracy and thus can predict cellular phenotypes under various genetic perturbations more precisely, providing reliable guidance for metabolic engineering.
1. Introduction
Accurate prediction of metabolic phenotypes of an organism is a key goal of computational biology and has attracted more and more attention from researchers. For this purpose, many genome-scale metabolic models have been developed [1,2] and successfully applied for guiding metabolic engineering based on flux balance analysis (FBA) and other stoichiometry-based methods [3,4]. However, in many cases, a microorganism shows suboptimal metabolism [5,6] that is inconsistent with the optimal solution of FBA [7], implying that the metabolic capacity of an organism is also constrained by other factors. For example, overflow metabolism, involving incomplete oxidation of glucose to fermentation byproducts such as acetate and ethanol instead of using respiratory pathway even in the presence of oxygen [8] cannot be properly explained by models only considering reaction stoichiometries. Studies suggested that it is likely to be caused by the limited amount of protein molecules within the cell [9].
In recent years, researchers proposed several new methods that introduced new constraints such as cell volume limitation [10], protein resource allocation [11], enzyme activity and total protein mass [12,13], thermodynamics [14] into the model along with the stoichiometric constraints. FBA with molecular crowding (FBAwMC) [10] introduced both the crowding coefficient and cell volume constraint to limit the space occupied by enzymes. With the new constraints, the method successfully simulated the substrate hierarchy utilization in E. coli [10]. Adadi et al. further extended FBAwMC by introducing known enzyme kinetic parameters and proposed a new method called MOMENT (metabolic modeling with enzyme kinetics), which improved the prediction accuracy of intracellular fluxes and enzyme gene expression values [15]. In 2017, Sanchez et al. proposed a new construction workflow of the enzyme-constrained model (GECKO, genome-scale model to account for enzyme constraints, using kinetics and omics), which used an average enzyme saturation coefficient and determined the fraction of enzyme proteins from proteomics data [16]. They developed an enzyme-constrained model for S. cerevisiae using GECKO and made an accurate prediction of several metabolic phenotypes [16]. However, introducing the enzyme constraints into the original metabolic model using GECKO needs to be extensively revised by modifying every metabolic reaction with a pseudo-metabolite representing an enzyme and adding hundreds of exchange reactions for enzymes, which is complex and significant increases the model size. Bekiaris et al. further provided an automatic workflow (AutoPACMEN) for the construction of enzyme-constrained models inspired by MOMENT and GECKO, which only introduced one pseudo-reaction and pseudo-metabolite [17]. These two construction processes, GECKO and AutoPACMEN, have greatly facilitated the construction of enzyme-constrained models for each species, and successfully constructed for S. cerevisiae [16], Bacillus subtilis [18], Bacillus coagulans [19], E. coli [20] and Streptomyces coelicolor [21], which have successfully applied to target prediction for enhancing the yield of products [18,20,21].
In the current study, we propose a simpler workflow called ECMpy by explicitly introducing an enzyme constraint without modifying existing metabolic reactions or adding new reactions. Using ECMpy workflow, we constructed a high-quality enzyme-constrained model for E. coli (eciML1515) based on its latest metabolic model iML1515 [22], high coverage of enzyme kinetics data gathering from the literature [23], and automated enzyme kinetic parameter calibration process. We demonstrated that eciML1515 could simulate the sub-optimal metabolism such as overflow metabolism and the maximal growth rates under different carbon sources. The whole process for model construction and simulation is available at GitHub (https://github.com/tibbdc/ECMpy, accessed on 25 December 2021) for users to easily reproduce the results and use it as a reference to build enzyme-constrained models for other organisms.
2. Materials and Methods
2.1. The Workflow of ECMpy
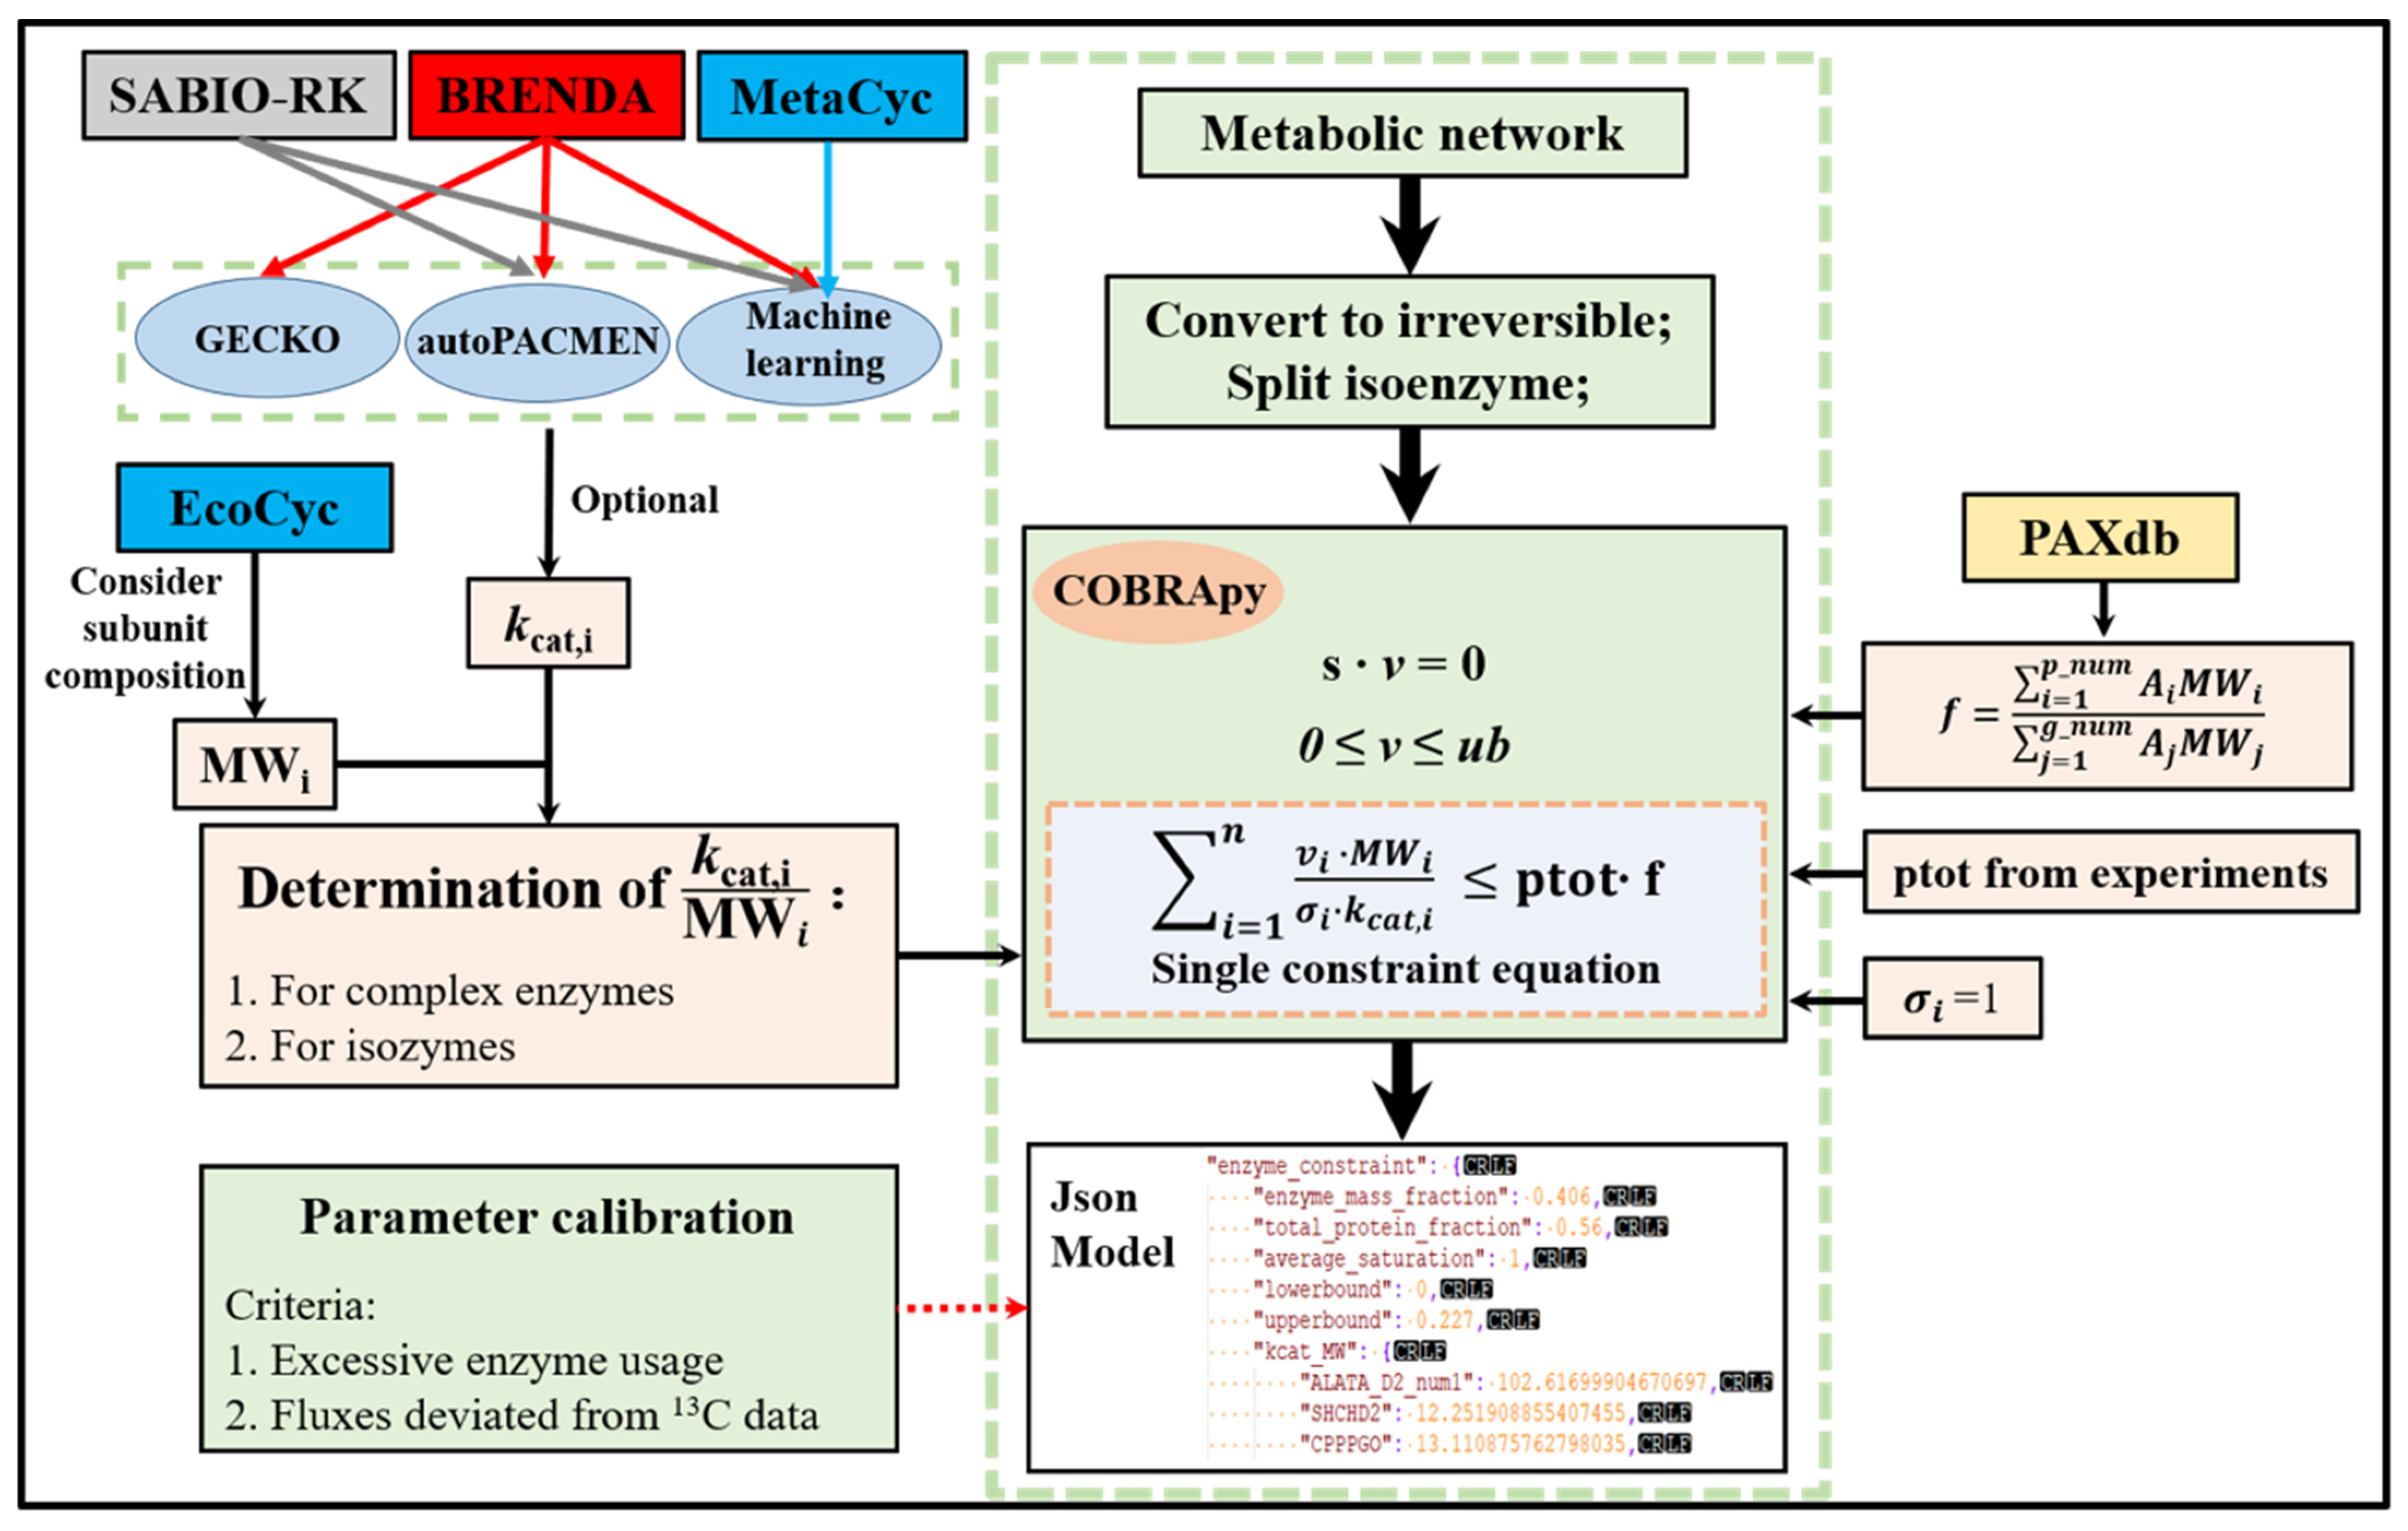
A metabolic network (like iML1515 model in this study) was used as the initial model for the construction of enzyme-constrained models according to the workflow shown in Figure 1. Firstly, reversible reactions in the model were divided into two irreversible reactions because of different kcat values. The stoichiometric constraints (Equation (1)) and reversibility constraints (Equation (2)) used were the same as in flux balance analysis [24]. A new enzymatic constraint (Equation (3)) was introduced into the model, where ptot and f represent the total protein fraction in E. coli and the mass fraction of enzymes, respectively. The enzyme mass fraction f was calculated based on Equation (4) where Ai and Aj represented the abundances (mole ratio) of the i-th protein (p_num represented proteins expressed in the model) and j-th protein (g_num represented proteins expressed in the whole proteome). MWi and kcat,i were molecular weight and turnover number of an enzyme catalyzing reaction i. For reactions catalyzed by multiple isoenzymes, a reaction can be split into multiple reactions. For reactions catalyzed by enzyme complex, using the minimum value of protein in complex (, m is the number of proteins in complex). was the saturation coefficient of i-th enzyme.
2.2. Calibration of the Original kcat Values
Generally, enzyme-constrained models need model validation (e.g., adjust the original kcat values to some extent to improve the agreement of model predictions with experimental data), similar to the way in GECKO and AutoPACMEN [17]. We proposed two principles (enzyme usage and 13C flux consistency) to adjust the original kcat values, as follows: First, a reaction with an enzyme usage exceeding 1% of the total enzyme content requires parameter correction; Second, a reaction with the kcat multiplied by 10% of the total enzyme amount () is less than the flux determined by 13C experiment needs to be corrected. All the kcat data used for correction comes from BRaunschweig ENzyme DAta base (BRENDA) and System for the Analysis of Biochemical Pathways - Reaction Kinetics databases (SABIO-RK) (using the maximum kcat value).
2.3. Simulation
We stored enzyme constraint information and metabolic network into JavaScript Object Notation (JSON) format, as the Systems Biology Markup Language (SBML) format cannot save enzyme constraints due to COBRApy [25] limitations. Then, we directly read the JSON file to obtain the enzyme-constrained model using the ‘get_enzyme_constraint_model’ function written by us. This transformed enzyme-constrained model is consistent with classical constraint-based models in format, which means that functions in COBRApy can be used directly on this model.
To evaluate eciML1515′s ability to predict growth rates, we compared the predicted results of iML1515 and eciML1515 with experimental results performed by Adadi et al. [15], respectively. Specially, we set the upper bound of substrate uptake rate to 10 mmol/gDW/h and measured E. coli’s growth rates on 24 single carbon sources (e.g., acetate, fructose, fumarate and et al.). For comparison of each method on 24 single carbon sources, the model and experimental results were used to calculate the estimation error of the growth rate (Equation (5)) [26] and normalized flux error (Equation (6)) [27].
In addition to the maximal growth rates under different carbon sources, we also explored the overflow metabolic behaviours of E. coli. Especially, the growth rate is fixed (from 0.1 h−1 to 0.65 h−1) and glucose is supplied infinitely. Besides, we calculated the reaction enzyme cost (Equation (7)), energy synthesis enzyme cost (Equation (8)) and oxidative phosphorylation ratio (Equation (9)) to explore the adjustment strategy of E. coli’s overflow metabolic pathway.
To obtain the trade-off between yield () and enzyme usage efficiency (), we developed a new method (Equations (10)–(14)) to calculate the minimum enzyme amount () inspired by pFBA (parsimonious FBA) [28]. When simulation, we set the concentration of glucose from 1 mmol/gDW/h to 10 mmol/gDW/h).
3. Results
3.1. Construction of the Enzyme-Constrained Model of iML1515 by ECMpy
The iML1515 model was used as the initial model for the construction of the enzyme-constrained model. During the process, we observed that some errors in iML1515 (e.g., GPR relationships, reaction direction and EC number, et al.) and corrected them based on information from the Encyclopedia of Escherichia coli genes and metabolism database (EcoCyc) [29] (see Table S1 for details). Then, we divided reversible reactions in iML1515 into two irreversible reactions and split reactions catalyzed by multiple isoenzymes into different reactions (append num in reaction ID, e.g., ALATA_D2_num1). We found that the subunit composition of different proteins in E. coli differed significantly (Figure S1), so we took the subunit composition of proteins into account when calculating protein molecular weights. The molecular weights, subunit composition of enzymes in iML1515 were obtained from EcoCyc. GECKO and sMOMENT (AutoPACMEN for E. coli) used the in vitro kcat which was obtained in labour-intensive, low-throughput in vitro assays and resulted in only a small fraction of cellular enzymes having a measured kcat even in model organisms [30]. That is why we used the kcat values derived from machine learning methods performed by Heckmann et al. [23]. In the model, kcat values were assigned to 2432 enzymatic reactions, and the coverage exceeds 60% (including isozyme split reactions and reversible split reactions, exclude exchange reactions), which is larger than the GECKO and sMOMENT (the number of reactions that matched EC number and substrate at the same time was only about 387). The protein fraction ptot was set at 0.56 g gDW−1 based on the experimentally measured macromolecular composition of E. coli cells [31,32]. The E. coli protein abundance values were obtained from the Protein abundance database (PAXdb) (https://pax-db.org/, accessed on 25 December 2021) [33] and the ‘whole organism (integrated)’ dataset with the highest coverage and credibility was selected. According to Equation (4), f was calculated to be 0.406 g enzyme/g protein.
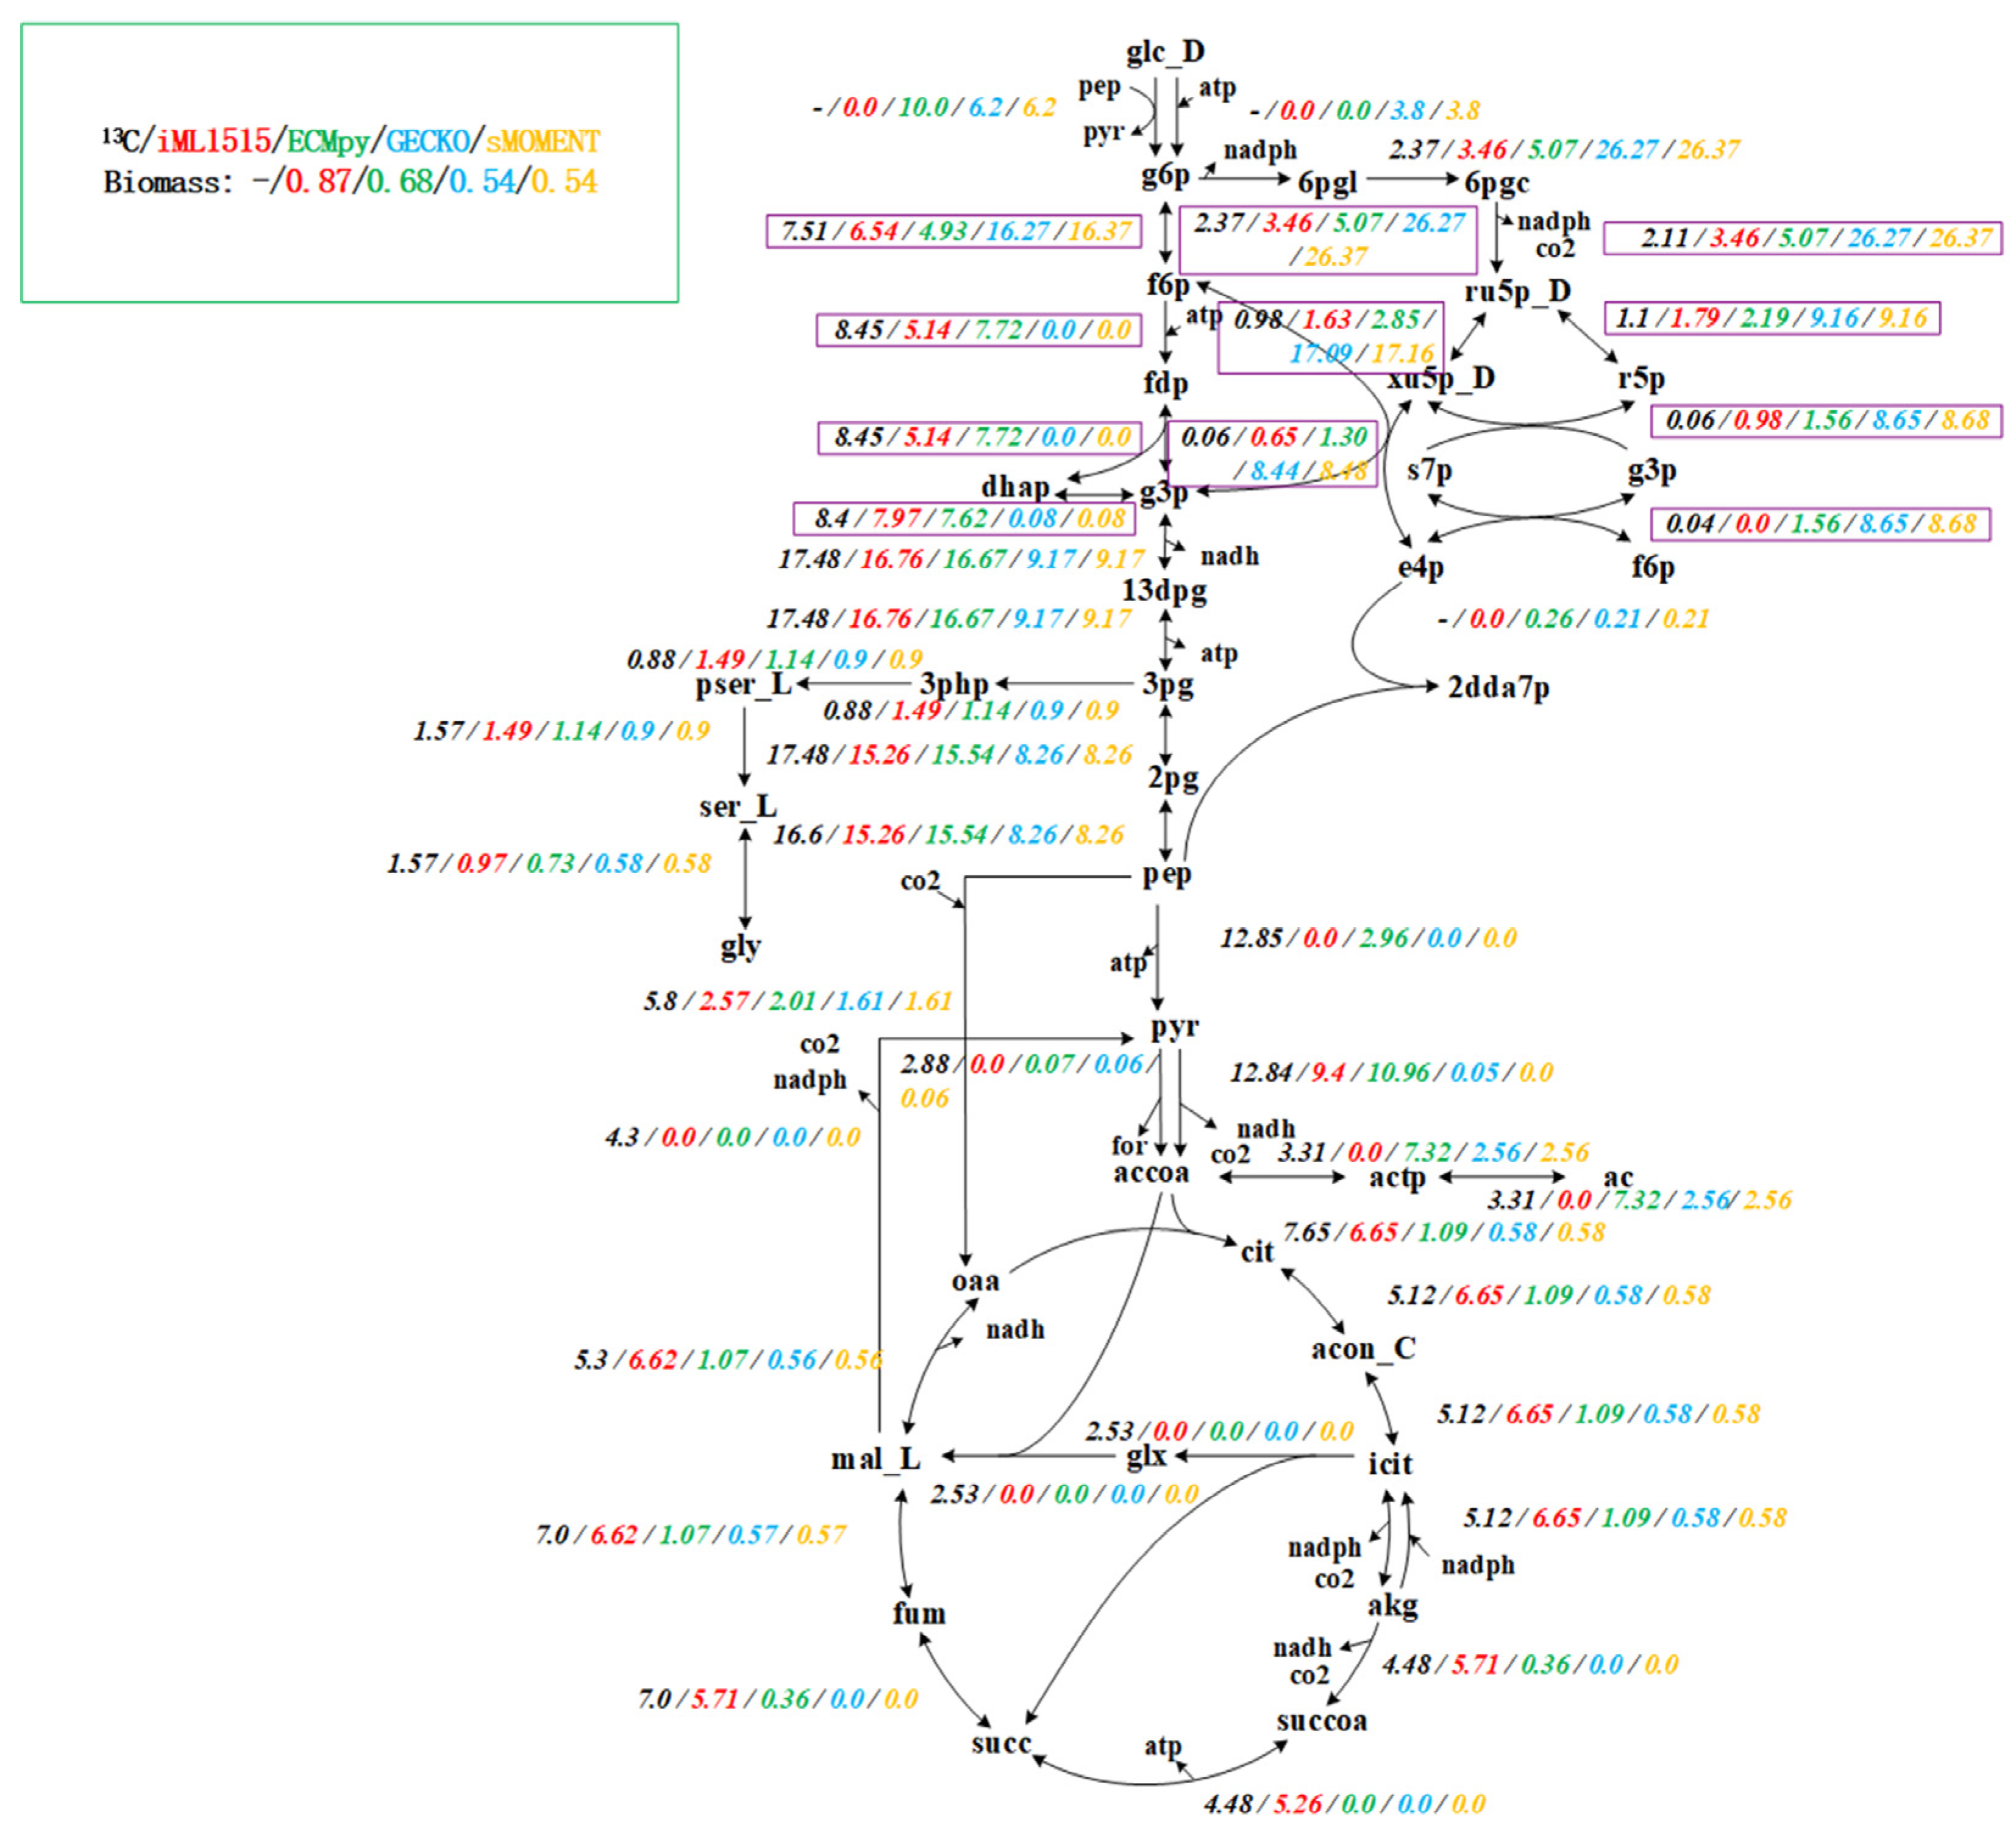
However, the flux of growth rate predicted by this initial model is low and the conversion of phosphoenolpyruvate to the TCA pathway is abnormal (Figure S2). We first calibrated the reaction according to the enzyme usage, and changed 14 reactions (See Table S2 for details). The flux of growth rate predicted by the calibrated model increased to 0.5594 h−1, but the conversion of phosphoenolpyruvate to the TCA pathway was still abnormal (Figure S2). Subsequently, we compared with the 13C experimental data [34] and found that the kcat value of two reactions (PDH: pyruvate to acetyl-CoA and AKGDH: 2-oxoglutarate to succinyl-CoA) is low, which is mainly caused by the subunit composition of these two reactions is complicated and the protein molecular weight is very large. After calibration using 13C data (changed two reactions, Table S2), the growth rate increased to 0.6802 h−1, and the consistency with the pathway obtained by 13C data reached 92.1% (Figure S3). Different from other methods for constructing enzyme-constrained models, our method considers the composition of protein subunits and realizes enzyme constraint by simply adding the total enzyme amount equation (Table 1). Therefore, the enzyme-constrained model we constructed does not change the stoichiometric matrix format (because the isoenzyme reaction and reversible reaction were split, the number of reactions increased), and the solution and subsequent operations of the entire model are consistent with the classical constraint-based model. We used AutoPACMEN to build the GECKO and sMOMENT model of iML1515, and compared them with ECMpy. We found that when considering the subunit composition of protein, the growth rate predicted by GECKO and sMOMENT model is lower, and the flux distribution of the pathway is abnormal from the 13C data, especially the EMP pathway (Figure 2, purple boxes).
3.2. Overflow Metabolism of E. coli
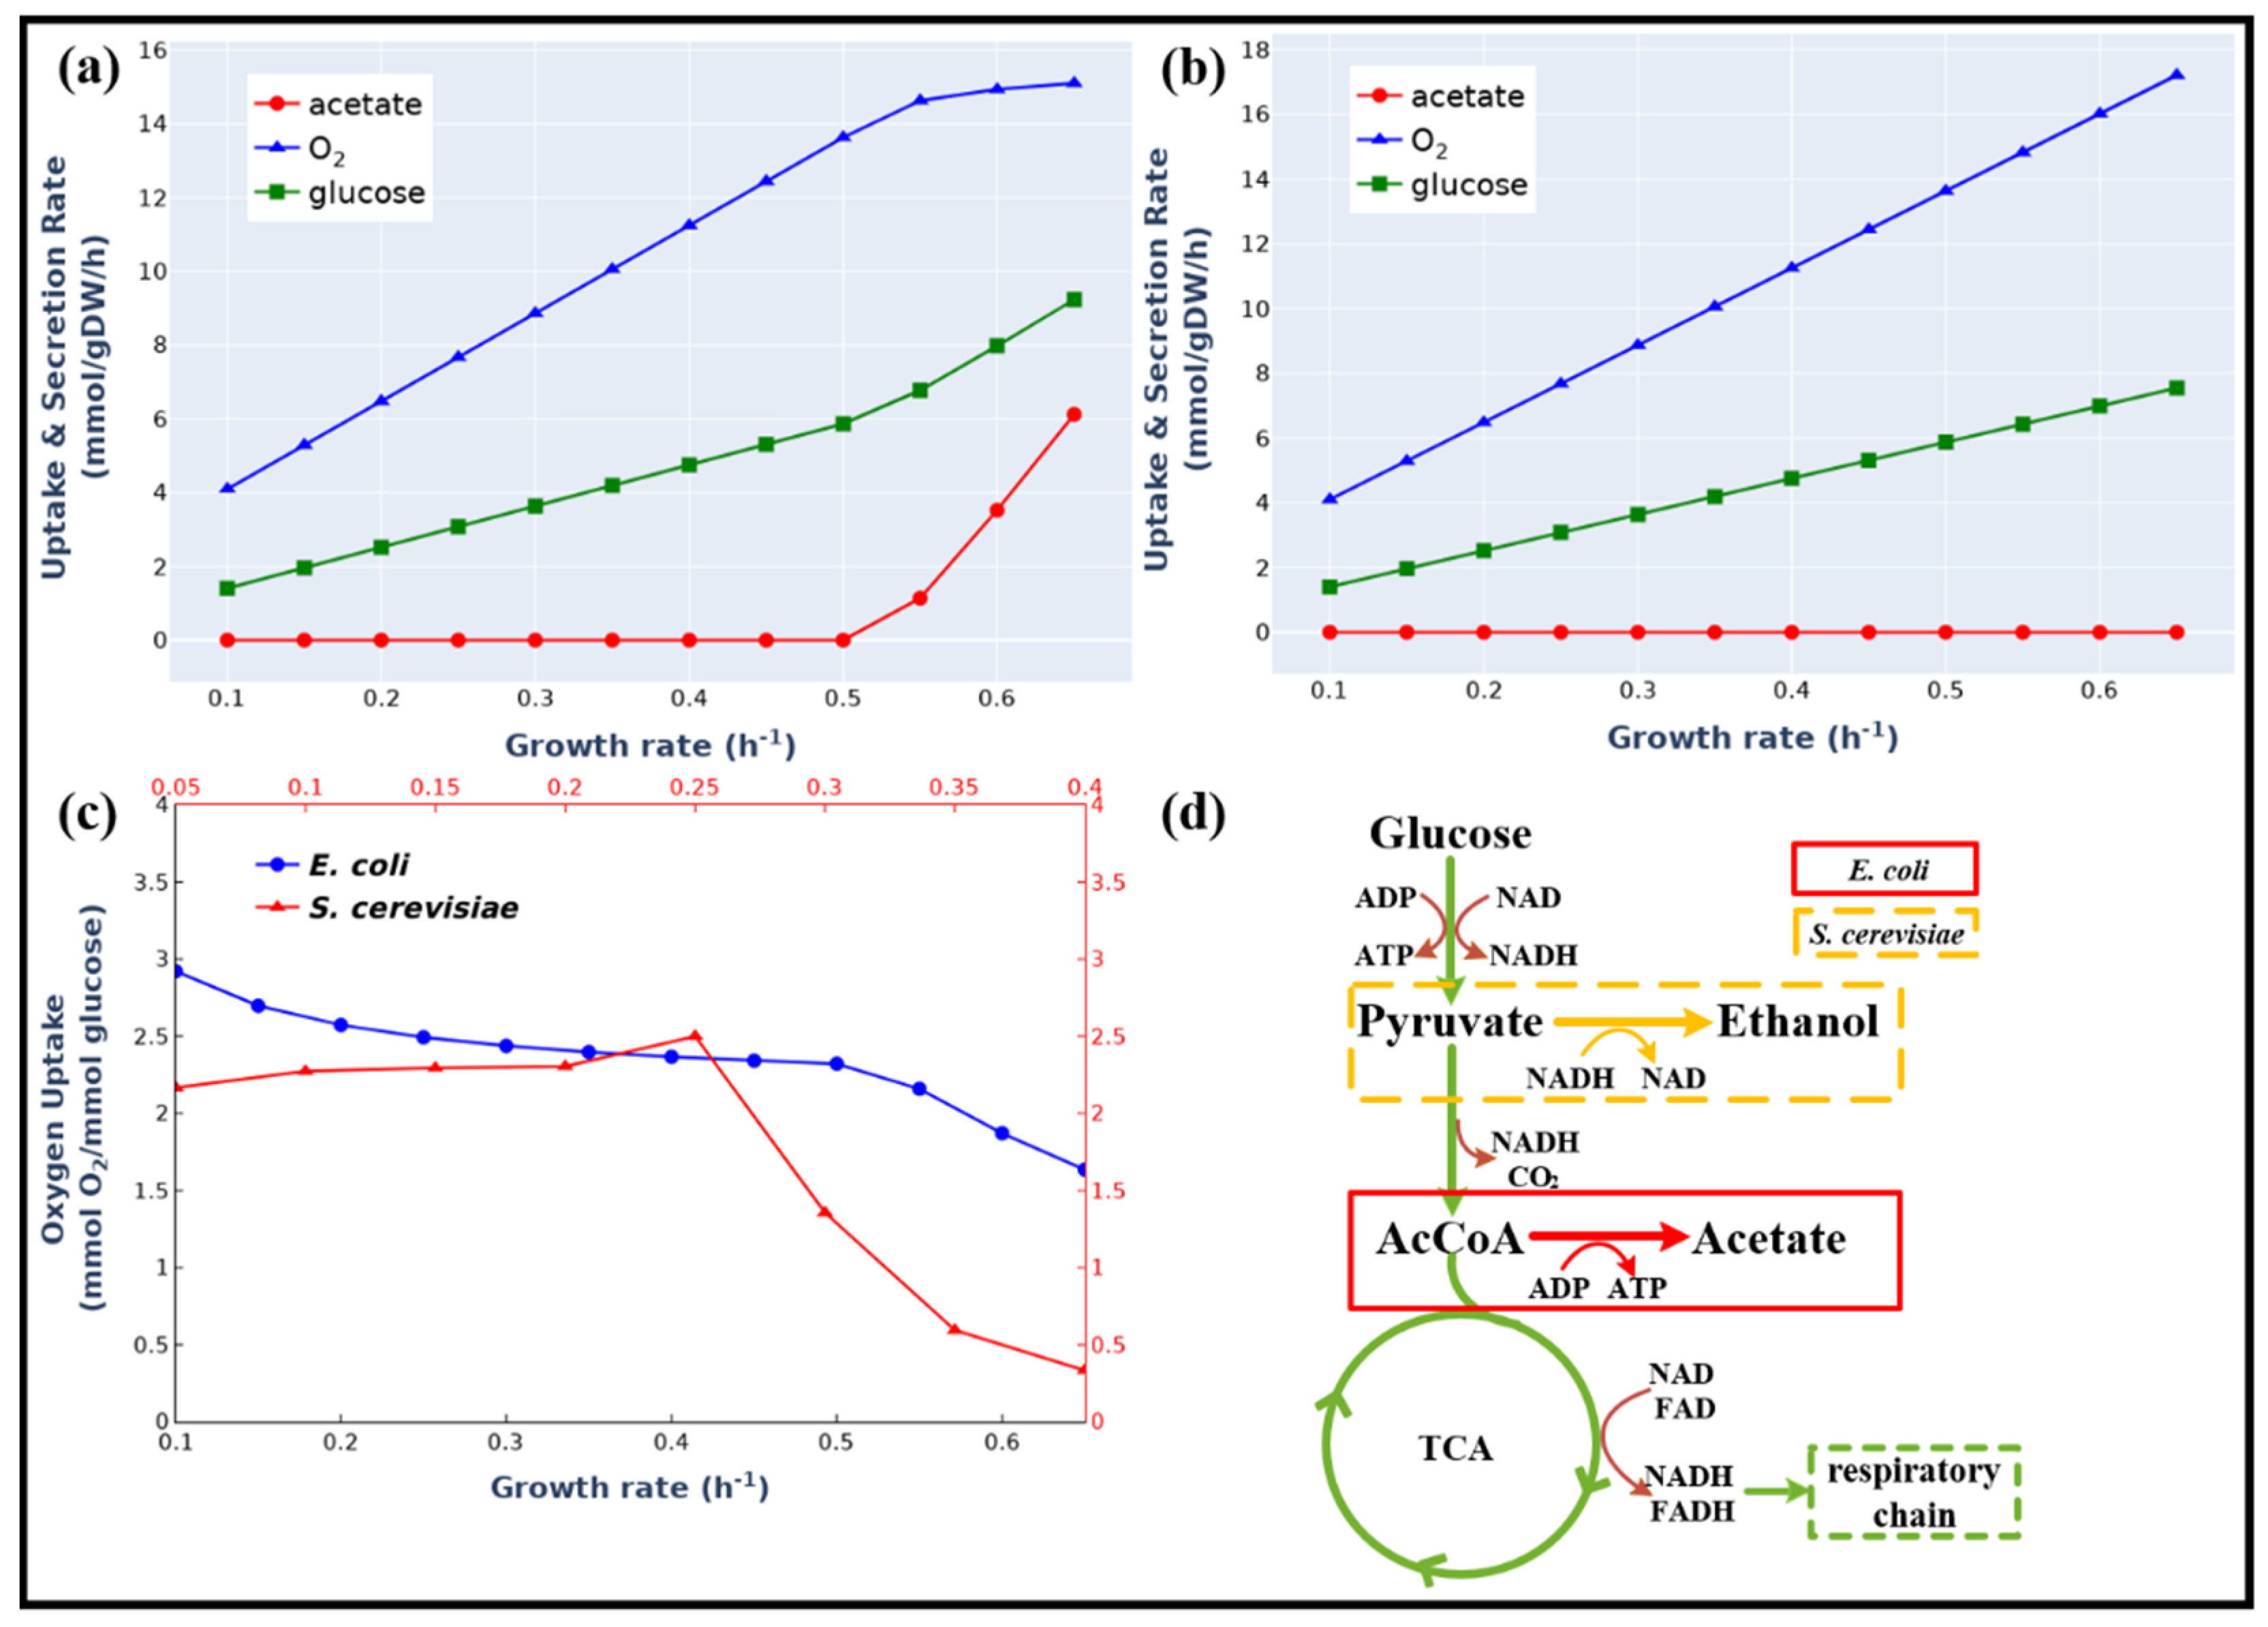
Overflow metabolism describes a phenomenon in which cells produce fermentation products even in the presence of oxygen that led to the waste of carbon sources [9]. Enzyme-constrained metabolic models have been used to simulate the overflow metabolism in S. cerevisiae [16,35]. To test our model, we applied it to simulate the overflow metabolism reported by literature [36], in which E. coli secreted acetate at high growth rates (above 0.5 h−1). As shown in Figure 3a,b, the eciML1515 model (the kinetic parameters for each reaction see Table S3) could precisely simulate the switch point where acetate production started. The simulation results indicated that at high growth rates, the acetate producing fermentation pathway was activated due to its low enzyme cost in comparison with the energetically-efficient oxidative respiratory pathway (0.62 g vs. 2.38 g enzyme for 1 mol ATP/h, Table S4).
The model also predicted a notable difference in the overflow metabolism between E. coli and S. cerevisiae (Figure 3c). In S. cerevisiae, the oxygen-consuming high-yield respiratory pathway was decreased to a very low value [37], whereas in E. coli the respiratory pathway was maintained at a high level (Figure 3a) even though the acetate production pathway was activated. A logical explanation for this is that the fermentation products of these two organisms are different. In S. cerevisiae, ethanol was produced and NADH was balanced in the fermentation pathway. However, in E. coli, acetate was produced and the excess NADH produced in the fermentation pathway needs to be balanced through the oxidative respiratory pathway (Figure 3d). This result was in agreement with the finding of a previous study [38].
3.3. Maximum Growth Rate of E. coli on Different Carbon Sources
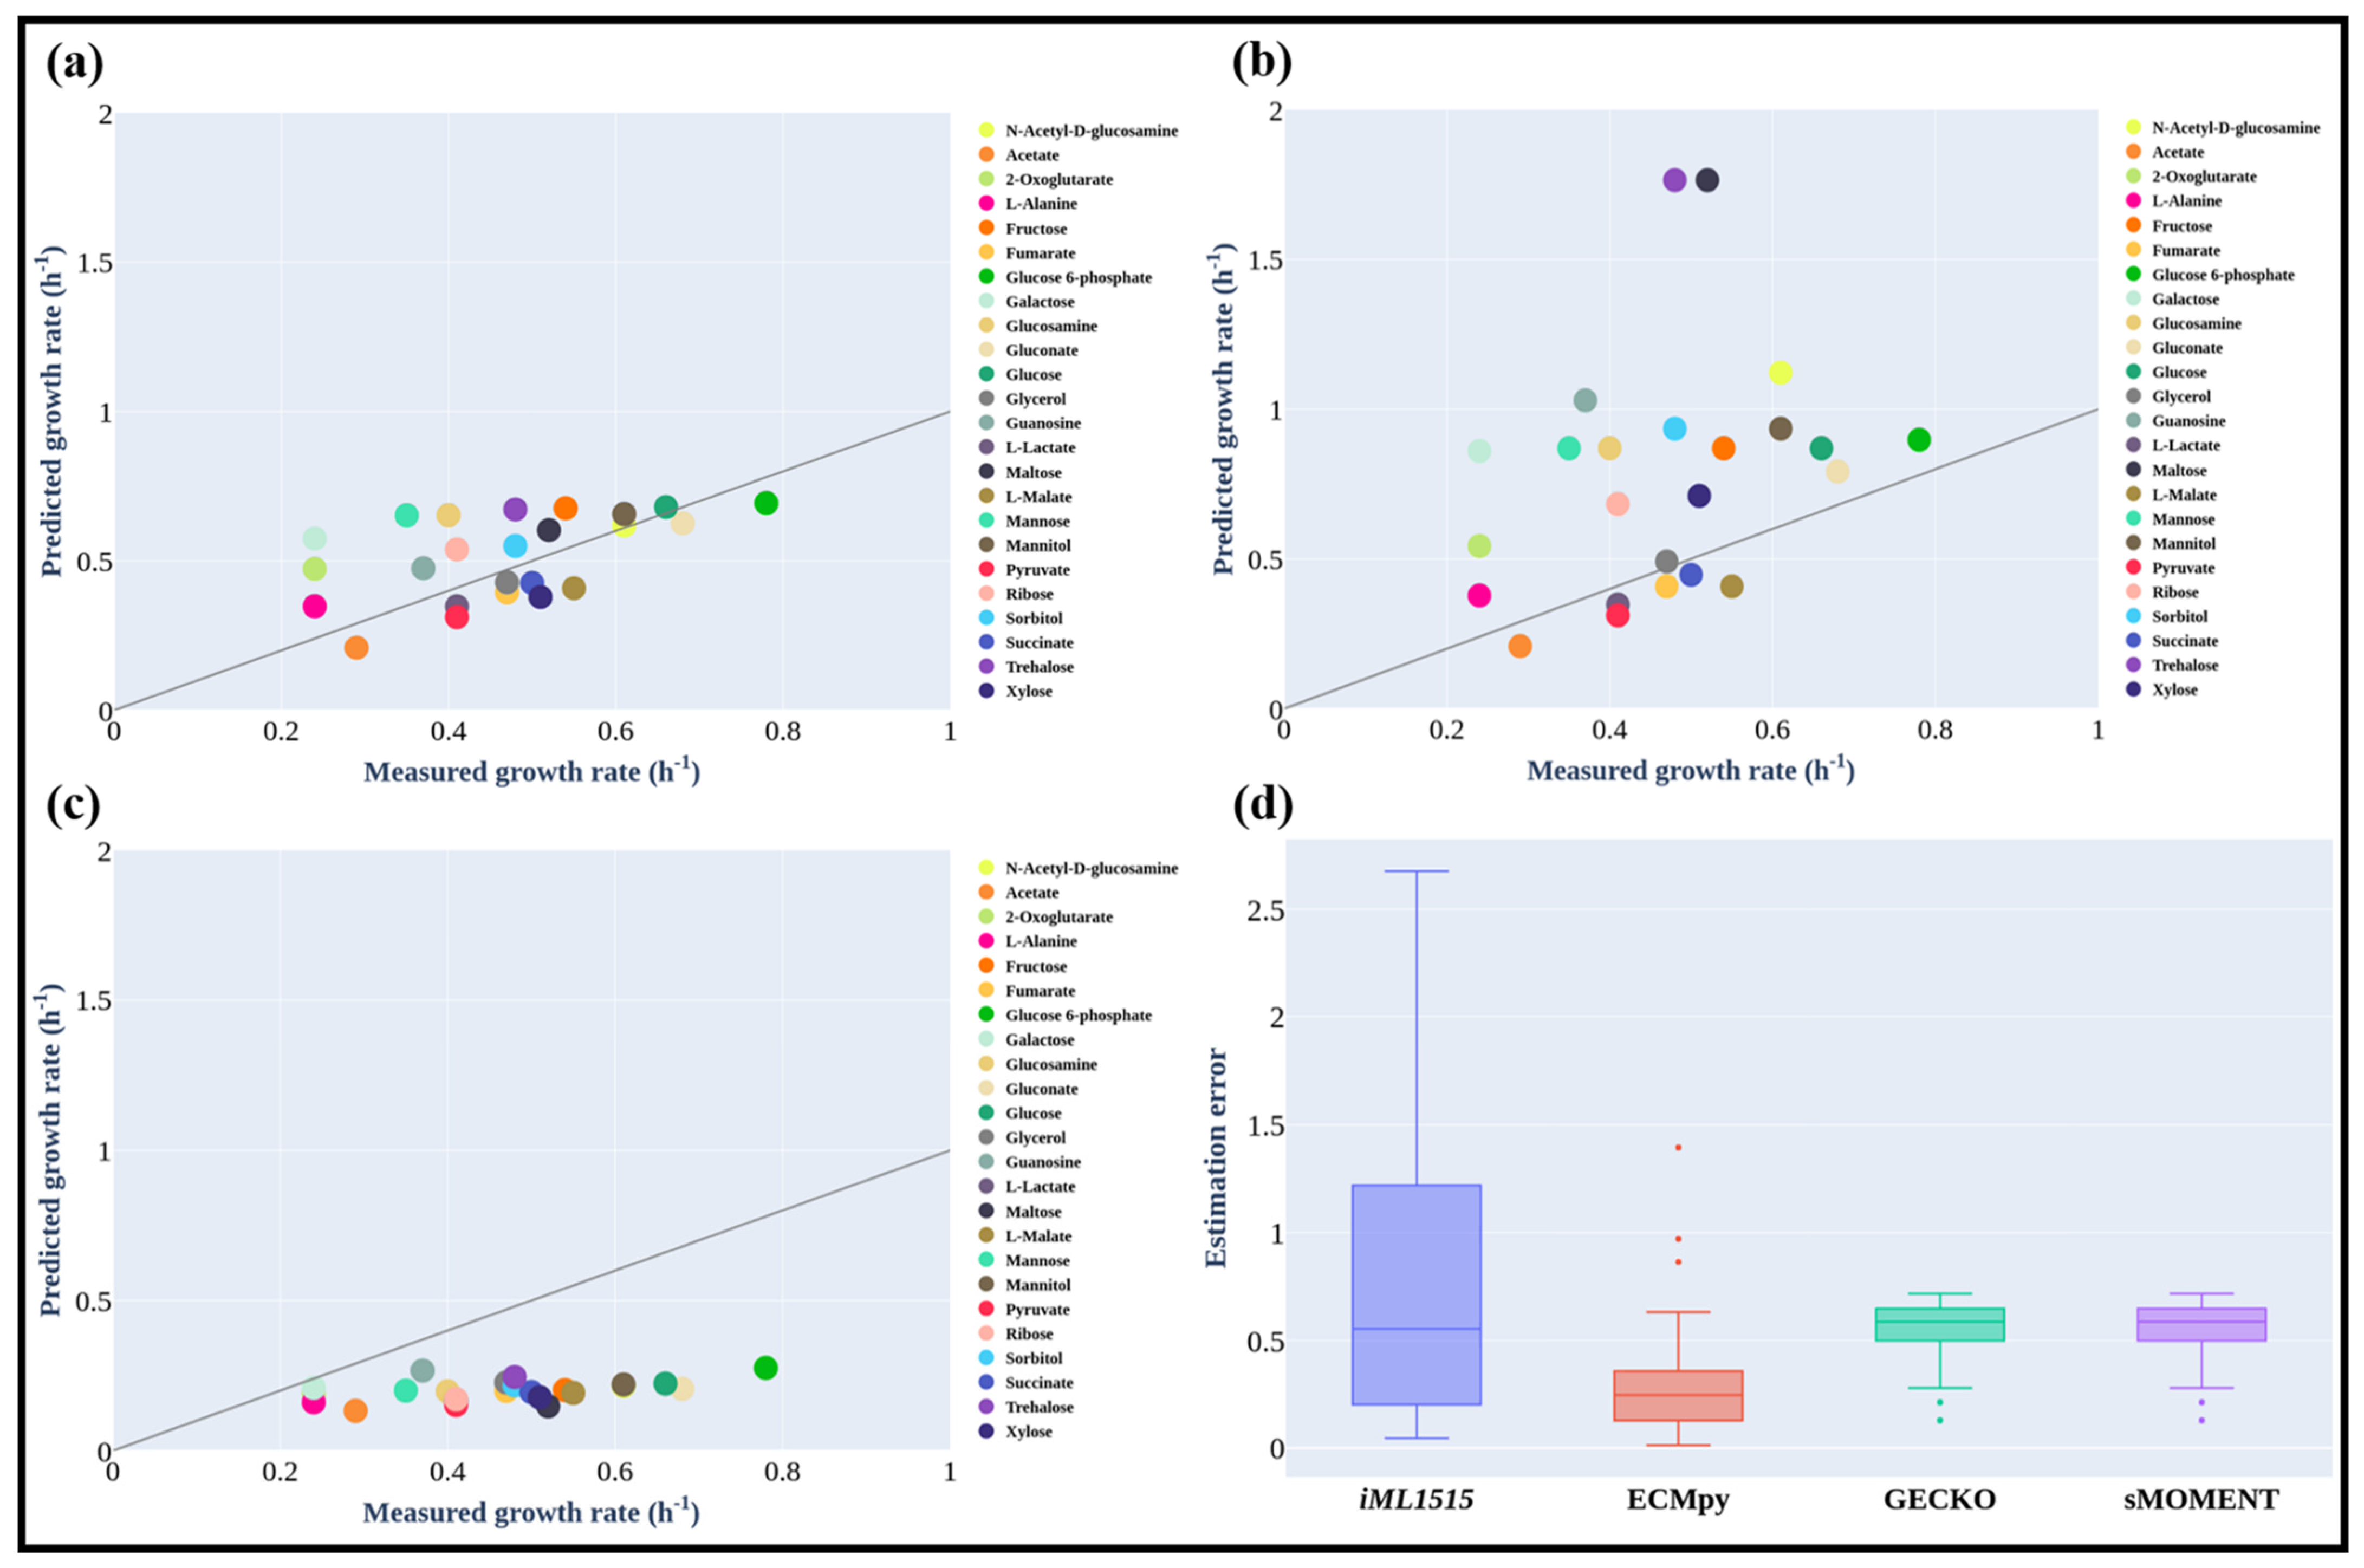
We simulated the maximum growth rates of E. coli on 24 different carbon sources and observed that certain other fermentation byproducts (e.g., pyruvate and fumarate) in addition to acetate could also be produced at the maximal growth rates. The predicted results were in good agreement with previously reported experimental results [15] as shown in Figure 4a (the normalized flux error is 0.062) and Table S5. On the other hand, the calculated growth rates using iML1515 (the substrate uptake rates were set as the same as those for eciML1515) were significantly higher than the measured values (the standard flux error is 0.205, Figure 4b). The prediction results for most of the substrates (e.g., N-Acetyl-d-glucosamine and glucose) from eciML1515 were closer to (estimation error is 0.01 and 0.03) experimental values than those from the iML1515 model. In a stoichiometric model such as iML1515, the substrate uptake rate needs to be preset to calculate the growth rate and there is a linear relationship between the growth rate and substrate consumption rate. Whereas in the enzyme-constrained model, the maximal growth rate is limited by enzyme resources and thus there is no need to preset a substrate consumption rate. This means that at the maximal growth rate, a considerable quantity of substrates was utilized through the fermentation pathways with the secretion of fermentation products. Therefore, the predicted growth rates from the enzyme-constrained model were significantly lower than those from iML1515 but much closer to the experimental findings. One exception for acetate as the carbon source is that the predicted results were the same for both models as no acetate producing fermentation pathway was activated in this case. From the results shown in Figure 4a, we can also see that for most carbon sources the predicted growth rates were still higher than the experimentally measured rates. This may imply that there are other constraints along with enzyme constraints limiting cellular growth, such as the regulatory or thermodynamic constraints. New models integrating these new constraints in a proper formula can further improve the prediction accuracy [39]. For xylose and glycerol, the predicted rates were smaller than the experimental values, implying that the kcat values of enzymes in the uptake pathways of these two substrates may be underestimated. Besides, we found that ECMpy is better than GECKO and sMOMENT for the simulation of growth rate on 24 different carbon sources (all consider protein subunits, but ECMpy corrected for enzyme kinetic parameters), and the simulation results of all enzyme-constrained models are also better than non-enzyme-constrained models (Figure 4a–d). This may also mean more precise measurement of the enzyme kinetic parameters could improve model prediction.
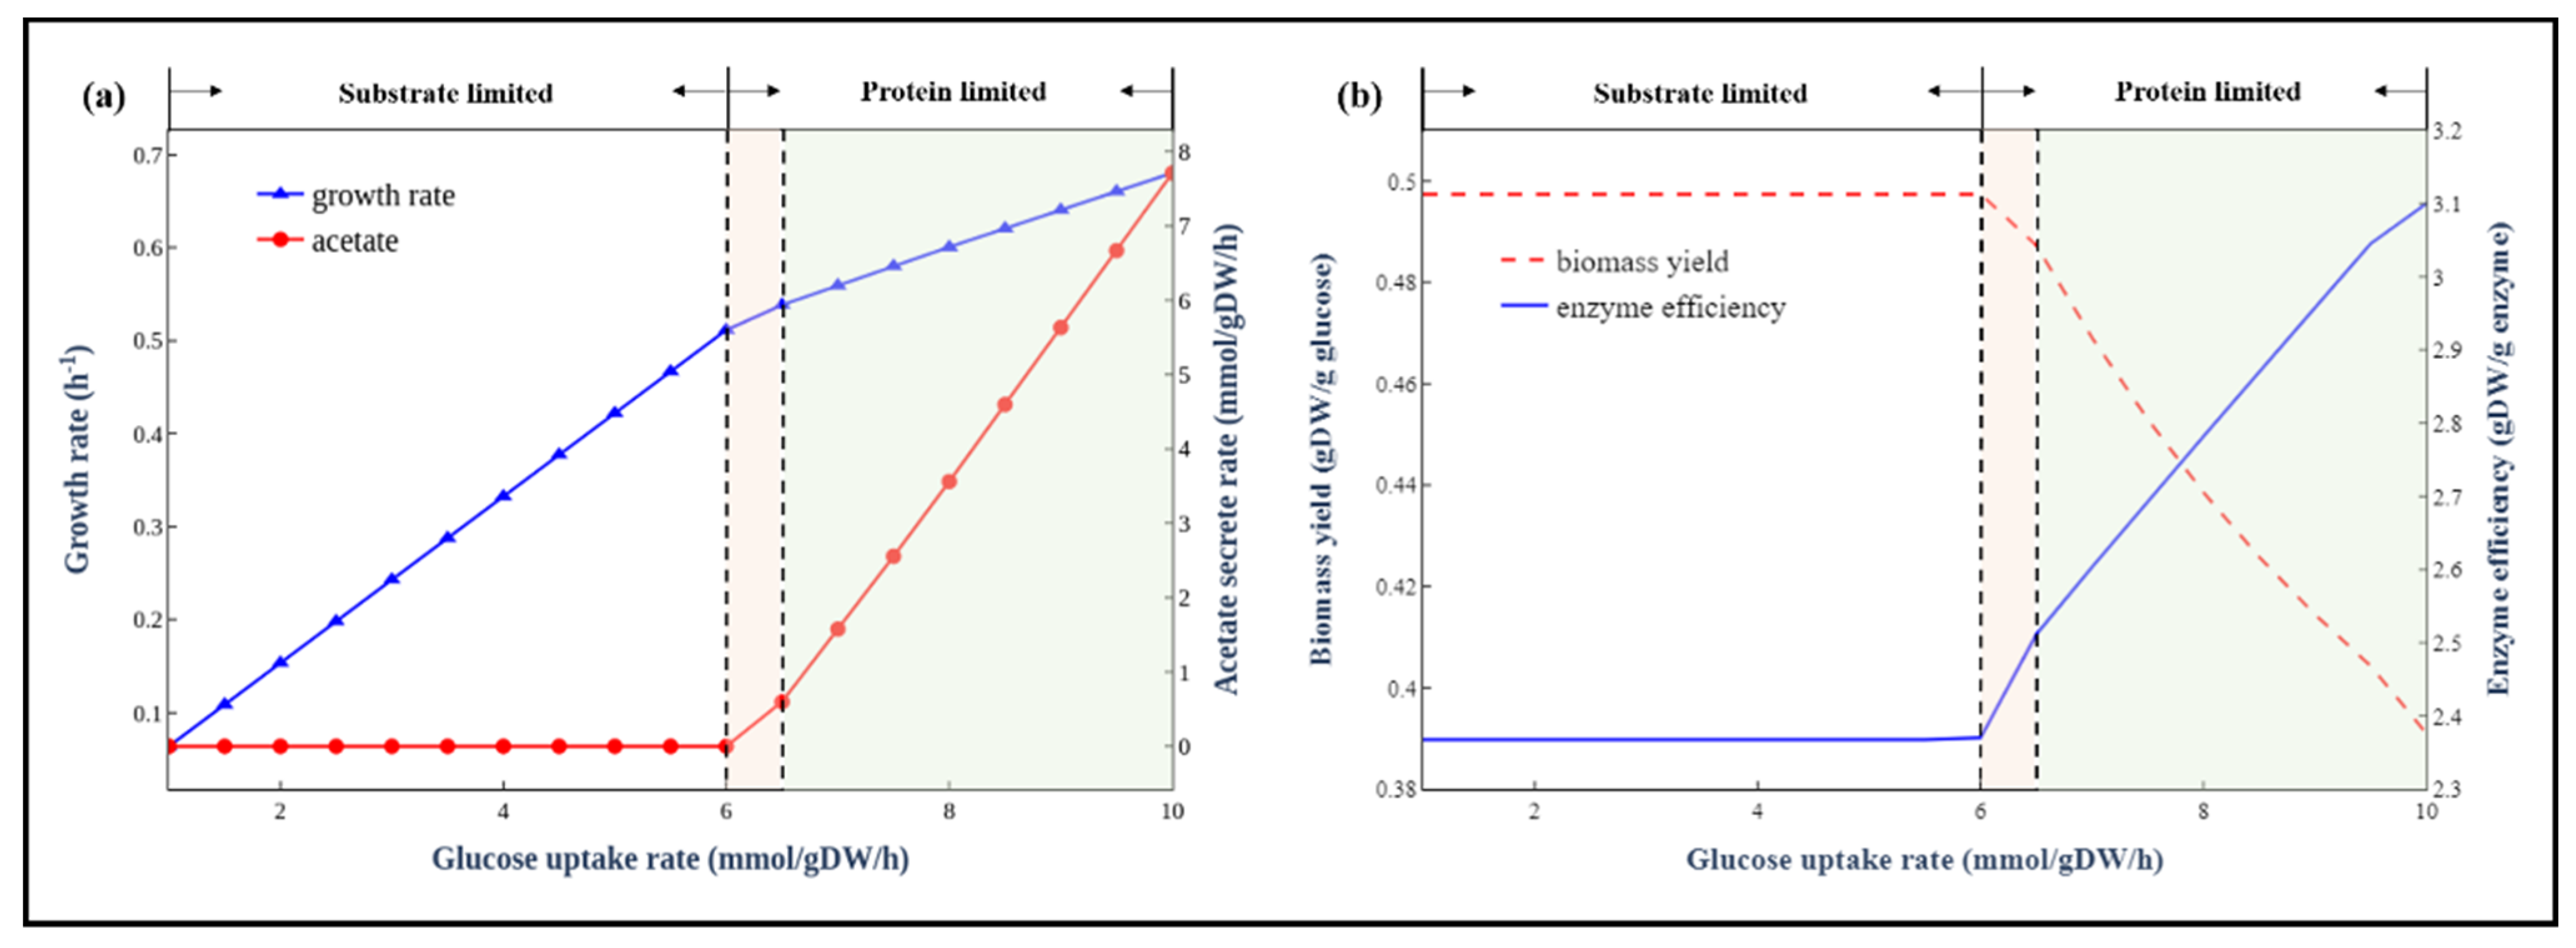
3.4. Simulation of the Trade-Off between Enzyme Usage Efficiency and Biomass Yield
In addition to the maximal growth rates under different carbon sources, we also explored the metabolic behaviours of E. coli at different substrate (glucose as an example) uptake rates. As shown in Figure 5a,b, the metabolism processes can be divided into three stages: substrate-limited stage, overflow switching phase and overflow stage. At the first stage, the glucose uptake rate is low and has a linear relationship with growth rates. The biomass yield is almost constant (not the same as a small number of substrates are used for non-growth-related maintenance). At the second stage, the cell redistributes the intracellular fluxes toward pathways with high enzyme usage efficiency but low biomass yield, and acetate gradually becomes a byproduct of the newly activated pathways. In contrast, at the overflow stage, the organism has to activate the less energy efficient but higher enzyme usage efficiency fermentation pathway to produce the energy required for growth, leading to a sharp drop of biomass yield due to a big fraction of substrates used in the fermentation pathway. There was a clear trade-off between yield and enzyme usage efficiency (Figure 5b). These predicted metabolic behaviours were consistent with long-standing empirical models of microbial growth [40]. This trade-off phenomenon was also predicted by the E. coli ME-model [41], indicating that the enzyme-constrained model could accurately predict the same phenomenon as ME-model but without introducing thousands of new reactions involved in the transcription and translation process in the model.
4. Discussion
We constructed a genome-scale enzyme-constrained model eciML1515 for E. coli using the simplified Python-based ECMpy workflow. The new model was validated with various experimental data from literature including metabolic overflow data and the growth rates under different carbon sources. The prediction results were better than GECKO and sMOMENT, and those enzyme-constrained models were also better than the original iML1515, indicating in these conditions enzyme availability rather than network stoichiometry is the key constraint. The enzyme-constrained model also showed a clear trade-off between biomass yield and enzyme usage efficiency. Switching from a high yield pathway to a high-rate pathway could be a general principle in metabolic regulation. This provides new insight into engineering organisms for the production of valuable biochemicals. In organisms using a high yield and high enzyme cost biosynthesis pathway, improving enzyme-specific activity could be more effective than enzyme overexpression.
Different from GECKO and sMOMENT, our method for enzyme constrained model construction just adds a constraint on the total amount of enzyme does not need to modify the reaction equations (e.g., introduce enzymes as reactants) and introduce over a thousand new enzyme exchange reactions (like GECKO). This greatly reduces the complexity in model construction and the model can be solved using COBRApy or other freely available python packages for constrained optimization. Besides, compared to the existing E. coli enzyme constraint model (using GECKO or sMOMENT), which set the number of each of the protein subunits to one, we defined the number of subunits for each protein in detail based on the EcoCyc. For example, pyruvate dehydrogenase consists of three subunits, AceE, AceF and Lpd, and its molecular weight is about 216.43 kD if the number of subunits is 1:1:1. However, the true number of subunits is 24:24:12 in EcoCyc, which means that the final molecular weight is 4586.16 kD. The large difference between the molecular weight of the same reaction would certainly cause a big difference in the flux results. The whole model construction and simulation processes were written in Jupyter Notebook files available from GitHub. This enables people from anywhere to reproduce the work and construct their enzyme constrained models for other organisms.
As we have shown that the quality of the enzyme constrained model depended largely on the quantity and accuracy of enzyme parameters. Even for E. coli, the enzyme kinetic data coverage is low in databases such as BRENDA and kinetic parameters from different researchers are often inconsistent. In this study, we make use of the predicted data from machine learning [23] to improve the data coverage. Besides, enzyme-constrained models need model validation to adjust the original kcat values to some extent to improve the agreement of model predictions with experimental data [17]. A system kinetic parameter correction method has been presented in the sMOMENT workflow [17], which helps identify such unreliable parameters and improve model prediction accuracy. However, this calibration workflow is time-consuming, going through protein pool calibration, manual kcat adjustment and automated kcat calibration, and there are some unreasonable places, such as the manual correction is simply expanded by 10 times or reduced by 10 times. In recently, GECKO 2.0 (https://0-doi-org.brum.beds.ac.uk/10.1101/2021.03.05.433259, accessed on 25 December 2021) provided an automatic procedure, in which the top enzymatic limitation on growth rate is identified and its correspondent kcat is then iteratively replaced by the highest one available in BRENDA for the given enzyme class until the growth rate fit is normal [42]. Currently, we propose a simpler calibration process that requires only two steps (enzyme usage and 13C flux consistency, see method) to update the kcat for a small number of reactions to achieve a better growth rate fit. This new calibration process will facilitate the construction of high-quality enzyme constraint models.
The ECMpy also has some areas that need improvement. First, ECMpy currently obtains protein subunit composition data manually, while a large amount of protein composition data are distributed in databases, such as BioCyc [43], Uniprot [44] and Complex Portal [45], so an automated tool to obtain them is urgently needed. Second, the rationale of the model needs to be further developed to consider more factors affecting the cost of the enzyme (e.g., thermodynamics and regulation).
5. Conclusions
We presented ECMpy, a simple open-source Python-based workflow, for constructing enzyme-constrained models based on enzyme kinetic parameters and proteomics data. Using this method, we constructed an enzyme constrained model eciML1515 for E. coli. By introducing the enzyme constraints, the model can predict the overflow metabolism and growth under different carbon sources more precisely than the stoichiometric model iML1515. The construction method can be applied to construct enzyme constrained models for other organisms and the optimization framework can be extended to integrate other constraints such as thermodynamic feasibility to further reduce the solution space and subsequently improve model prediction accuracy.
Supplementary Materials
The following are available online at https://0-www-mdpi-com.brum.beds.ac.uk/article/10.3390/biom12010065/s1, Figure S1: Number of subunits per complex (only consider complex with two or more subunits) in E. coli. Figure S2: Flux comparison of eciML1515_ori and eciML1515_adj_round1. Figure S3: Flux comparison of eciML1515_ori and eciML1515_adj_round2. Table S1: The modified genes. Table S2: The corrected kinetic parameters. Table S3: The kinetic parameters. Table S4: Enzyme cost of energy metabolism in E. coli. Table S5: The maximum growth rates.
Author Contributions
Conceptualization, Z.M., X.Z. and H.M.; data curation, Z.M. and X.Z.; formal analysis, Z.M. and X.Z.; funding acquisition, H.M.; methodology, Z.M., X.Z. and H.M.; project administration, Z.M. and H.M.; software, Z.M. and P.Z.; validation, X.Z., X.Y., P.Z., J.D. and Q.Y.; writing—original draft, Z.M., X.Z. and X.Y.; writing—review and editing, Z.M., X.Z., X.Y., Q.Y. and H.M. Conceived the research, H.M.; developed the automatic workflow of the enzyme-constrained model, Z.M. and X.Z.; designed the enzyme-constrained model construction method and analyzed eciML1515, Z.M., X.Z., and X.Y. Wrote the manuscript, Z.M. and X.Z. Further perfected the workflow, X.Y., P.Z., J.D. and Q.Y. All authors have read and agreed to the published version of the manuscript.
Funding
This work was funded by the National Key Research and Development Program of China (2018YFA0900300); the International Partnership Program of Chinese Academy of Sciences (153D31KYSB20170121). Other than supplying funds, the funding agencies played no role in the development of this research, the analysis of results, or in the preparation of this manuscript.
Institutional Review Board Statement
Not applicable.
Informed Consent Statement
Not applicable.
Data Availability Statement
The scripts and datasets generated during and/or analyzed during the current study can be found at: https://github.com/tibbdc/ECMpy (accessed on 25 December 2021).
Conflicts of Interest
The authors declare no conflict of interest.
References
- Edwards, J.S.; Palsson, B.O. Systems Properties of the Haemophilus influenzaeRd Metabolic Genotype. J. Biol. Chem. 1999, 274, 17410–17416. [Google Scholar] [CrossRef] [PubMed] [Green Version]
- Gu, C.; Kim, G.B.; Kim, W.J.; Kim, H.U.; Lee, S.Y. Current status and applications of genome-scale metabolic models. Genome Biol. 2019, 20, 1–18. [Google Scholar] [CrossRef] [PubMed] [Green Version]
- O’Brien, E.J.; Monk, J.M.; Palsson, B.O. Using Genome-scale Models to Predict Biological Capabilities. Cell 2015, 161, 971–987. [Google Scholar] [CrossRef] [PubMed] [Green Version]
- Kerkhoven, E.; Lahtvee, P.-J.; Nielsen, J. Applications of computational modeling in metabolic engineering of yeast. FEMS Yeast Res. 2014, 15, 1–13. [Google Scholar] [CrossRef] [Green Version]
- Schuetz, R.; Kuepfer, L.; Sauer, U. Systematic evaluation of objective functions for predicting intracellular fluxes in Escherichia coli. Mol. Syst. Biol. 2007, 3, 119. [Google Scholar] [CrossRef]
- Mahadevan, R.; Schilling, C.H. The effects of alternate optimal solutions in constraint-based genome-scale metabolic models. Metab. Eng. 2003, 5, 264–276. [Google Scholar] [CrossRef]
- Lin, Z.; Zhang, Y.; Yuan, Q.; Liu, Q.; Li, Y.; Wang, Z.; Ma, H.; Chen, T.; Zhao, X. Metabolic engineering of Escherichia coli for poly(3-hydroxybutyrate) production via threonine bypass. Microb. Cell Factories 2015, 14, 185. [Google Scholar] [CrossRef] [Green Version]
- Veit, A.; Polen, T.; Wendisch, V.F. Global gene expression analysis of glucose overflow metabolism in Escherichia coli and reduction of aerobic acetate formation. Appl. Microbiol. Biotechnol. 2006, 74, 406–421. [Google Scholar] [CrossRef]
- Basan, M.; Hui, S.; Okano, H.; Zhang, Z.; Shen, Y.; Williamson, J.; Hwa, T. Overflow metabolism in Escherichia coli results from efficient proteome allocation. Nature 2015, 528, 99–104. [Google Scholar] [CrossRef] [Green Version]
- Beg, Q.K.; Vazquez, A.; Ernst, J.; de Menezes, M.A.; Bar-Joseph, Z.; Barabasi, A.; Oltvai, Z.N. Intracellular crowding defines the mode and sequence of substrate uptake by Escherichia coli and constrains its metabolic activity. Proc. Natl. Acad. Sci. USA 2007, 104, 12663–12668. [Google Scholar] [CrossRef] [Green Version]
- Mori, M.; Hwa, T.; Martin, O.; De Martino, A.; Marinari, E. Constrained Allocation Flux Balance Analysis. PLoS Comput. Biol. 2016, 12, e1004913. [Google Scholar] [CrossRef] [Green Version]
- Shlomi, T.; Benyamini, T.; Gottlieb, E.; Sharan, R.; Ruppin, E. Genome-Scale Metabolic Modeling Elucidates the Role of Proliferative Adaptation in Causing the Warburg Effect. PLoS Comput. Biol. 2011, 7, e1002018. [Google Scholar] [CrossRef] [Green Version]
- Zeng, H.; Yang, A. Modelling overflow metabolism in Escherichia coli with flux balance analysis incorporating differential proteomic efficiencies of energy pathways. BMC Syst. Biol. 2019, 13, 3. [Google Scholar] [CrossRef]
- Noor, E.; Flamholz, A.; Bar-Even, A.; Davidi, D.; Milo, R.; Liebermeister, W. The Protein Cost of Metabolic Fluxes: Prediction from Enzymatic Rate Laws and Cost Minimization. PLOS Comput. Biol. 2016, 12, e1005167. [Google Scholar] [CrossRef] [PubMed]
- Adadi, R.; Volkmer, B.; Milo, R.; Heinemann, M.; Shlomi, T. Prediction of Microbial Growth Rate versus Biomass Yield by a Metabolic Network with Kinetic Parameters. PLOS Comput. Biol. 2012, 8, e1002575. [Google Scholar] [CrossRef] [Green Version]
- Sánchez, B.J.; Zhang, C.; Nilsson, A.; Lahtvee, P.-J.; Kerkhoven, E.J.; Nielsen, J. Improving the phenotype predictions of a yeast genome-scale metabolic model by incorporating enzymatic constraints. Mol. Syst. Biol. 2017, 13, 935. [Google Scholar] [CrossRef]
- Bekiaris, P.S.; Klamt, S. Automatic construction of metabolic models with enzyme constraints. BMC Bioinform. 2020, 21, 1–13. [Google Scholar] [CrossRef] [PubMed]
- Massaiu, I.; Pasotti, L.; Sonnenschein, N.; Rama, E.; Cavaletti, M.; Magni, P.; Calvio, C.; Herrgard, M.J. Integration of enzymatic data in Bacillus subtilis genome-scale metabolic model improves phenotype predictions and enables in silico design of poly-γ-glutamic acid production strains. Microb. Cell Fact. 2019, 18, 1–20. [Google Scholar] [CrossRef]
- Chen, Y.; Sun, Y.; Liu, Z.; Dong, F.; Li, Y.; Wang, Y. Genome-scale modeling for Bacillus coagulans to understand the metabolic characteristics. Biotechnol. Bioeng. 2020, 117, 3545–3558. [Google Scholar] [CrossRef] [PubMed]
- Ye, C.; Luo, Q.; Guo, L.; Gao, C.; Xu, N.; Zhang, L.; Liu, L.; Chen, X. Improving lysine production through construction of an Escherichia coli enzyme-constrained model. Biotechnol. Bioeng. 2020, 117, 3533–3544. [Google Scholar] [CrossRef]
- Sulheim, S.; Kumelj, T.; Van Dissel, D.; Salehzadeh-Yazdi, A.; Du, C.; Van Wezel, G.P.; Nieselt, K.; Almaas, E.; Wentzel, A.; Kerkhoven, E.J. Enzyme-Constrained Models and Omics Analysis of Streptomyces coelicolor Reveal Metabolic Changes that Enhance Heterologous Production. iScience 2020, 23. [Google Scholar] [CrossRef]
- Monk, J.M.; Lloyd, C.J.; Brunk, E.; Mih, N.; Sastry, A.; King, Z.; Takeuchi, R.; Nomura, W.; Zhang, Z.; Mori, H.; et al. iML1515, a knowledgebase that computes Escherichia coli traits. Nat. Biotechnol. 2017, 35, 904–908. [Google Scholar] [CrossRef]
- Heckmann, D.; Lloyd, C.J.; Mih, N.; Ha, Y.; Zielinski, D.C.; Haiman, Z.B.; Desouki, A.A.; Lercher, M.J.; Palsson, B.O. Machine learning applied to enzyme turnover numbers reveals protein structural correlates and improves metabolic models. Nat. Commun. 2018, 9, 1–10. [Google Scholar] [CrossRef] [PubMed] [Green Version]
- Orth, J.D.; Thiele, I.; Palsson, B.Ø. What is flux balance analysis? Nat. Biotechnol 2010, 28, 245–248. [Google Scholar] [CrossRef] [PubMed]
- Ebrahim, A.; Lerman, J.A.; Palsson, B.O.; Hyduke, D.R. COBRApy: COnstraints-Based Reconstruction and Analysis for Python. BMC Syst. Biol. 2013, 7, 74. [Google Scholar] [CrossRef] [Green Version]
- Motamedian, E.; Mohammadi, M.; Shojaosadati, S.A.; Heydari, M. TRFBA. An algorithm to integrate genome-scale metabolic and transcriptional regulatory networks with incorporation of expression data. Bioinformatics 2017, 33, 1057–1063. [Google Scholar] [CrossRef] [PubMed] [Green Version]
- Machado, D.; Herrgård, M. Systematic Evaluation of Methods for Integration of Transcriptomic Data into Constraint-Based Models of Metabolism. PLoS Comput. Biol. 2014, 10, e1003580. [Google Scholar] [CrossRef] [Green Version]
- Lewis, N.; Hixson, K.K.; Conrad, T.M.; Lerman, J.; Charusanti, P.; Polpitiya, A.D.; Adkins, J.; Schramm, G.; Purvine, S.; Lopez-Ferrer, D.; et al. Omic data from evolved E. coli are consistent with computed optimal growth from genome-scale models. Mol. Syst. Biol. 2010, 6, 390. [Google Scholar] [CrossRef]
- Karp, P.D.; Ong, W.K.; Paley, S.; Billington, R.; Caspi, R.; Fulcher, C.; Kothari, A.; Krummenacker, M.; Latendresse, M.; Midford, P.E.; et al. The EcoCyc Database. EcoSal Plus 2018. [Google Scholar] [CrossRef] [Green Version]
- Nilsson, A.; Nielsen, J.; Palsson, B.O. Metabolic Models of Protein Allocation Call for the Kinetome. Cell Syst. 2017, 5, 538–541. [Google Scholar] [CrossRef] [PubMed] [Green Version]
- Bremer, H.; Dennis, P.P. Modulation of chemical composition and other parameters of the cell at different exponential growth rates. EcoSal. Plus 2008, 3. [Google Scholar] [CrossRef]
- Brunk, E.; Mih, N.; Monk, J.; Zhang, Z.; O’Brien, E.J.; Bliven, S.E.; Chen, K.; Chang, R.L.; Bourne, P.E.; Palsson, B.O. Systems biology of the structural proteome. BMC Syst. Biol. 2016, 10, 26. [Google Scholar] [CrossRef] [Green Version]
- Wang, M.; Weiss, M.; Simonovic, M.; Haertinger, G.; Schrimpf, S.P.; Hengartner, M.; von Mering, C. PaxDb, a Database of Protein Abundance Averages Across All Three Domains of Life. Mol. Cell. Proteom. 2012, 11, 492–500. [Google Scholar] [CrossRef] [Green Version]
- Okahashi, N.; Kajihata, S.; Furusawa, C.; Shimizu, H. Reliable Metabolic Flux Estimation in Escherichia coli Central Carbon Metabolism Using Intracellular Free Amino Acids. Metabolites 2014, 4, 408–420. [Google Scholar] [CrossRef] [Green Version]
- Chen, Y.; Nielsen, J. Energy metabolism controls phenotypes by protein efficiency and allocation. Proc. Natl. Acad. Sci. USA 2019, 116, 17592–17597. [Google Scholar] [CrossRef] [Green Version]
- Varma, A.; Palsson, B.O. Stoichiometric flux balance models quantitatively predict growth and metabolic by-product secretion in wild-type Escherichia coli W3110. Appl. Environ. Microbiol. 1994, 60, 3724–3731. [Google Scholar] [CrossRef] [PubMed] [Green Version]
- Thomas, T.D.; Ellwood, D.C.; Longyear, V.M.C. Change from Homo- to Heterolactic Fermentation by Streptococcus lactis Resulting from Glucose Limitation in Anaerobic Chemostat Cultures. J. Bacteriol. 1979, 138, 109–117. [Google Scholar] [CrossRef] [Green Version]
- van Hoek, M.J.; Merks, R.M. Redox balance is key to explaining full vs. partial switching to low-yield metabolism. BMC Syst. Biol. 2012, 6, 1–10. [Google Scholar] [CrossRef] [PubMed] [Green Version]
- Yang, X.; Mao, Z.; Zhao, X.; Wang, R.; Zhang, P.; Cai, J.; Xue, C.; Ma, H. Integrating thermodynamic and enzymatic constraints into genome-scale metabolic models. Metab. Eng. 2021, 67, 133–144. [Google Scholar] [CrossRef] [PubMed]
- Koch, A.L. Microbial physiology and ecology of slow growth. Microbiol Mol. Biol. Rev. 1997, 61, 305–318. [Google Scholar] [PubMed]
- O’Brien, E.J.; Lerman, J.; Chang, R.; Hyduke, D.R.; Palsson, B.Ø. Genome-scale models of metabolism and gene expression extend and refine growth phenotype prediction. Mol. Syst. Biol. 2013, 9, 693. [Google Scholar] [CrossRef]
- Domenzain, I.; Sánchez, B.; Anton, M.; Kerkhoven, E.J.; Millán-Oropeza, A.; Henry, C.; Siewers, V.; Morrissey, J.P.; Sonnenschein, N.; Nielsen, J. Reconstruction of a catalogue of genome-scale metabolic models with enzymatic constraints using GECKO 2.0. bioRxiv 2021. [Google Scholar] [CrossRef]
- Karp, P.D.; Billington, R.; Caspi, R.; Fulcher, C.A.; Latendresse, M.; Kothari, A.; Keseler, I.M.; Krummenacker, M.; Midford, P.E.; Ong, Q.; et al. The BioCyc collection of microbial genomes and metabolic pathways. Briefings Bioinform. 2019, 20, 1085–1093. [Google Scholar] [CrossRef] [PubMed]
- The UniProt Consortium. UniProt: The universal protein knowledgebase in 2021. Nucleic Acids Res. 2021, 49, D480–D489. [Google Scholar] [CrossRef] [PubMed]
- Meldal, B.H.M.; Bye-A-Jee, H.; Gajdoš, L.; Hammerová, Z.; Horáčková, A.; Melicher, F.; Perfetto, L.; Pokorný, D.; Rodriguez-Lopez, M.; Tuerkova, A.; et al. Complex Portal 2018. Extended content and enhanced visualization tools for macromolecular complexes. Nucleic Acids Res. 2019, 47, D550–D558. [Google Scholar] [CrossRef] [PubMed]
Figure 1.
The ECMpy Workflow for Construction of Enzyme-constrained Models.

Figure 2.
Flux Comparison of iML1515, ECMpy, GECKO and sMOMENT. From left to right: 13C experimental data (black), prediction results of iML1515 model (red), prediction results of eciML1515 constructed by ECMpy (green), prediction results of eciML1515 constructed by GECKO (blue), and prediction results of eciML1515 constructed by sMOMENT (yelllow).

Figure 3.
Comparison of Simulation Results of the Enzyme-constrained Model eciML1515 and the Stoichiometric Model iML1515. Simulation of overflow metabolism at different growth rates using eciML1515 (a) and iML1515 (b). (c) Simulated different overflow metabolism of E. coli and S. cerevisiae. (d) The different overflow metabolic pathways of E. coli and S. cerevisiae.

Figure 4.
Predicted E. coli Growth Rates on Different Carbon Sources Using ECMpy (a), iML1515 (b), GECKO and sMOMENT (c). (d) Distribution of prediction errors of internal fluxes from different models (GECKO and sMOMENT with consideration of protein subunits).
Figure 4.
Predicted E. coli Growth Rates on Different Carbon Sources Using ECMpy (a), iML1515 (b), GECKO and sMOMENT (c). (d) Distribution of prediction errors of internal fluxes from different models (GECKO and sMOMENT with consideration of protein subunits).

Figure 5.
The metabolic behaviours of E. coli at different glucose uptake rates. (a) Simulated growth rates at different glucose uptake rates. (b) The trade-off between biomass yield and enzyme efficiency.
Figure 5.
The metabolic behaviours of E. coli at different glucose uptake rates. (a) Simulated growth rates at different glucose uptake rates. (b) The trade-off between biomass yield and enzyme efficiency.


Table 1.
Comparison of the Construction Methods of Enzyme-constrained Model.
| Items | MOMENT | GECKO | AutoPACMEN | ECMpy |
|---|---|---|---|---|
| Subunit number | (not consider) × | (consider) √ | × (provide interface) | √ |
| Proteomics | × | √ | √ | √ |
| Saturation | 1 | 0.46 | 1 | 1 |
| Mass fraction of enzymes | 0.56 | 0.448 | 0.095 | 0.227 |
| Adding methods of enzyme constraints | add enzyme concentrations for each reaction and add the enzymes solvent capacity constraint | change stoichiometric matrix, and introduce a large number of pseudo-reaction and pseudo-metabolite | change stoichiometric matrix, and introduce one pseudo-reaction and pseudo-metabolite | only add a total enzyme constraint |
| Reaction reversibility | not split | split | part split | split |
| Isozyme | a reaction can be catalyzed by multiple enzymes | a reaction can be catalyzed by multiple enzymes | always assumes that the enzyme with the minimal cost is used | a reaction can be catalyzed by multiple enzymes |
| Filling method of missing kcat | the median turnover number across all reactions | match the kcat value to other substrates, organisms, or even introduce wild cards in the EC number. | Similar to GECKO | enzyme cost=0 |
| Model calibration | × | √ | √ | √ |
| Model type | Not provided | XML | XML | JSON |
Publisher’s Note: MDPI stays neutral with regard to jurisdictional claims in published maps and institutional affiliations. |
© 2022 by the authors. Licensee MDPI, Basel, Switzerland. This article is an open access article distributed under the terms and conditions of the Creative Commons Attribution (CC BY) license (https://creativecommons.org/licenses/by/4.0/).
Share and Cite
MDPI and ACS Style
Mao, Z.; Zhao, X.; Yang, X.; Zhang, P.; Du, J.; Yuan, Q.; Ma, H. ECMpy, a Simplified Workflow for Constructing Enzymatic Constrained Metabolic Network Model. Biomolecules 2022, 12, 65. https://0-doi-org.brum.beds.ac.uk/10.3390/biom12010065
AMA Style
Mao Z, Zhao X, Yang X, Zhang P, Du J, Yuan Q, Ma H. ECMpy, a Simplified Workflow for Constructing Enzymatic Constrained Metabolic Network Model. Biomolecules. 2022; 12(1):65. https://0-doi-org.brum.beds.ac.uk/10.3390/biom12010065
Chicago/Turabian StyleMao, Zhitao, Xin Zhao, Xue Yang, Peiji Zhang, Jiawei Du, Qianqian Yuan, and Hongwu Ma. 2022. "ECMpy, a Simplified Workflow for Constructing Enzymatic Constrained Metabolic Network Model" Biomolecules 12, no. 1: 65. https://0-doi-org.brum.beds.ac.uk/10.3390/biom12010065
Note that from the first issue of 2016, this journal uses article numbers instead of page numbers. See further details here.