Article

Signs of Alveolar Collapse in Idiopathic Pulmonary Fibrosis, Hypersensitivity Pneumonitis and Systemic Sclerosis Revealed by Inspiration and Expiration Computed Tomography

1
Department of Diagnostic, Interventional, and Pediatric Radiology, Inselspital, Bern University Hospital, University of Bern, Freiburgstrasse 10, 3010 Bern, Switzerland
2
Department of Radiology, Spital Muri, Spitalstrasse 144, 5630 Muri, Switzerland
3
University Institute of Clinical Chemistry, Inselspital, Bern University Hospital, University of Bern, Freiburgstrasse 10, 3010 Bern, Switzerland
4
Center for Artificial Intelligence in Medicine (CAIM), University of Bern, 3010 Bern, Switzerland
5
Department of Laboratory Medicine and Pathology, Institute of Pathology, Lausanne University Hospital, University of Lausanne, Rue du Bugnon 25, 1011 Lausanne, Switzerland
6
Institute of Tissue Medicine and Pathology, University of Bern, 3008 Bern, Switzerland
7
Department of Pulmonary Medicine, Inselspital, Bern University Hospital, University of Bern, 3010 Bern, Switzerland
8
Department of Rheumatology and Immunology, Inselspital, Bern University Hospital, University of Bern, Freiburgstrasse 10, 3010 Bern, Switzerland
*
Author to whom correspondence should be addressed.
Submission received: 15 September 2023 / Revised: 26 October 2023 / Accepted: 27 October 2023 / Published: 7 November 2023

Abstract

:
Idiopathic pulmonary fibrosis (IPF), hypersensitivity pneumonitis (HP) and systemic sclerosis (SSc) are among the most common entities that cause pulmonary fibrosis. Alveolar collapse with subsequent collapse induration of lung tissue is thought to contribute to the fibrotic transformation. The purpose of this study was to examine lung tissue in computed tomography (CT) of non-diseased appearance during expiration for signs of increased density suggesting collapsibility in fibrosing lung diseases. We further analyzed the diaphragmatic movements during the respiratory cycle to determine relationships between density differences and the apex–diaphragm diameter. Significant differences in attenuation changes between inspiration and expiration of unaffected lung parenchyma were detected between IPF and controls and between HP and controls for all lung lobes (p < 0.001). Only minor differences were found between SSc and controls. There was no clinically relevant difference between patients with IPF and those with HP. The measured absolute apex–diaphragm diameter in inspiration and expiration demonstrated a statistically significant difference between patients with IPF versus normal controls. However, the diaphragmatic excursions were not different between these groups. Compared to controls, CT lung density increases significantly more during expiration in the fibrotic lungs of IPF and HP patients. The observed increase in density might indicate the collapse of alveoli during expiration and may represent a common pathophysiologic feature of fibrosing lung diseases. The density changes and lung extensions do not have the same ratios across different diseases and controls.

1. Introduction

Fibrotic lung diseases of various causes often exhibit increased attenuation of lung parenchyma in computed tomography (CT) [1,2]. Certain CT attenuation parameters have been shown to be associated not only with lung function but also with survival in idiopathic pulmonary fibrosis (IPF) as well as in systemic sclerosis-associated interstitial lung disease (SSc-ILD) [1,2].
Until recently, most of these studies were conducted with CTs at full inspiration only. In a survey published in 2013, only 58% of radiologists routinely performed CT imaging in expiration for ILD [3]. The new ATS/ESR/JRS/ALAT guideline from 2018 now recommends expiratory CTs in interstitial lung disease, primarily to rule out air-trapping [4]. Expiratory CTs in ILDs may also provide additional information and thereby increase our understanding of the expansibility of fibrotic lung tissue.
To date, only a few papers have described CT density in ILD in relation to disease progression or survival [1,2], and even fewer studies have systematically investigated CT density in fibrotic lungs during inspiration and expiration [5].
IPF is a chronic, progressive, fibrosing ILD of unknown cause. It is characterized by the histological and radiographic pattern of usual interstitial pneumonia (UIP). In high-resolution CT (HRCT), the hallmark of a UIP pattern is the presence of honeycombing with or without peripheral traction bronchiectasis [4]. IPF is the most common type of idiopathic ILDs and makes up 17–37% of all ILD diagnoses [6,7]. Two other major groups of ILDs of known cause are connective tissue disease-associated ILD (CTD-ILD) in 14% and hypersensitivity pneumonitis (HP) in 7% of ILD cases, although the percentage varies greatly depending on the region [7,8]. Systemic sclerosis (SSc) is a CTD with frequent pulmonary involvement [9]. A total of 40–80% of all patients show affection of the lung [10,11]. Radiologically, the predominant presentation is that of a nonspecific interstitial pneumonia (NSIP) pattern (78%), particularly associated with ground-glass opacities. Rarely, a usual interstitial pneumonia (UIP) pattern (5–10%) may occur [12]. HP is one of the granulomatous ILDs, and different radiological patterns may occur [13,14]. The most recent classification differentiates between non-fibrotic HP and fibrotic HP [15,16]. The classic HRCT appearance of non-fibrotic HP features ground-glass opacities, poorly defined centrilobular nodules and lobular areas of decreased attenuation representing air-trapping, while fibrotic HP shows irregular linear and reticular opacities, traction bronchiectasis/bronchiolectasis, lobar volume loss and honeycombing cysts, which may predominate in the upper, middle or lower lung zone, but often spare the outermost lung base [14,15,17,18].
While the distribution pattern in HP appears to be random and all lobes can be affected, IPF and SSc show a predominant involvement of the lower lobe. These sometimes-similar distribution patterns, in addition to the often overlapping radiological features and non-specific patterns, complicate the diagnosis. Often, invasive diagnostics must be resorted to, with the associated risks. Density analysis might further refine radiological diagnosis and the estimation of disease progression.
In this study, a quantitative analysis of CT densities during inspiration and expiration was performed: First, to test whether expiratory scans can reveal CT attenuation differences between normal controls and patients with different fibrotic lung diseases. Second, to investigate whether there are attenuation differences between the different types of ILDs examined. Third, to evaluate the relationship between CT lung attenuation in inspiration and expiration and lung expansion/diaphragmatic excursion to obtain a measure of density change per change in expansion.

2. Materials and Methods

2.1. Patients

This study was approved by the local ethics committee (BASEC Nr. 2018-01548). All patients provided written informed consent.
Chest CT scans of 60 participants were analyzed retrospectively including 15 patients with a diagnosis of IPF by a multidisciplinary team according to the ATS/ERS/JRS/ALAT guidelines [4,19], 15 patients with a multidisciplinary diagnosis of HP [14] and 15 patients with a clinical diagnosis of SSc-ILD. A total of 15 patients who received CT imaging due to various medical indications (e.g., unclear breathing difficulties) but showed radiologically normal lung parenchyma served as a control group. All patients received CT imaging due to medical indications for diagnosis or follow-up at our institution between 16 July 2015 and 14 May 2018.
In order to be able to estimate the extent of the limitations in lung function, lung function data were taken from the most recent body plethysmography.

2.2. Thorax CT and Imaging Modalities

All patients underwent CT imaging of the chest during routine clinical workup, using a 128-row detector CT scanner (Siemens SOMATOM Definition FLASH, Siemens Healthineers) or a 64-row detector CT scanner (Philips Medical Systems). Imaging was performed during breath-hold in end-inspiratory and end-expiratory suspended breathing positions. Prior to imaging procedures, patients received thorough instructions from specially trained radiology technologists regarding the required breathing maneuvers. These instructions were aimed at ensuring proper technique and optimal imaging results. Additionally, patients were given the opportunity to practice these breathing maneuvers a few times under the guidance of the specialists before the actual imaging took place. This process helped familiarize patients with the maneuvers and enhanced their ability to execute them accurately during the imaging procedure. The lungs were scanned from the lung apex to the diaphragm–rib angle, with the patients in a supine position, without an intravenous contrast agent.
The tube voltage was kept constant at 120 kVp or 100 kVp in all patients in inspiration and expiratory imaging. For imaging during inspiration, a standard dose protocol was employed, whereas a low dose protocol was utilized for expiratory imaging to ensure minimal radiation exposure to each patient. Both protocols used automatic exposure control using tube current modulation (CARE Dose4D Siemens Healthineers, DoseRight, Philips Healthcare). A spiral CT of the entire thorax was recorded with a slice thickness of 1mm. The pixel matrix was 512 × 512, collimation 128 × 0.6 mm, pitch factor 0.6, and rotation time 0.28 s. Siemens Sinogram-Affirmed Iterative Reconstruction (SAFIRE, magnitude 3) second-generation iterative reconstruction (kernel I31f) was used for the reconstruction of the Siemens SOMATOM Definition FLASH MDCT imaging. The iterative reconstruction of the images with the Philips Brilliance 64 was performed with iDose (strength 4, kernel standard B).

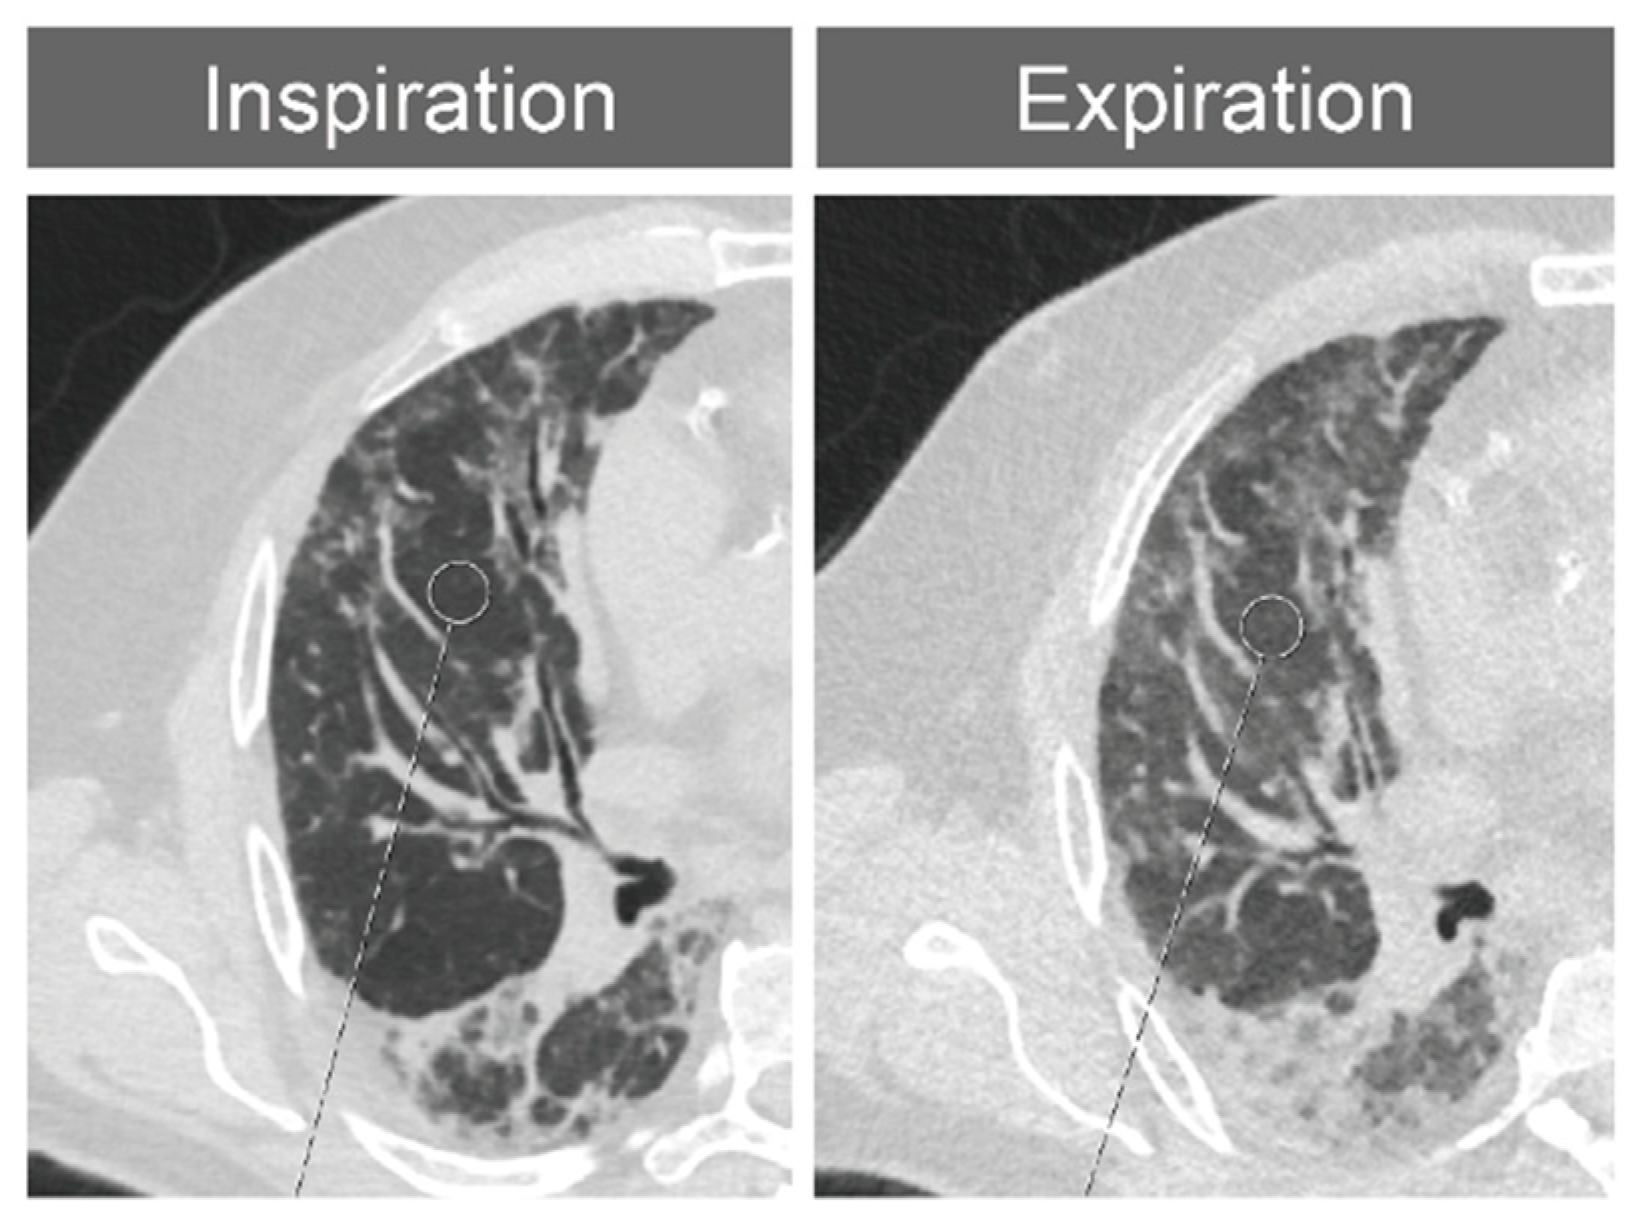
2.3. Segment-Based CT Densitometry

Density measurements were performed in each bronchopulmonary segment of both lungs according to the anatomical division of the lung in inspiration and expiration. For symmetry, two regions of interest (ROIs) each were measured in the apicoposterior segment (B1/2) and in the anteromedial segment (B7/8), giving a total of 40 measurements per patient and 4800 measurements for all patients and both readers in total. The measurements were performed independently by a radiologist with 5 years of experience in the assessment of CT imaging of the lungs (K.S.Y.) and a reader in continued education (W.M.F.) under the supervision of an experienced radiologist with 18 years of experience (P.A.). In radiologically healthy-appearing lung tissue, regions of interest with a diameter of 15 mm were manually annotated in axial slice images of 1 mm thickness in the lung window (window center: −500 Hounsfield units [HU]); window width, 1500 HU). When measuring the density in IPF, HP or SSc patients, special care was taken to place the ROI only in non-pathological-appearing lung tissue (Figure 1). Lung areas showing radiographic signs of fibrosis, emphysema, air trapping or other pathologies were avoided. If possible, pulmonary vessels were not included in the ROI. No measurement was performed in lung segments that were so altered by the underlying disease that normal-appearing lung parenchyma could no longer be identified.

2.4. Expansion Measurements

In addition, the pulmonary expansion between end-inspiration and end-expiration was measured. For this purpose, the distance between the lung apex and the diaphragm was measured in a coronary reformatted slice at the level of the carina in both lungs (AD distance). A straight line was drawn from the most apical point of the lung to the point on the diaphragm, perpendicular to the diaphragm. The diaphragmatic extension was calculated as the difference between the AD distance in inspiration and expiration.

2.5. Statistical Analysis
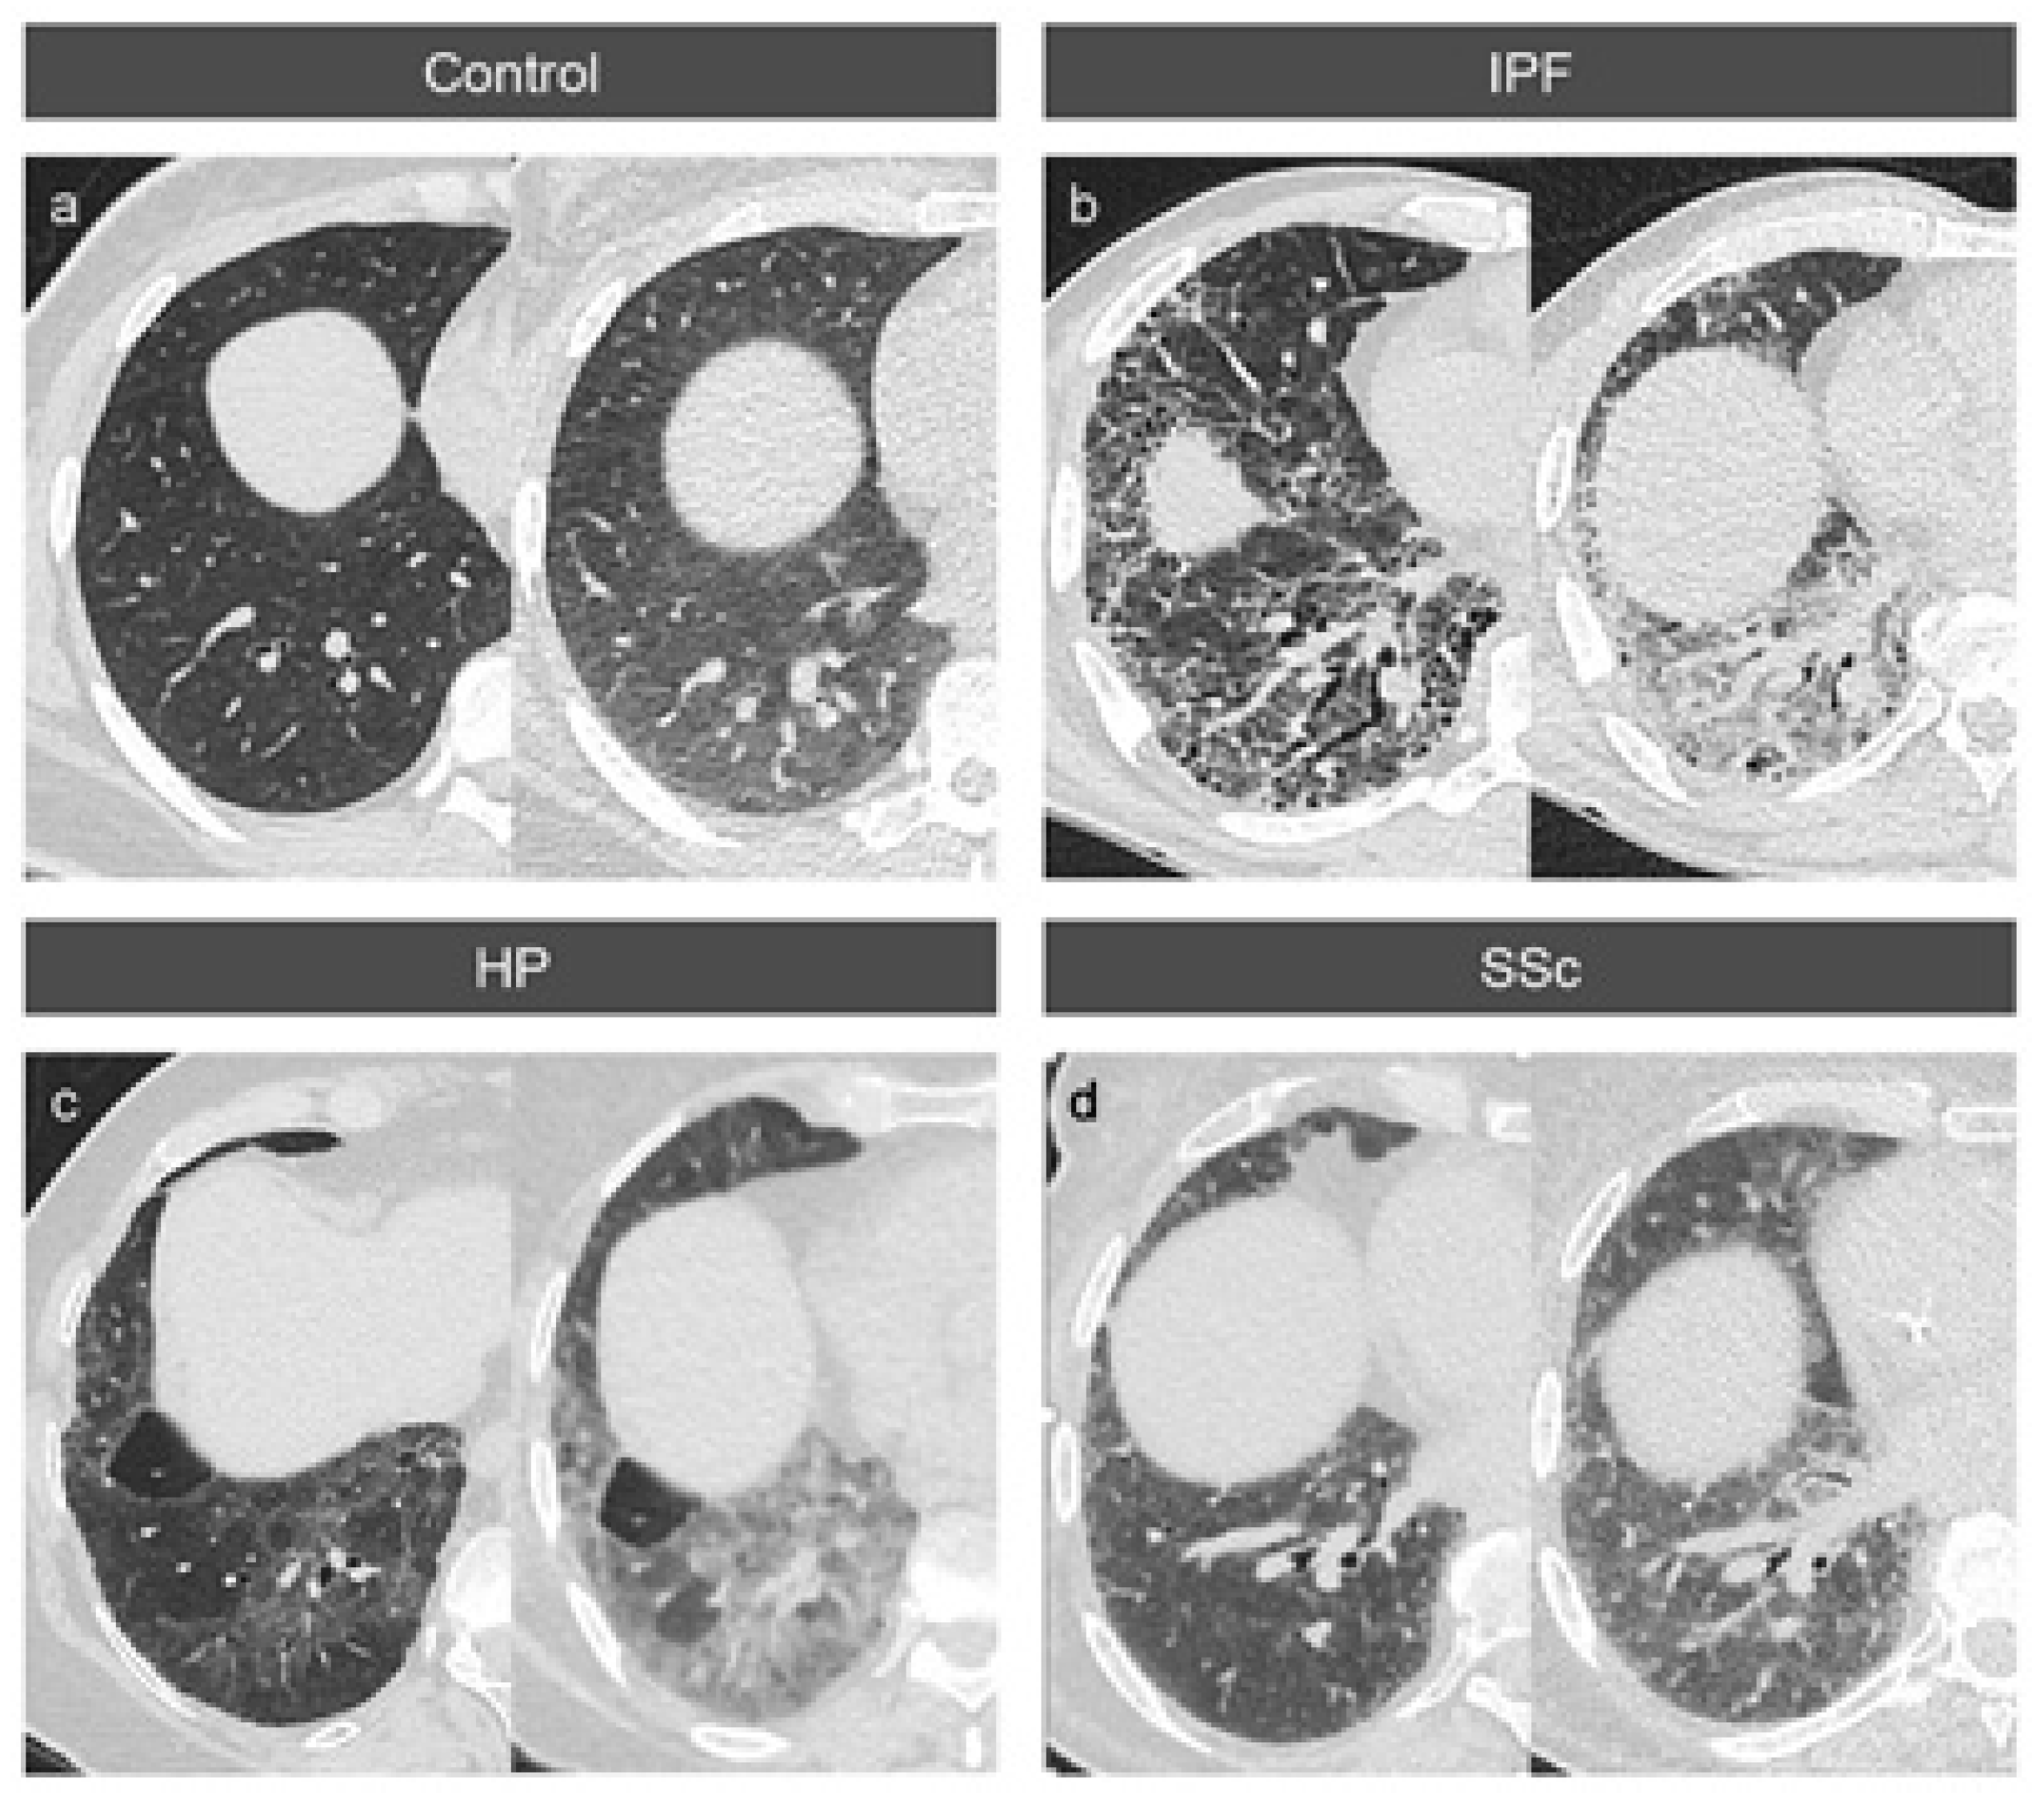
Statistical analysis was performed by using R version 3.5.2 and IBM SPSS Statistics version 25 (IBM, Armonk, NY, USA). By using a generalized linear mixed effects model with Kenward–Roger approximation, we analyzed the absolute attenuation values in inspiration and expiration and the absolute differences and percentage differences between inspiration and expiration separately as dependent variables. Disease was the independent variable and patients were included as random effects. We compared the pairwise differences of least-squares means between diseases [20,21].
A Kruskal–Wallis test was used for the assessment of lung density in absolute HU values in comparison to the expansion of the lung (apex–diaphragm). The variability between the readers was tested with single-score interclass correlation. Differences were considered statistically significant if the two-sided p-value was less than 0.05.

3. Results

3.1. Patient Characteristics

In total, 60 patients were included in this study. This included 15 patients with IPF (mean age, 64.8 years; range, 53–81 years), 15 patients with HP (mean age, 65.5; range, 45–79 years), 15 patients with radiographically confirmed pulmonary involvement in SSc-ILD (mean age, 62.2; range, 54–86 years) and, as control group, 15 patients without radiographic signs of ILD (mean age, 63.7; range, 45–78 years). In total, 36 men and 24 women were included in the study.
The results of the current pulmonary function test showed a similar degree of absolute restriction of the lung volumes in the different ILDs (Table 1). The predicted lung volumes were similar for HP and SSc but smaller for IPF.

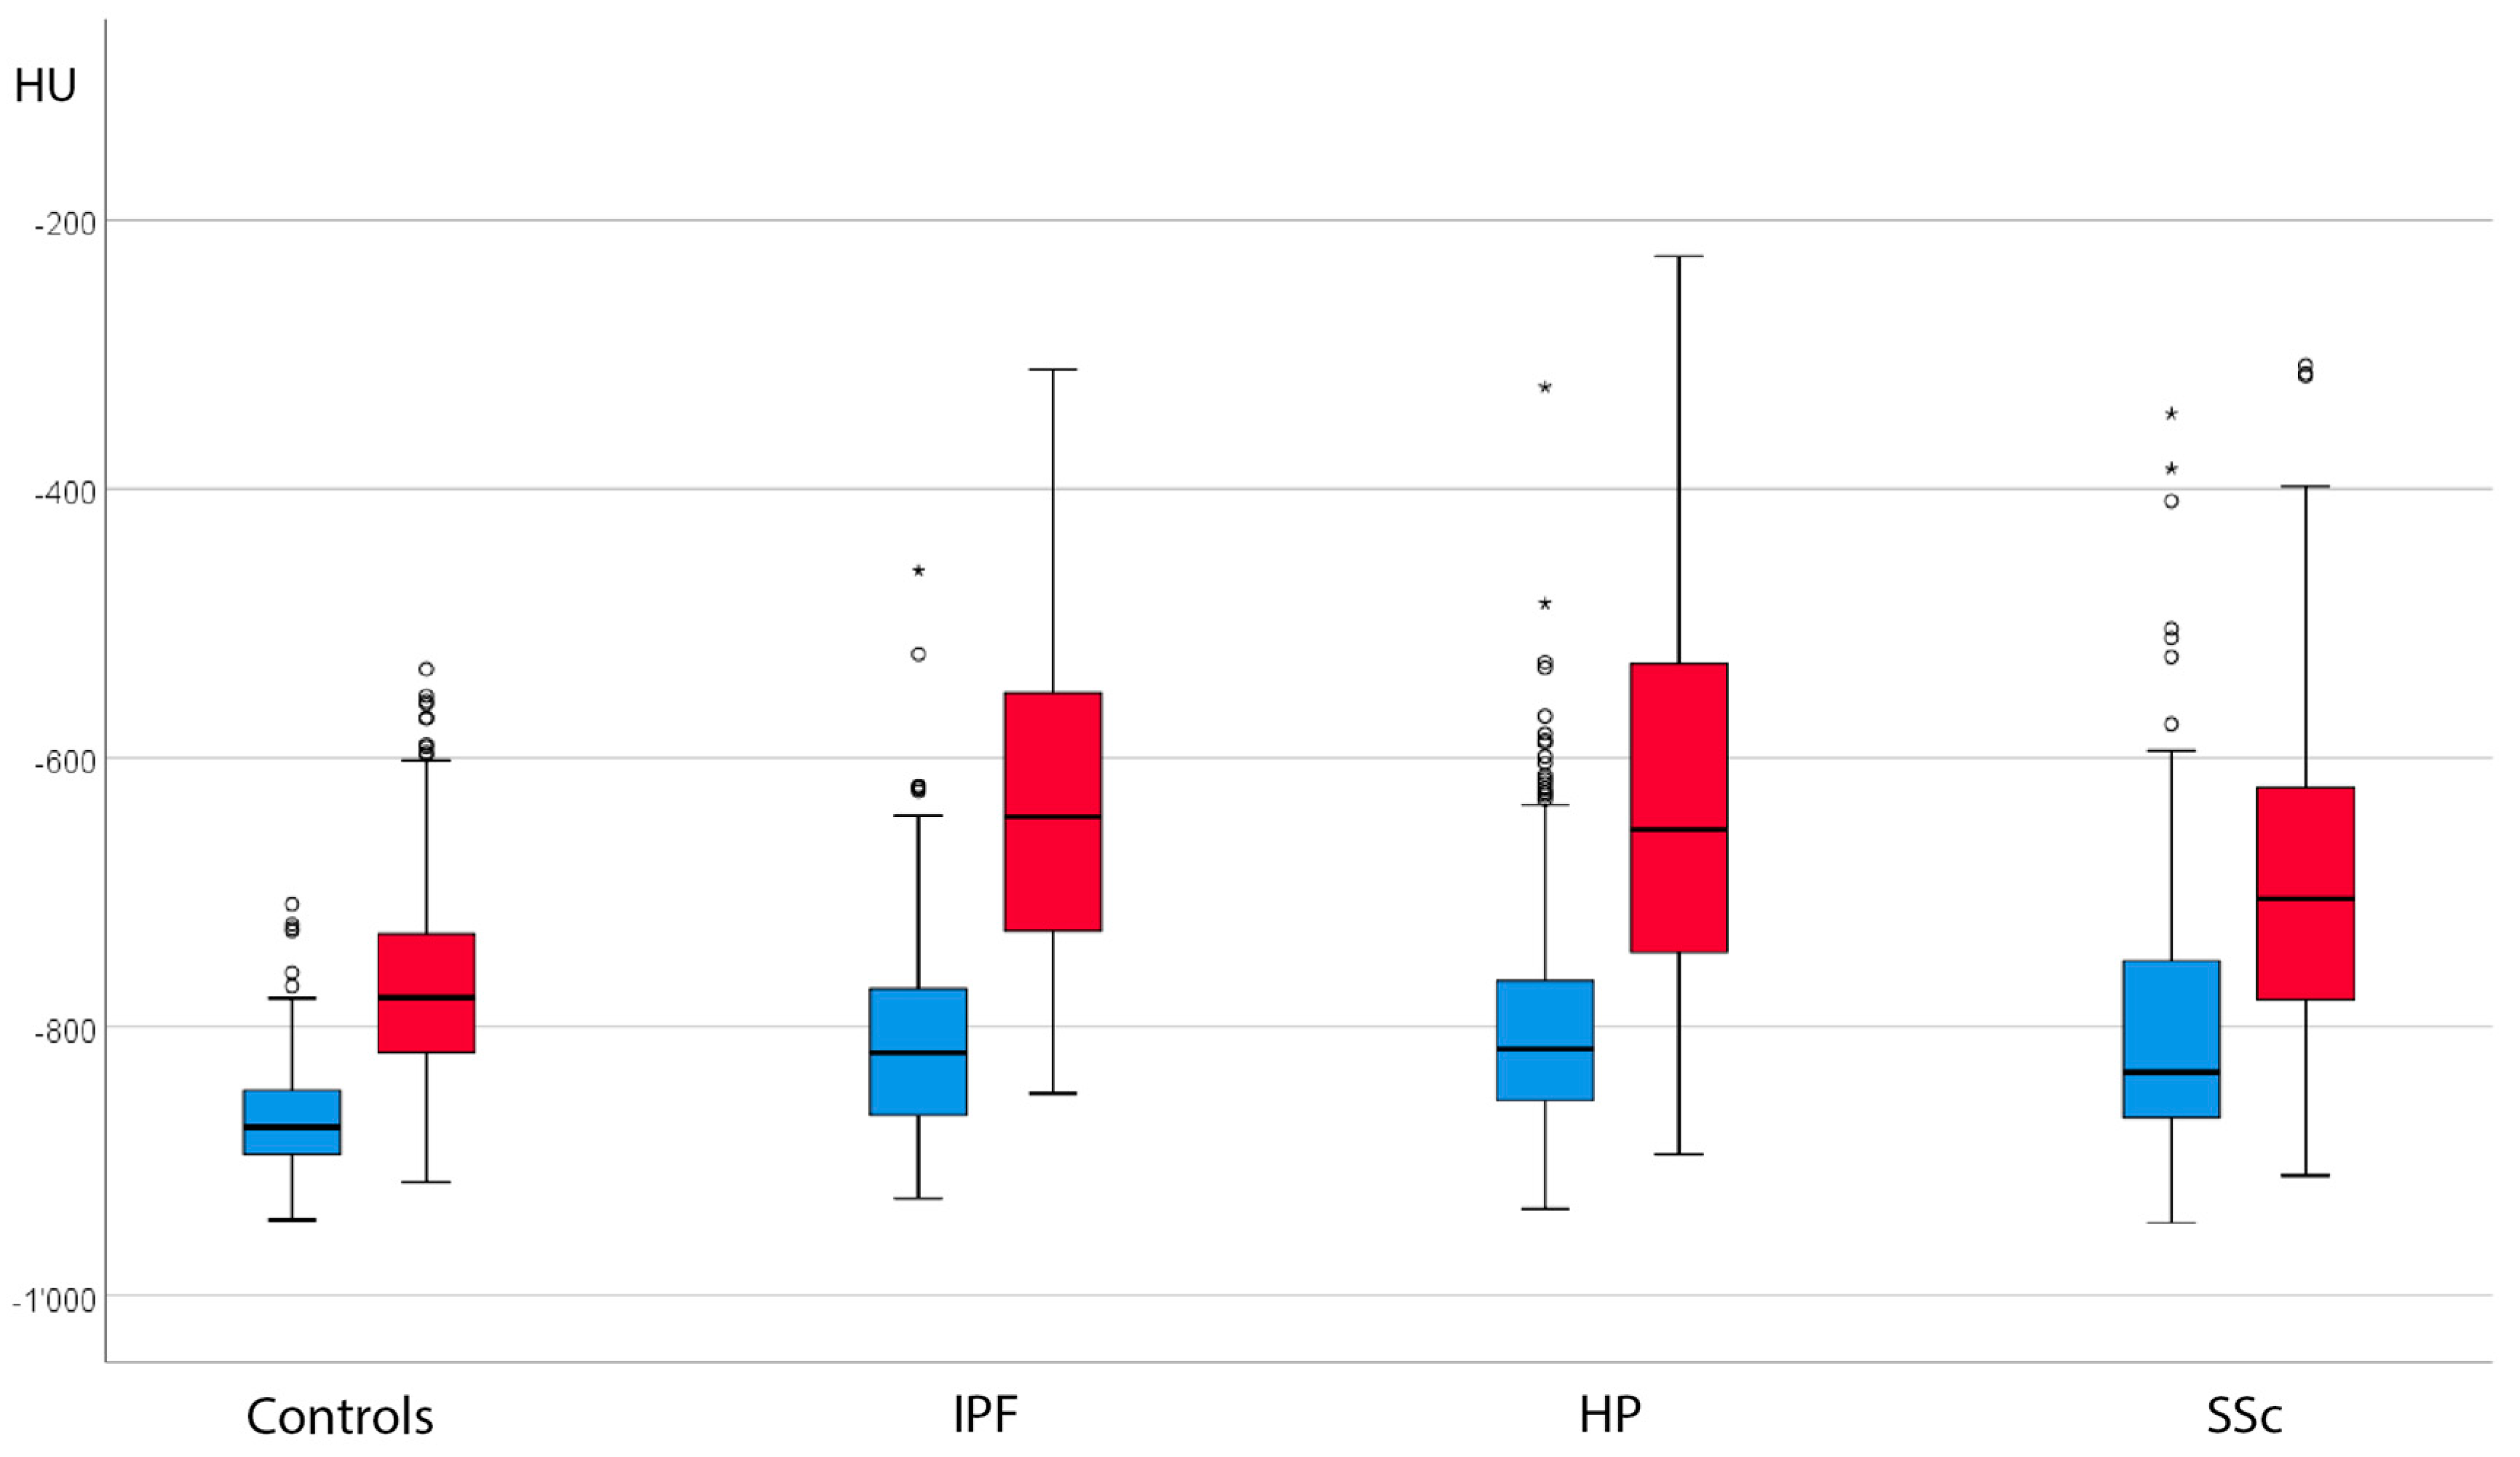
3.2. Absolute Attenuation Values

Each reader performed 2400 density measurements in inspiration and expiration on 60 patients (Table 2).
Already in end-inspiration, patients with IPF, HP and SSc showed significantly higher absolute density values in nearly all lung lobes compared to the control group (p < 0.01), with the exception of the upper lobe between IPF and controls (p = 0.074). There were no significant differences in absolute attenuation values between the different ILDs in all lobes during inspiration (p > 0.05) (Table 3).
Expiration resulted in an increase in density values in all groups. Compared to inspiration, the differences in density values between controls and the different ILDs became even larger, resulting in significant attenuation differences for all lobes between normal controls and the three ILDs (Figure 2). During expiration, there was no difference between the absolute HU-values of IPF and HP (p > 0.05). However, there were significant differences between SSc and IPF and SSc and HP, with significant differences in the middle lobe/lingula (p = 0.049) and the lower lobe between IPF and SSc (p = 0.030) and in the lower lobe between HP and SSc (p = 0.027).

3.3. Attenuation Differences between Inspiration and Expiration

The mean density increase between inspiration and expiration was significantly greater in IPF and HP patients than in controls and SSc (Table 4). This attenuation difference for IPF and HP was twice the attenuation difference for controls for all lobes (p < 0.001). The greatest increase in density for the entire lung and particularly for the lower lobe was observed in HP patients, followed by IPF patients. There were no significant differences in absolute HU increases between IPF and HP patients (p > 0.05). The SSc patients showed no statistically significant difference in density increase (expiration vs. inspiration) compared to the control group (p > 0.05).

3.4. Variable Density Increases in the Lung Lobes

The increase in density varied depending on the lung lobe. In general, the density increase was least in the middle lobe/lingula, followed by the upper lobe. The largest increase was observed in the lower lobes (Table 4). This pattern was noticeable in control subjects and all three ILD subtypes investigated. In IPF and HP patients, the density in the lower lobe increased by a factor of more than two compared to the other two lobes (Table 4). This increase in density is clearly visible on the CT imaging, particularly in the lower lobes (Figure 3).

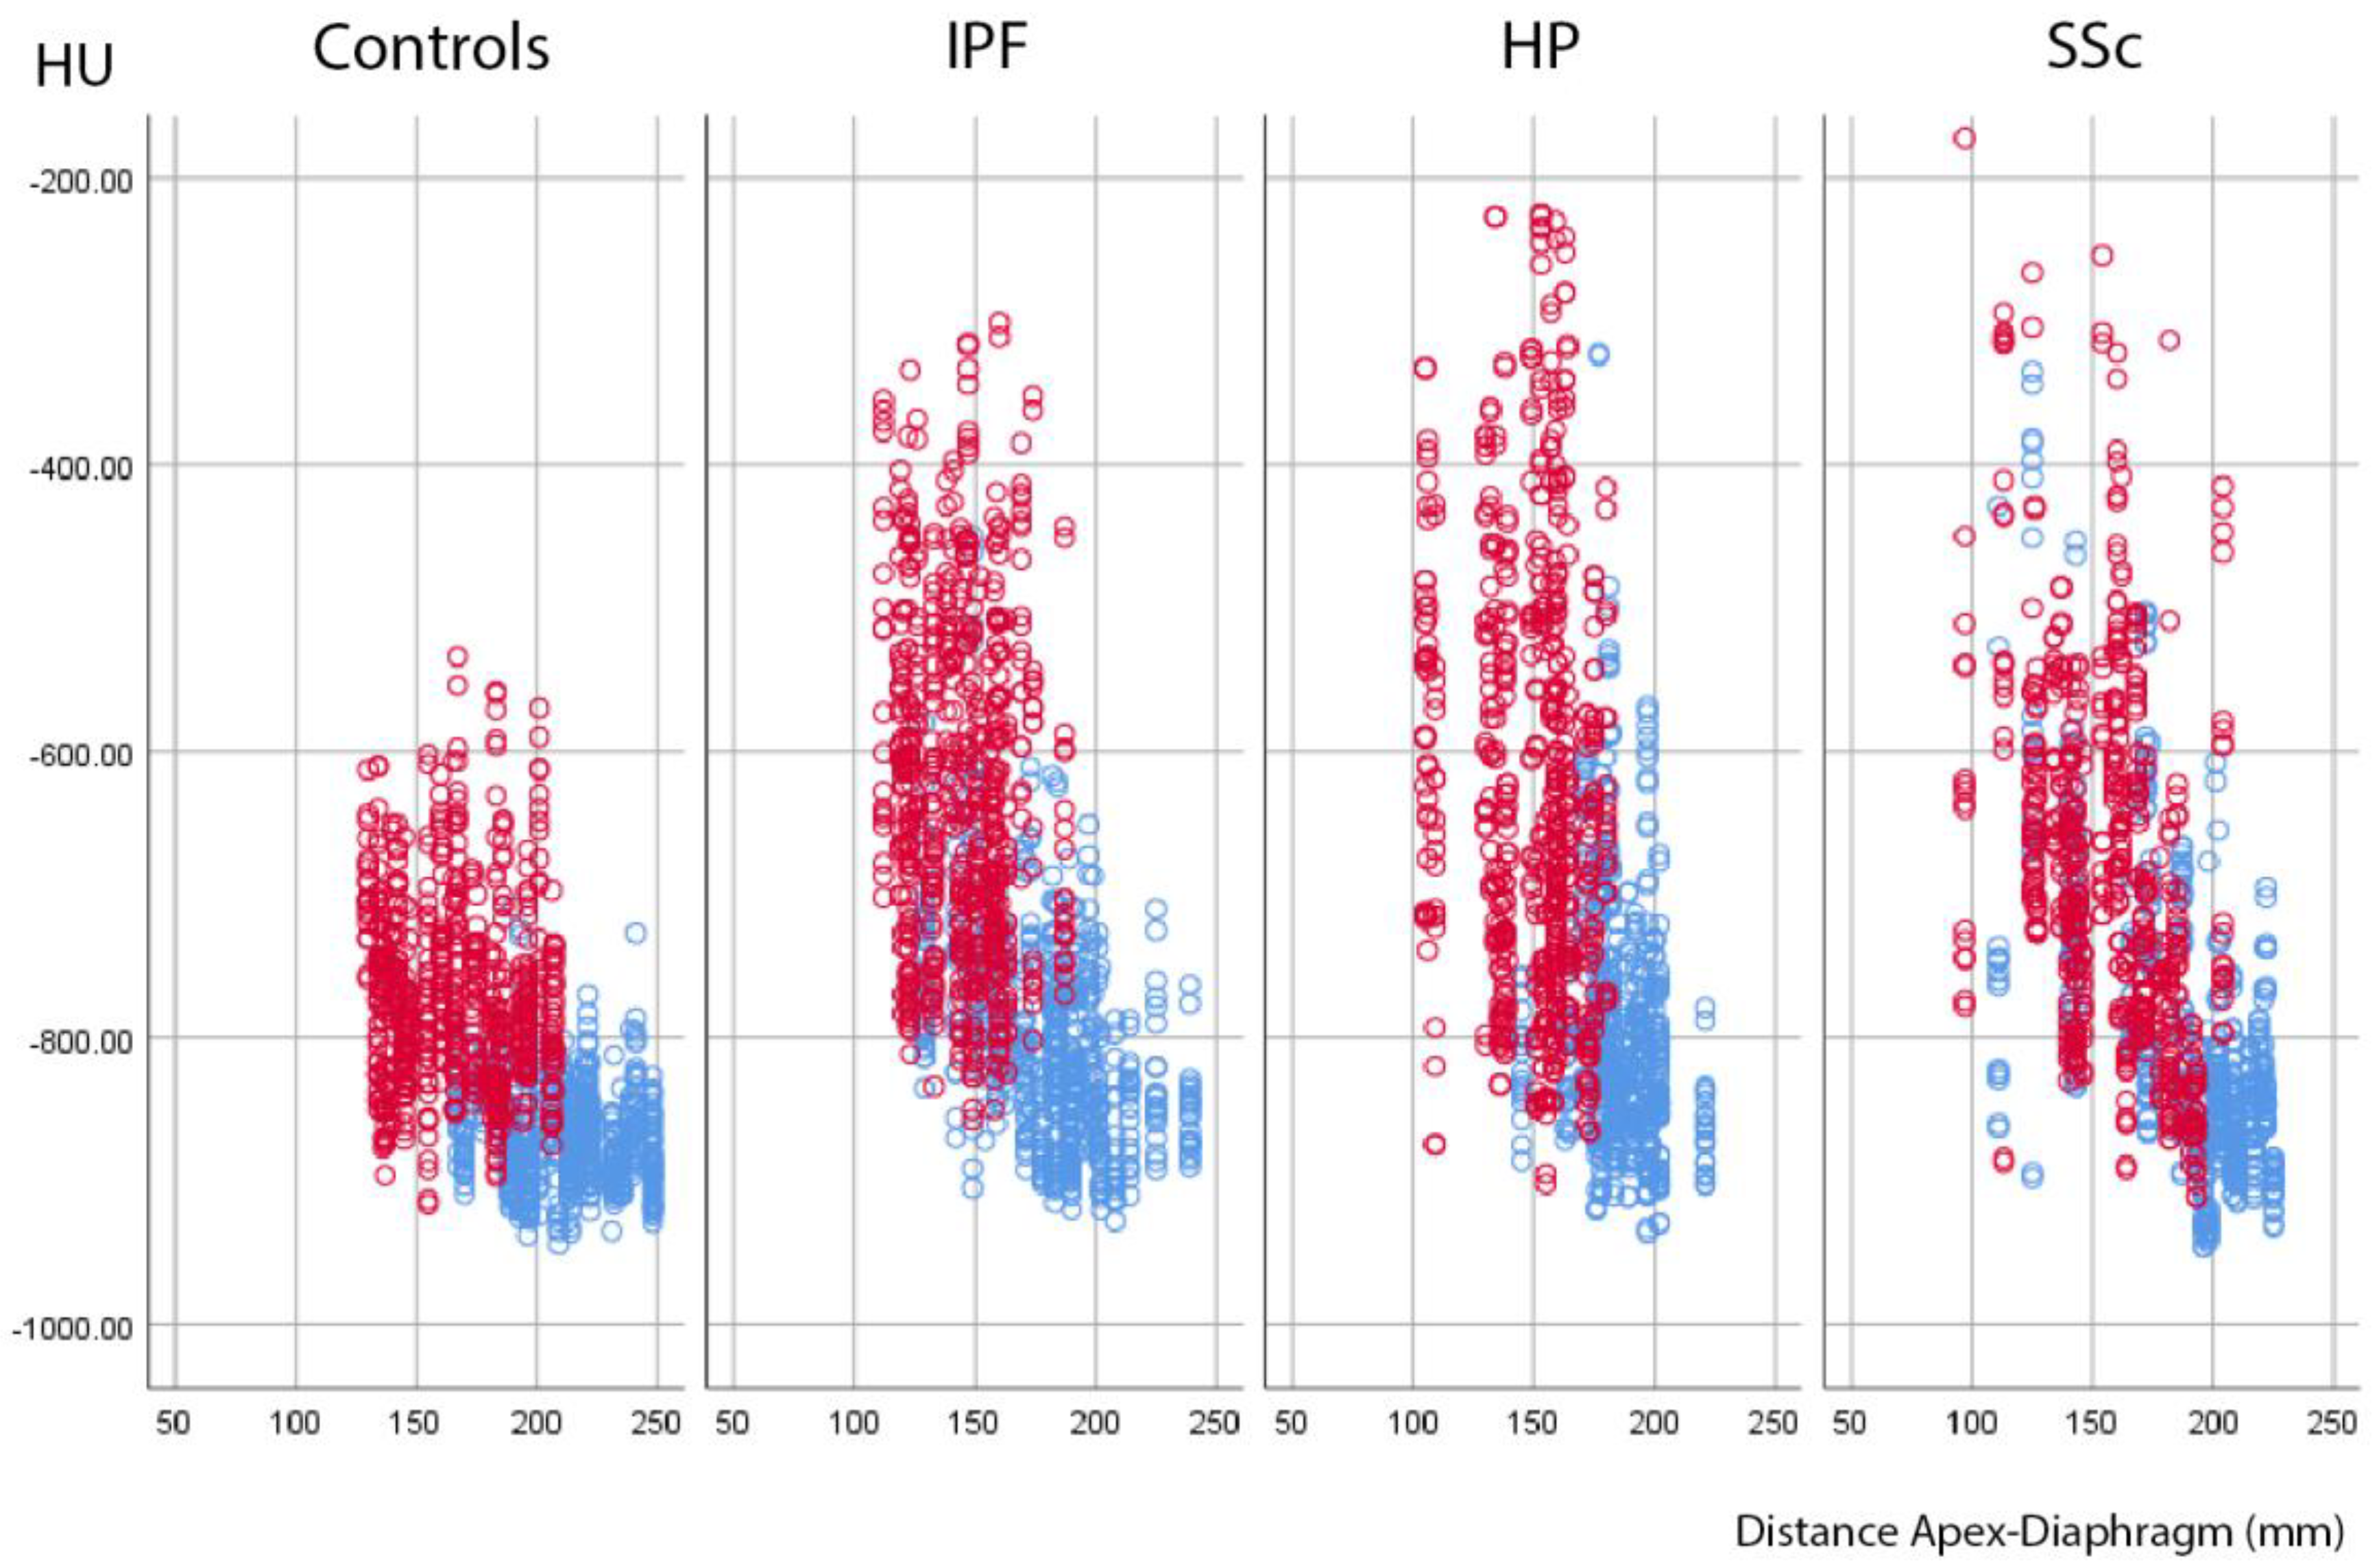
3.5. Expansion Measurements

When measuring the apex–diaphragm distance, a significant difference was found between the control group and the IPF group for the absolute measured values. This was observed both for inspiration (p = 0.001) and for expiration (p = 0.008). In contrast, there was no difference in the apex–diaphragm distance differences (diaphragmatic excursion) between inspiration and expiration between the controls and the IPF patients (p = 1.0). In HP, there was a significant difference for the apex–diaphragm distance in inspiration (p = 0.002) but not in expiration (p = 0.297) or for the diaphragmatic excursion (p = 0.611) compared to the control patients. The SSc patients showed no significant difference in inspiration (p = 0.1), expiration (p = 1.00) or diaphragmatic excursion (p = 0.41) compared to controls.

3.6. Correlation between Density Increase and Expansion

As mentioned above, the magnitude of the diaphragmatic excursion (apex–diaphragm distance between inspiration and expiration) between controls and IPF patients was similar. However, because density increases significantly more during expiration in IPF patients, the ratio of density change (in HU) to expansion change (in cm) was significantly higher in IPF patients than in controls. When the apex–diaphragm distance is plotted against the measured density values, the scatter diagram shows a steeper increase of the scatter plot slope of inspiration and expiration densities over the diaphragmatic expansion for the IPF patients than for the controls (Figure 4).

3.7. Interobserver Variability

There was no significant difference between the absolute and percentage density differences between the two readers (p > 0.05). Inter-reader variability tested with single-score interclass correlation was 0.95 (values above 0.9 indicate excellent reliability).

4. Discussion

The pathogenesis of fibrosis in patients with fibrosing ILD is still not completely understood. Current scientific knowledge suggests that repeated subclinical epithelial damage, in addition to accelerated epithelial aging, leads to the abnormal repair of damaged alveoli and subsequent formation of interstitial fibrosis by myofibroblasts [22]. HRCT of the lung is a key component of the multidisciplinary approach to diagnose ILD subtypes. Correct classification of disease subtype and disease extent is essential as management, treatment and prognosis largely differ between ILD subgroups and also depend on disease severity [23,24]. Recent studies have shown that expiratory imaging in IPF patients could further deepen our understanding of the pathogenesis of these diseases [5,25]. In this work, we focused both on expiratory and inspiratory imaging to determine whether quantitative analysis of CT lung density could provide new insights into the fibrotic mechanisms of different ILD subtypes.
In our study, patients with IPF and HP exhibited very similar radiological density values in non-fibrotic-appearing lung areas during inspiration and expiration (all lobes), ranging from a mean of −809 HU (inspiration) to −633 HU (expiration) for IPF and from −799 HU (inspiration) to −628 HU (expiration) for HP (Table 2). Consequently, there was no difference in attenuation changes between inspiration and expiration in patients with IPF and HP. In contrast, the comparison between IPF or HP on the one hand and the control group on the other hand showed significant differences in HU between inspiration and expiration (Table 3). We conclude that lung density increases significantly more during expiration in the normal-appearing lung tissue of fibrotic lungs of IPF and HP patients and that this phenomenon does not occur exclusively in IPF patients.
For the selected group of patients, there was no significant change in attenuation difference between IPF and SSc or between HP and SSc.
In contrast to the study performed by Park J et al. [25], our measurements showed no significant difference in the absolute craniocaudal movement of the diaphragm during the respiratory cycle between IPF patients and controls. This suggests that in IPF patients, the HU density change and, therefore, the mass density change, with a linear relationship between HU density and mass density being anticipated [26] per diaphragmatic extension (in centimeters), is higher than in controls. This increase in lung density in IPF patients might be caused by the collapse of the alveoli during expiration. The progression of pulmonary fibrosis can be caused by increased mechanical stress on alveolar stem cells due to a disruption of alveolar regeneration [27]. In addition, alveolar collapse might stimulate the TGF-β-signaling pathway, leading to the progression of fibrosis. Furthermore, the cause of alveolar collapse is partly observed in the dysfunction of surfactant proteins [28]. In the last few years, it has been shown that the progressive fibrotic phenotype is not unique to IPF but is also observed in other fibrosing ILDs [29,30]. According to the latest ATS/ERS guidelines, progressive pulmonary fibrosis is defined as a worsening of respiratory symptoms, a decrease in lung function parameters or an increase in fibrotic changes on imaging within one year. Both HP and SSc show a progressive pulmonary fibrosis phenotype in about 50% of cases [31].
Similar to Kolb et al., we also found increased expiratory density in non-IPF ILDs [29]. In our study, IPF and fibrotic HP showed an almost identically increased attenuation during expiration. The increased density that we document in normal-appearing lung tissue could represent the CT–morphological correlate of this microscopically, incipient, progressive fibrosis.
Expiratory lung CT scans are part of the established work-up in lung diseases with bronchiolitis such as HP [32]. In our study, we suggest that expiratory CT might also add to the understanding of fibrotic changes. While it may be too early to directly incorporate our findings into routine clinical practice, comprehensive prospective studies of larger scale are imperative to discern if the supplementary data gleaned from expiratory CT scans can serve as predictive markers for the advancement towards a fibrotic phenotype or even patient survival outcomes. To this end, a careful examination of the longitudinal course of patients showing a significant increase in expiratory density should be contrasted with patients showing a minor increase. We can envision that, upon validation, these findings could wield a profound influence on the forthcoming paradigm of diagnostic and therapeutic modalities in the field.
This study has several limitations. In the age of artificial intelligence (AI), it seems peculiar that we have preferred the manual measurement of densitometry over the automatic quantitative analysis of density values. However, we have used manual measurement of densitometry rather than automatic quantitative analysis of the density by AI to accurately localize the same ROIs of healthy-appearing tissue in the inspiratory and expiration images. Until a few years ago, the necessary algorithms to correctly register lung structures in HRCT in IPF patients were lacking. Recently, multiple studies with quantitative analyses have been published. For example, Jacob et al. showed that predicting the outcome of IPF patients could be possible with quantitative CT measurements [33]. Therefore, density values and expansion should be recorded automatically in future studies in order to provide a more objective assessment of, in particular, the correlation between lung density and survival. As a further limitation, this study did not objectify how well the test subjects actually participated in the breathing maneuvers. A certain degree of error in the results due to variable inspiration and expiration depth must therefore be assumed. In a prospective study design, for example, the moved respiratory volumes could be recorded using a handheld spirometer in order to avoid this limitation. And, finally, by analyzing only 15 patients per group, there could be a selection bias such that the severity of disease in patients could explain why we measured less density increase on expiration in SSc patients compared to patients with the other ILDs. However, this also reflects the well-known fact that the extent of fibrosis in SSc-ILD is usually less severe than in IPF patients [34].

5. Conclusions

According to our study, not only patients with idiopathic pulmonary fibrosis (IPF) but also those with hypersensitivity pneumonitis (HP) exhibit a greater increase in expiratory density in the non-fibrotic appearing lung tissue compared to healthy controls. This increased density is larger, despite similar diaphragmatic expansion to the control group during the respiratory cycle, indicating a disproportionate increase in lung density in these fibrotic lung diseases. These findings could potentially enhance our understanding of the development of fibrotic interstitial lung disease (ILD) and aid in the identification of appropriate diagnostic and therapeutic options in future studies.

Author Contributions

Conceptualization, M.F.W. and A.P.; Data curation, A.L. and A.P.; Formal analysis, M.F.W., A.L. and A.P.; Investigation, M.F.W., S.-Y.K. and A.P.; Methodology, S.A.G. and A.P.; Project administration, A.P.; Resources, T.G., J.H., B.M. and A.P.; Supervision, A.P.; Visualization, M.F.W. and A.P.; Writing—original draft, M.F.W. and S.-Y.K.; Writing—review & editing, M.F.W., S.-Y.K., A.L., S.B., S.A.G., B.M. and A.P. All authors have read and agreed to the published version of the manuscript.

Funding

This research received no external funding.

Institutional Review Board Statement

This study was conducted in accordance with the Declaration of Helsinki and approved by the local ethics committee (Kantonale Ethikkomission, Kanton Bern—BASEC Nr. 2018-01548).

Informed Consent Statement

Informed written consent was obtained from all subjects involved in the study.

Data Availability Statement

Supporting data are available for review by the corresponding author upon reasonable request.

Conflicts of Interest

The authors declare no conflict of interest.

Abbreviations

AI:Artificial intelligence
CT:Computed tomography
CTD-ILD:Connective tissue disease-associated ILD
DLCOcCorrected diffusion capacity of the lungs for carbon monoxide
GGO:Ground-glass opacities
FEV1Forced first-second volume
FVCForced vital capacity
HP:Hypersensitivity pneumonitis
HRCT:High-resolution computed tomography
HU:Hounsfield units
ILD:Interstitial lung disease
IPF:Idiopathic pulmonary fibrosis
NSIP:Nonspecific interstitial pneumonia
ROI:Region of interest
SSc:Systemic sclerosis
UIP:Usual interstitial pneumonia

References

  1. Saldana, D.C.; Hague, C.J.; Murphy, D.; Coxson, H.O.; Tschirren, J.; Peterson, S.; Sieren, J.P.; Kirby, M.; Ryerson, C.J. Association of Computed Tomography Densitometry with Disease Severity, Functional Decline, and Survival in Systemic Sclerosis-associated Interstitial Lung Disease. Ann. Am. Thorac. Soc. 2020, 17, 813–820. [Google Scholar] [CrossRef] [PubMed]
  2. Loeh, B.; Brylski, L.T.; von der Beck, D.; Seeger, W.; Krauss, E.; Bonniaud, P.; Crestani, B.; Vancheri, C.; Wells, A.U.; Markart, P.; et al. Lung CT Densitometry in Idiopathic Pulmonary Fibrosis for the Prediction of Natural Course, Severity, and Mortality. Chest 2019, 155, 972–981. [Google Scholar] [CrossRef]
  3. Prosch, H.; Schaefer-Prokop, C.M.; Eisenhuber, E.; Kienzl, D.; Herold, C.J. CT protocols in interstitial lung diseases—A survey among members of the European Society of Thoracic Imaging and a review of the literature. Eur. Radiol. 2013, 23, 1553–1563. [Google Scholar] [CrossRef] [PubMed]
  4. Raghu, G.; Remy-Jardin, M.; Myers, J.L.; Richeldi, L.; Ryerson, C.J.; Lederer, D.J.; Behr, J.; Cottin, V.; Danoff, S.K.; Morell, F.; et al. Diagnosis of Idiopathic Pulmonary Fibrosis. An Official ATS/ERS/JRS/ALAT Clinical Practice Guideline. Am. J. Respir. Crit. Care Med. 2018, 198, e44–e68. [Google Scholar] [CrossRef] [PubMed]
  5. Petroulia, V.; Funke, M.; Zumstein, P.; Berezowska, S.; Ebner, L.; Geiser, T.; Torbica, N.; Heverhagen, J.; Poellinger, A. Increased Expiratory Computed Tomography Density Reveals Possible Abnormalities in Radiologically Preserved Lung Parenchyma in Idiopathic Pulmonary Fibrosis. Investig. Radiol. 2018, 53, 45–51. [Google Scholar] [CrossRef]
  6. Cottin, V.; Hirani, N.A.; Hotchkin, D.L.; Nambiar, A.M.; Ogura, T.; Otaola, M.; Skowasch, D.; Park, J.S.; Poonyagariyagorn, H.K.; Wuyts, W.; et al. Presentation, diagnosis and clinical course of the spectrum of progressive-fibrosing interstitial lung diseases. Eur. Respir. Rev. 2018, 27, 180076. [Google Scholar] [CrossRef]
  7. Salciccioli, J.D.; Marshall, D.C.; Goodall, R.; Crowley, C.; Shalhoub, J.; Patel, P.; Molyneaux, P.L. Comparison of registries of interstitial lung diseases in three European countries. Eur. Respir. J. 2001, 18 (Suppl. 32), 114s–118s. [Google Scholar] [CrossRef]
  8. Hyldgaard, C.; Hilberg, O.; Muller, A.; Bendstrup, E. A cohort study of interstitial lung diseases in central Denmark. Respir. Med. 2014, 108, 793–799. [Google Scholar] [CrossRef] [PubMed]
  9. Capobianco, J.; Grimberg, A.; Thompson, B.M.; Antunes, V.B.; Jasinowodolinski, D.; Meirelles, G.S.P. Thoracic manifestations of collagen vascular diseases. Radiographics 2012, 32, 33–50. [Google Scholar] [CrossRef]
  10. Denton, C.P.; Khanna, D. Systemic sclerosis. Lancet 2017, 390, 1685–1699. [Google Scholar] [CrossRef]
  11. Bergamasco, A.; Hartmann, N.; Wallace, L.; Verpillat, P. Epidemiology of systemic sclerosis and systemic sclerosis-associated interstitial lung disease. Clin. Epidemiol. 2019, 11, 257–273. [Google Scholar] [CrossRef] [PubMed]
  12. Rehbock, B. Pulmonale Beteiligung bei Kollagenosen. Radiologe 2015, 55, 241–256. [Google Scholar] [CrossRef]
  13. American Thoracic Society; European Respiratory Society. American Thoracic Society/European Respiratory Society International Multidisciplinary Consensus Classification of the Idiopathic Interstitial Pneumonias. Am. J. Respir. Crit. Care Med. 2002, 165, 277–304. [Google Scholar] [CrossRef]
  14. Elicker, B.M.; Jones, K.D.; Henry, T.S.; Collard, H.R. Multidisciplinary Approach to Hypersensitivity Pneumonitis. J. Thorac. Imaging 2016, 31, 92–103. [Google Scholar] [CrossRef] [PubMed]
  15. Raghu, G.; Remy-Jardin, M.; Ryerson, C.J.; Myers, J.L.; Kreuter, M.; Vasakova, M.; Bargagli, E.; Chung, J.H.; Collins, B.F.; Bendstrup, E.; et al. Diagnosis of Hypersensitivity Pneumonitis in Adults. An Official ATS/JRS/ALAT Clinical Practice Guideline. Am. J. Respir. Crit. Care Med. 2020, 202, e36–e69. [Google Scholar] [CrossRef]
  16. Vasakova, M.; Morell, F.; Walsh, S.; Leslie, K.; Raghu, G. Hypersensitivity Pneumonitis: Perspectives in Diagnosis and Management. Am. J. Respir. Crit. Care Med. 2017, 196, 680–689. [Google Scholar] [CrossRef] [PubMed]
  17. Magee, A.L.; Montner, S.M.; Husain, A.; Adegunsoye, A.; Vij, R.; Chung, J.H. Imaging of Hypersensitivity Pneumonitis. Radiol. Clin. N. Am. 2016, 54, 1033–1046. [Google Scholar] [CrossRef] [PubMed]
  18. Varone, F.; Iovene, B.; Sgalla, G.; Calvello, M.; Calabrese, A.; Larici, A.R.; Richeldi, L. Fibrotic Hypersensitivity Pneumonitis: Diagnosis and Management. Lung 2020, 198, 429–440. [Google Scholar] [CrossRef] [PubMed]
  19. Raghu, G.; Collard, H.R.; Egan, J.J.; Martinez, F.J.; Behr, J.; Brown, K.K.; Colby, T.V.; Cordier, J.-F.; Flaherty, K.R.; Lasky, J.A.; et al. An Official ATS/ERS/JRS/ALAT Statement: Idiopathic Pulmonary Fibrosis: Evidence-based Guidelines for Diagnosis and Management. Am. J. Respir. Crit. Care Med. 2011, 183, 788–824. [Google Scholar] [CrossRef] [PubMed]
  20. Shaker, S.B.; Dirksen, A.; Lo, P.; Skovgaard, L.T.; de Bruijne, M.; Pedersen, J.H. Factors influencing the decline in lung density in a Danish lung cancer screening cohort. Eur. Respir. J. 2012, 40, 1142–1148. [Google Scholar] [CrossRef]
  21. Buckler, A.J.; Danagoulian, J.; Johnson, K.; Peskin, A.; Gavrielides, M.A.; Petrick, N.; Obuchowski, N.A.; Beaumont, H.; Hadjiiski, L.; Jarecha, R.; et al. Inter-Method Performance Study of Tumor Volumetry Assessment on Computed Tomography Test-Retest Data. Acad. Radiol. 2015, 22, 1393–1408. [Google Scholar] [CrossRef]
  22. Orbach, H.; Karlinskaya, M.; Fruchter, O. Idiopathic Pulmonary Fibrosis. N. Engl. J. Med. 2018, 379, 795–798. [Google Scholar] [CrossRef]
  23. Lynch, D.A.; Godwin, J.D.; Safrin, S.; Starko, K.M.; Hormel, P.; Brown, K.K.; Raghu, G.; King, T.E., Jr.; Bradford, W.Z.; Schwartz, D.A.; et al. High-resolution computed tomography in idiopathic pulmonary fibrosis: Diagnosis and prognosis. Am. J. Respir. Crit. Care Med. 2005, 172, 488–493. [Google Scholar] [CrossRef] [PubMed]
  24. Best, A.C.; Meng, J.; Lynch, A.M.; Bozic, C.M.; Miller, D.; Grunwald, G.K.; Lynch, D.A. Idiopathic pulmonary fibrosis: Physiologic tests, quantitative CT indexes, and CT visual scores as predictors of mortality. Radiology 2008, 246, 935–940. [Google Scholar] [CrossRef]
  25. Park, J.; Jung, J.; Yoon, S.H.; Goo, J.M.; Hong, H.; Yoon, J.-H. Inspiratory Lung Expansion in Patients with Interstitial Lung Disease: CT Histogram Analyses. Sci. Rep. 2018, 8, 15265. [Google Scholar] [CrossRef] [PubMed]
  26. Sudhyadhom, A. On the molecular relationship between Hounsfield Unit (HU), mass density, and electron density in computed tomography (CT). PLoS ONE 2020, 15, e0244861. [Google Scholar] [CrossRef] [PubMed]
  27. Wu, H.; Yu, Y.; Huang, H.; Hu, Y.; Fu, S.; Wang, Z.; Shi, M.; Zhao, X.; Yuan, J.; Li, J.; et al. Progressive Pulmonary Fibrosis Is Caused by Elevated Mechanical Tension on Alveolar Stem Cells. Cell 2019, 180, 107–121.e17. [Google Scholar] [CrossRef] [PubMed]
  28. Lutz, D.; Gazdhar, A.; Lopez-Rodriguez, E.; Ruppert, C.; Mahavadi, P.; Günther, A.; Klepetko, W.; Bates, J.H.; Smith, B.; Geiser, T.; et al. Alveolar Derecruitment and Collapse Induration as Crucial Mechanisms in Lung Injury and Fibrosis. Am. J. Respir. Cell Mol. Biol. 2015, 52, 232–243. [Google Scholar] [CrossRef]
  29. Kolb, M.; Vašáková, M. The natural history of progressive fibrosing interstitial lung diseases. Respir. Res. 2019, 20, 57. [Google Scholar] [CrossRef]
  30. George, P.M.; Spagnolo, P.; Kreuter, M.; Altinisik, G.; Bonifazi, M.; Martinez, F.J.; Molyneaux, P.L.; Renzoni, E.A.; Richeldi, L.; Tomassetti, S.; et al. Progressive fibrosing interstitial lung disease: Clinical uncertainties, consensus recommendations, and research priorities. Lancet Respir. Med. 2020, 8, 925–934. [Google Scholar] [CrossRef] [PubMed]
  31. Raghu, G.; Remy-Jardin, M.; Richeldi, L.; Thomson, C.C.; Inoue, Y.; Johkoh, T.; Kreuter, M.; Lynch, D.A.; Maher, T.M.; Martinez, F.J.; et al. Idiopathic Pulmonary Fibrosis (an Update) and Progressive Pulmonary Fibrosis in Adults: An Official ATS/ERS/JRS/ALAT Clinical Practice Guideline. Am. J. Respir. Crit. Care Med. 2022, 205, e18–e47. [Google Scholar] [CrossRef] [PubMed]
  32. Miller, W.T.; Chatzkel, J.; Hewitt, M.G. Expiratory Air Trapping on Thoracic Computed Tomography. A Diagnostic Subclassification. Ann. Am. Thorac. Soc. 2014, 11, 874–881. [Google Scholar] [CrossRef] [PubMed]
  33. Jacob, J.; Bartholmai, B.J.; Rajagopalan, S.; van Moorsel, C.H.M.; van Es, H.W.; van Beek, F.T.; Struik, M.H.L.; Kokosi, M.; Egashira, R.; Brun, A.L.; et al. Predicting Outcomes in Idiopathic Pulmonary Fibrosis Using Automated Computed Tomographic Analysis. Am. J. Respir. Crit. Care Med. 2018, 198, 767–776. [Google Scholar] [CrossRef]
  34. Desai, S.R.; Veeraraghavan, S.; Hansell, D.M.; Nikolakopolou, A.; Goh, N.S.L.; Nicholson, A.G.; Colby, T.V.; Denton, C.P.; Black, C.M.; du Bois, R.M.; et al. CT Features of Lung Disease in Patients with Systemic Sclerosis: Comparison with Idiopathic Pulmonary Fibrosis and Nonspecific Interstitial Pneumonia. Radiology 2004, 232, 560–567. [Google Scholar] [CrossRef] [PubMed]
Figure 1. Placement of an ROI in healthy-appearing lung tissue of a patient with IPF while avoiding the pulmonary vessels.
Biomed 03 00038 g001
Figure 2. Absolute HU values for inspiration (blue) and expiration (red) across all four groups (all lobes). For inspiration and expiration, there were significant differences between controls and the different ILD groups (p < 0.01). There was no significant difference between IPF, HP and SSc patients during inspiration. In end-expiration, there was no significant difference between IPF and HP (p = 0.874) but a significant difference between IPF and SSc (p = 0.043) and HP and SSc (p = 0.03).
Biomed 03 00038 g002
Figure 3. CT images in axial reconstruction of the lower lobe of the right lung. Inspiration on the left, expiration on the right. A clear density increase is visible in expiration. [(a) = control; (b) = IPF; (c) = HP; (d) SSc-ILD.].
Biomed 03 00038 g003
Figure 4. HU values in inspiration (blue) and expiration (red) for the whole lung, plotted over the distance between lung apex and diaphragm. Although the apex–diaphragm difference between inspiration and expiration was not significantly different between diseases, there was a significant difference in the Hounsfield units. This result suggests a disproportionate density increase in expiration for fibrotic lung disease compared with normal controls.
Biomed 03 00038 g004
Table 1. Patient characteristics for all four groups. The total fibrosis score was obtained by summing the extent of all radiological fibrosis features (honeycombing, reticulations, traction bronchiectasis and ground-glass opacities). No fibrosis score was collected for the controls. Lung function data were obtained from the most recent body plethysmography. [Mean ± standard deviation.] Abbreviations: IPF, Idiopatic pulmonary fibrosis; HP, Hypersensitivity pneumonitis; SSc-ILD, Systemic sclerosis-associated interstitial lung disease; GGO, Ground-glass opacities; FVC, Forced vital capacity; FEV1, Forced first-second volume; DLCOc, Corrected diffusing capacity of the lungs for carbon monoxide.
DiseaseIPFHPSSc-ILDControls
Mean age (years)64.865.562.263.7
GenderF = 0
M = 15
F = 5
M = 10
F = 13
M = 2
F = 6
M = 9
Extent of Honeycombing15 ± 14.56 ± 7.811 ± 14.9None
Extent of Reticulations52 ± 14.242 ± 24.234 ± 15.9None
Extent of Traction-bronchiectasis40 ± 13.631 ± 20.121 ± 11.7None
Extent of Ground-glass Opacities 17 ± 18.840 ± 24.520 ± 9.7None
Visual Fibrosis Score (incl. GGO)124 ± 35.2119 ± 59.086 ± 34.7None
Visual Fibrosis Score (excl. GGO)107 ± 28.479 ± 44.165 ± 33.9None
FVC (L)2.5 ± 0.72.7 ± 0.72.4 ± 0.93.7 ± 1.1
FVC % Predicted58.9 ± 15.570.2 ± 21.772.5 ± 27.9103.3 ± 11.0
FEV1 (L)2.1 ± 0.72.1 ± 0.51.8 ± 0.62.6 ± 0.6
FEV1 % Predicted65.3 ± 18.671.2 ± 20.270.7 ± 26.193.5 ± 12.1
DLCOc (mmol/(min*kPa)4.1 ± 1.34.3 ± 1.44.5 ± 1.86.3 ± 2.0
DLCOc % Predicted45.1 ± 13.351.3 ± 17.757.3 ± 21.577.9 ± 14.0
Table 2. Absolute attenuation values for all four groups across all lobes, upper lobe, middle lobe/lingula and lower lobe, with standard deviation in inspiration and expiration. [Mean ± standard deviation.] Abbreviations: Insp., Inspiration; Exp., Expiration; HU, Hounsfield units; IPF, Idiopatic pulmonary fibrosis; HP, Hypersensitivity pneumonitis; SSc-ILD, Systemic sclerosis-associated interstitial lung disease.
All LobesUpper LobeMiddle Lobe/LingulaLower Lobe
Insp., HUExp., HUInsp., HUExp., HUInsp., HUExp., HUInsp., HUExp., HU
Controls−872.1
± 33.1
−772.6
± 64.8
−873.3
± 27.9
−793.7
± 48.6
−889.2
± 28.6
−817.9
± 47.7
−864.5
± 35.7
−741.7
± 63.6
IPF−809.4
± 69.4
−632.7
± 115.8
−838.1
± 48.6
−698.5
± 82.8
−818.4
± 65.8
−682.8
± 89.7
−788.3
± 74.6
−572.4
± 111.2
HP−798.9
± 84.1
−628.0
± 149.7
−815.3
± 85.4
−678.5
± 123.6
−826.2
± 70.3
−700.7
± 117.1
−777.2
± 83.5
−566.2
± 152.0
SSc-ILD−806.8
± 95.5
−692.5
± 114.8
−822.7
± 78.9
−723.4
± 97.9
−828.1
± 76.7
−733.1
± 94.7
−786.4
± 109.0
−653.4
± 121.5
Table 3. p-values for the differences between groups in inspiratory and expiratory attenuation values and absolute and relative differences. Analysis for all lobes, upper lobes, middle lobes/lingula and lower lobes.
EvaluationComparisonAll LobesUpper LobeMiddle Lobe/LingulaLower Lobe
Control—IPF0.00310.07350.00020.0028
Control—HP0.00050.00380.00090.0007
InspirationControl—SSc0.00190.01090.00120.0015
IPF—HP0.55800.24250.67130.6558
IPF—SSc0.86960.42730.60370.8365
HP—SSc0.67320.70490.92410.8112
Control—IPF<0.00010.0009<0.0001<0.0001
Control—HP<0.00010.0001<0.0001<0.0001
ExpirationControl—SSc0.00470.01270.00100.0069
IPF—HP0.87430.46940.47450.9654
IPF—SSc0.04280.36650.04890.0303
HP—SSc0.02960.10620.20280.0274
Control—IPF<0.00010.00050.0001<0.0001
Control—HP0.00010.00080.00090.0001
AbsoluteControl—SSc0.35420.23240.13010.5263
DifferenceIPF—HP0.66300.86420.51770.6510
IPF—SSc0.00070.01600.01180.0002
HP—SSc0.00250.02460.05680.0011
Control—IPF<0.00010.00170.0001<0.0001
Control—HP<0.00010.00030.0002<0.0001
RelativeControl—SSc0.26650.20560.10480.3482
DifferenceIPF—HP0.59420.59180.84270.5442
IPF—SSc0.00190.05040.01430.0012
HP—SSc0.00030.01370.02360.0002
Bold within the table (the p-values) means that this value is statistically significant.
Table 4. Average density differences between inspiration and expiration in absolute values and in vpercentage change across all four groups in all lobes, upper lobe, middle lobe/lingula and lower lobe, with standard deviations.
All Lobes, HU and %Upper Lobe, HU and %Middle Lobe/Lingula, HU and %Lower Lobe, HU and %
Controls−100 ± 47
14 ± 8
−80 ± 32
10 ± 5
−71 ± 31
9 ± 5
−123 ± 47
17 ± 8
IPF−177 ± 79
31 ± 21
−140 ± 54
21 ± 11
−136 ± 62
21 ± 12
−216 ± 79
42 ± 23
HP−171 ± 99
34 ± 31
−137 ± 84
23 ± 20
−126 ± 75
21 ± 18
−211 ± 101
46 ± 37
SSc-ILD−114 ± 57
18 ± 11
−99 ± 43
15 ± 8
−95 ± 49
14 ± 8
−133 ± 62
22 ± 13
Disclaimer/Publisher’s Note: The statements, opinions and data contained in all publications are solely those of the individual author(s) and contributor(s) and not of MDPI and/or the editor(s). MDPI and/or the editor(s) disclaim responsibility for any injury to people or property resulting from any ideas, methods, instructions or products referred to in the content.

