
Low Density Lipoprotein Exposure of Plasmacytoid Dendritic Cells Blunts Toll-like Receptor 7/9 Signaling via NUR77

 , , , , and
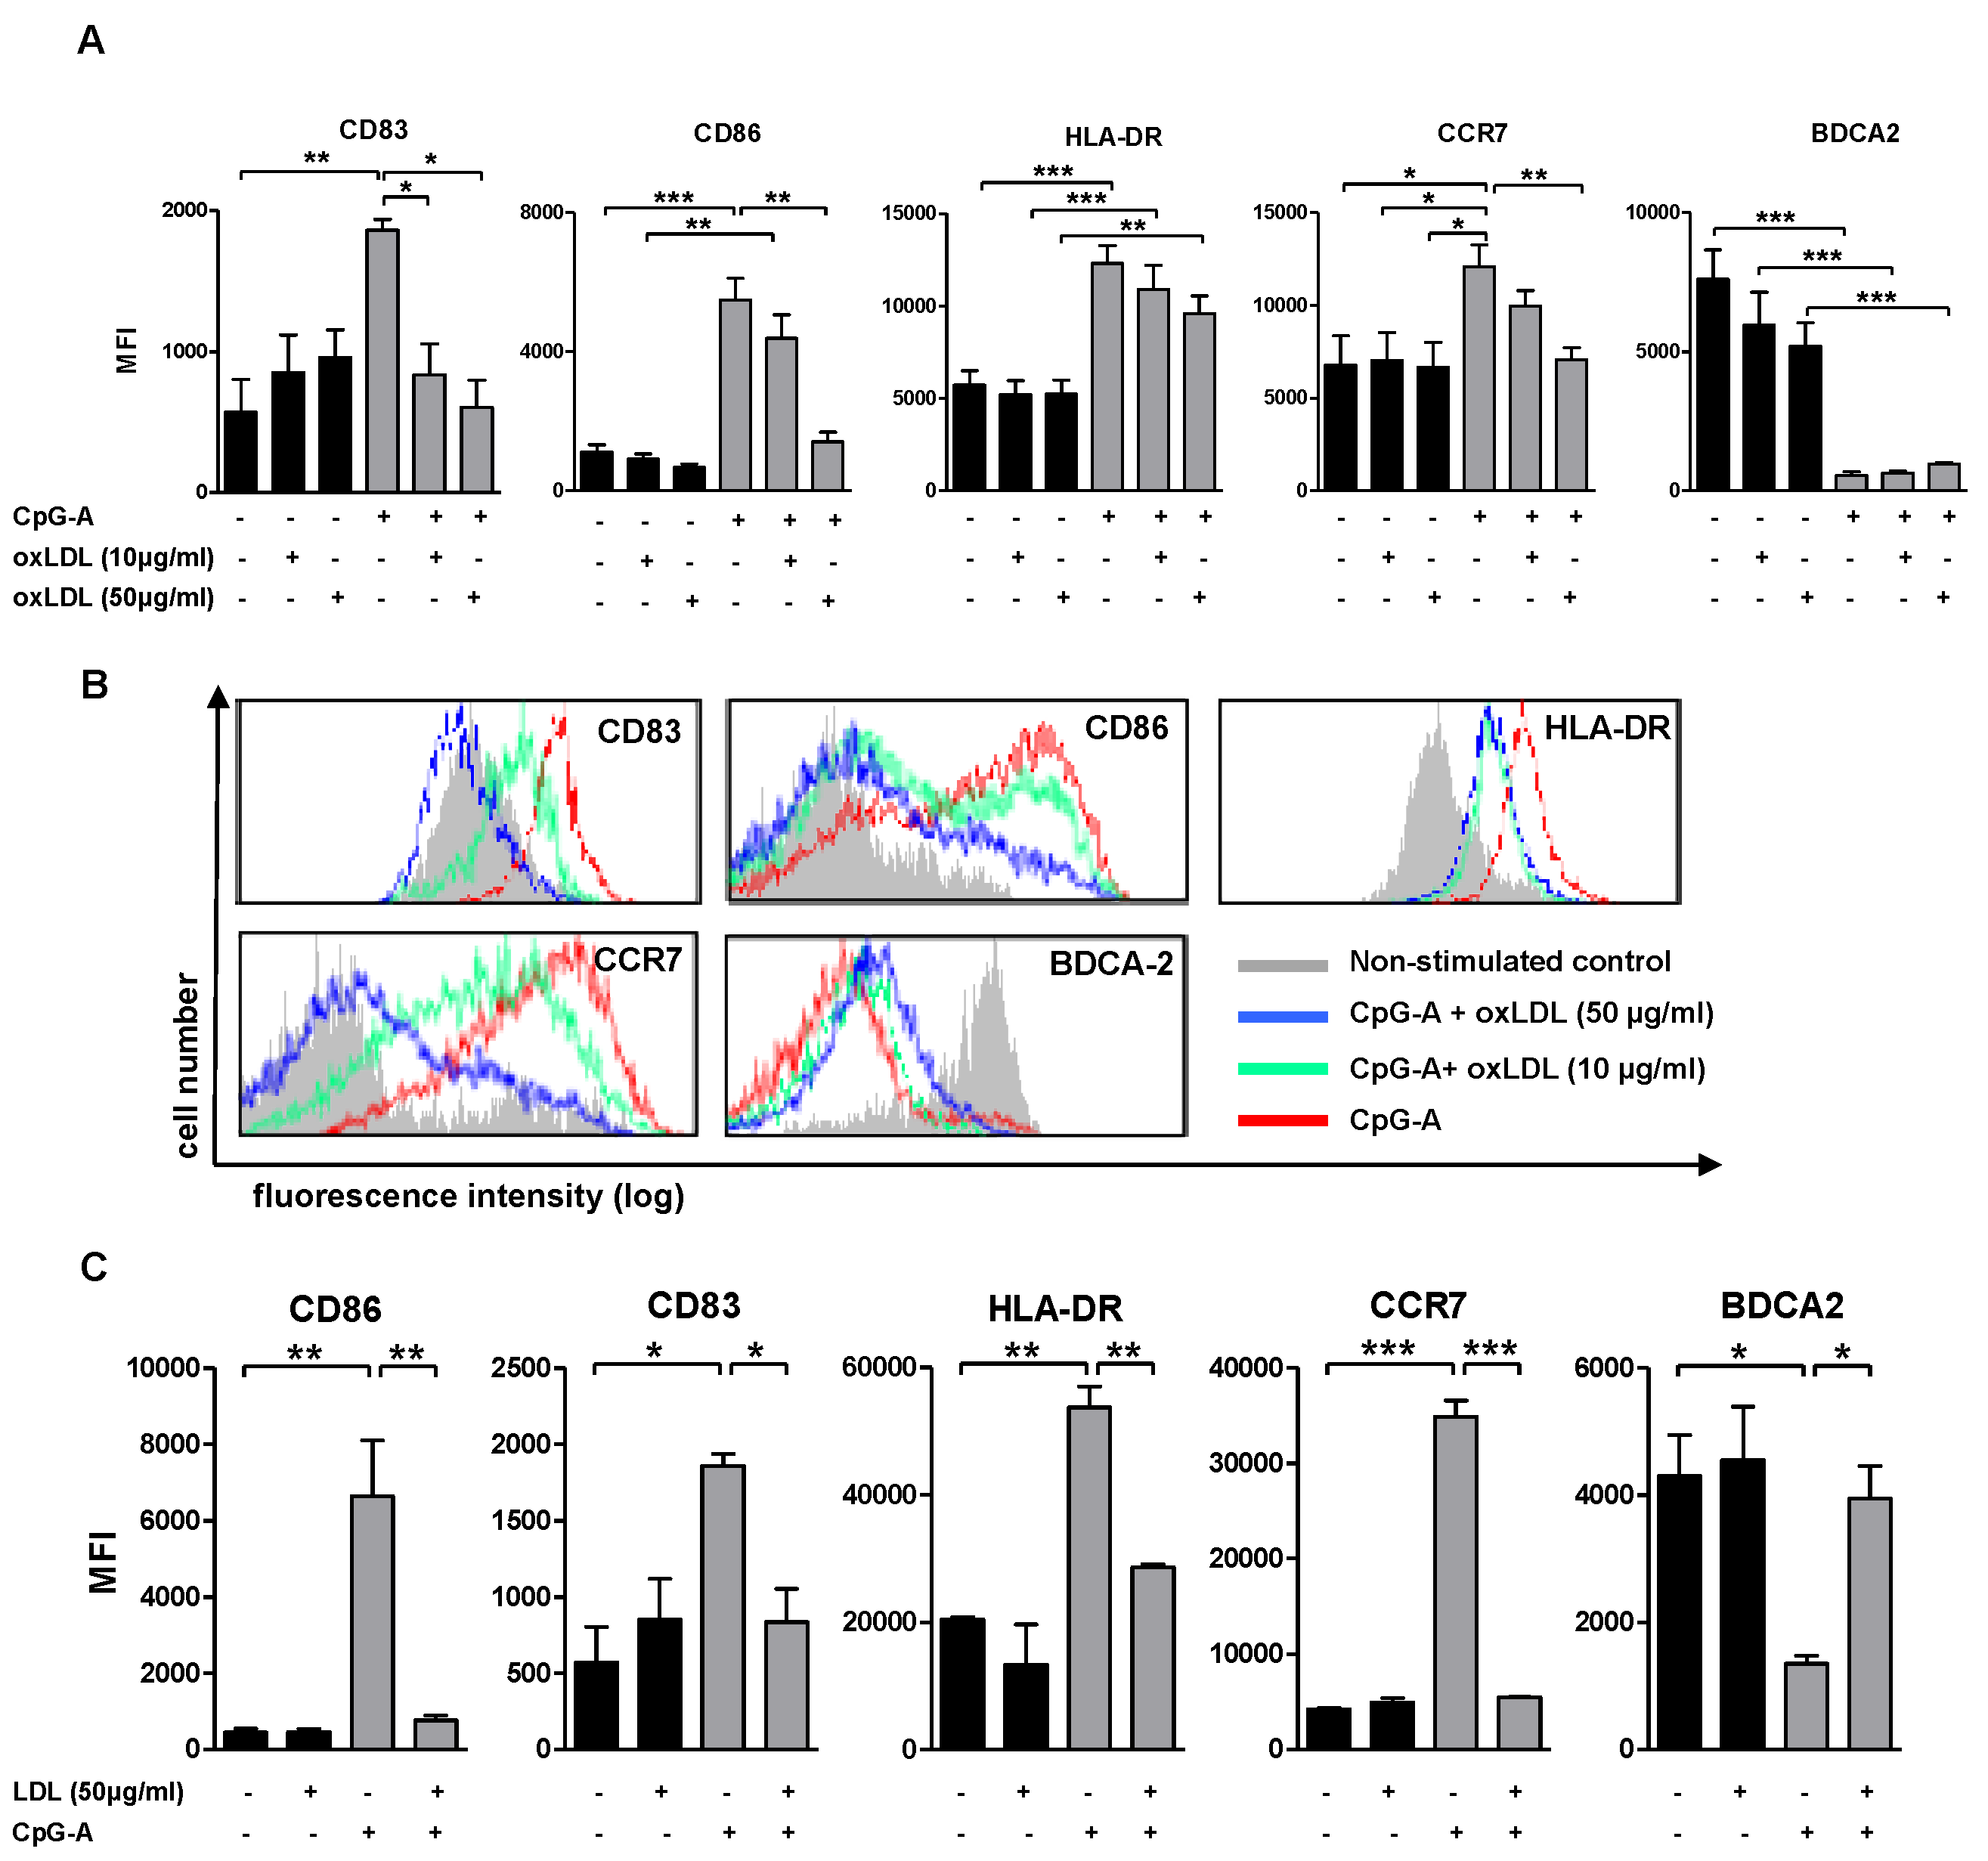
Abstract
:1. Introduction
2. Material and Methods
2.1. Isolation and Culture of pDCs
2.2. OxLDL Preparation
2.3. Labeling of Lipoproteins and CpG
2.4. Oil-Red-O Staining
2.5. Flow Cytometry
2.6. Mixed Leukocyte Reaction
2.7. Cytokine Measurement
2.8. RNA Isolation
2.9. Quantitative Real-Time PCR (qRT-PCR) Analysis
2.10. Microarray Analysis
2.11. Nuclear Localization Studies
2.12. NF-κB Immunofluorescent Staining
2.13. Statistical Analysis
3. Results
3.1. Human pDCs Are Able to Engulf Lipoproteins
3.2. (Oxidized) Lipoprotein Dampens CpG-A Induced Up-Regulation of Maturation Markers
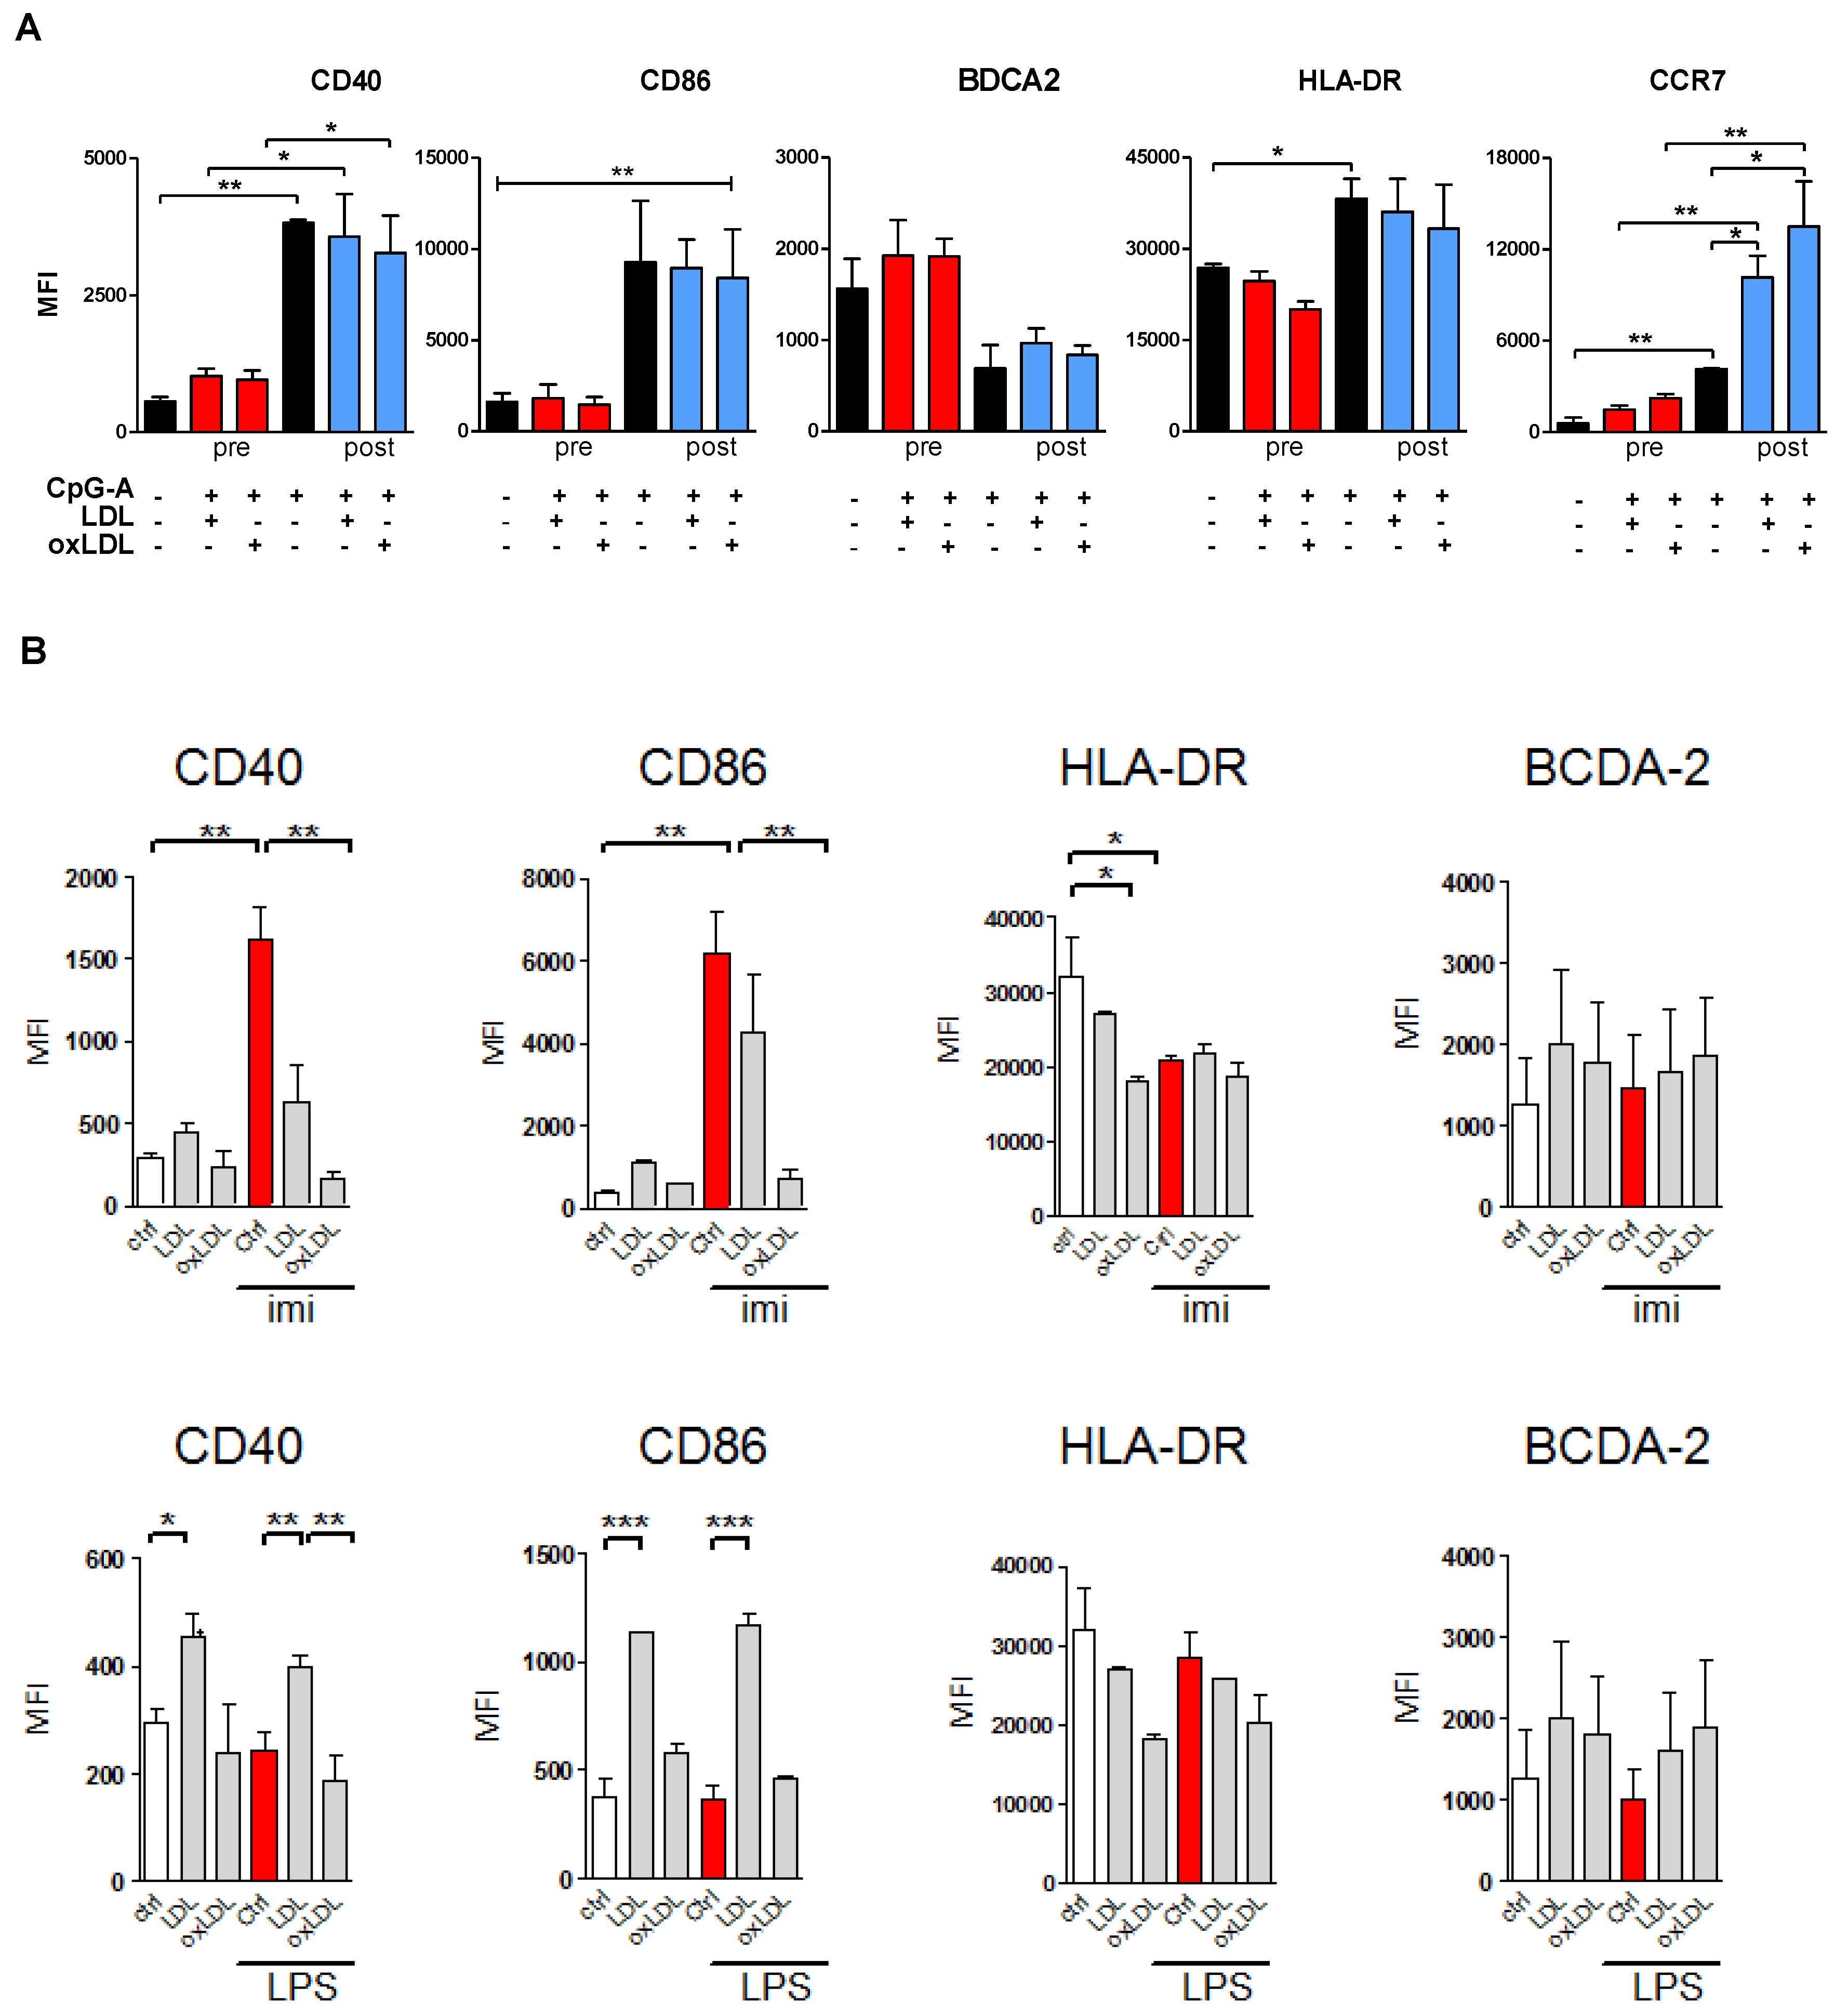
3.3. Lipoprotein Pre-Treatment Inhibits TLR7 and TLR9-Induced pDC Maturation
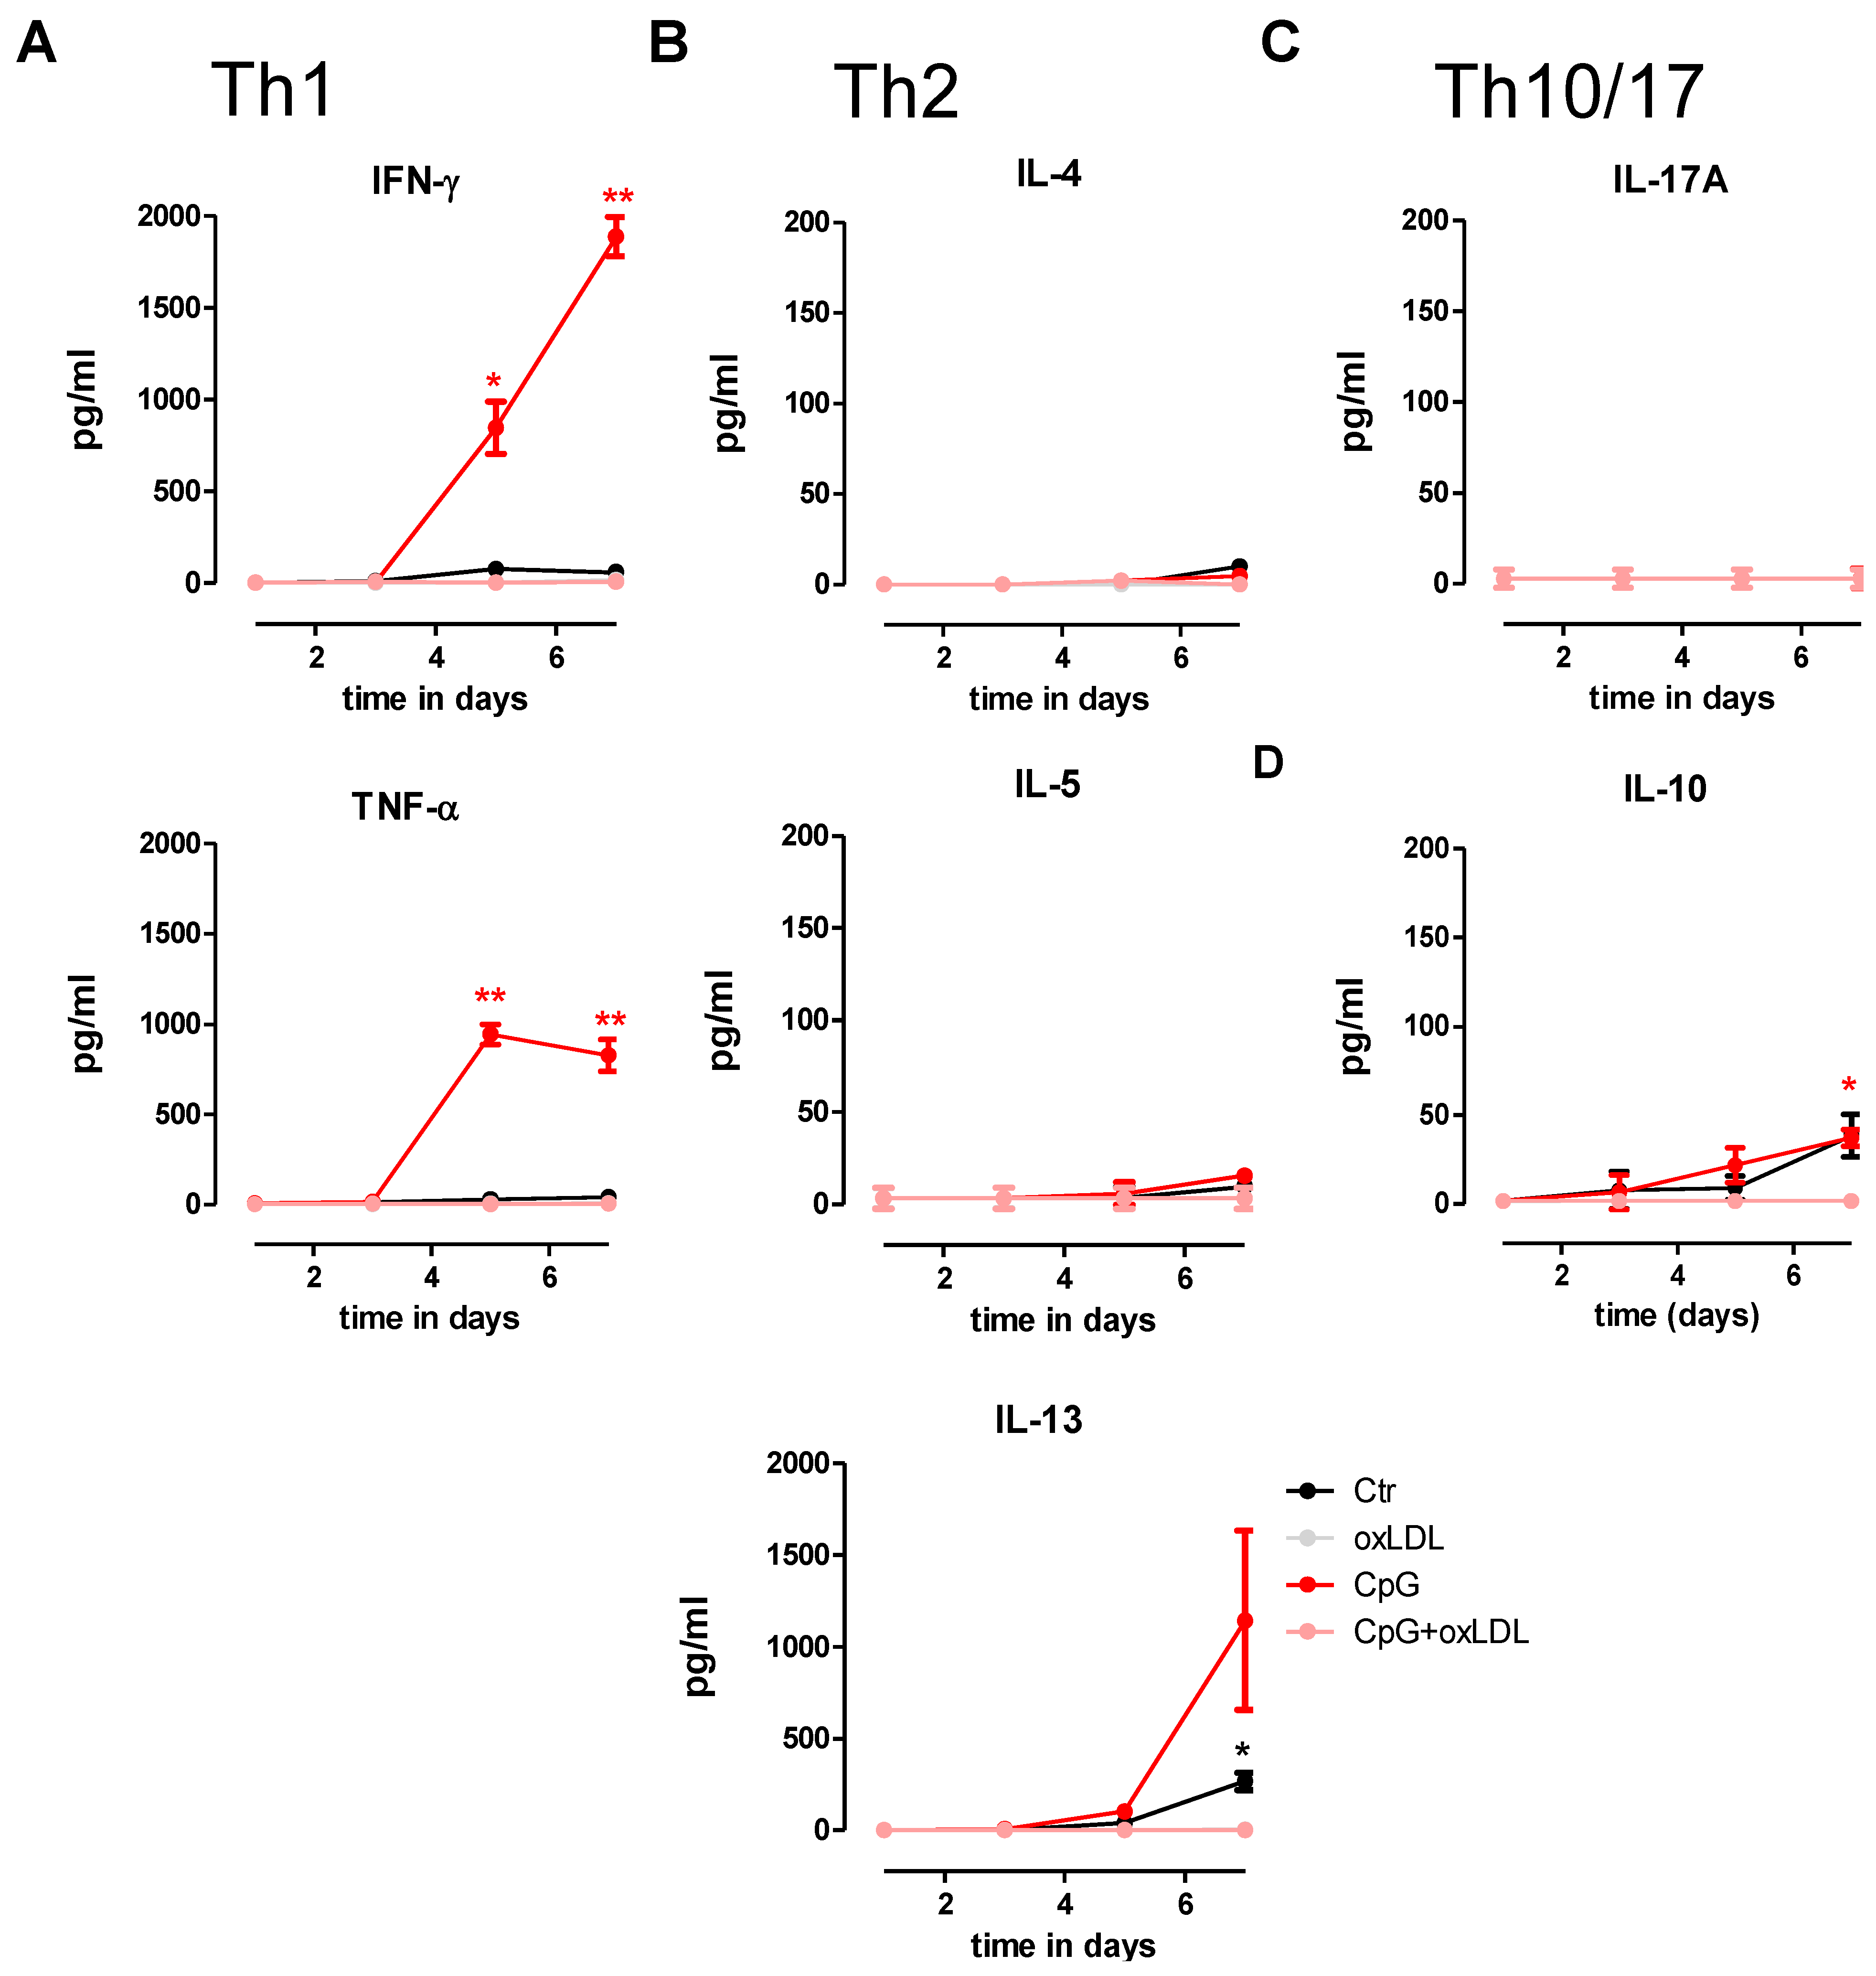
3.4. OxLDL Treatment Suppresses TLR9-Induced pDC Activation and T Cell Stimulatory Capacity
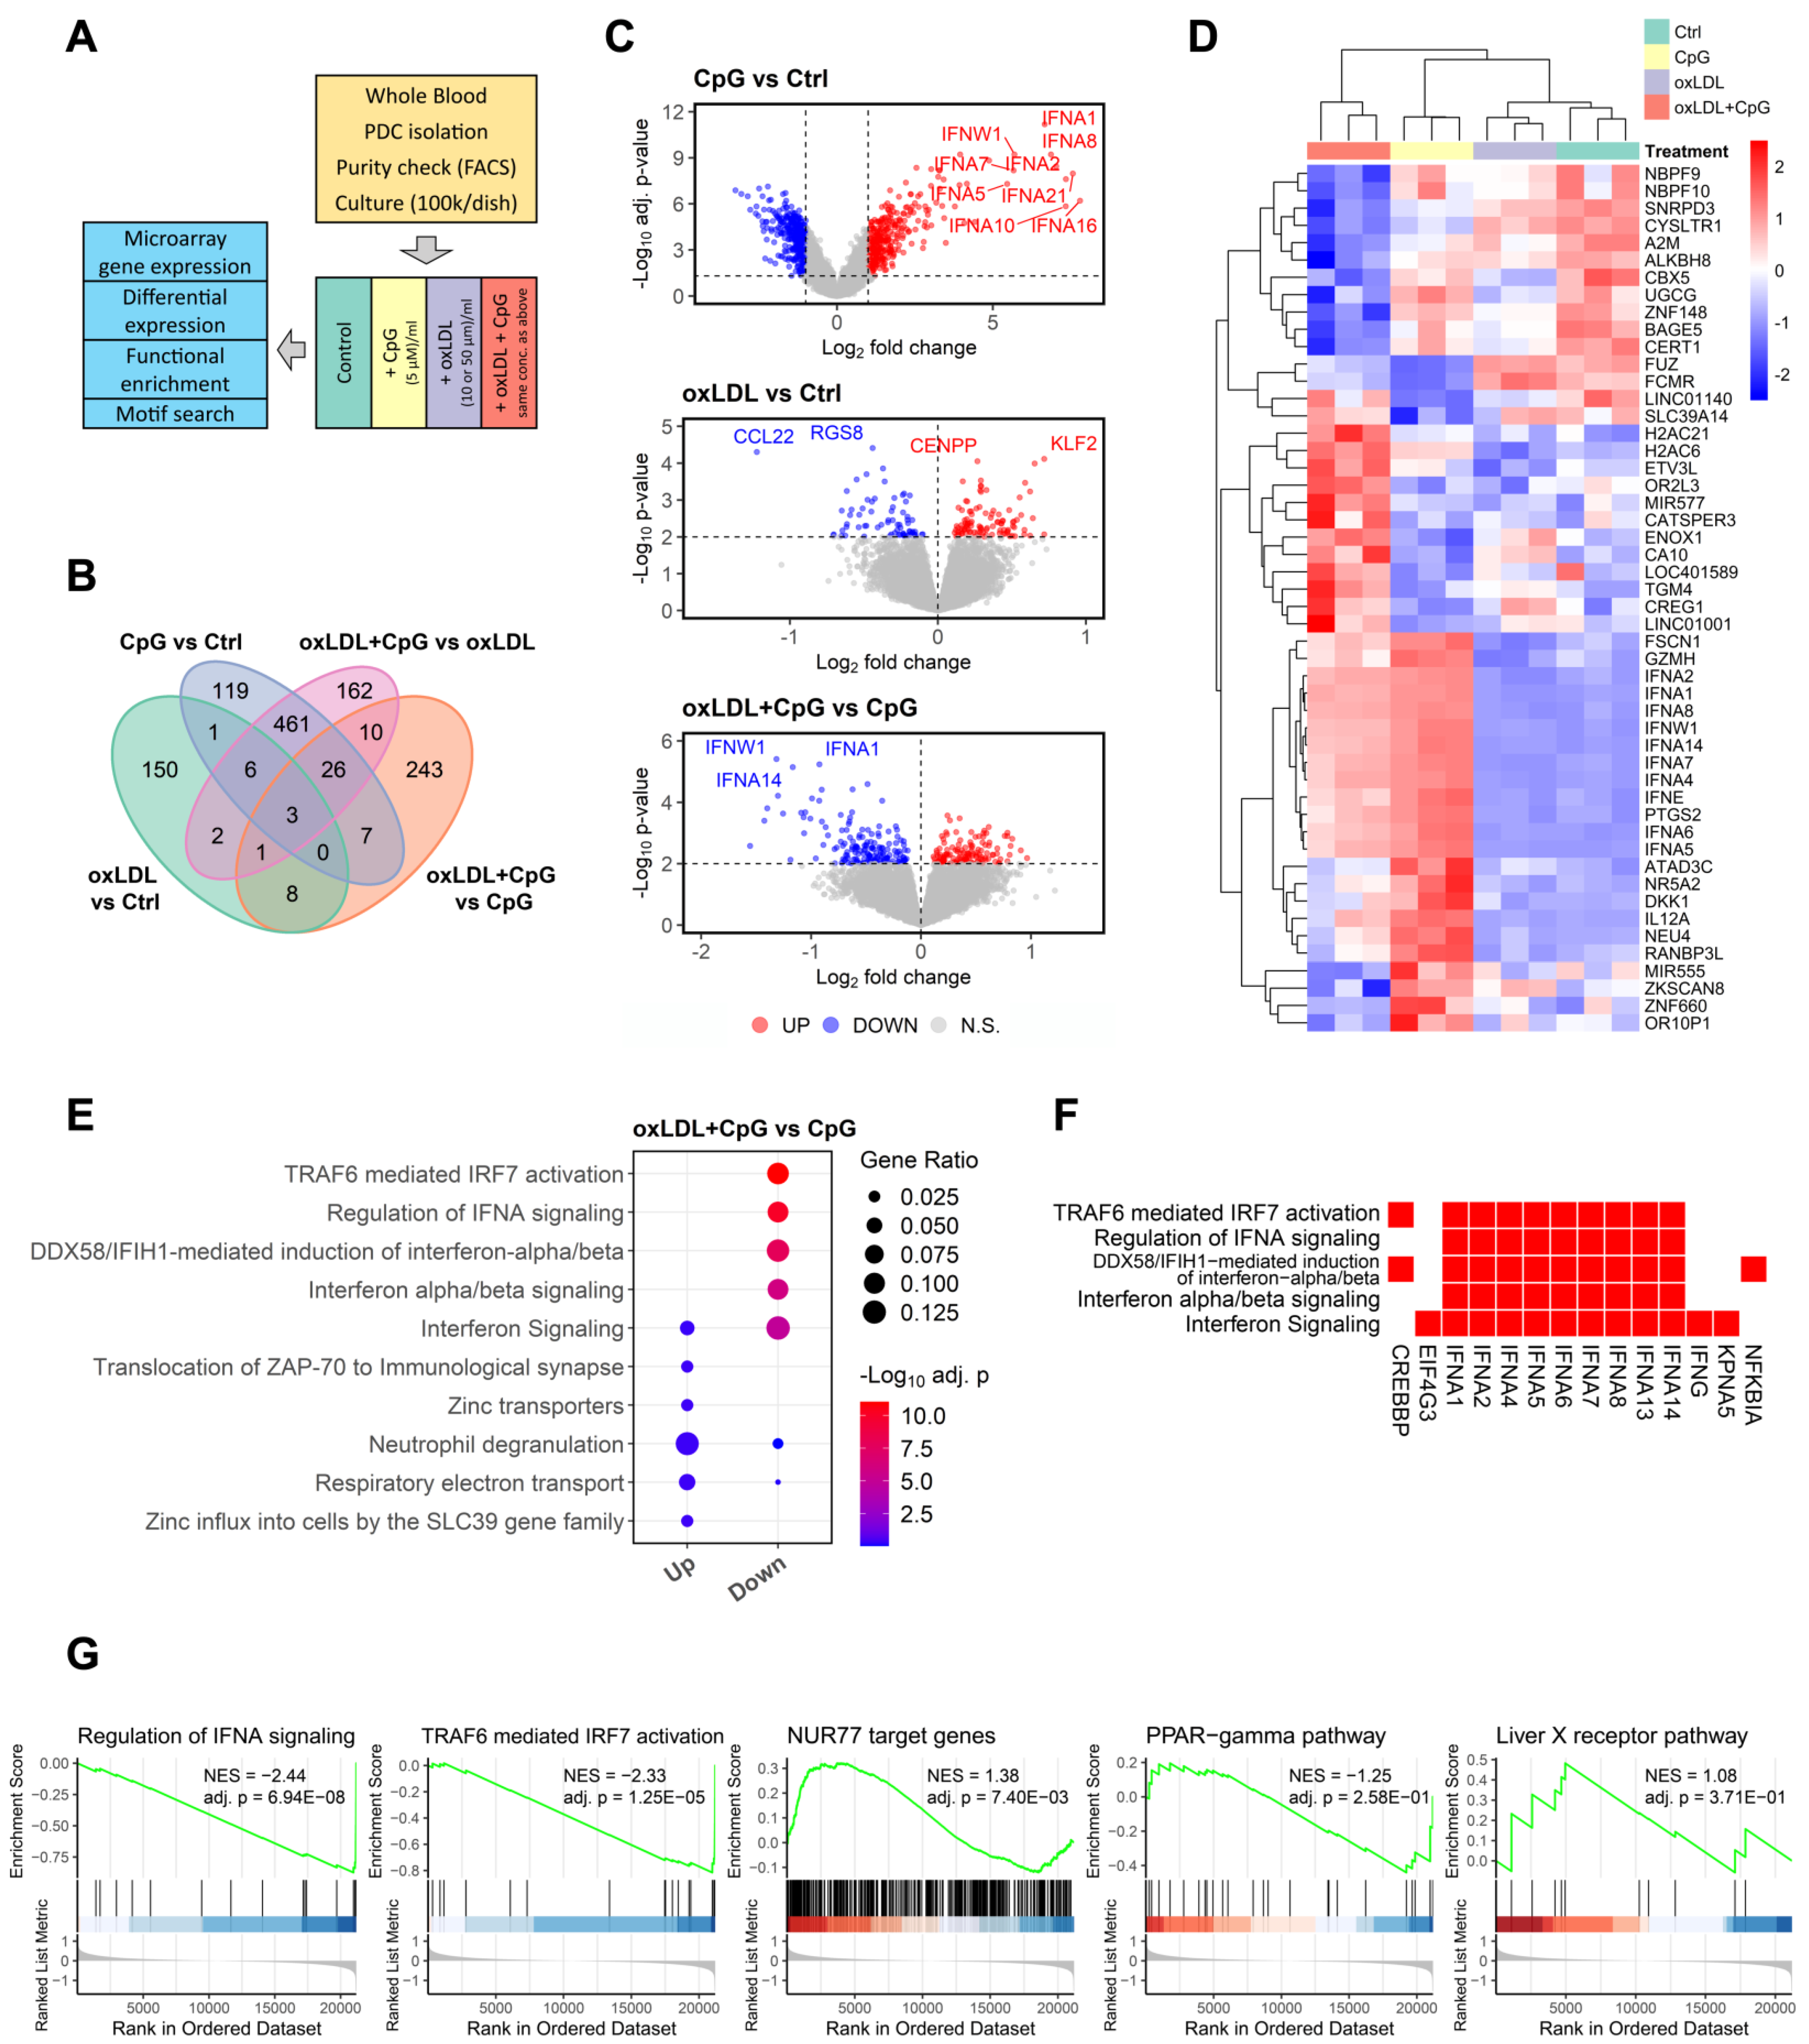
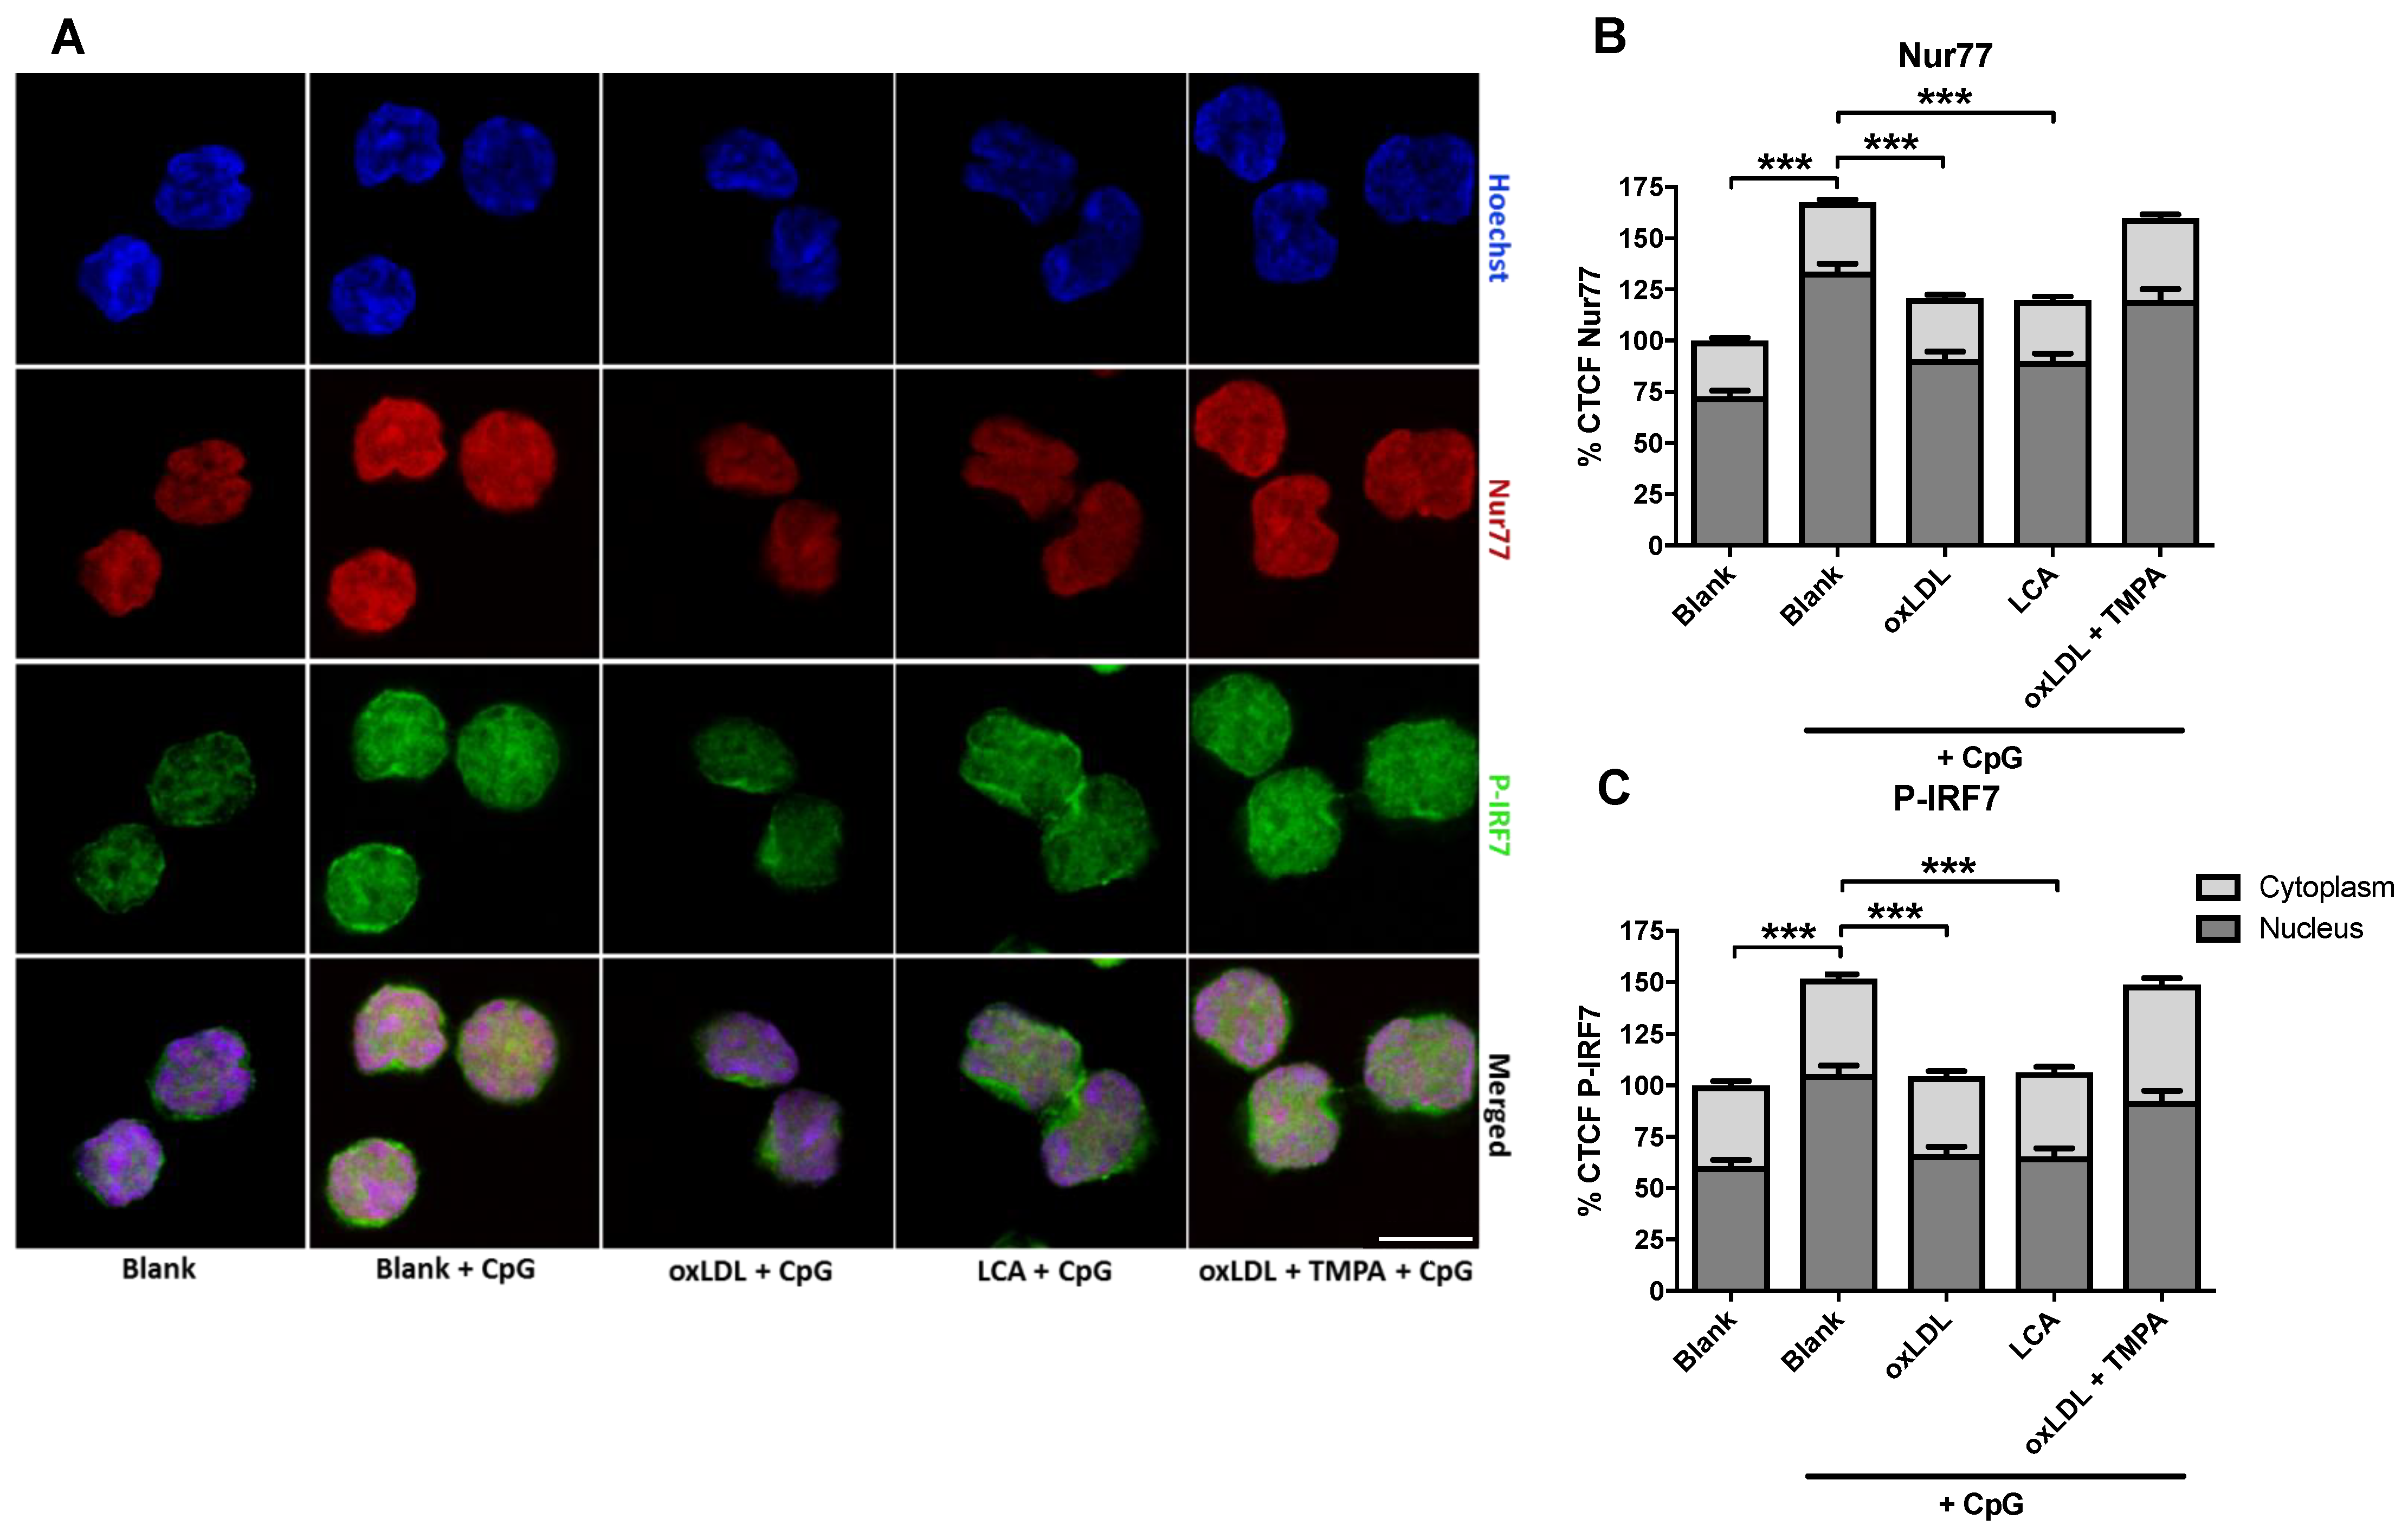
3.5. Involvement of the NUR77/TRAF6 Axis in oxLDL Inhibition
4. Discussion
Supplementary Materials
Author Contributions
Funding
Institutional Review Board Statement
Informed Consent Statement
Data Availability Statement
Acknowledgments
Conflicts of Interest
References
- Siegal, F.P.; Kadowaki, N.; Shodell, M.; Fitzgerald-Bocarsly, P.A.; Shah, K.; Ho, S.; Antonenko, S.; Liu, Y.J. The nature of the principal type 1 interferon-producing cells in human blood. Science 1999, 284, 1835–1837. [Google Scholar] [CrossRef] [PubMed] [Green Version]
- Cella, M.; Jarrossay, D.; Facchetti, F.; Alebardi, O.; Nakajima, H.; Lanzavecchia, A.; Colonna, M. Plasmacytoid monocytes migrate to inflamed lymph nodes and produce large amounts of type I interferon. Nat. Med. 1999, 5, 919–923. [Google Scholar] [CrossRef] [PubMed]
- Ronnblom, L.; Eloranta, M.L.; Alm, G.V. Role of natural interferon-alpha producing cells (plasmacytoid dendritic cells) in autoimmunity. Autoimmunity 2003, 36, 463–472. [Google Scholar] [CrossRef]
- Ochando, J.C.; Homma, C.; Yang, Y.; Hidalgo, A.; Garin, A.; Tacke, F.; Angeli, V.; Li, Y.; Boros, P.; Ding, Y.; et al. Alloantigen-presenting plasmacytoid dendritic cells mediate tolerance to vascularized grafts. Nat. Immunol. 2006, 7, 652–662. [Google Scholar] [CrossRef]
- Goubier, A.; Dubois, B.; Gheit, H.; Joubert, G.; Villard-Truc, F.; Asselin-Paturel, C.; Trinchieri, G.; Kaiserlian, D. Plasmacytoid dendritic cells mediate oral tolerance. Immunity 2008, 29, 464–475. [Google Scholar] [CrossRef] [Green Version]
- Daissormont, I.T.; Christ, A.; Temmerman, L.; Sampedro Millares, S.; Seijkens, T.; Manca, M.; Rousch, M.; Poggi, M.; Boon, L.; van der Loos, C.; et al. Plasmacytoid dendritic cells protect against atherosclerosis by tuning T-cell proliferation and activity. Circ. Res. 2011, 109, 1387–1395. [Google Scholar] [CrossRef]
- Doring, Y.; Manthey, H.D.; Drechsler, M.; Lievens, D.; Megens, R.T.; Soehnlein, O.; Busch, M.; Manca, M.; Koenen, R.R.; Pelisek, J.; et al. Auto-antigenic protein-DNA complexes stimulate plasmacytoid dendritic cells to promote atherosclerosis. Circulation 2012, 125, 1673–1683. [Google Scholar] [CrossRef] [Green Version]
- Sage, A.P.; Murphy, D.; Maffia, P.; Masters, L.M.; Sabir, S.R.; Baker, L.L.; Cambrook, H.; Finigan, A.J.; Ait-Oufella, H.; Grassia, G.; et al. MHC Class II-restricted antigen presentation by plasmacytoid dendritic cells drives proatherogenic T cell immunity. Circulation 2014, 130, 1363–1373. [Google Scholar] [CrossRef]
- Hansson, G.K.; Hermansson, A. The immune system in atherosclerosis. Nat. Immunol. 2011, 12, 204–212. [Google Scholar] [CrossRef]
- Doherty, T.M.; Fisher, E.A.; Arditi, M. TLR signaling and trapped vascular dendritic cells in the development of atherosclerosis. Trends Immunol. 2006, 27, 222–227. [Google Scholar] [CrossRef]
- Llodra, J.; Angeli, V.; Liu, J.; Trogan, E.; Fisher, E.A.; Randolph, G.J. Emigration of monocyte-derived cells from atherosclerotic lesions characterizes regressive, but not progressive, plaques. Proc. Natl. Acad. Sci. USA 2004, 101, 11779–11784. [Google Scholar] [CrossRef] [PubMed] [Green Version]
- Packard, R.R.; Maganto-Garcia, E.; Gotsman, I.; Tabas, I.; Libby, P.; Lichtman, A.H. CD11c(+) dendritic cells maintain antigen processing, presentation capabilities, and CD4(+) T-cell priming efficacy under hypercholesterolemic conditions associated with atherosclerosis. Circ. Res. 2008, 103, 965–973. [Google Scholar] [CrossRef] [PubMed] [Green Version]
- Gautier, E.L.; Huby, T.; Saint-Charles, F.; Ouzilleau, B.; Pirault, J.; Deswaerte, V.; Ginhoux, F.; Miller, E.R.; Witztum, J.L.; Chapman, M.J.; et al. Conventional dendritic cells at the crossroads between immunity and cholesterol homeostasis in atherosclerosis. Circulation 2009, 119, 2367–2375. [Google Scholar] [CrossRef] [PubMed] [Green Version]
- Shamshiev, A.T.; Ampenberger, F.; Ernst, B.; Rohrer, L.; Marsland, B.J.; Kopf, M. Dyslipidemia inhibits Toll-like receptor-induced activation of CD8alpha-negative dendritic cells and protective Th1 type immunity. J. Exp. Med. 2007, 204, 441–452. [Google Scholar] [CrossRef] [Green Version]
- Bluml, S.; Kirchberger, S.; Bochkov, V.N.; Kronke, G.; Stuhlmeier, K.; Majdic, O.; Zlabinger, G.J.; Knapp, W.; Binder, B.R.; Stockl, J.; et al. Oxidized phospholipids negatively regulate dendritic cell maturation induced by TLRs and CD40. J. Immunol. 2005, 175, 501–508. [Google Scholar] [CrossRef] [Green Version]
- Wu, T.; Hu, E.; Xu, S.; Chen, M.; Guo, P.; Dai, Z.; Feng, T.; Zhou, L.; Tang, W.; Zhan, L.; et al. ClusterProfiler 4.0: A universal enrichment tool for interpreting omics data. Innovation 2021, 2, 100141. [Google Scholar] [CrossRef]
- Yu, G.; He, Q.Y. ReactomePA: An R/Bioconductor package for reactome pathway analysis and visualization. Mol. Biosyst. 2016, 12, 477–479. [Google Scholar] [CrossRef]
- Aibar, S.; Gonzalez-Blas, C.B.; Moerman, T.; Huynh-Thu, V.A.; Imrichova, H.; Hulselmans, G.; Rambow, F.; Marine, J.C.; Geurts, P.; Aerts, J.; et al. SCENIC: Single-cell regulatory network inference and clustering. Nat. Methods 2017, 14, 1083–1086. [Google Scholar] [CrossRef] [Green Version]
- Dzionek, A.; Sohma, Y.; Nagafune, J.; Cella, M.; Colonna, M.; Facchetti, F.; Gunther, G.; Johnston, I.; Lanzavecchia, A.; Nagasaka, T.; et al. BDCA-2, a novel plasmacytoid dendritic cell-specific type II C-type lectin, mediates antigen capture and is a potent inhibitor of interferon alpha/beta induction. J. Exp. Med. 2001, 194, 1823–1834. [Google Scholar] [CrossRef]
- Lusis, A.J. Atherosclerosis. Nature 2000, 407, 233–241. [Google Scholar] [CrossRef]
- Hemmi, H.; Takeuchi, O.; Kawai, T.; Kaisho, T.; Sato, S.; Sanjo, H.; Matsumoto, M.; Hoshino, K.; Wagner, H.; Takeda, K.; et al. A Toll-like receptor recognizes bacterial DNA. Nature 2000, 408, 740–745. [Google Scholar] [CrossRef] [PubMed]
- Liu, Y.J. IPC: Professional type 1 interferon-producing cells and plasmacytoid dendritic cell precursors. Annu. Rev. Immunol. 2005, 23, 275–306. [Google Scholar] [CrossRef] [PubMed]
- Colonna, M.; Trinchieri, G.; Liu, Y.J. Plasmacytoid dendritic cells in immunity. Nat. Immunol. 2004, 5, 1219–1226. [Google Scholar] [CrossRef] [PubMed]
- Megjugorac, N.J.; Young, H.A.; Amrute, S.B.; Olshalsky, S.L.; Fitzgerald-Bocarsly, P. Virally stimulated plasmacytoid dendritic cells produce chemokines and induce migration of T and NK cells. J. Leukoc. Biol. 2004, 75, 504–514. [Google Scholar] [CrossRef] [Green Version]
- Piqueras, B.; Connolly, J.; Freitas, H.; Palucka, A.K.; Banchereau, J. Upon viral exposure, myeloid and plasmacytoid dendritic cells produce 3 waves of distinct chemokines to recruit immune effectors. Blood 2006, 107, 2613–2618. [Google Scholar] [CrossRef]
- Ahl, P.J.; Hopkins, R.A.; Xiang, W.W.; Au, B.; Kaliaperumal, N.; Fairhurst, A.M.; Connolly, J.E. Met-Flow, a strategy for single-cell metabolic analysis highlights dynamic changes in immune subpopulations. Commun. Biol. 2020, 3, 305. [Google Scholar] [CrossRef]
- Verberk, S.G.S.; Kuiper, K.L.; Lauterbach, M.A.; Latz, E.; Van den Bossche, J. The multifaceted therapeutic value of targeting ATP-citrate lyase in atherosclerosis. Trends Mol. Med. 2021, 27, 1095–1105. [Google Scholar] [CrossRef]
- Rouillard, A.D.; Gundersen, G.W.; Fernandez, N.F.; Wang, Z.; Monteiro, C.D.; McDermott, M.G.; Ma’ayan, A. The harmonizome: A collection of processed datasets gathered to serve and mine knowledge about genes and proteins. Database 2016, 2016, baw100. [Google Scholar] [CrossRef]
- Slenter, D.N.; Kutmon, M.; Hanspers, K.; Riutta, A.; Windsor, J.; Nunes, N.; Melius, J.; Cirillo, E.; Coort, S.L.; Digles, D.; et al. WikiPathways: A multifaceted pathway database bridging metabolomics to other omics research. Nucleic Acids Res. 2018, 46, D661–D667. [Google Scholar] [CrossRef]
- De Bont, N.; Netea, M.G.; Demacker, P.N.; Verschueren, I.; Kullberg, B.J.; van Dijk, K.W.; van der Meer, J.W.; Stalenhoef, A.F. Apolipoprotein E knock-out mice are highly susceptible to endotoxemia and Klebsiella pneumoniae infection. J. Lipid Res. 1999, 40, 680–685. [Google Scholar] [CrossRef]
- Netea, M.G.; Demacker, P.N.; de Bont, N.; Boerman, O.C.; Stalenhoef, A.F.; van der Meer, J.W.; Kullberg, B.J. Hyperlipoproteinemia enhances susceptibility to acute disseminated Candida albicans infection in low-density-lipoprotein-receptor-deficient mice. Infect. Immun. 1997, 65, 2663–2667. [Google Scholar] [CrossRef] [PubMed] [Green Version]
- Roselaar, S.E.; Kakkanathu, P.X.; Daugherty, A. Lymphocyte populations in atherosclerotic lesions of apoE -/- and LDL receptor -/- mice. Decreasing density with disease progression. Arterioscler. Thromb. Vasc. Biol. 1996, 16, 1013–1018. [Google Scholar] [CrossRef] [PubMed]
- Ludewig, B.; Jaggi, M.; Dumrese, T.; Brduscha-Riem, K.; Odermatt, B.; Hengartner, H.; Zinkernagel, R.M. Hypercholesterolemia exacerbates virus-induced immunopathologic liver disease via suppression of antiviral cytotoxic T cell responses. J. Immunol. 2001, 166, 3369–3376. [Google Scholar] [CrossRef] [PubMed] [Green Version]
- Cella, M.; Facchetti, F.; Lanzavecchia, A.; Colonna, M. Plasmacytoid dendritic cells activated by influenza virus and CD40L drive a potent TH1 polarization. Nat. Immunol. 2000, 1, 305–310. [Google Scholar] [CrossRef] [PubMed]
- Salio, M.; Palmowski, M.J.; Atzberger, A.; Hermans, I.F.; Cerundolo, V. CpG-matured murine plasmacytoid dendritic cells are capable of in vivo priming of functional CD8 T cell responses to endogenous but not exogenous antigens. J. Exp. Med. 2004, 199, 567–579. [Google Scholar] [CrossRef] [Green Version]
- Banchereau, J.; Steinman, R.M. Dendritic cells and the control of immunity. Nature 1998, 392, 245–252. [Google Scholar] [CrossRef]
- Fonteneau, J.F.; Larsson, M.; Beignon, A.S.; McKenna, K.; Dasilva, I.; Amara, A.; Liu, Y.J.; Lifson, J.D.; Littman, D.R.; Bhardwaj, N. Human immunodeficiency virus type 1 activates plasmacytoid dendritic cells and concomitantly induces the bystander maturation of myeloid dendritic cells. J. Virol. 2004, 78, 5223–5232. [Google Scholar] [CrossRef] [Green Version]
- Fiorentini, S.; Riboldi, E.; Facchetti, F.; Avolio, M.; Fabbri, M.; Tosti, G.; Becker, P.D.; Guzman, C.A.; Sozzani, S.; Caruso, A. HIV-1 matrix protein p17 induces human plasmacytoid dendritic cells to acquire a migratory immature cell phenotype. Proc. Natl. Acad. Sci. USA 2008, 105, 3867–3872. [Google Scholar] [CrossRef] [Green Version]
- Sozzani, S.; Vermi, W.; Del Prete, A.; Facchetti, F. Trafficking properties of plasmacytoid dendritic cells in health and disease. Trends Immunol. 2010, 31, 270–277. [Google Scholar] [CrossRef] [Green Version]
- Vermi, W.; Riboldi, E.; Wittamer, V.; Gentili, F.; Luini, W.; Marrelli, S.; Vecchi, A.; Franssen, J.D.; Communi, D.; Massardi, L.; et al. Role of ChemR23 in directing the migration of myeloid and plasmacytoid dendritic cells to lymphoid organs and inflamed skin. J. Exp. Med. 2005, 201, 509–515. [Google Scholar] [CrossRef] [Green Version]
- Van Brussel, I.; Van Vre, E.A.; De Meyer, G.R.; Vrints, C.J.; Bosmans, J.M.; Bult, H. Decreased numbers of peripheral blood dendritic cells in patients with coronary artery disease are associated with diminished plasma Flt3 ligand levels and impaired plasmacytoid dendritic cell function. Clin. Sci. 2011, 120, 415–426. [Google Scholar] [CrossRef] [PubMed] [Green Version]
- Bochkov, V.N.; Kadl, A.; Huber, J.; Gruber, F.; Binder, B.R.; Leitinger, N. Protective role of phospholipid oxidation products in endotoxin-induced tissue damage. Nature 2002, 419, 77–81. [Google Scholar] [CrossRef] [PubMed]
- Cao, W.; Rosen, D.B.; Ito, T.; Bover, L.; Bao, M.; Watanabe, G.; Yao, Z.; Zhang, L.; Lanier, L.L.; Liu, Y.J. Plasmacytoid dendritic cell-specific receptor ILT7-Fc epsilonRI gamma inhibits Toll-like receptor-induced interferon production. J. Exp. Med. 2006, 203, 1399–1405. [Google Scholar] [CrossRef] [PubMed] [Green Version]
- Meyer-Wentrup, F.; Benitez-Ribas, D.; Tacken, P.J.; Punt, C.J.; Figdor, C.G.; de Vries, I.J.; Adema, G.J. Targeting DCIR on human plasmacytoid dendritic cells results in antigen presentation and inhibits IFN-alpha production. Blood 2008, 111, 4245–4253. [Google Scholar] [CrossRef] [Green Version]
- Moore, K.W.; de Waal Malefyt, R.; Coffman, R.L.; O’Garra, A. Interleukin-10 and the interleukin-10 receptor. Annu. Rev. Immunol. 2001, 19, 683–765. [Google Scholar] [CrossRef]
- Strobl, H.; Knapp, W. TGF-beta1 regulation of dendritic cells. Microbes Infect. Inst. Pasteur. 1999, 1, 1283–1290. [Google Scholar] [CrossRef]


Publisher’s Note: MDPI stays neutral with regard to jurisdictional claims in published maps and institutional affiliations. |
© 2022 by the authors. Licensee MDPI, Basel, Switzerland. This article is an open access article distributed under the terms and conditions of the Creative Commons Attribution (CC BY) license (https://creativecommons.org/licenses/by/4.0/).
Share and Cite
Christ, A.; Goossens, P.G.; Wijnands, E.; Jin, H.; Legein, B.; Oth, T.; Isaacs, A.; Stoll, M.; Vanderlocht, J.; Lutgens, E.; et al. Low Density Lipoprotein Exposure of Plasmacytoid Dendritic Cells Blunts Toll-like Receptor 7/9 Signaling via NUR77. Biomedicines 2022, 10, 1152. https://0-doi-org.brum.beds.ac.uk/10.3390/biomedicines10051152
Christ A, Goossens PG, Wijnands E, Jin H, Legein B, Oth T, Isaacs A, Stoll M, Vanderlocht J, Lutgens E, et al. Low Density Lipoprotein Exposure of Plasmacytoid Dendritic Cells Blunts Toll-like Receptor 7/9 Signaling via NUR77. Biomedicines. 2022; 10(5):1152. https://0-doi-org.brum.beds.ac.uk/10.3390/biomedicines10051152
Chicago/Turabian StyleChrist, Anette, Pieter G. Goossens, Erwin Wijnands, Han Jin, Bart Legein, Tammy Oth, Aaron Isaacs, Monika Stoll, Joris Vanderlocht, Esther Lutgens, and et al. 2022. "Low Density Lipoprotein Exposure of Plasmacytoid Dendritic Cells Blunts Toll-like Receptor 7/9 Signaling via NUR77" Biomedicines 10, no. 5: 1152. https://0-doi-org.brum.beds.ac.uk/10.3390/biomedicines10051152