Increased IL-2 and Reduced TGF-β Upon T-Cell Stimulation are Associated with GM-CSF Upregulation in Multiple Immune Cell Types in Multiple Sclerosis

 , , and
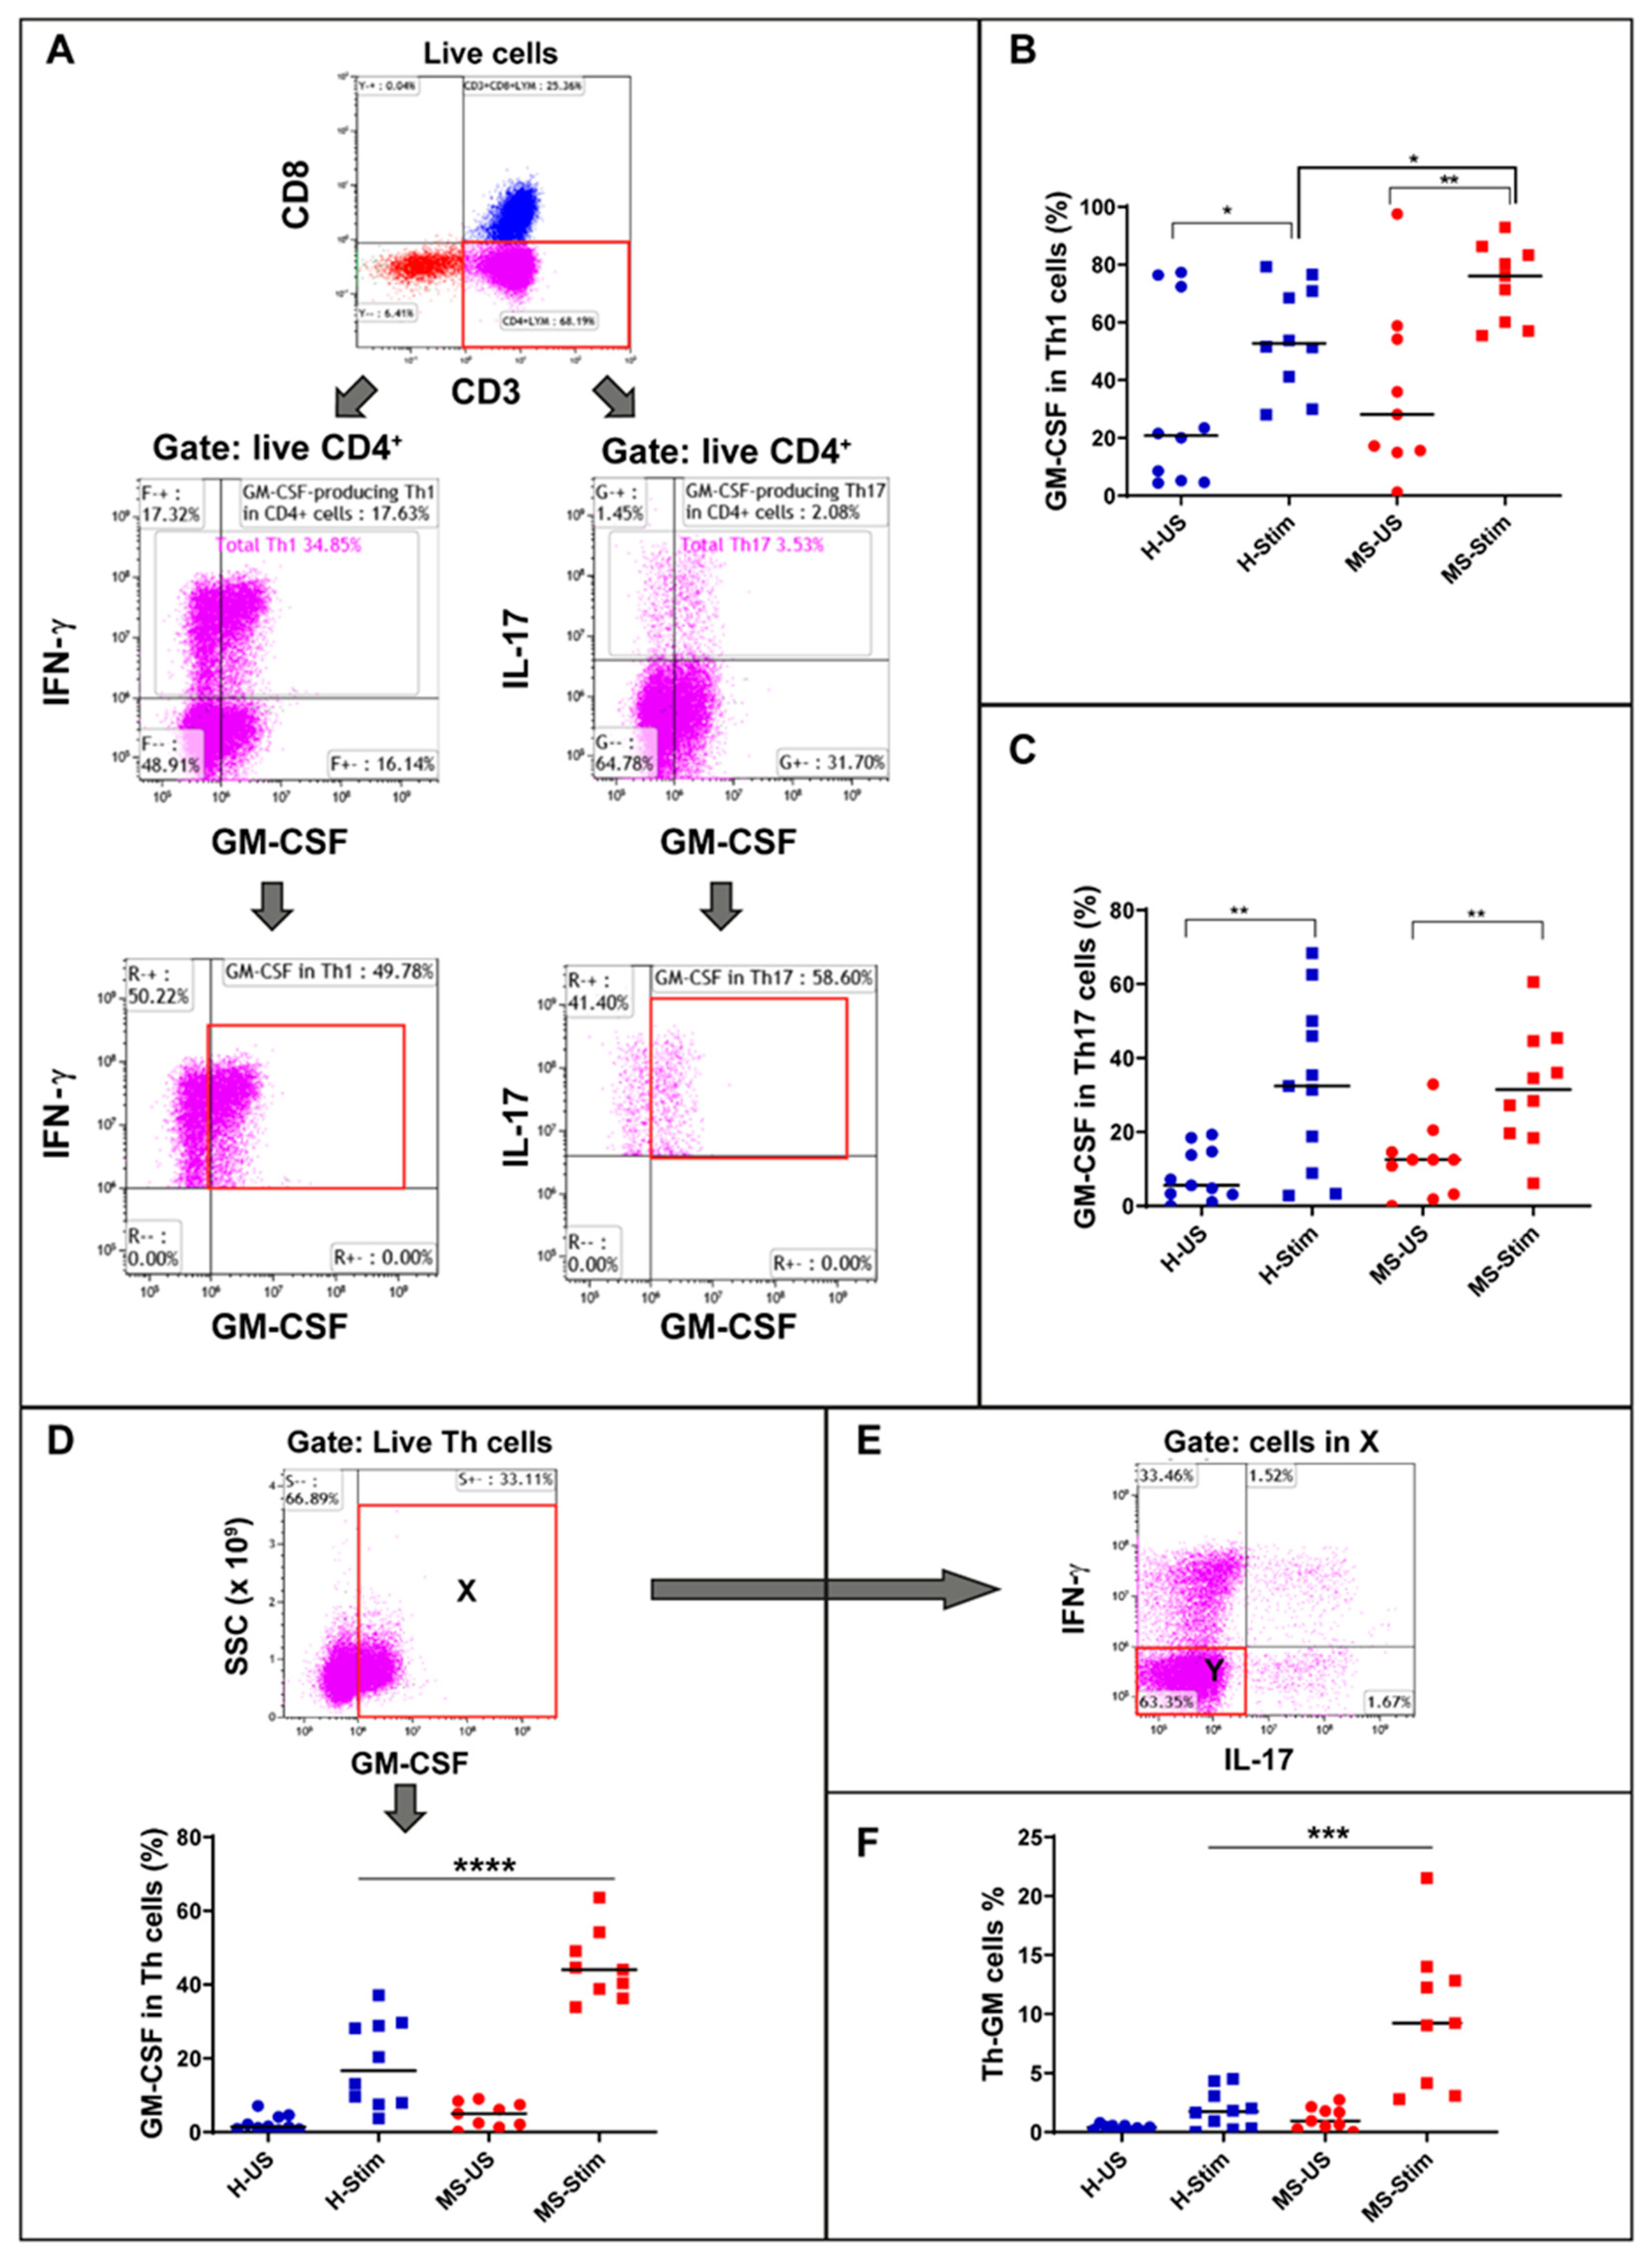
Abstract
:1. Introduction
2. Subjects and Methods
2.1. Subjects
2.2. Cell Culture and Stimulation
2.3. NK Cell Isolation and Stimulation
2.4. Naïve CD4 T Cell Isolation and Stimulation for Identification of Th-GM Cells
2.5. Cell Identification and Analysis by Flow Cytometry
2.6. Cytokine Determination by Multiplex Bead Assay and ELISA
2.7. Statistics and Data Analysis
3. Results
3.1. Demographic and Clinical Characteristics of Recruited Patients and Control Subjects
3.2. Higher Frequency of GM-CSF-Expressing Th1 Cells in PBMC of MS Patients after In Vitro Stimulation
3.3. Higher Percentage of Non-Th1 Non-Th17 Th Cells Expressing GM-CSF (Th-GM Cells) in PBMC of MS Patients after In Vitro Stimulation
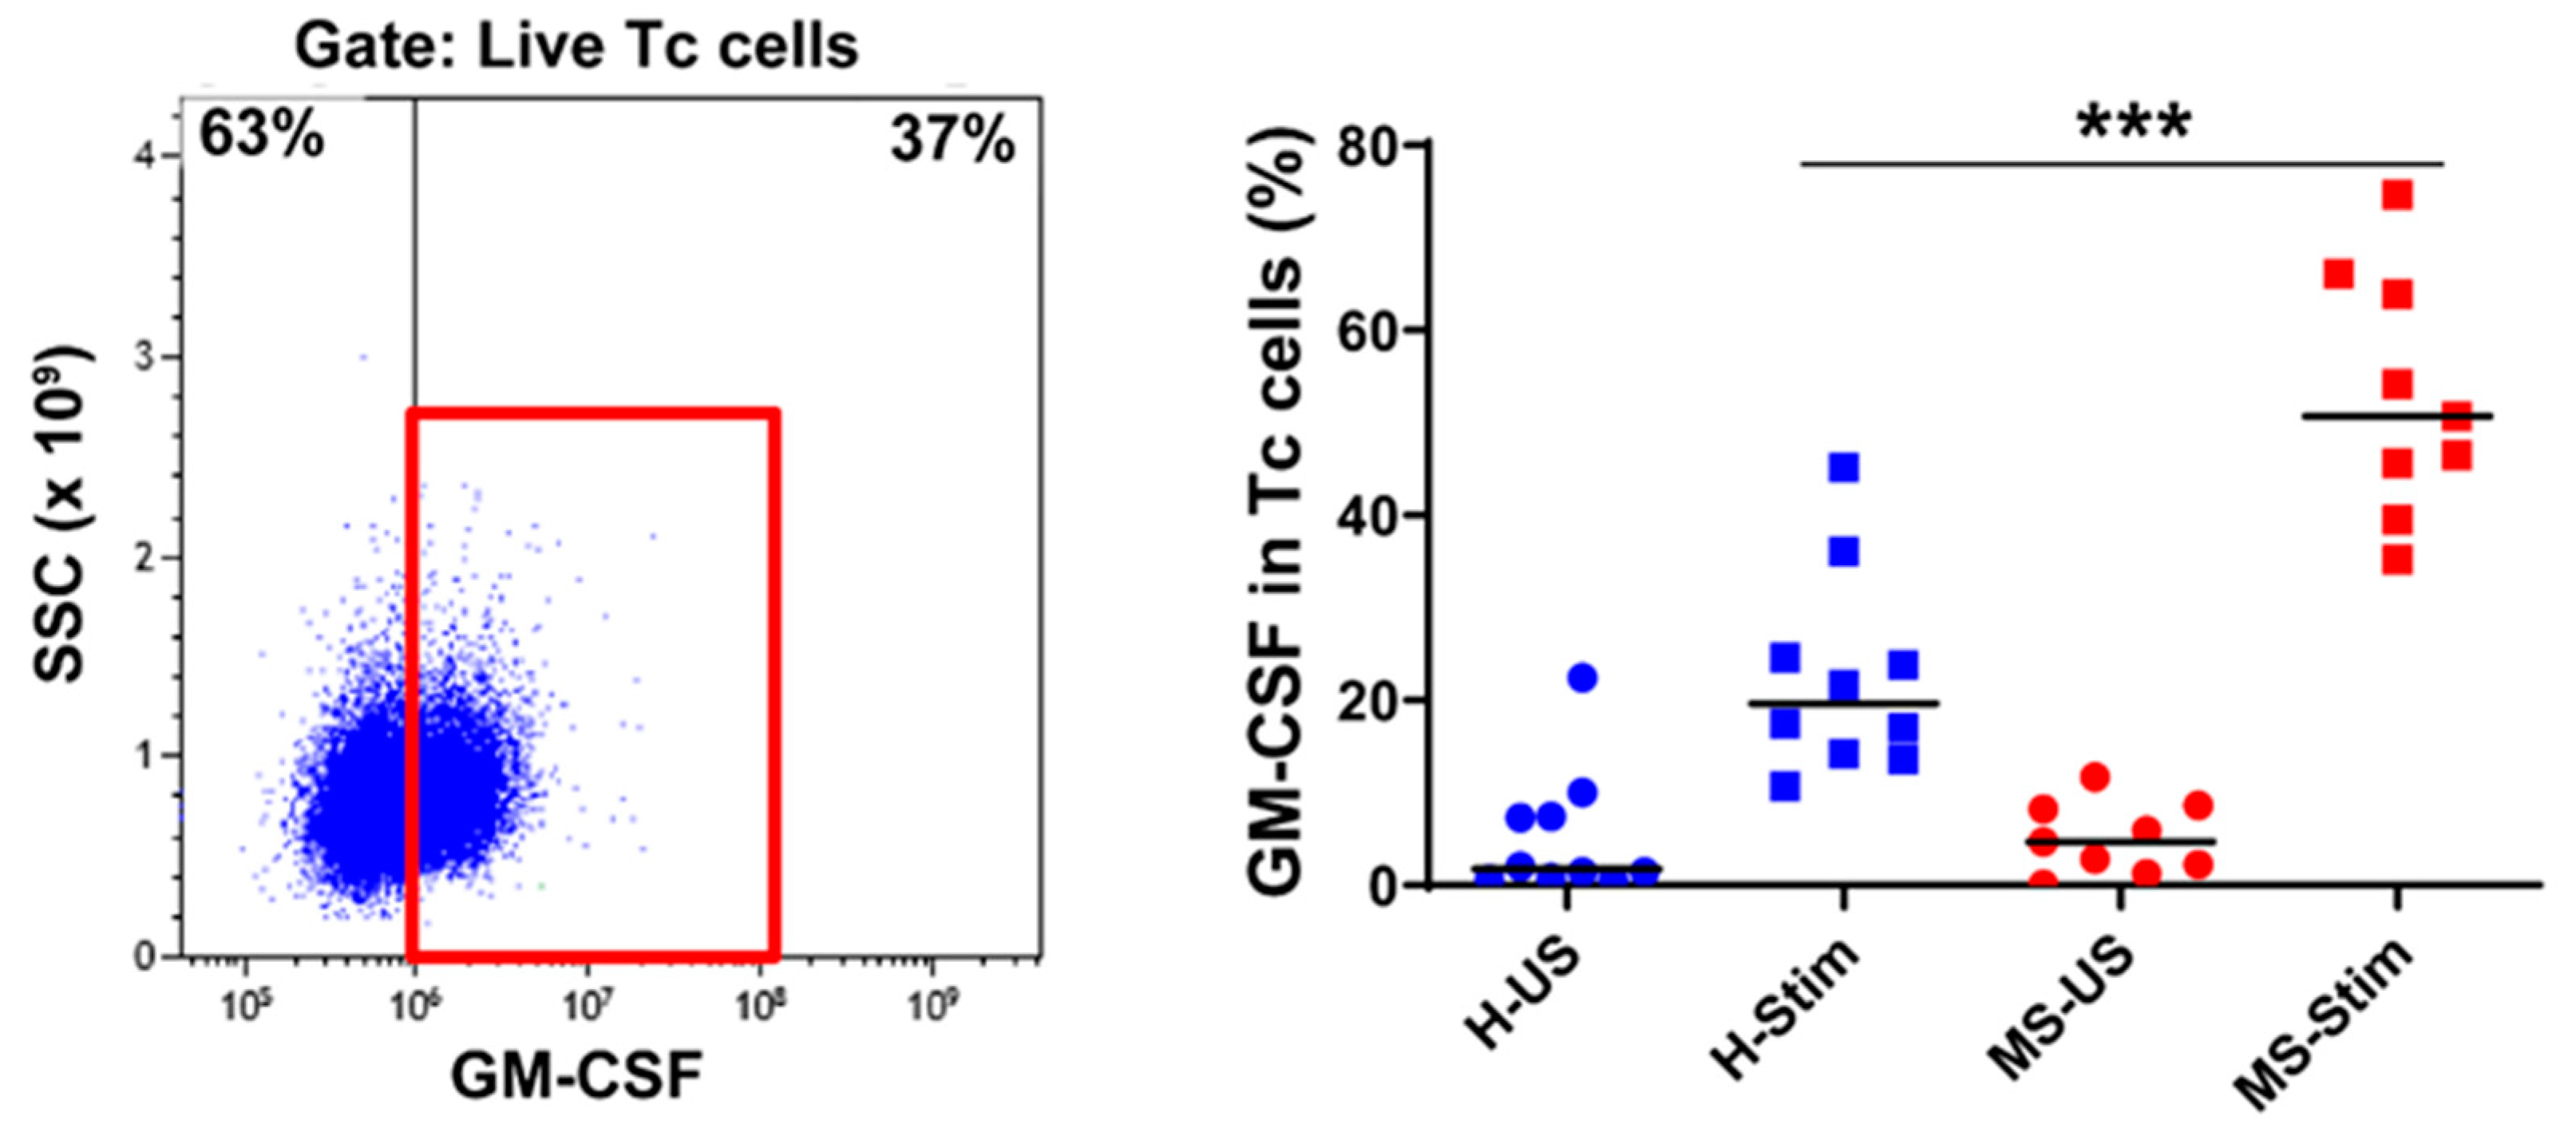
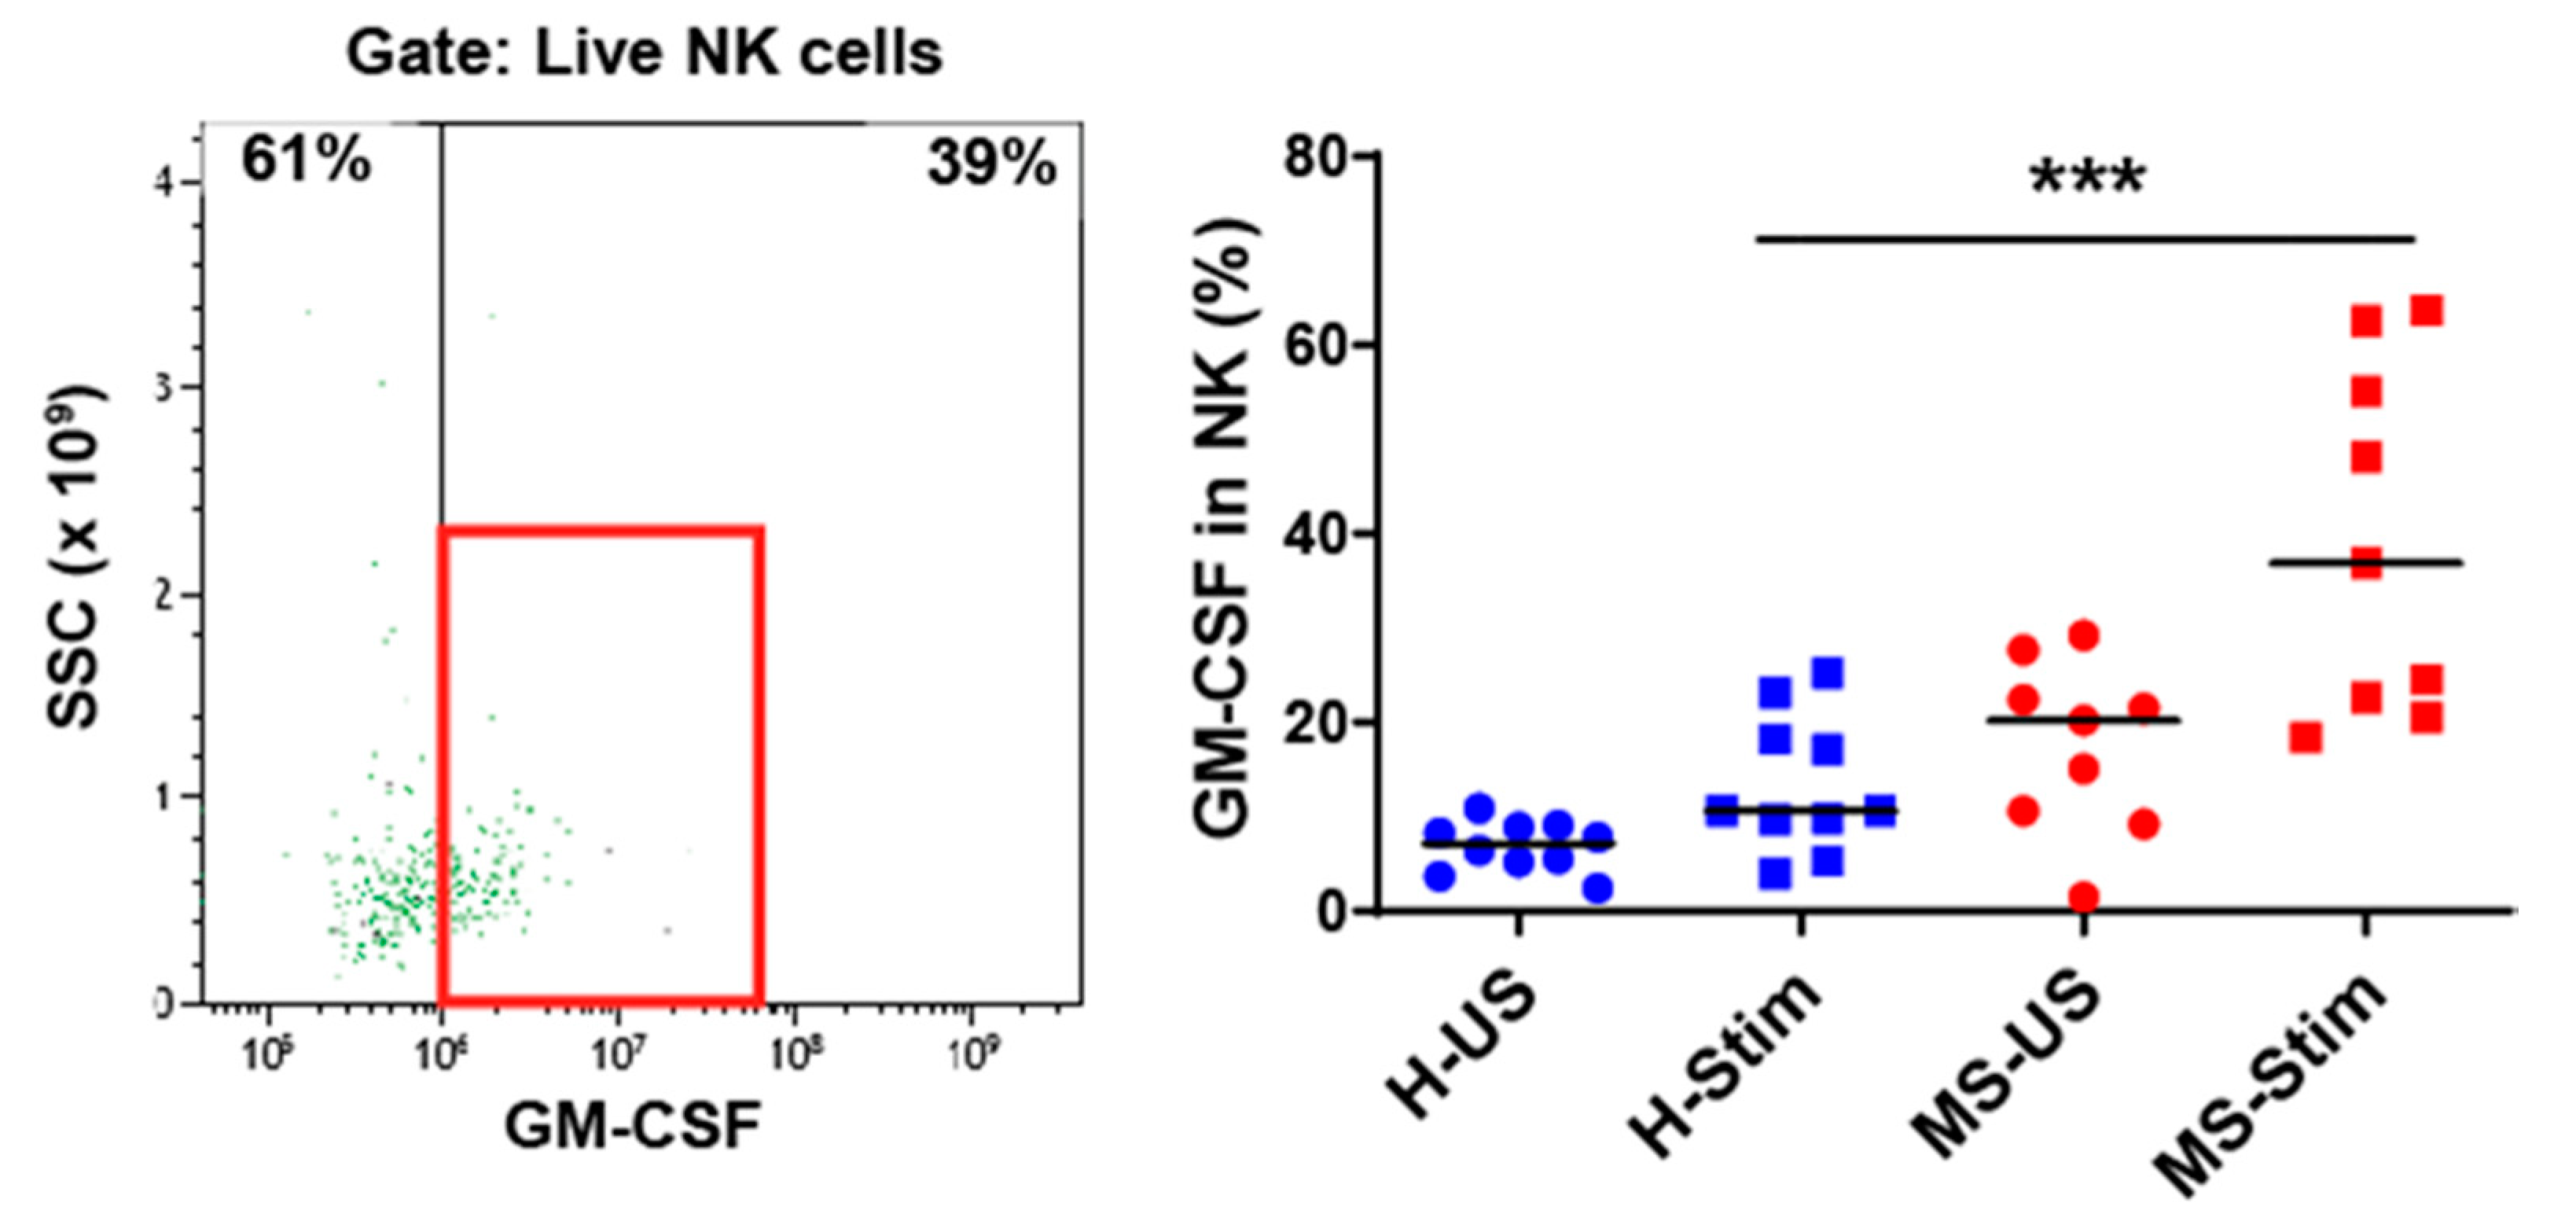
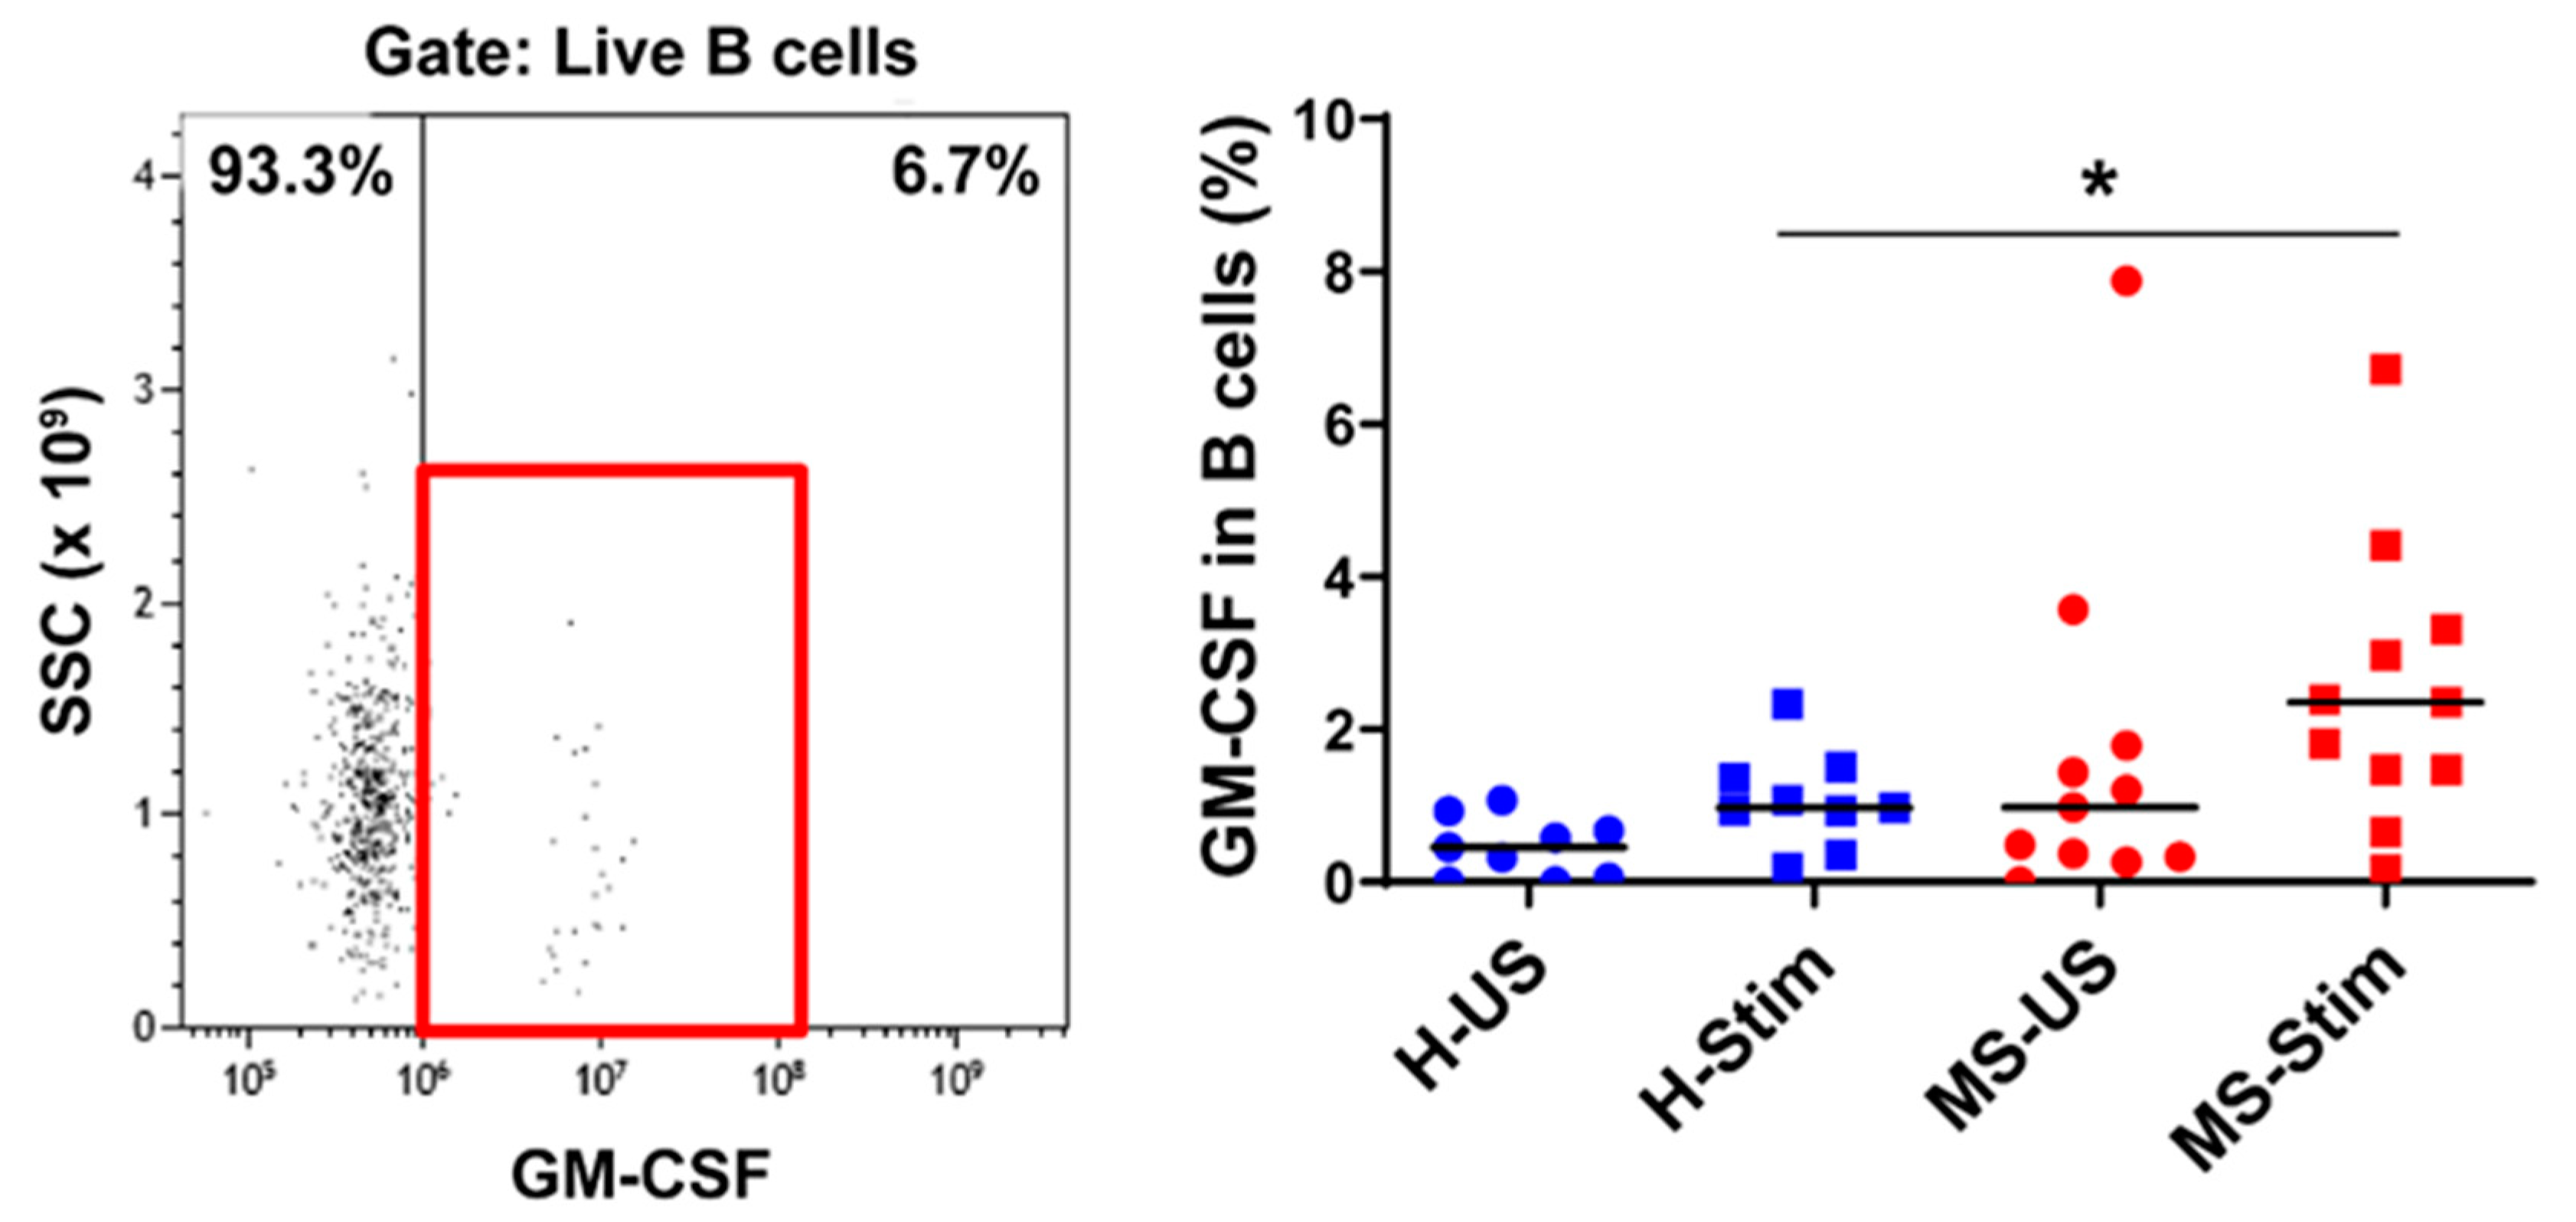
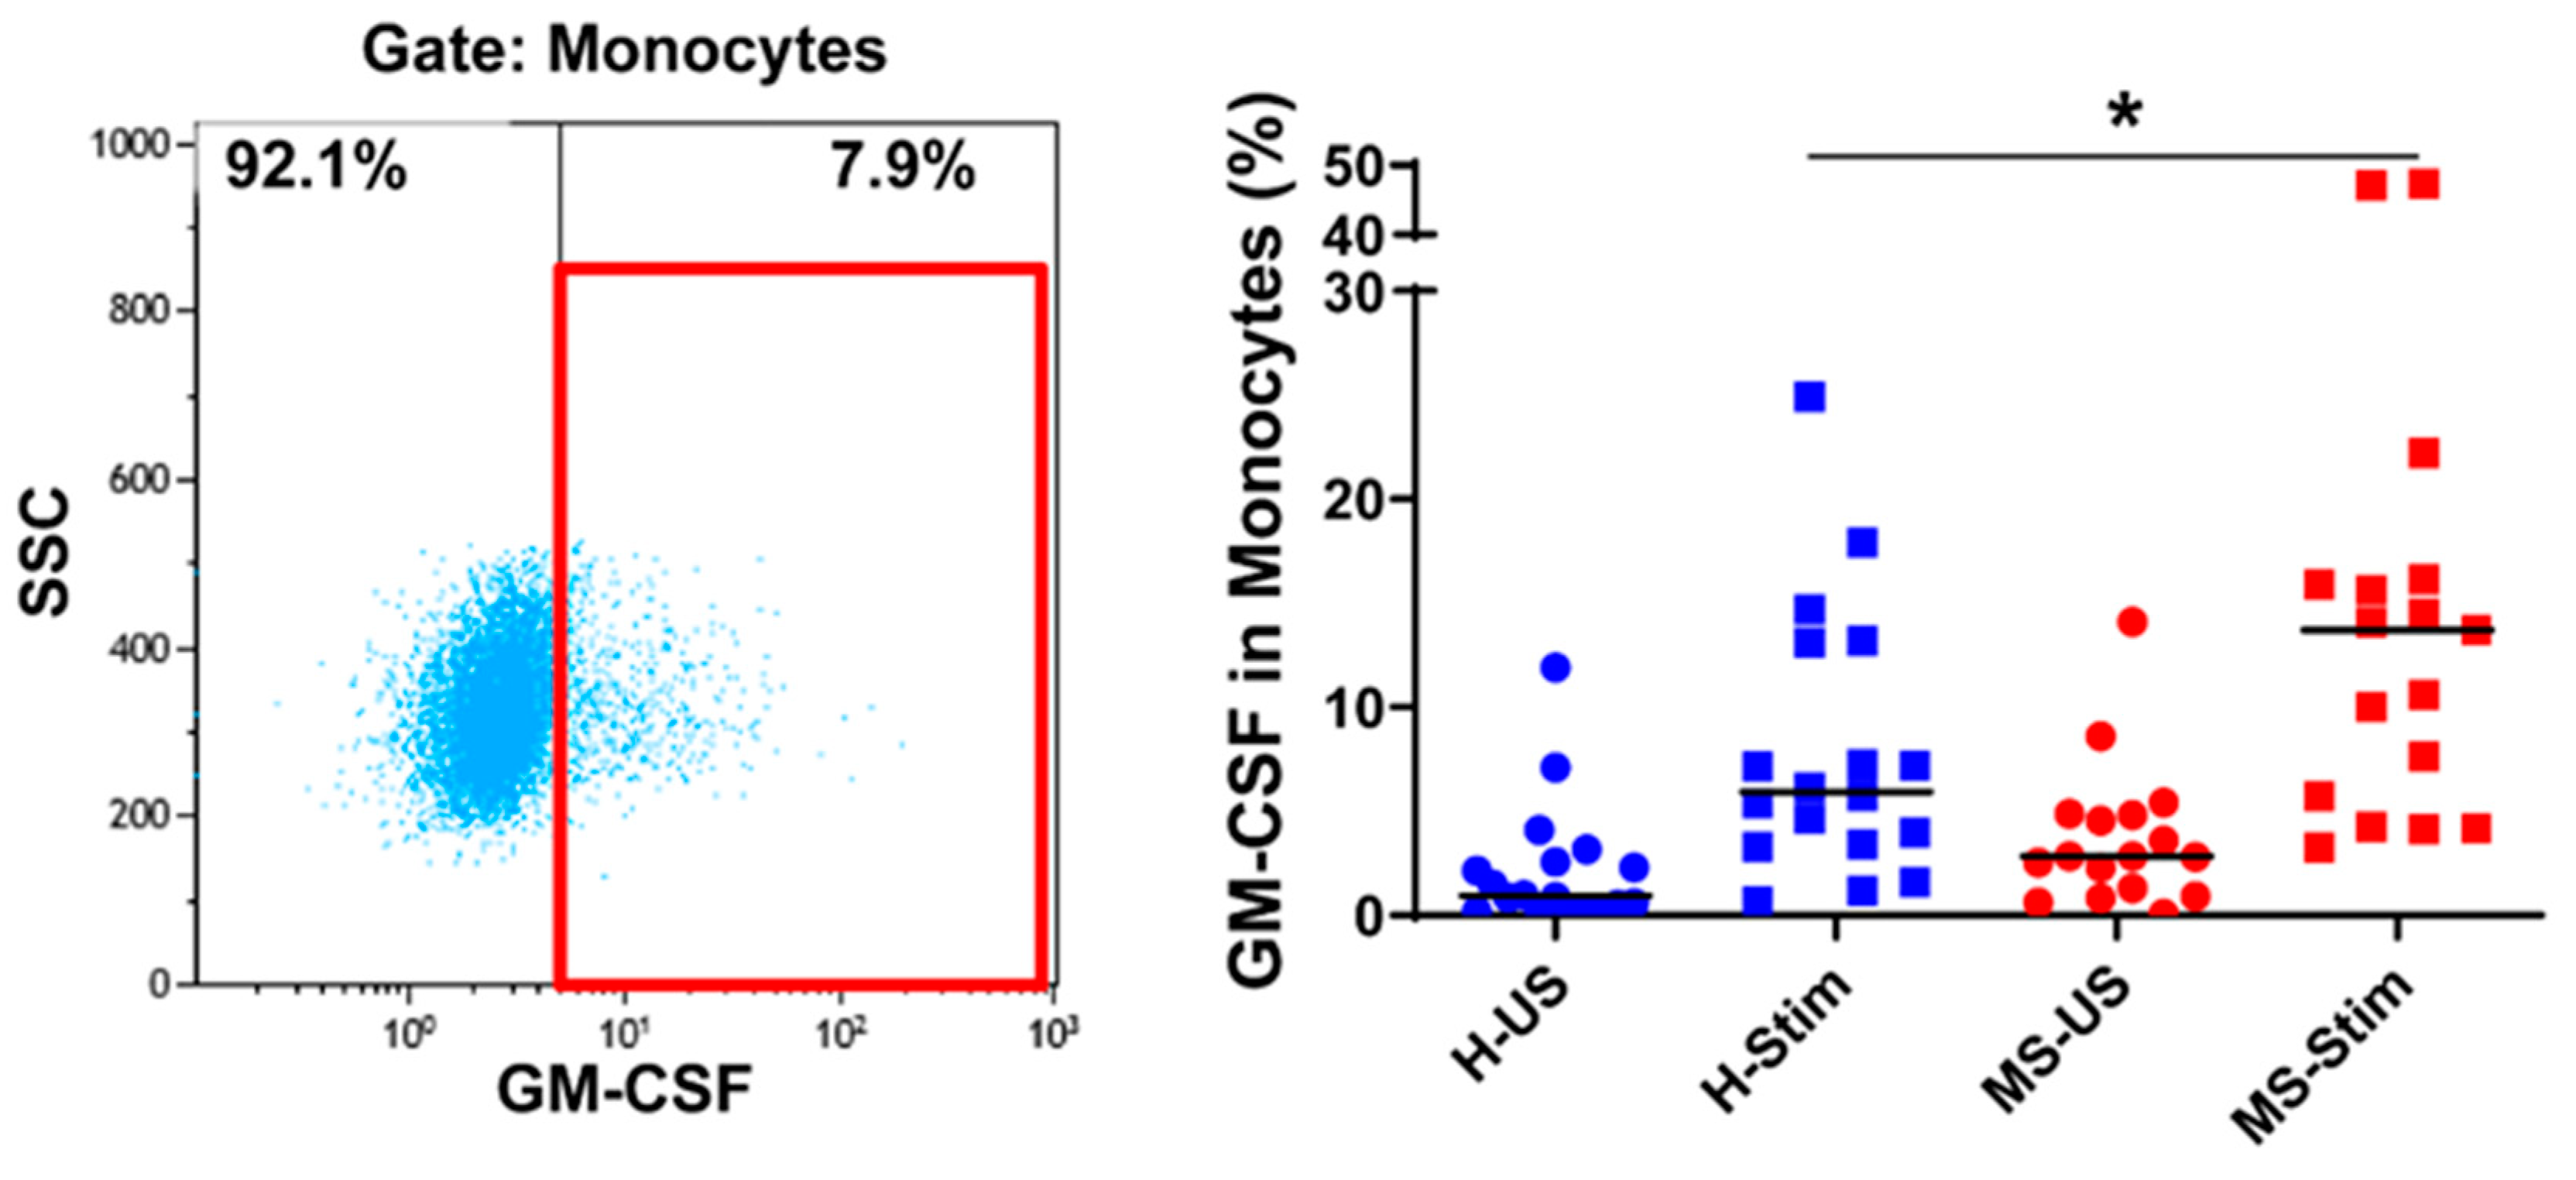
3.4. The Frequency of GM-CSF-Expressing Immune Cells Types after In Vitro Stimulation of PBMC Is Higher in MS
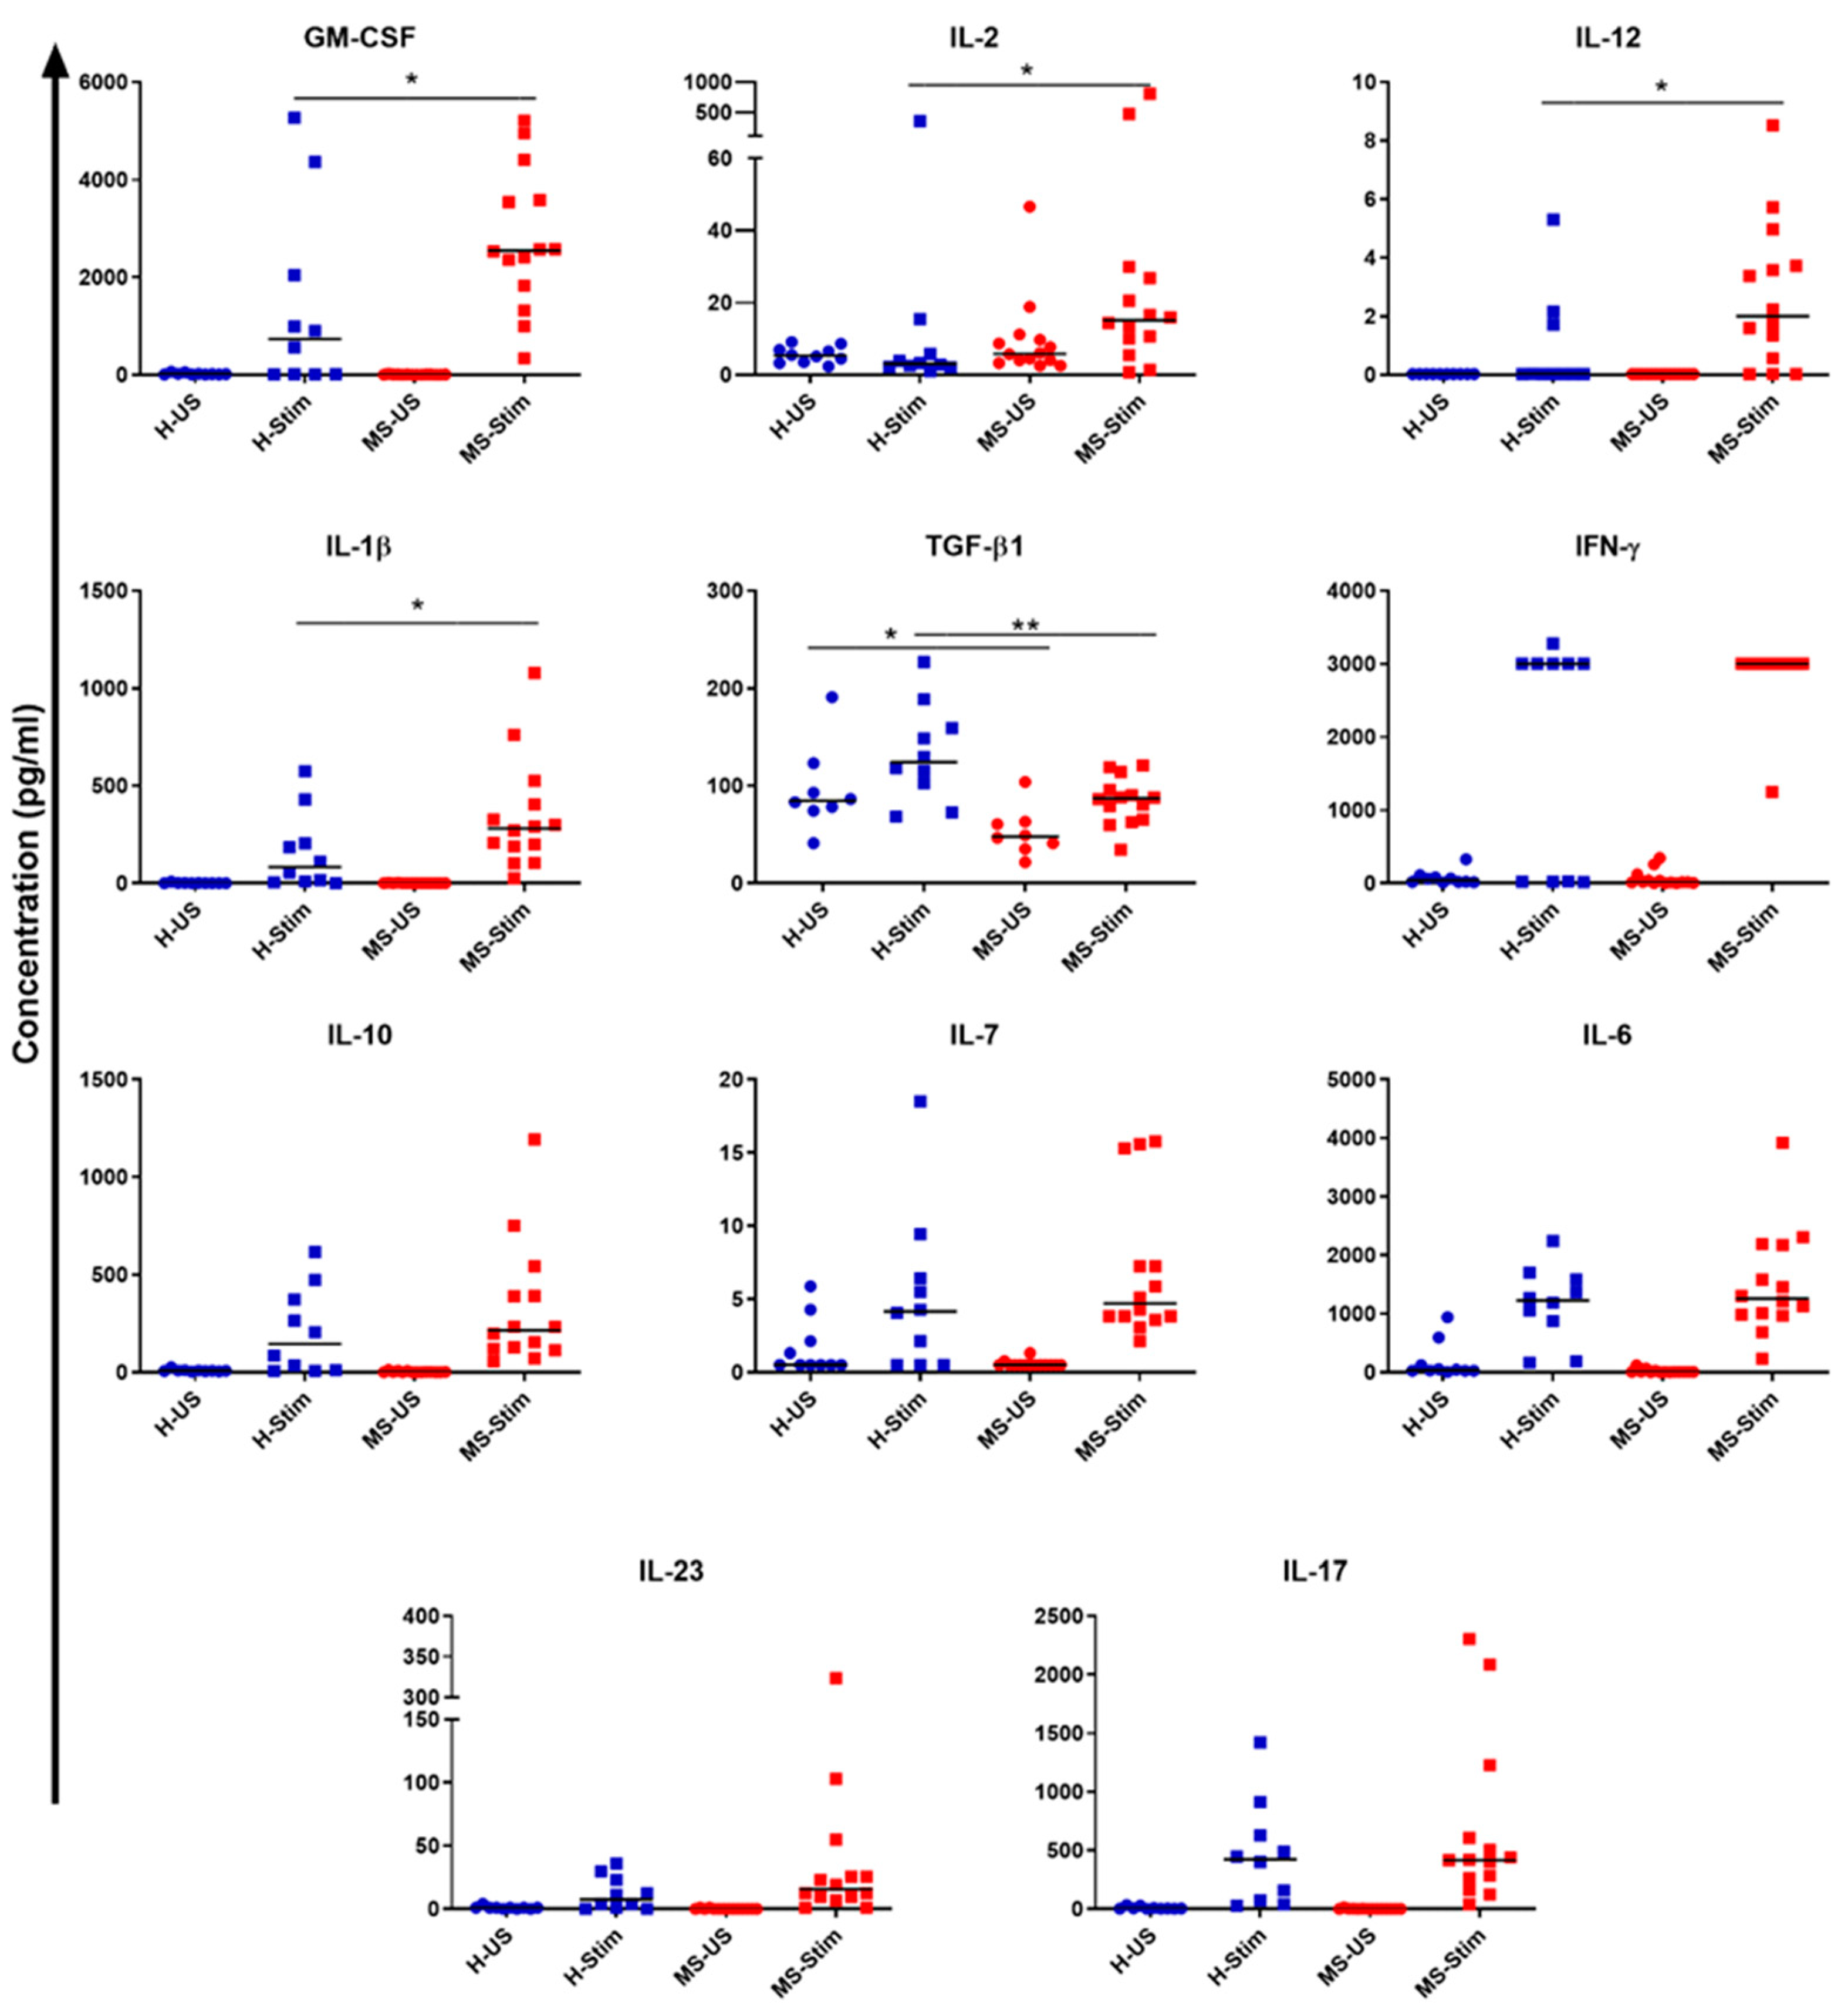
3.5. Supernatants of In Vitro Stimulated PBMC from MS Patients Contain Higher Levels of IL-2, IL-12, IL-1β, and GM-CSF and Lower TGF-β Levels than Those from Healthy Controls
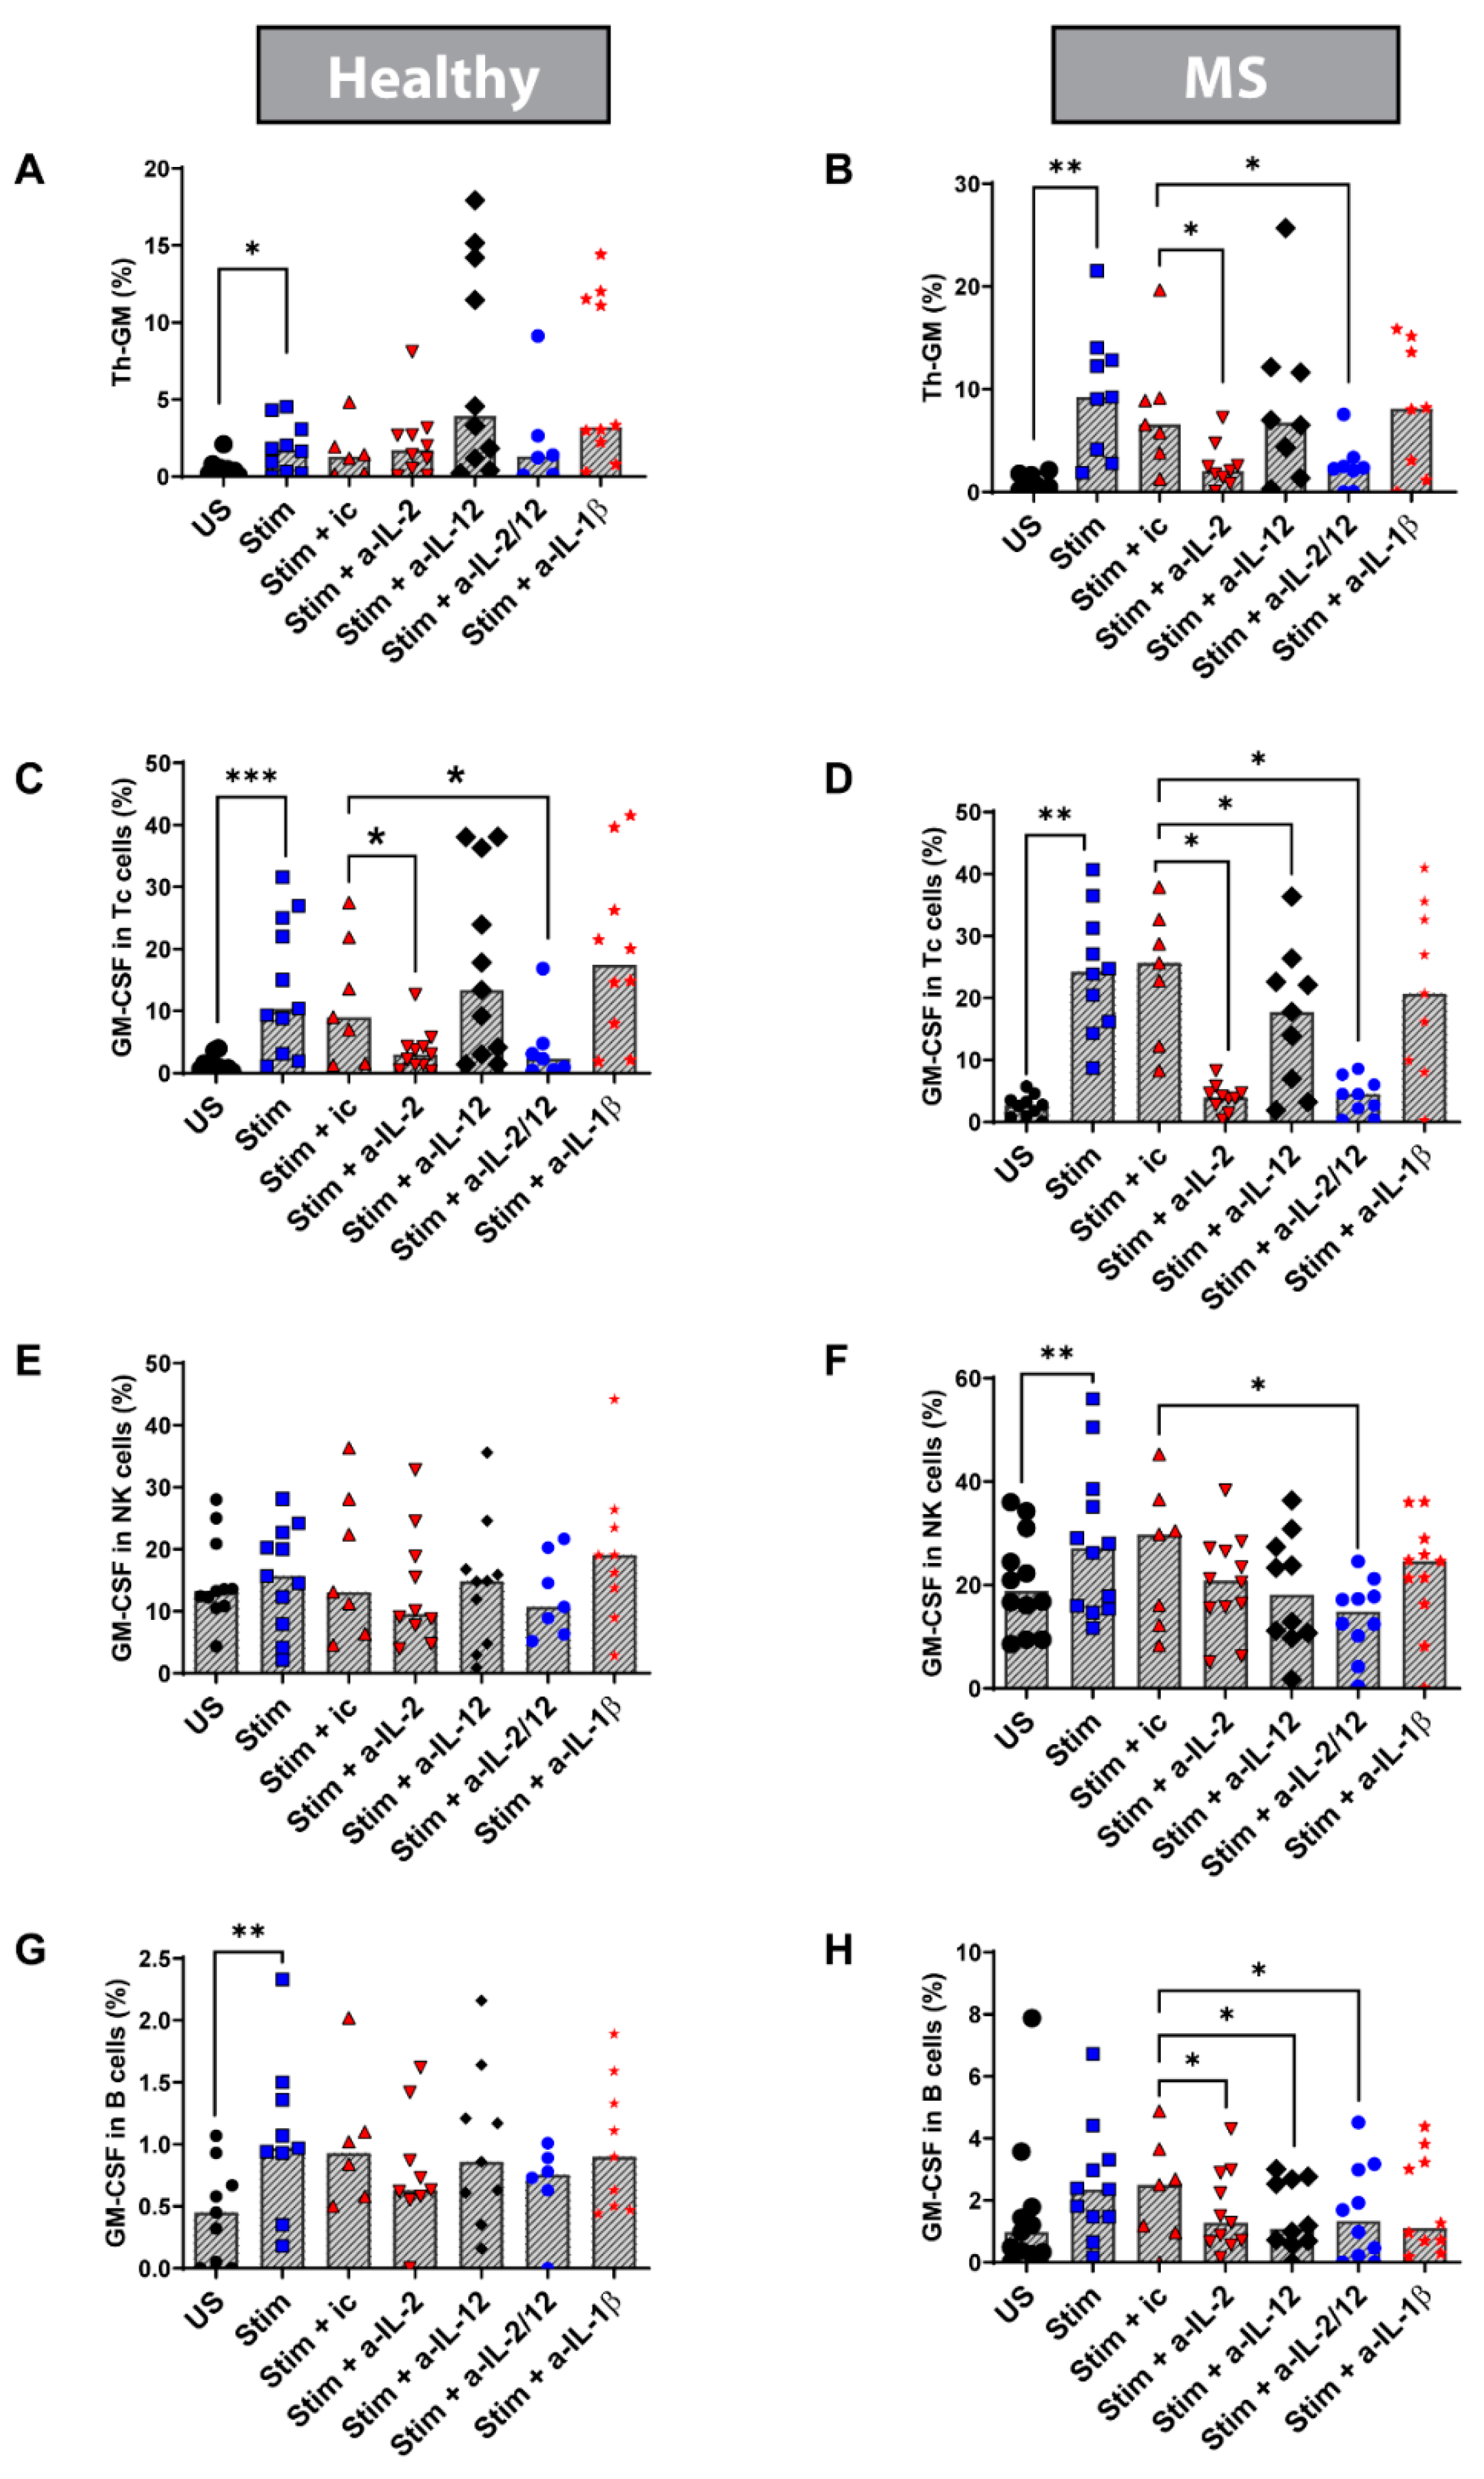
3.6. Blocking IL-2 In Vitro Reduced the Percentage of Th-GM Cells in Stimulated PBMC from MS Patients
3.7. Blocking IL-2 and IL-12 In Vitro Reduces the Frequency of Tc, NK, and B Cells Expressing GM-CSF in Stimulated PBMC from MS Patients
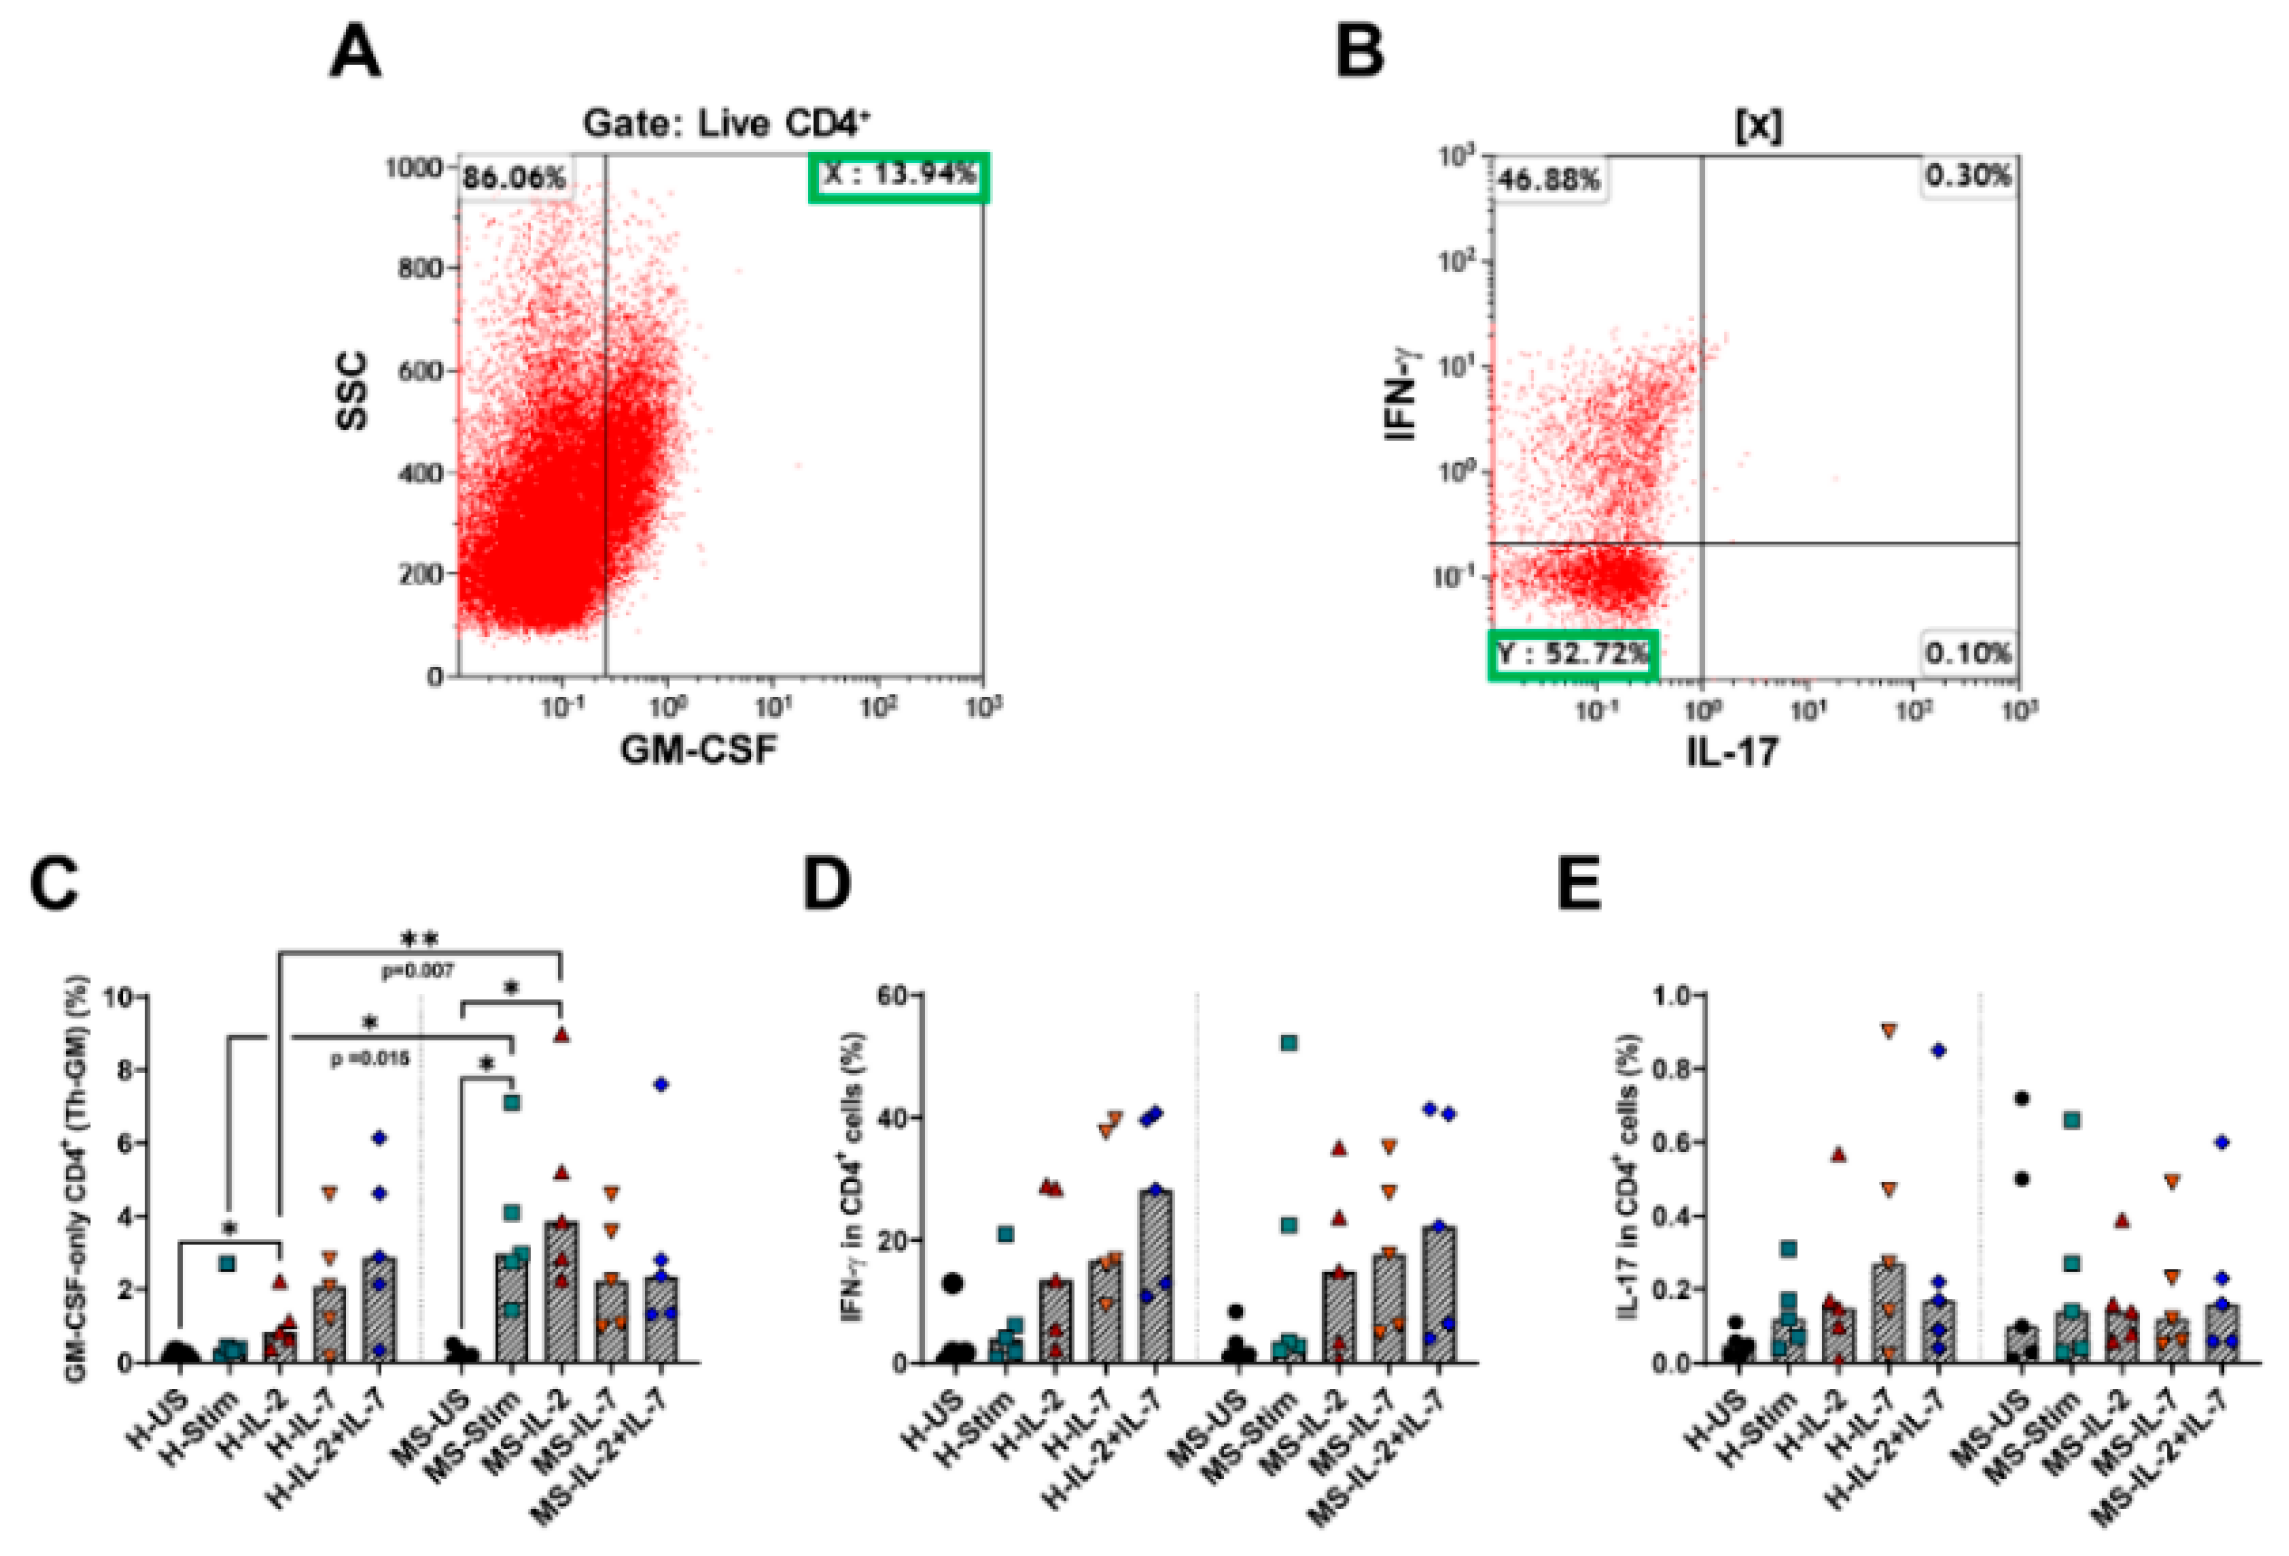
3.8. Th-GM Cells Differentiated In Vitro from Naïve CD4 T Cells Are More Frequent in Samples from MS Patients, and Exogenous IL-2 Increases Their Proportion Further
4. Discussion
5. Conclusions
Supplementary Materials
Author Contributions
Funding
Acknowledgments
Conflicts of Interest
References
- Compston, A.; Coles, A. Multiple sclerosis. Lancet 2008, 372, 1502–1517. [Google Scholar] [CrossRef]
- Haegert, D.G. Multiple sclerosis: A disorder of altered T-cell homeostasis. Mult. Scler. Int. 2011, 2011, 461304. [Google Scholar] [CrossRef] [PubMed] [Green Version]
- Desai, R.A.; Davies, A.L.; Tachrount, M.; Kasti, M.; Laulund, F.; Golay, X.; Smith, K.J. Cause and prevention of demyelination in a model multiple sclerosis lesion. Ann. Neurol. 2016. [Google Scholar] [CrossRef] [PubMed] [Green Version]
- Handman, E.; Burgess, A.W. Stimulation by granulocyte-macrophage colony-stimulating factor of Leishmania tropica killing by macrophages. J. Immunol. 1979, 122, 1134–1137. [Google Scholar]
- Hamilton, J.A.; Stanley, E.R.; Burgess, A.W.; Shadduck, R.K. Stimulation of macrophage plasminogen activator activity by colony-stimulating factors. J. Cell Physiol. 1980, 103, 435–445. [Google Scholar] [CrossRef]
- Whetton, A.D.; Dexter, T.M. Myeloid haemopoietic growth factors. Biochim. Biophys. Acta 1989, 989, 111–132. [Google Scholar] [CrossRef]
- Stanley, E.; Lieschke, G.J.; Grail, D.; Metcalf, D.; Hodgson, G.; Gall, J.A.; Maher, D.W.; Cebon, J.; Sinickas, V.; Dunn, A.R. Granulocyte/macrophage colony-stimulating factor-deficient mice show no major perturbation of hematopoiesis but develop a characteristic pulmonary pathology. Proc. Natl. Acad Sci. USA 1994, 91, 5592–5596. [Google Scholar] [CrossRef] [Green Version]
- Sawada, M.; Itoh, Y.; Suzumura, A.; Marunouchi, T. Expression of cytokine receptors in cultured neuronal and glial cells. Neurosci. Lett. 1993, 160, 131–134. [Google Scholar] [CrossRef]
- Ponomarev, E.D.; Shriver, L.P.; Maresz, K.; Pedras-Vasconcelos, J.; Verthelyi, D.; Dittel, B.N. GM-CSF production by autoreactive T cells is required for the activation of microglial cells and the onset of experimental autoimmune encephalomyelitis. J. Immunol. 2007, 178, 39–48. [Google Scholar] [CrossRef] [PubMed] [Green Version]
- Kroenke, M.A.; Chensue, S.W.; Segal, B.M. EAE mediated by a non-IFN-gamma/non-IL-17 pathway. Eur. J. Immunol. 2010, 40, 2340–2348. [Google Scholar] [CrossRef] [Green Version]
- Codarri, L.; Gyulveszi, G.; Tosevski, V.; Hesske, L.; Fontana, A.; Magnenat, L.; Suter, T.; Becher, B. RORgammat drives production of the cytokine GM-CSF in helper T cells, which is essential for the effector phase of autoimmune neuroinflammation. Nat. Immunol. 2011, 12, 560–567. [Google Scholar] [CrossRef] [PubMed]
- El-Behi, M.; Ciric, B.; Dai, H.; Yan, Y.; Cullimore, M.; Safavi, F.; Zhang, G.X.; Dittel, B.N.; Rostami, A. The encephalitogenicity of T(H)17 cells is dependent on IL-1- and IL-23-induced production of the cytokine GM-CSF. Nat. Immunol. 2011, 12, 568–575. [Google Scholar] [CrossRef] [PubMed] [Green Version]
- McQualter, J.L.; Darwiche, R.; Ewing, C.; Onuki, M.; Kay, T.W.; Hamilton, J.A.; Reid, H.H.; Bernard, C.C. Granulocyte macrophage colony-stimulating factor: A new putative therapeutic target in multiple sclerosis. J. Exp. Med. 2001, 194, 873–882. [Google Scholar] [CrossRef] [PubMed] [Green Version]
- Marusic, S.; Miyashiro, J.S.; Douhan, J., 3rd; Konz, R.F.; Xuan, D.; Pelker, J.W.; Ling, V.; Leonard, J.P.; Jacobs, K.A. Local delivery of granulocyte macrophage colony-stimulating factor by retrovirally transduced antigen-specific T cells leads to severe, chronic experimental autoimmune encephalomyelitis in mice. Neurosci. Lett. 2002, 332, 185–189. [Google Scholar] [CrossRef]
- Duncker, P.C.; Stoolman, J.S.; Huber, A.K.; Segal, B.M. GM-CSF Promotes Chronic Disability in Experimental Autoimmune Encephalomyelitis by Altering the Composition of Central Nervous System-Infiltrating Cells, but Is Dispensable for Disease Induction. J. Immunol. 2018, 200, 966–973. [Google Scholar] [CrossRef]
- Komuczki, J.; Tuzlak, S.; Friebel, E.; Hartwig, T.; Spath, S.; Rosenstiel, P.; Waisman, A.; Opitz, L.; Oukka, M.; Schreiner, B.; et al. Fate-Mapping of GM-CSF Expression Identifies a Discrete Subset of Inflammation-Driving T Helper Cells Regulated by Cytokines IL-23 and IL-1beta. Immunity 2019, 50, 1289–1304 e1286. [Google Scholar] [CrossRef]
- Sheng, W.; Yang, F.; Zhou, Y.; Yang, H.; Low, P.Y.; Kemeny, D.M.; Tan, P.; Moh, A.; Kaplan, M.H.; Zhang, Y.; et al. STAT5 programs a distinct subset of GM-CSF-producing T helper cells that is essential for autoimmune neuroinflammation. Cell Res. 2014, 24, 1387–1402. [Google Scholar] [CrossRef] [Green Version]
- Carrieri, P.B.; Provitera, V.; De Rosa, T.; Tartaglia, G.; Gorga, F.; Perrella, O. Profile of cerebrospinal fluid and serum cytokines in patients with relapsing-remitting multiple sclerosis: A correlation with clinical activity. Immunopharmacol. Immunotoxicol. 1998, 20, 373–382. [Google Scholar] [CrossRef]
- Rasouli, J.; Ciric, B.; Imitola, J.; Gonnella, P.; Hwang, D.; Mahajan, K.; Mari, E.R.; Safavi, F.; Leist, T.P.; Zhang, G.X.; et al. Expression of GM-CSF in T Cells Is Increased in Multiple Sclerosis and Suppressed by IFN-beta Therapy. J. Immunol. 2015, 194, 5085–5093. [Google Scholar] [CrossRef]
- Noster, R.; Riedel, R.; Mashreghi, M.F.; Radbruch, H.; Harms, L.; Haftmann, C.; Chang, H.D.; Radbruch, A.; Zielinski, C.E. IL-17 and GM-CSF expression are antagonistically regulated by human T helper cells. Sci. Transl. Med. 2014, 6, 241ra280. [Google Scholar] [CrossRef]
- Imitola, J.; Rasouli, J.; Watanabe, F.; Mahajan, K.; Sharan, A.D.; Ciric, B.; Zhang, G.X.; Rostami, A. Elevated expression of granulocyte-macrophage colony-stimulating factor receptor in multiple sclerosis lesions. J. Neuroimmunol. 2018, 317, 45–54. [Google Scholar] [CrossRef]
- Hartmann, F.J.; Khademi, M.; Aram, J.; Ammann, S.; Kockum, I.; Constantinescu, C.; Gran, B.; Piehl, F.; Olsson, T.; Codarri, L.; et al. Multiple sclerosis-associated IL2RA polymorphism controls GM-CSF production in human TH cells. Nat. Commun. 2014, 5, 5056. [Google Scholar] [CrossRef] [PubMed] [Green Version]
- Restorick, S.M.; Durant, L.; Kalra, S.; Hassan-Smith, G.; Rathbone, E.; Douglas, M.R.; Curnow, S.J. CCR6(+) Th cells in the cerebrospinal fluid of persons with multiple sclerosis are dominated by pathogenic non-classic Th1 cells and GM-CSF-only-secreting Th cells. Brain Behav. Immun. 2017, 64, 71–79. [Google Scholar] [CrossRef] [PubMed]
- Galli, E.; Hartmann, F.J.; Schreiner, B.; Ingelfinger, F.; Arvaniti, E.; Diebold, M.; Mrdjen, D.; van der Meer, F.; Krieg, C.; Nimer, F.A.; et al. GM-CSF and CXCR4 define a T helper cell signature in multiple sclerosis. Nat. Med. 2019, 25, 1290–1300. [Google Scholar] [CrossRef] [PubMed]
- Grishkan, I.V.; Ntranos, A.; Calabresi, P.A.; Gocke, A.R. Helper T cells down-regulate CD4 expression upon chronic stimulation giving rise to double-negative T cells. Cell Immunol. 2013, 284, 68–74. [Google Scholar] [CrossRef] [Green Version]
- Pelchen-Matthews, A.; Parsons, I.J.; Marsh, M. Phorbol ester-induced downregulation of CD4 is a multistep process involving dissociation from p56lck, increased association with clathrin-coated pits, and altered endosomal sorting. J. Exp. Med. 1993, 178, 1209–1222. [Google Scholar] [CrossRef]
- Mendes, R.; Bromelow, K.V.; Westby, M.; Galea-Lauri, J.; Smith, I.E.; O’Brien, M.E.; Souberbielle, B.E. Flow cytometric visualisation of cytokine production by CD3-CD56+ NK cells and CD3+CD56+ NK-T cells in whole blood. Cytometry 2000, 39, 72–78. [Google Scholar] [CrossRef]
- Cooper, M.A.; Fehniger, T.A.; Turner, S.C.; Chen, K.S.; Ghaheri, B.A.; Ghayur, T.; Carson, W.E.; Caligiuri, M.A. Human natural killer cells: A unique innate immunoregulatory role for the CD56(bright) subset. Blood 2001, 97, 3146–3151. [Google Scholar] [CrossRef] [Green Version]
- Barr, T.A.; Shen, P.; Brown, S.; Lampropoulou, V.; Roch, T.; Lawrie, S.; Fan, B.; O’Connor, R.A.; Anderton, S.M.; Bar-Or, A.; et al. B cell depletion therapy ameliorates autoimmune disease through ablation of IL-6-producing B cells. J. Exp. Med. 2012, 209, 1001–1010. [Google Scholar] [CrossRef]
- Duhen, T.; Campbell, D.J. IL-1beta promotes the differentiation of polyfunctional human CCR6+CXCR3+ Th1/17 cells that are specific for pathogenic and commensal microbes. J. Immunol. 2014, 193, 120–129. [Google Scholar] [CrossRef] [Green Version]
- Hashimoto, S.I.; Komuro, I.; Yamada, M.; Akagawa, K.S. IL-10 inhibits granulocyte-macrophage colony-stimulating factor-dependent human monocyte survival at the early stage of the culture and inhibits the generation of macrophages. J. Immunol. 2001, 167, 3619–3625. [Google Scholar] [CrossRef] [PubMed]
- Sawcer, S.; Hellenthal, G.; Pirinen, M.; Spencer, C.C.; Patsopoulos, N.A.; Moutsianas, L.; Dilthey, A.; Su, Z.; Freeman, C.; Hunt, S.E.; et al. Genetic risk and a primary role for cell-mediated immune mechanisms in multiple sclerosis. Nature 2011, 476, 214–219. [Google Scholar] [CrossRef] [PubMed]
- Trinchieri, G. Interleukin-12: A proinflammatory cytokine with immunoregulatory functions that bridge innate resistance and antigen-specific adaptive immunity. Annu. Rev. Immunol. 1995, 13, 251–276. [Google Scholar] [CrossRef] [PubMed]
- Hohlfeld, R.; Dornmair, K.; Meinl, E.; Wekerle, H. The search for the target antigens of multiple sclerosis, part 1: Autoreactive CD4+ T lymphocytes as pathogenic effectors and therapeutic targets. Lancet Neurol. 2016, 15, 198–209. [Google Scholar] [CrossRef]
- Hohlfeld, R.; Dornmair, K.; Meinl, E.; Wekerle, H. The search for the target antigens of multiple sclerosis, part 2: CD8+ T cells, B cells, and antibodies in the focus of reverse-translational research. Lancet Neurol. 2016, 15, 317–331. [Google Scholar] [CrossRef]
- Groh, V.; Bruhl, A.; El-Gabalawy, H.; Nelson, J.L.; Spies, T. Stimulation of T cell autoreactivity by anomalous expression of NKG2D and its MIC ligands in rheumatoid arthritis. Proc. Natl. Acad. Sci. USA 2003, 100, 9452–9457. [Google Scholar] [CrossRef] [Green Version]
- Reynolds, J.; Tam, F.W.; Chandraker, A.; Smith, J.; Karkar, A.M.; Cross, J.; Peach, R.; Sayegh, M.H.; Pusey, C.D. CD28-B7 blockade prevents the development of experimental autoimmune glomerulonephritis. J. Clin. Investig. 2000, 105, 643–651. [Google Scholar] [CrossRef] [Green Version]
- Li, R.; Rezk, A.; Miyazaki, Y.; Hilgenberg, E.; Touil, H.; Shen, P.; Moore, C.S.; Michel, L.; Althekair, F.; Rajasekharan, S.; et al. Proinflammatory GM-CSF-producing B cells in multiple sclerosis and B cell depletion therapy. Sci. Transl. Med. 2015, 7, 310ra166. [Google Scholar] [CrossRef]
- Takahashi, K.; Miyake, S.; Kondo, T.; Terao, K.; Hatakenaka, M.; Hashimoto, S.; Yamamura, T. Natural killer type 2 bias in remission of multiple sclerosis. J. Clin. Investig. 2001, 107, R23–R29. [Google Scholar] [CrossRef] [Green Version]
- Peritt, D.; Robertson, S.; Gri, G.; Showe, L.; Aste-Amezaga, M.; Trinchieri, G. Differentiation of human NK cells into NK1 and NK2 subsets. J. Immunol. 1998, 161, 5821–5824. [Google Scholar]
- Lehmann, C.; Zeis, M.; Uharek, L. Activation of natural killer cells with interleukin 2 (IL-2) and IL-12 increases perforin binding and subsequent lysis of tumour cells. Br. J. Haematol. 2001, 114, 660–665. [Google Scholar] [CrossRef] [PubMed]
- Parihar, R.; Dierksheide, J.; Hu, Y.; Carson, W.E. IL-12 enhances the natural killer cell cytokine response to Ab-coated tumor cells. J. Clin. Investig. 2002, 110, 983–992. [Google Scholar] [CrossRef] [PubMed]
- Leong, J.W.; Chase, J.M.; Romee, R.; Schneider, S.E.; Sullivan, R.P.; Cooper, M.A.; Fehniger, T.A. Preactivation with IL-12, IL-15, and IL-18 induces CD25 and a functional high-affinity IL-2 receptor on human cytokine-induced memory-like natural killer cells. Biol. Blood Marrow Transpl. 2014, 20, 463–473. [Google Scholar] [CrossRef] [PubMed] [Green Version]
- Boyman, O.; Sprent, J. The role of interleukin-2 during homeostasis and activation of the immune system. Nat. Rev. Immunol. 2012, 12, 180–190. [Google Scholar] [CrossRef]
- Amu, S.; Brisslert, M. Phenotype and function of CD25-expressing B lymphocytes isolated from human umbilical cord blood. Clin. Dev. Immunol. 2011, 2011, 481948. [Google Scholar] [CrossRef]
- Mingari, M.C.; Gerosa, F.; Carra, G.; Accolla, R.S.; Moretta, A.; Zubler, R.H.; Waldmann, T.A.; Moretta, L. Human interleukin-2 promotes proliferation of activated B cells via surface receptors similar to those of activated T cells. Nature 1984, 312, 641–643. [Google Scholar] [CrossRef]
- Nakagawa, T.; Hirano, T.; Nakagawa, N.; Yoshizaki, K.; Kishimoto, T. Effect of recombinant IL 2 and gamma-IFN on proliferation and differentiation of human B cells. J. Immunol. 1985, 134, 959–966. [Google Scholar]
- Miyawaki, T.; Suzuki, T.; Butler, J.L.; Cooper, M.D. Interleukin-2 effects on human B cells activated in vivo. J. Clin. Immunol. 1987, 7, 277–287. [Google Scholar] [CrossRef]
- Le Gallou, S.; Caron, G.; Delaloy, C.; Rossille, D.; Tarte, K.; Fest, T. IL-2 requirement for human plasma cell generation: Coupling differentiation and proliferation by enhancing MAPK-ERK signaling. J. Immunol. 2012, 189, 161–173. [Google Scholar] [CrossRef] [PubMed] [Green Version]
- Ai, W.; Li, H.; Song, N.; Li, L.; Chen, H. Optimal method to stimulate cytokine production and its use in immunotoxicity assessment. Int. J. Environ. Res. Public Health 2013, 10, 3834–3842. [Google Scholar] [CrossRef] [Green Version]
- Harris, R.J.; Pettitt, A.R.; Schmutz, C.; Sherrington, P.D.; Zuzel, M.; Cawley, J.C.; Griffiths, S.D. Granulocyte-macrophage colony-stimulating factor as an autocrine survival factor for mature normal and malignant B lymphocytes. J. Immunol. 2000, 164, 3887–3893. [Google Scholar] [CrossRef] [PubMed]
- Trinchieri, G. Interleukin-12: A cytokine produced by antigen-presenting cells with immunoregulatory functions in the generation of T-helper cells type 1 and cytotoxic lymphocytes. Blood 1994, 84, 4008–4027. [Google Scholar] [CrossRef] [Green Version]
- Durali, D.; de Goer de Herve, M.G.; Giron-Michel, J.; Azzarone, B.; Delfraissy, J.F.; Taoufik, Y. In human B cells, IL-12 triggers a cascade of molecular events similar to Th1 commitment. Blood 2003, 102, 4084–4089. [Google Scholar] [CrossRef] [PubMed]
- Shokrgozar, M.A.; Sarial, S.; Amirzargar, A.; Shokri, F.; Rezaei, N.; Arjang, Z.; Radfar, J.; Yousefi-Behzadi, M.; Ali Sahraian, M.; Lotfi, J. IL-2, IFN-gamma, and IL-12 gene polymorphisms and susceptibility to multiple sclerosis. J. Clin. Immunol. 2009, 29, 747–751. [Google Scholar] [CrossRef]
- Javan, M.R.; Shahraki, S.; Safa, A.; Zamani, M.R.; Salmaninejad, A.; Aslani, S. An interleukin 12 B single nucleotide polymorphism increases IL-12p40 production and is associated with increased disease susceptibility in patients with relapsing-remitting multiple sclerosis. Neurol Res. 2017, 39, 435–441. [Google Scholar] [CrossRef]
- Braitch, M.; Kawabe, K.; Nyirenda, M.; Gilles, L.J.; Robins, R.A.; Gran, B.; Murphy, S.; Showe, L.; Constantinescu, C.S. Expression of activity-dependent neuroprotective protein in the immune system: Possible functions and relevance to multiple sclerosis. Neuroimmunomodulation 2010, 17, 120–125. [Google Scholar] [CrossRef] [PubMed]
- Yoshimura, A.; Muto, G. TGF-beta function in immune suppression. Curr. Top Microbiol. Immunol. 2011, 350, 127–147. [Google Scholar] [CrossRef]
- Zheng, S.G. Regulatory T cells vs Th17: Differentiation of Th17 versus Treg, are the mutually exclusive? Am. J. Clin. Exp. Immunol. 2013, 2, 94–106. [Google Scholar]
- Nicoletti, F.; Di Marco, R.; Patti, F.; Reggio, E.; Nicoletti, A.; Zaccone, P.; Stivala, F.; Meroni, P.L.; Reggio, A. Blood levels of transforming growth factor-beta 1 (TGF-beta1) are elevated in both relapsing remitting and chronic progressive multiple sclerosis (MS) patients and are further augmented by treatment with interferon-beta 1b (IFN-beta1b). Clin. Exp. Immunol. 1998, 113, 96–99. [Google Scholar] [CrossRef]
- Rollnik, J.D.; Sindern, E.; Schweppe, C.; Malin, J.P. Biologically active TGF-beta 1 is increased in cerebrospinal fluid while it is reduced in serum in multiple sclerosis patients. Acta Neurol. Scand. 1997, 96, 101–105. [Google Scholar] [CrossRef]
- Hamilton, J.A. GM-CSF in inflammation. J. Exp. Med. 2020, 217, 1–16. [Google Scholar] [CrossRef] [PubMed] [Green Version]
- Avci, A.B.; Feist, E.; Burmester, G.R. Targeting GM-CSF in rheumatoid arthritis. Clin. Exp. Rheumatol. 2016, 34 (4 Suppl. 98), 39–44. [Google Scholar]
- Schottelius, A. The role of GM-CSF in multiple sclerosis. Drug Res. (Stuttg) 2013, 63 (Suppl. 1). [Google Scholar] [CrossRef] [PubMed] [Green Version]
- Behrens, F.; Ostergaard, M.; Stoilov, R.; Wiland, P.; Huizinga, T.W.; Berenfus, V.Y.; Tak, P.P.; Vladeva, S.; Rech, J.; Rubbert-Roth, A.; et al. First in Patient Study of Anti-GM-CSF Monoclonal Antibody (MOR103) in Active Rheumatoid Arthritis: Results of a Phase 1b/2a Randomized, Double-Blind, Placebo-Controlled Trial. Arthritis Rheum. 2012, 64, 4171–4172. [Google Scholar]
- Constantinescu, C.S.; Asher, A.; Fryze, W.; Kozubski, W.; Wagner, F.; Aram, J.; Tanasescu, R.; Korolkiewicz, R.P.; Dirnberger-Hertweck, M.; Steidl, S.; et al. Randomized phase 1b trial of MOR103, a human antibody to GM-CSF, in multiple sclerosis. Neurol Neuroimmunol. Neuroinflamm. 2015, 2, e117. [Google Scholar] [CrossRef] [Green Version]
- Behrens, F.; Tak, P.P.; Ostergaard, M.; Stoilov, R.; Wiland, P.; Huizinga, T.W.; Berenfus, V.Y.; Vladeva, S.; Rech, J.; Rubbert-Roth, A.; et al. MOR103, a human monoclonal antibody to granulocyte-macrophage colony-stimulating factor, in the treatment of patients with moderate rheumatoid arthritis: Results of a phase Ib/IIa randomised, double-blind, placebo-controlled, dose-escalation trial. Ann. Rheum Dis. 2015, 74, 1058–1064. [Google Scholar] [CrossRef] [Green Version]


© 2020 by the authors. Licensee MDPI, Basel, Switzerland. This article is an open access article distributed under the terms and conditions of the Creative Commons Attribution (CC BY) license (http://creativecommons.org/licenses/by/4.0/).
Share and Cite
Aram, J.; Frakich, N.; Morandi, E.; Alrouji, M.; Samaraweera, A.; Onion, D.; Spendlove, I.; Colombo, S.L.; Tanasescu, R.; Gran, B.; et al. Increased IL-2 and Reduced TGF-β Upon T-Cell Stimulation are Associated with GM-CSF Upregulation in Multiple Immune Cell Types in Multiple Sclerosis. Biomedicines 2020, 8, 226. https://0-doi-org.brum.beds.ac.uk/10.3390/biomedicines8070226
Aram J, Frakich N, Morandi E, Alrouji M, Samaraweera A, Onion D, Spendlove I, Colombo SL, Tanasescu R, Gran B, et al. Increased IL-2 and Reduced TGF-β Upon T-Cell Stimulation are Associated with GM-CSF Upregulation in Multiple Immune Cell Types in Multiple Sclerosis. Biomedicines. 2020; 8(7):226. https://0-doi-org.brum.beds.ac.uk/10.3390/biomedicines8070226
Chicago/Turabian StyleAram, Jehan, Nanci Frakich, Elena Morandi, Mohammed Alrouji, Amal Samaraweera, David Onion, Ian Spendlove, Sergio L. Colombo, Radu Tanasescu, Bruno Gran, and et al. 2020. "Increased IL-2 and Reduced TGF-β Upon T-Cell Stimulation are Associated with GM-CSF Upregulation in Multiple Immune Cell Types in Multiple Sclerosis" Biomedicines 8, no. 7: 226. https://0-doi-org.brum.beds.ac.uk/10.3390/biomedicines8070226