
Potential Mucosal Irritation Discrimination of Surface Disinfectants Employed against SARS-CoV-2 by Limacus flavus Slug Mucosal Irritation Assay

 , , , and
Abstract
:1. Introduction
- Alcohols, cross-linking, coagulation, and clumping, acting mainly as an aqueous emulsion on membrane proteins;
- Chlorine compounds, oxidation of proteins, carbohydrates, and lipids even at low concentrations;
- Hydrogen peroxide, oxidation of cell membrane components through the formation of peroxide radicals;
- Phenols, cross-linking, coagulating, clumping destroying the cell wall, and blocking of enzymatic activity;
- Iodine-based substances interfere at the level of the respiratory chain by blocking the transport of electrons, thus decreasing the oxygen supply of aerobic microorganisms;
- QACs act as ionic compounds that irreversibly bind membrane phospholipids, altering their permeability [13].
2. Materials and Methods
2.1. Chemicals
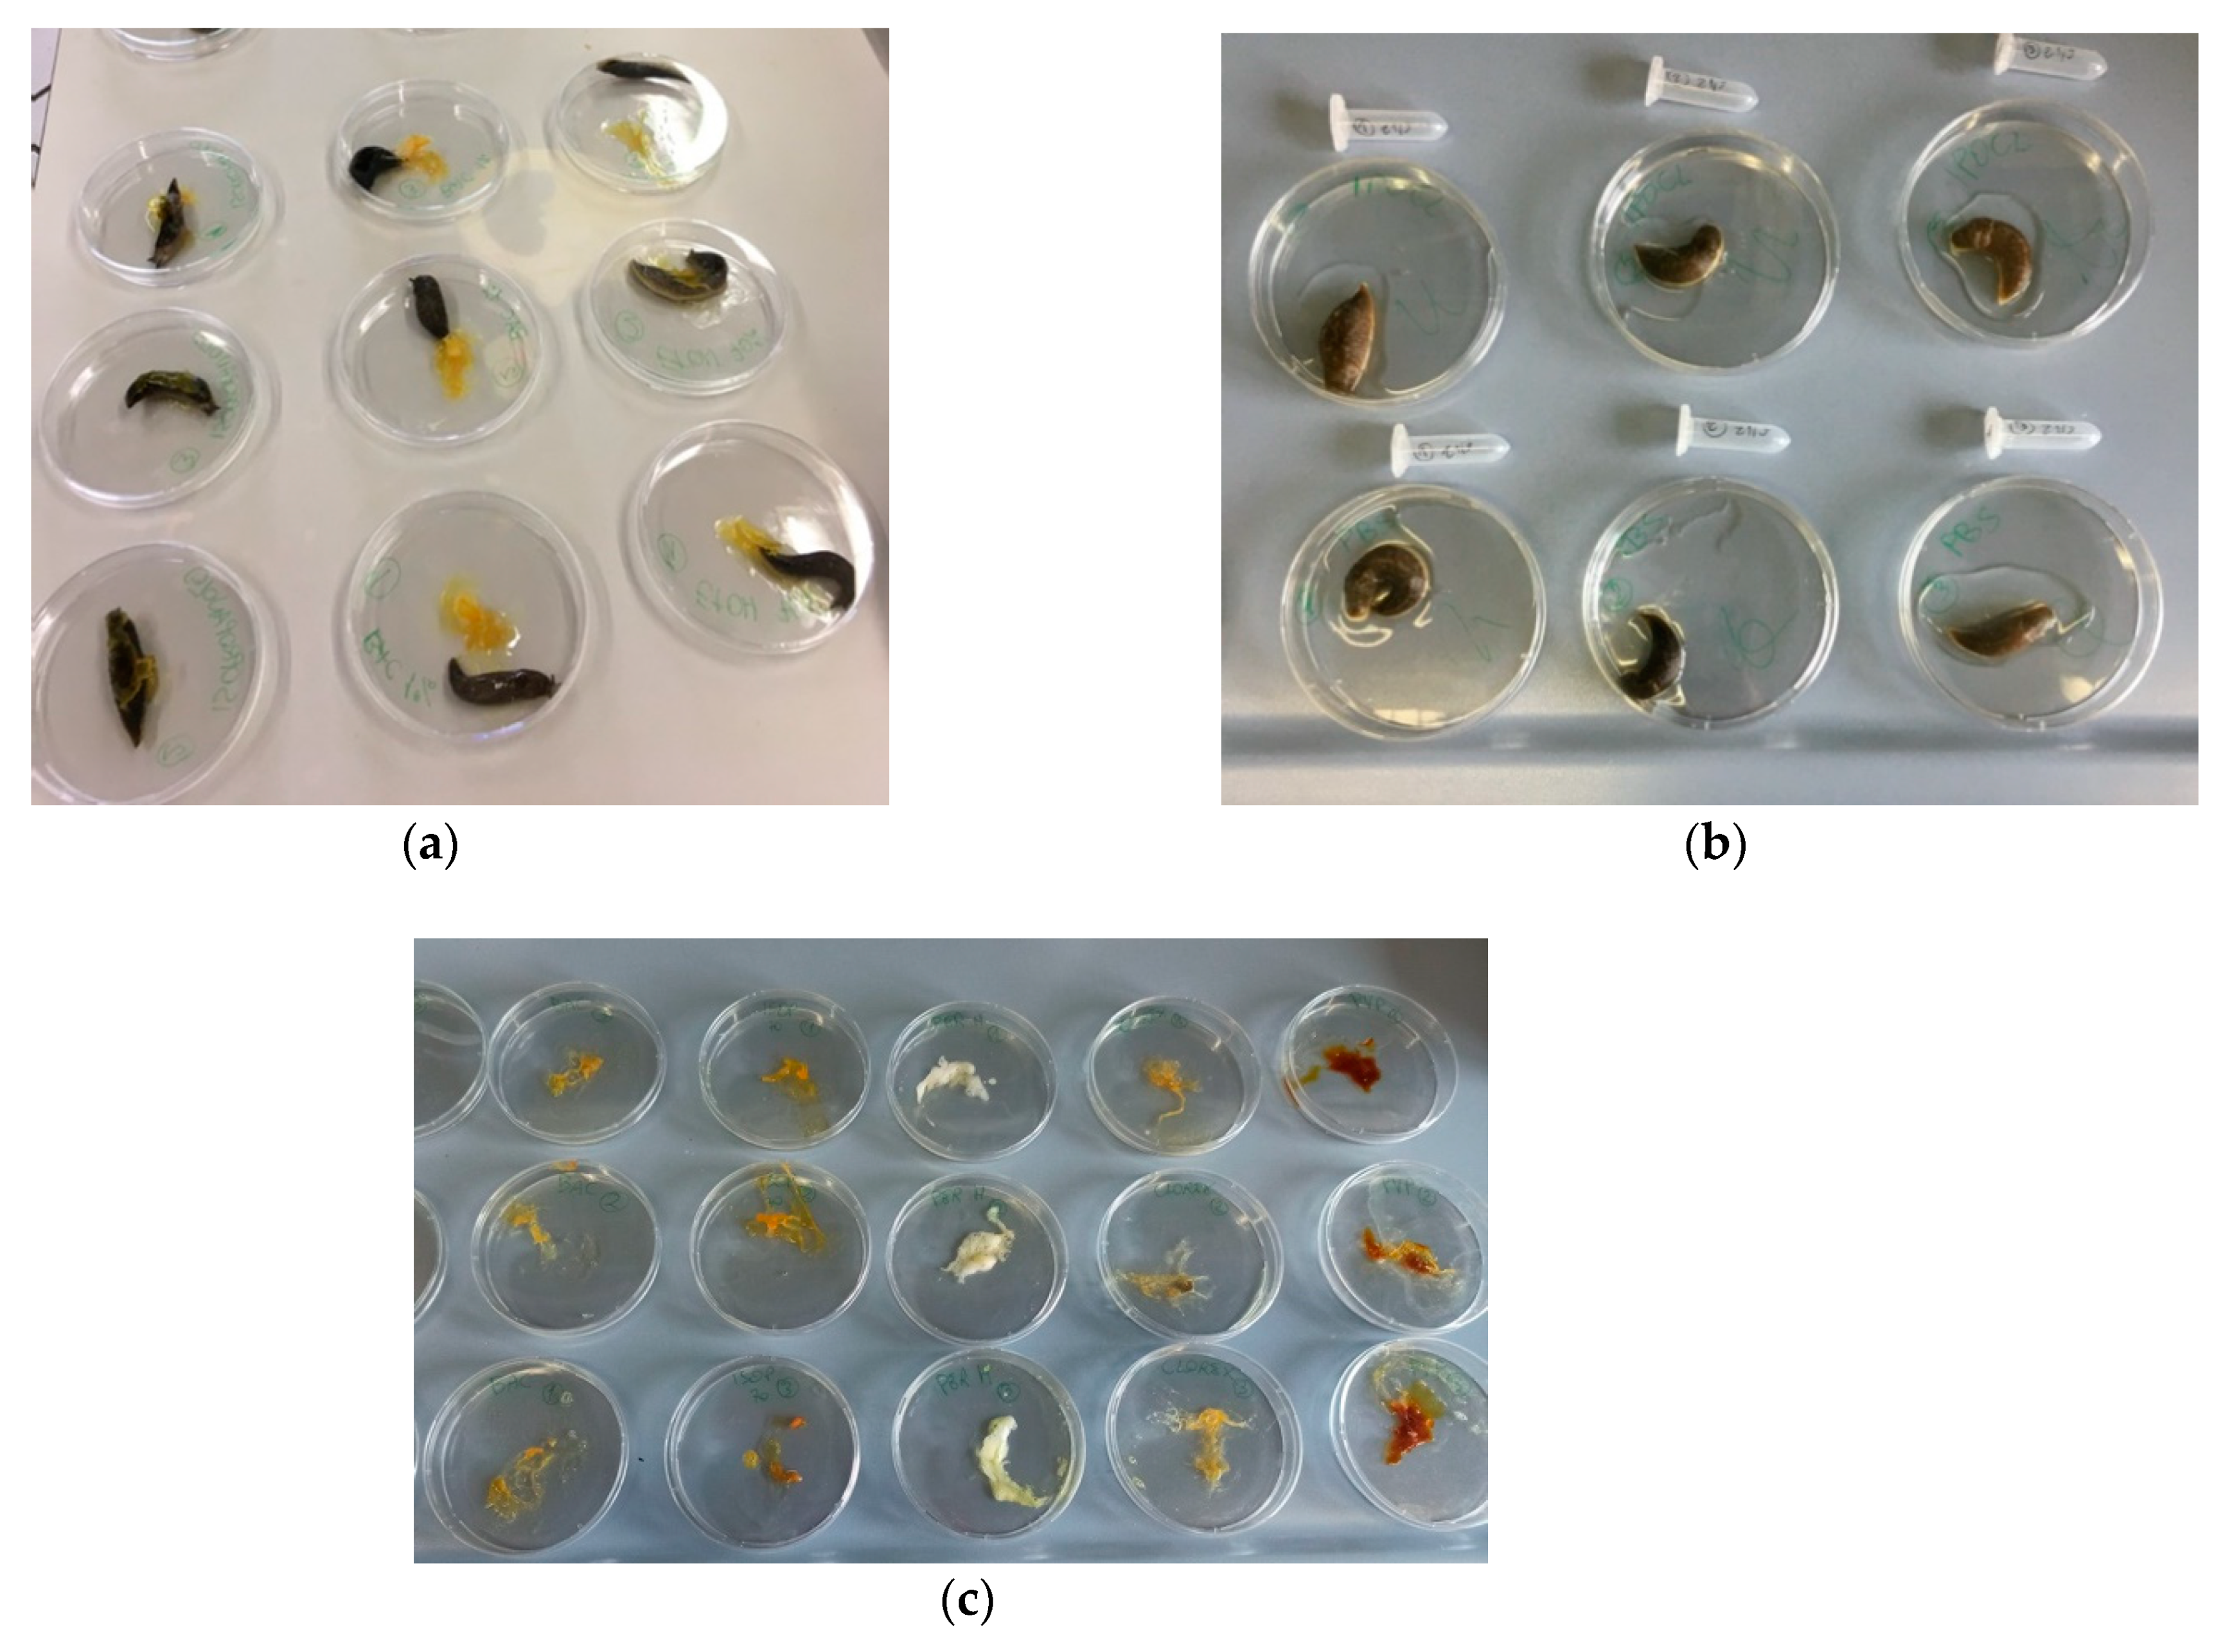
2.2. Collection, Housing, and Identification of Limacus flavus Specimens
2.3. SMI Assay
2.4. Mucus Analysis
2.4.1. Protein Quantification
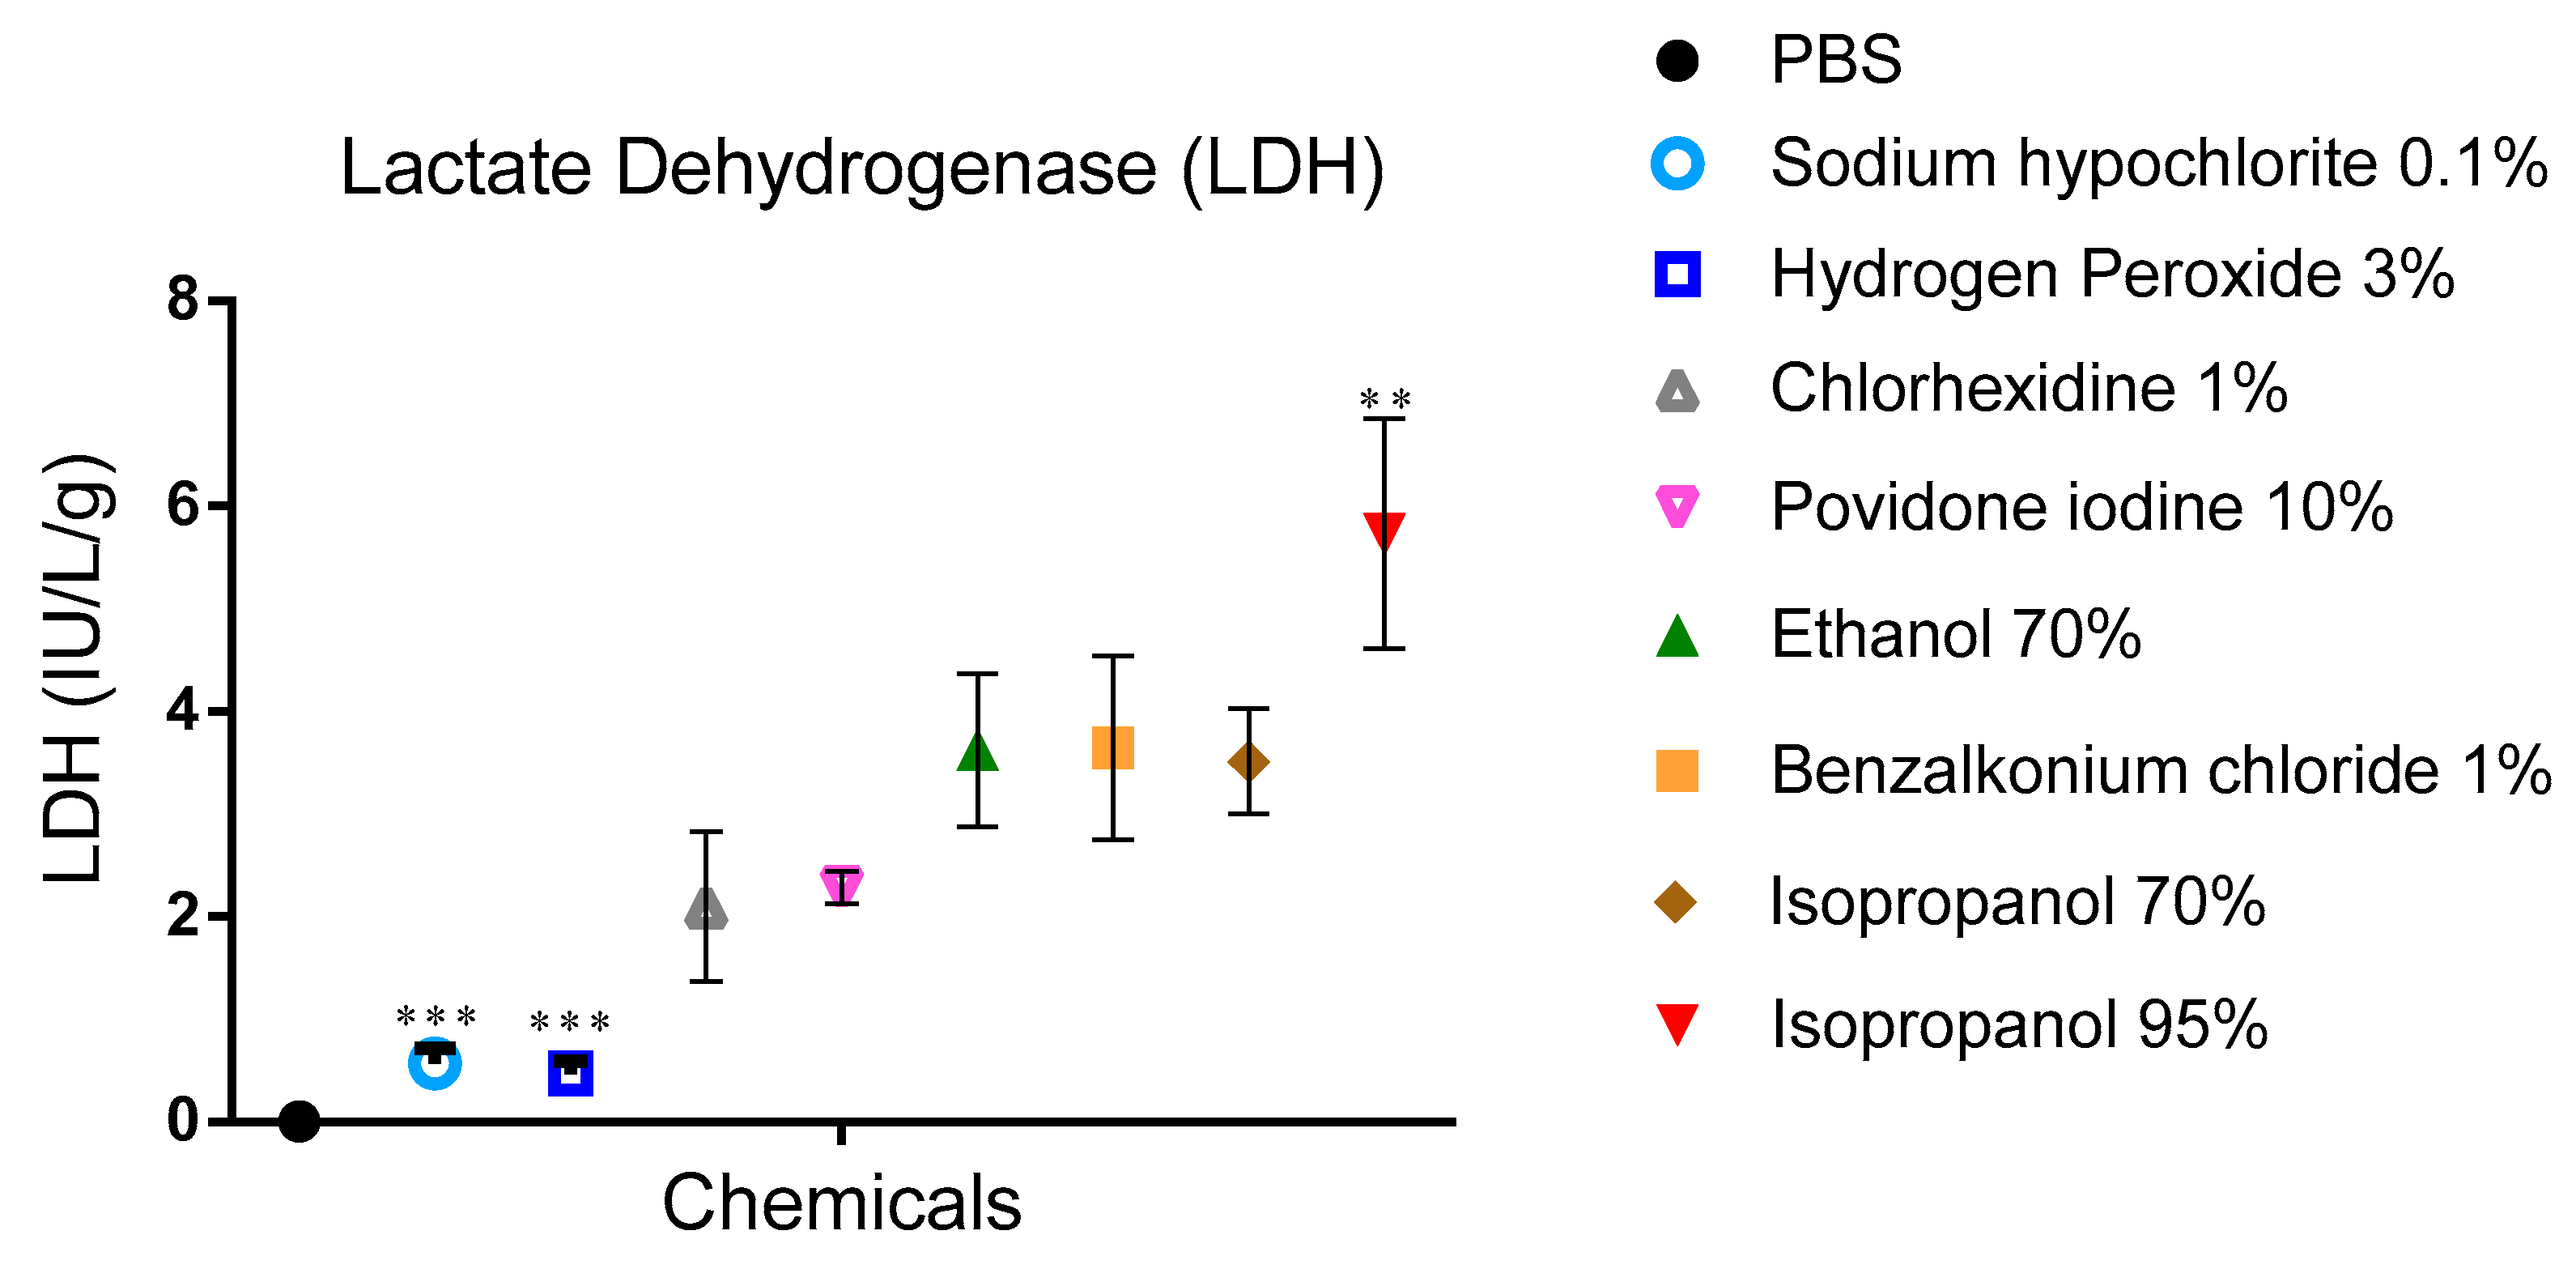
2.4.2. LDH
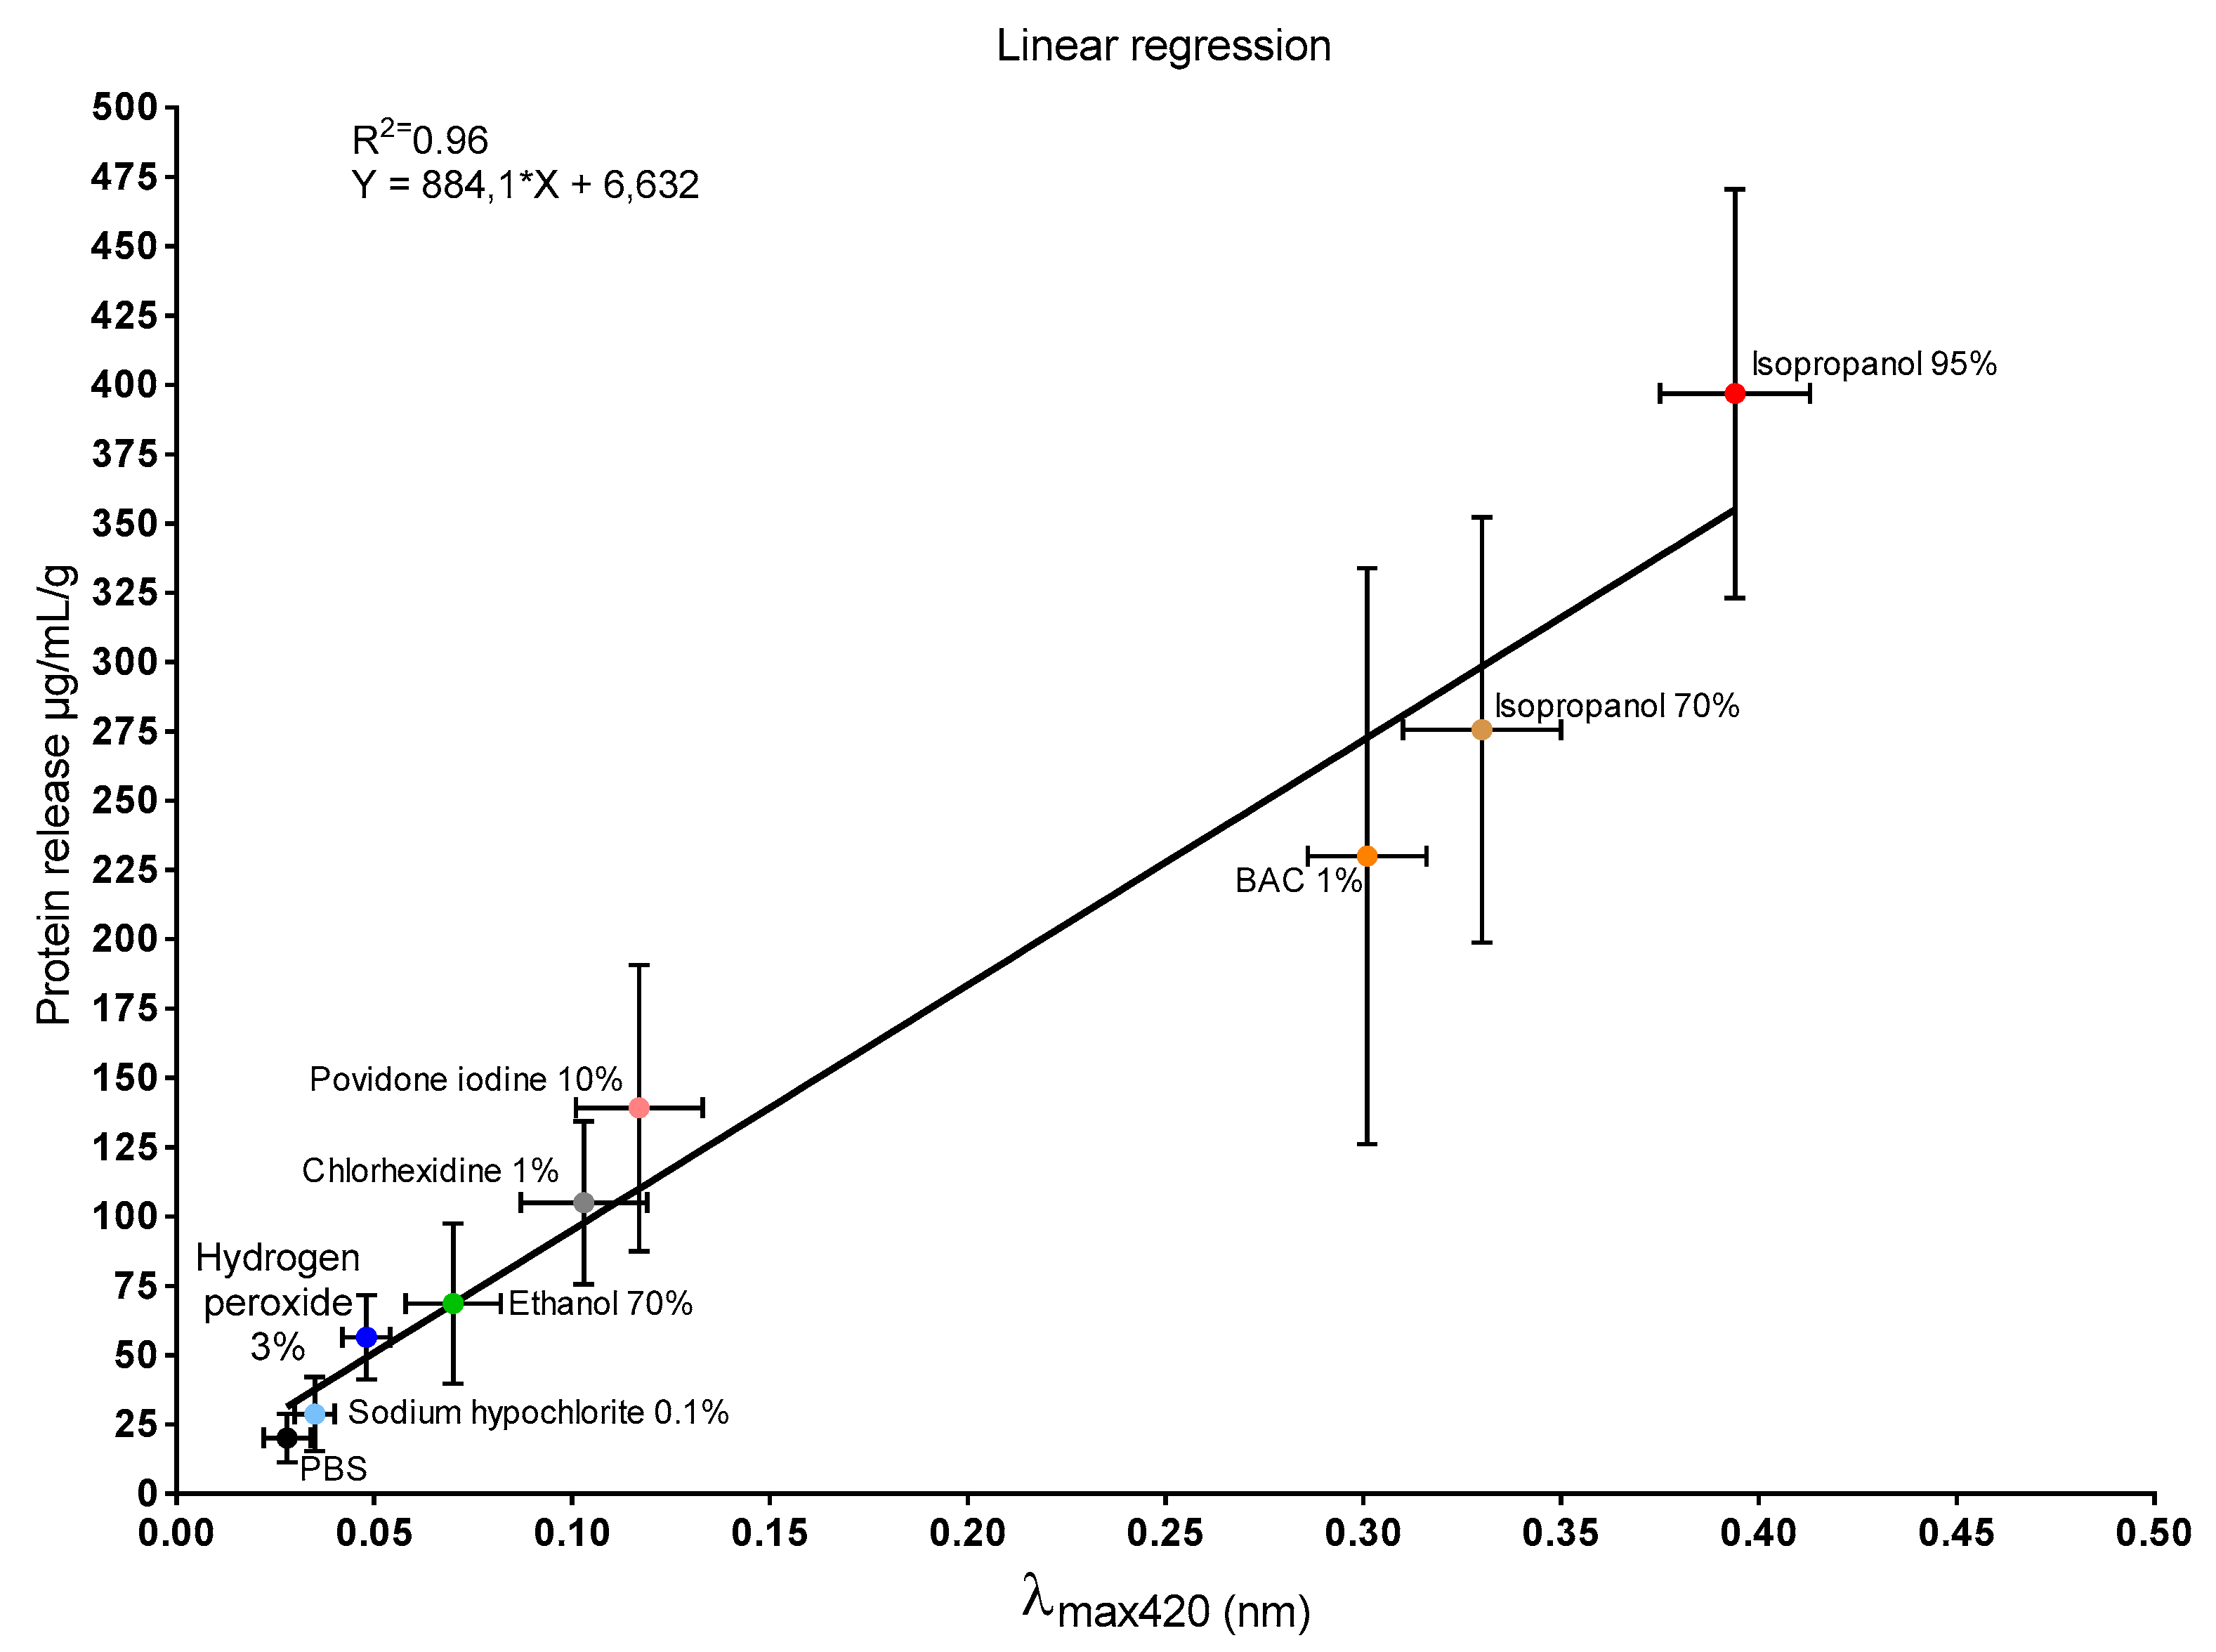
2.4.3. UV–Visible Spectra
2.5. Statistical Analysis
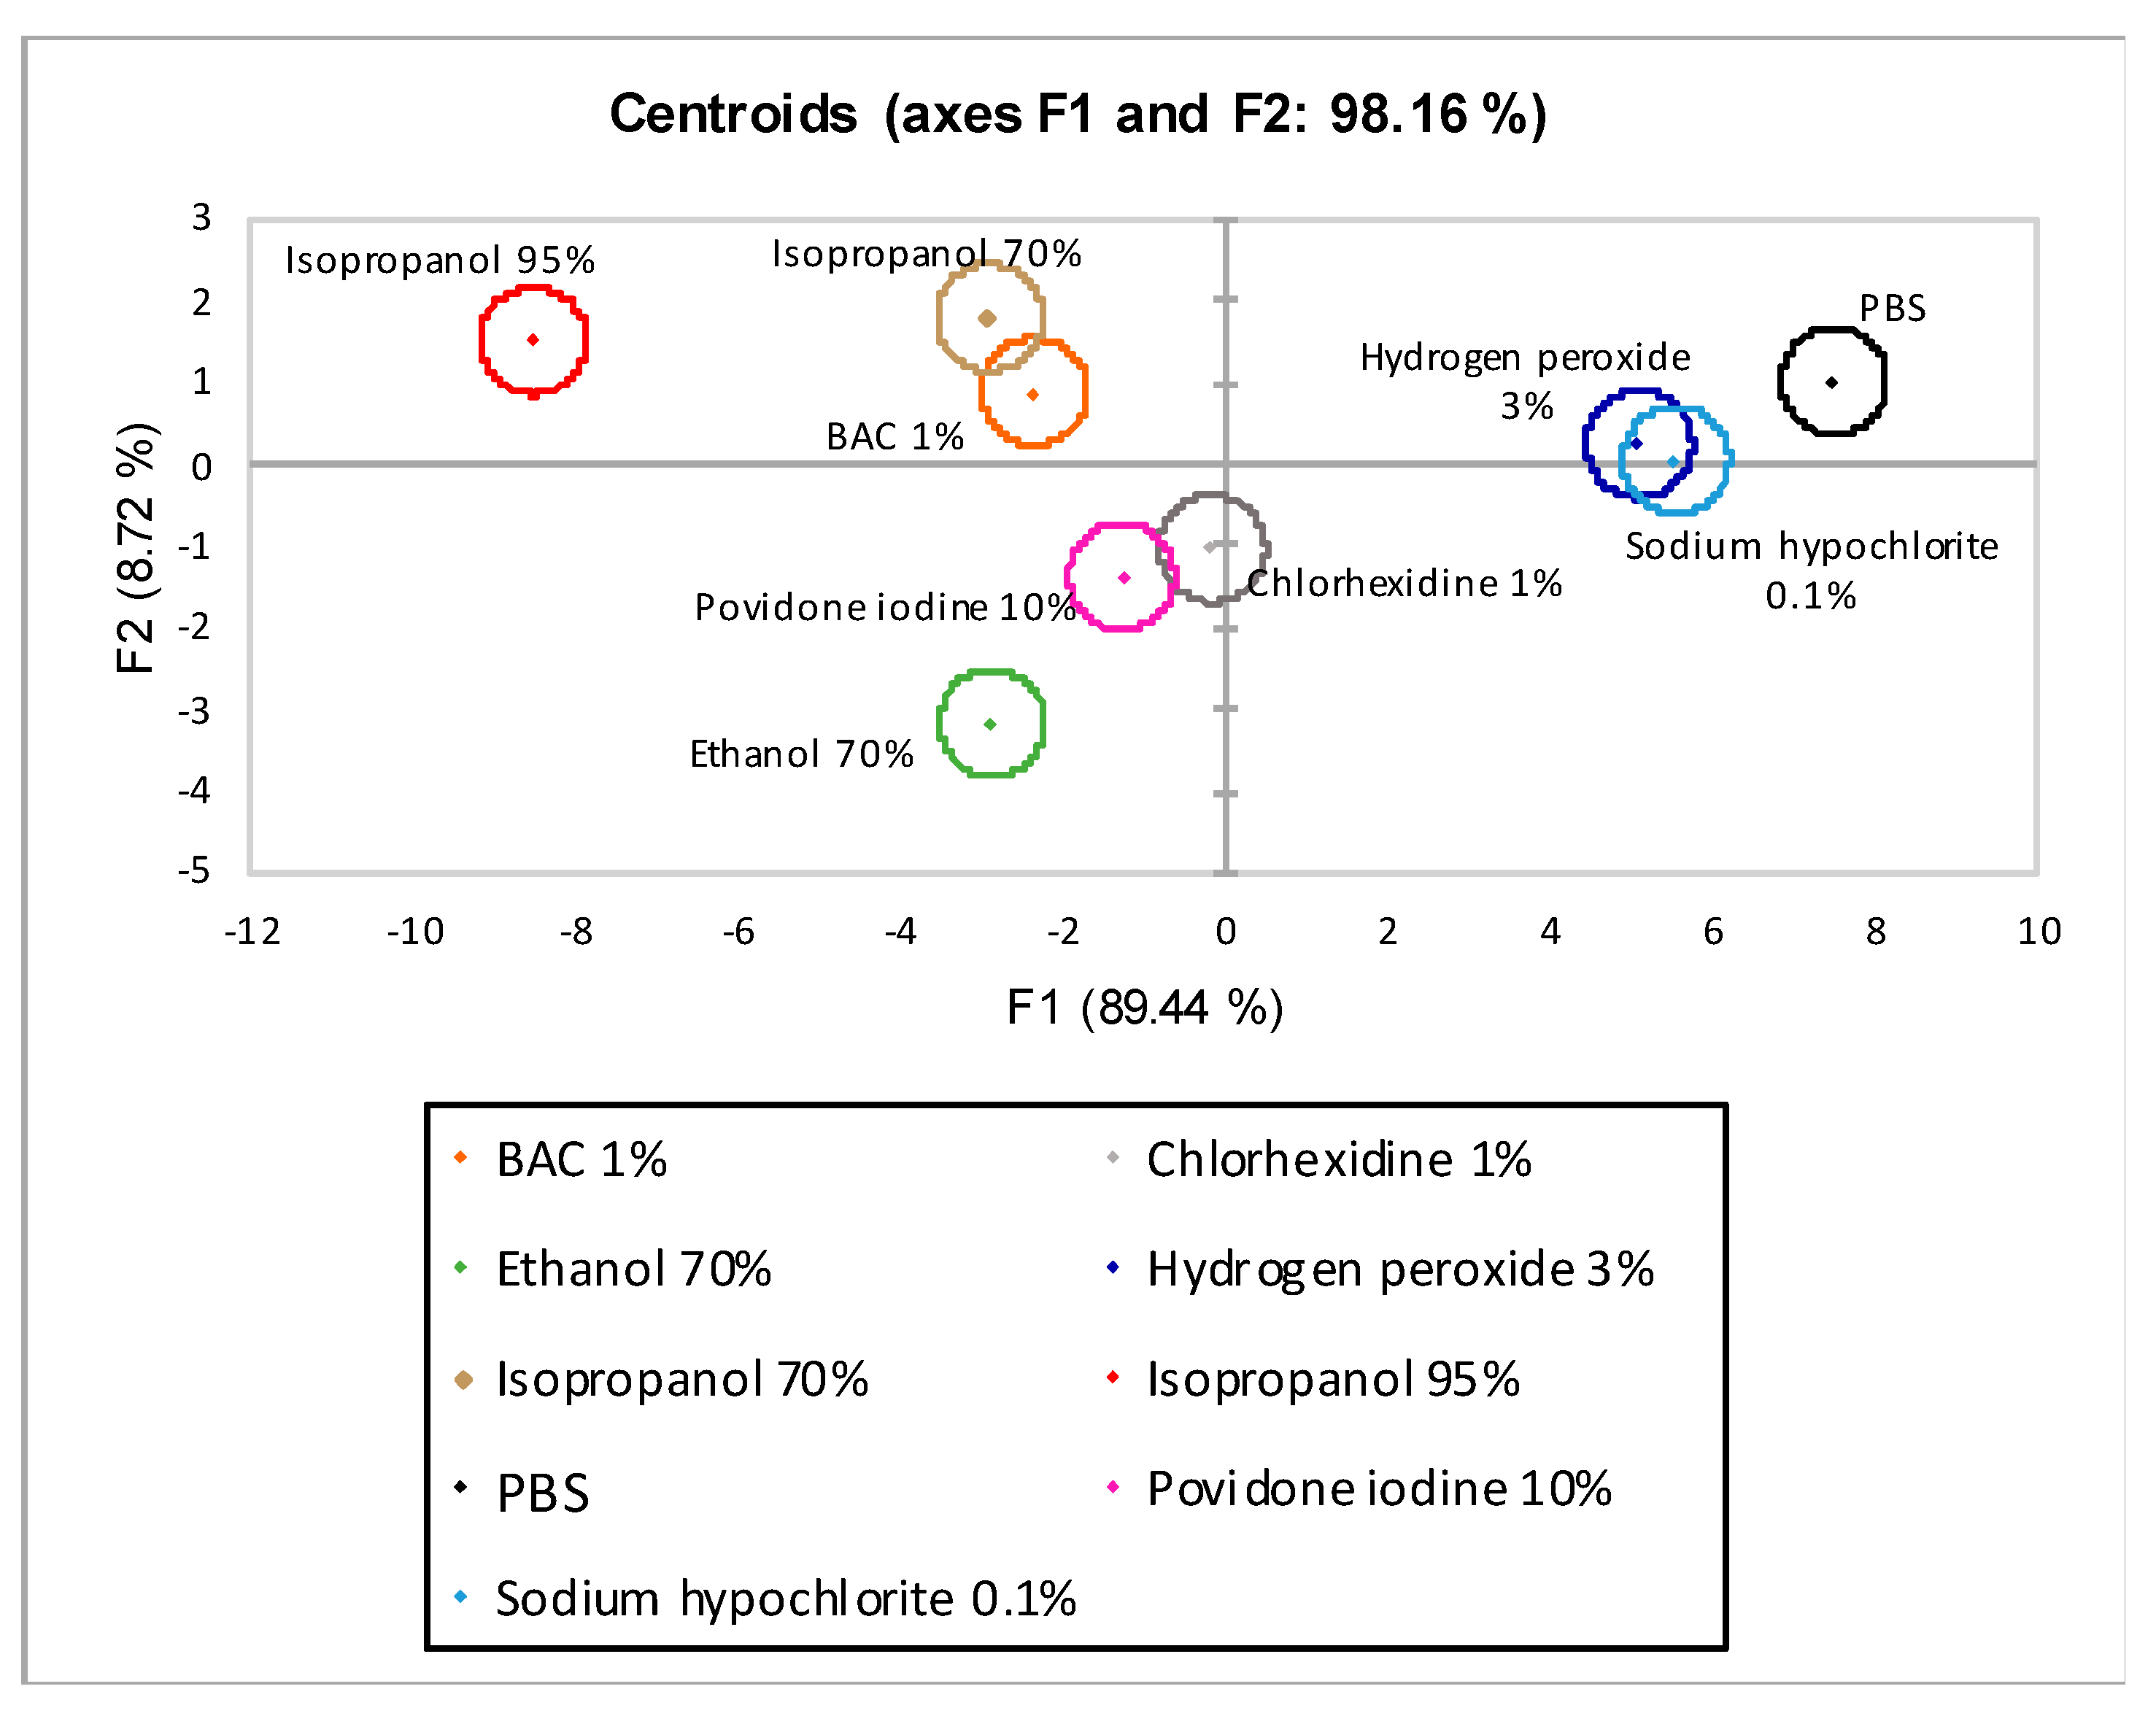
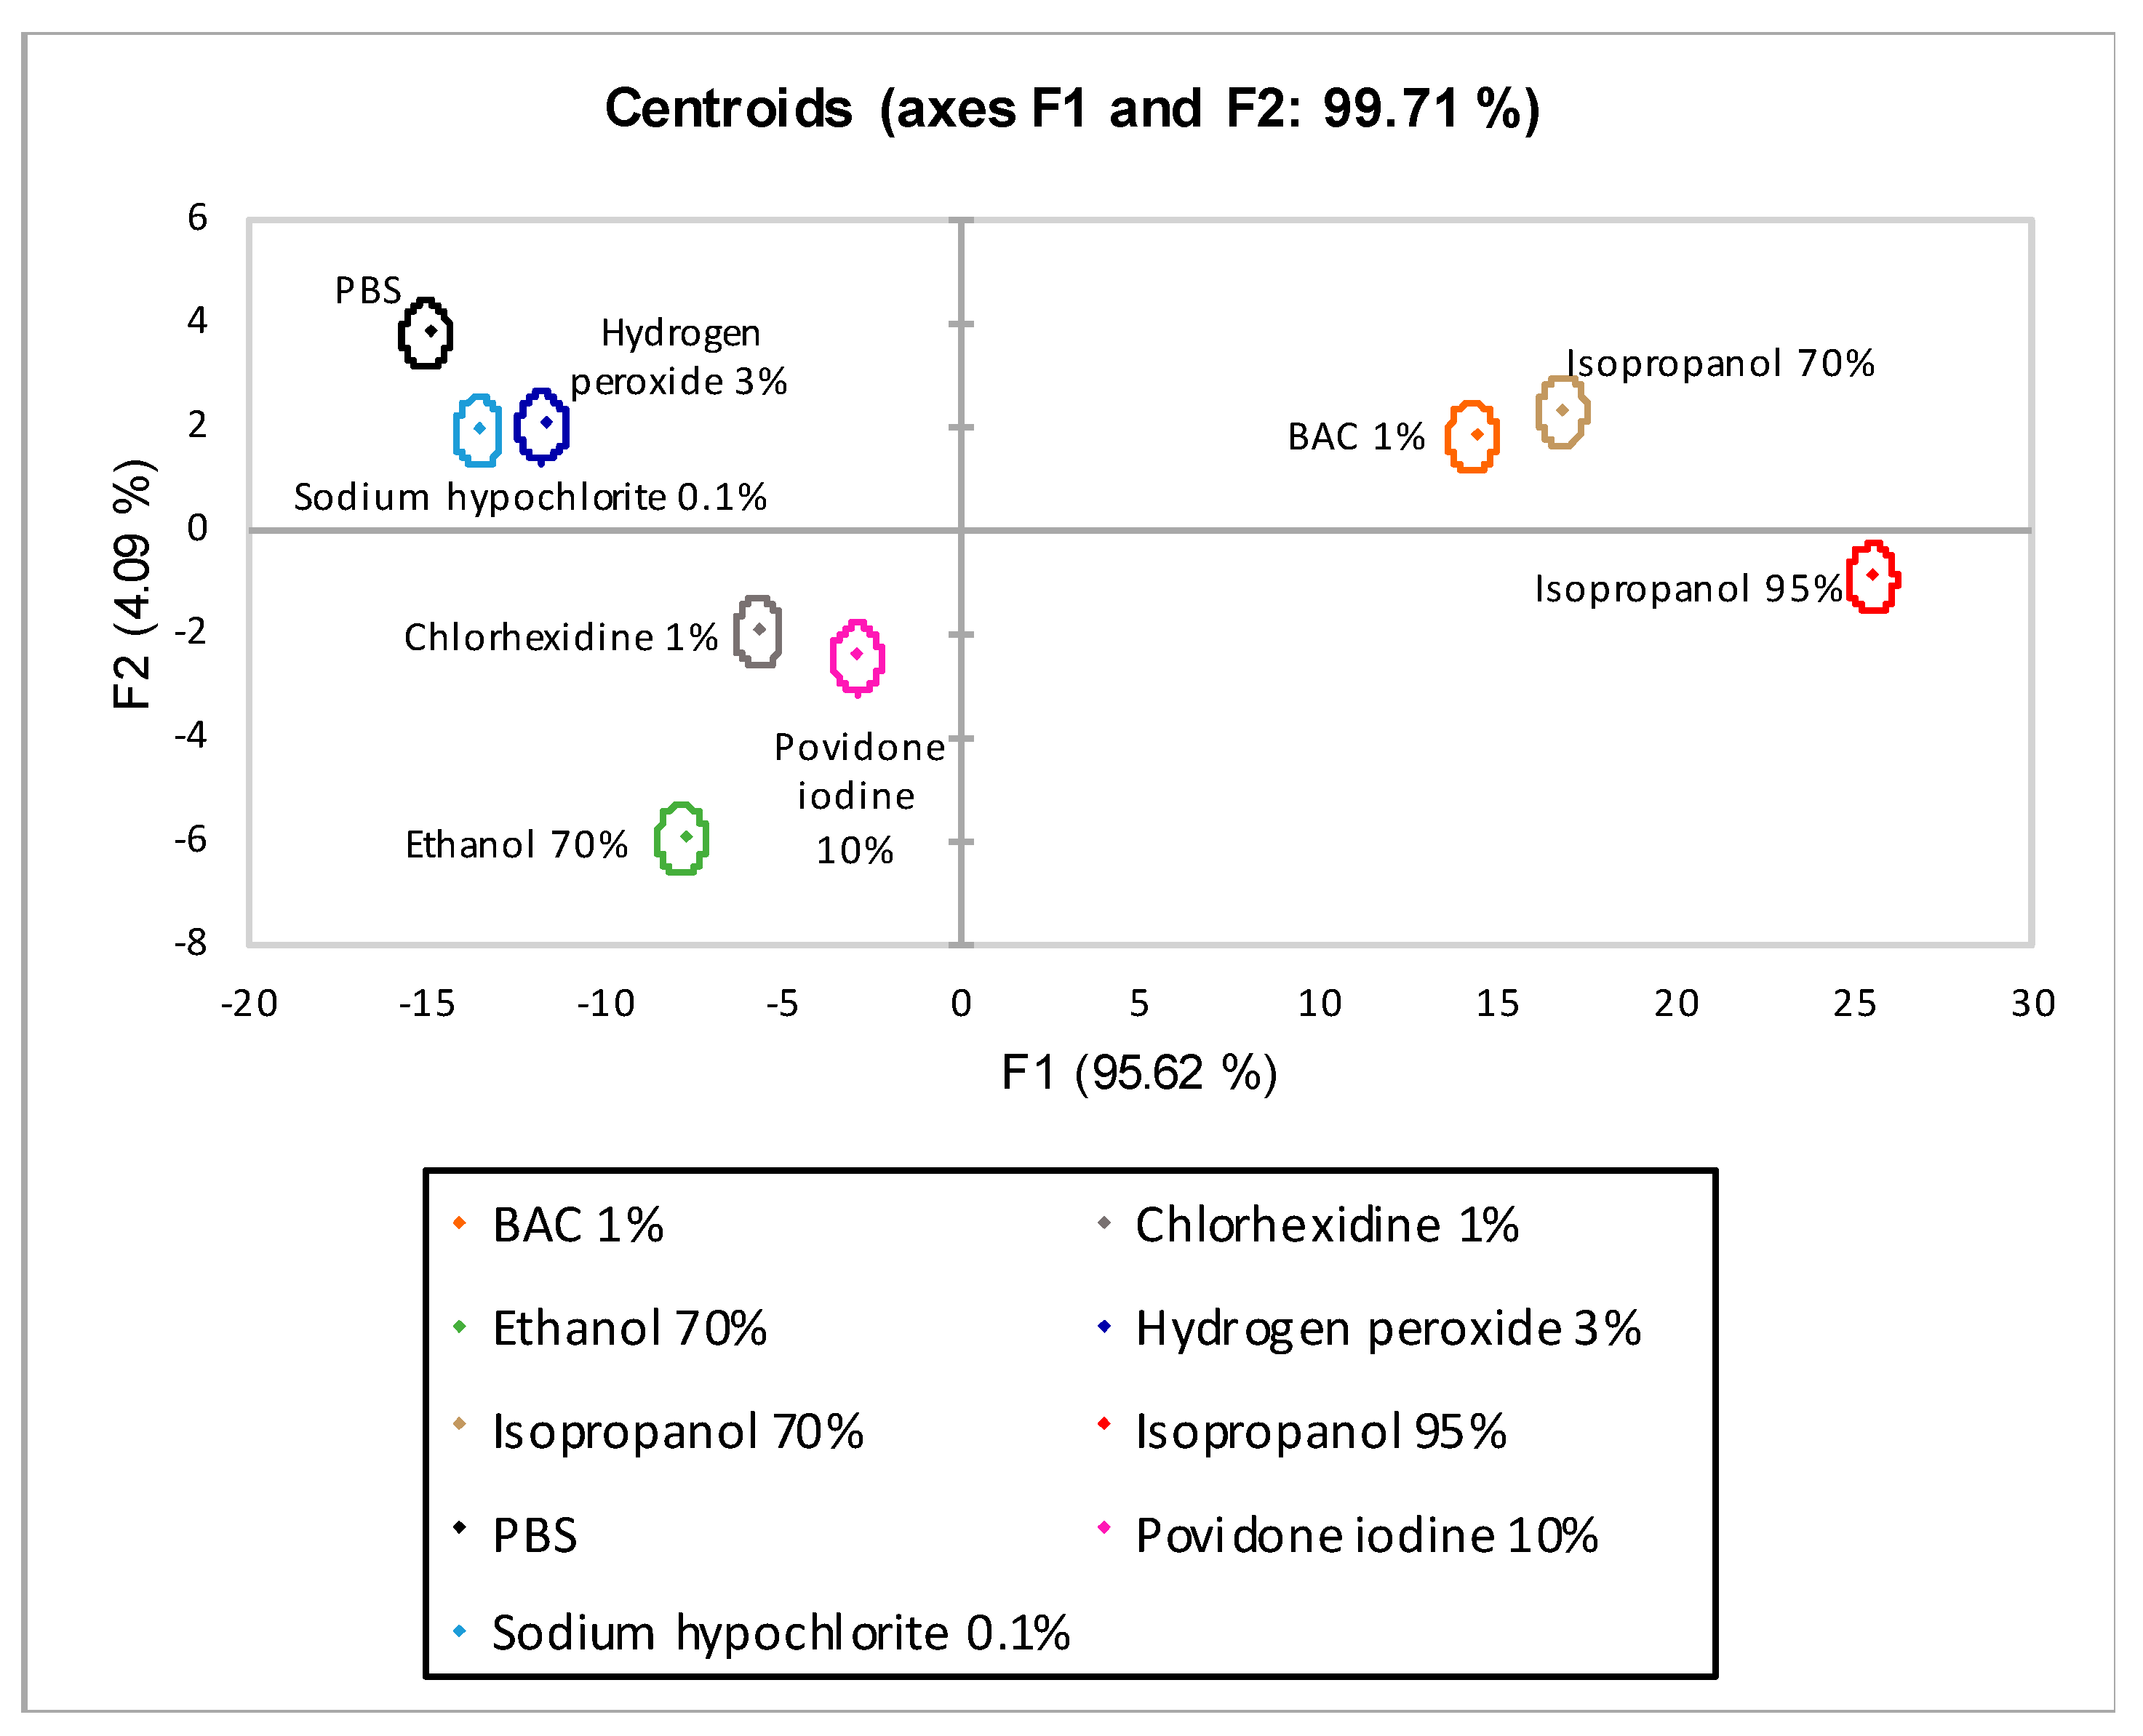
Linear Discriminant Analysis
3. Results
3.1. SMI Assay
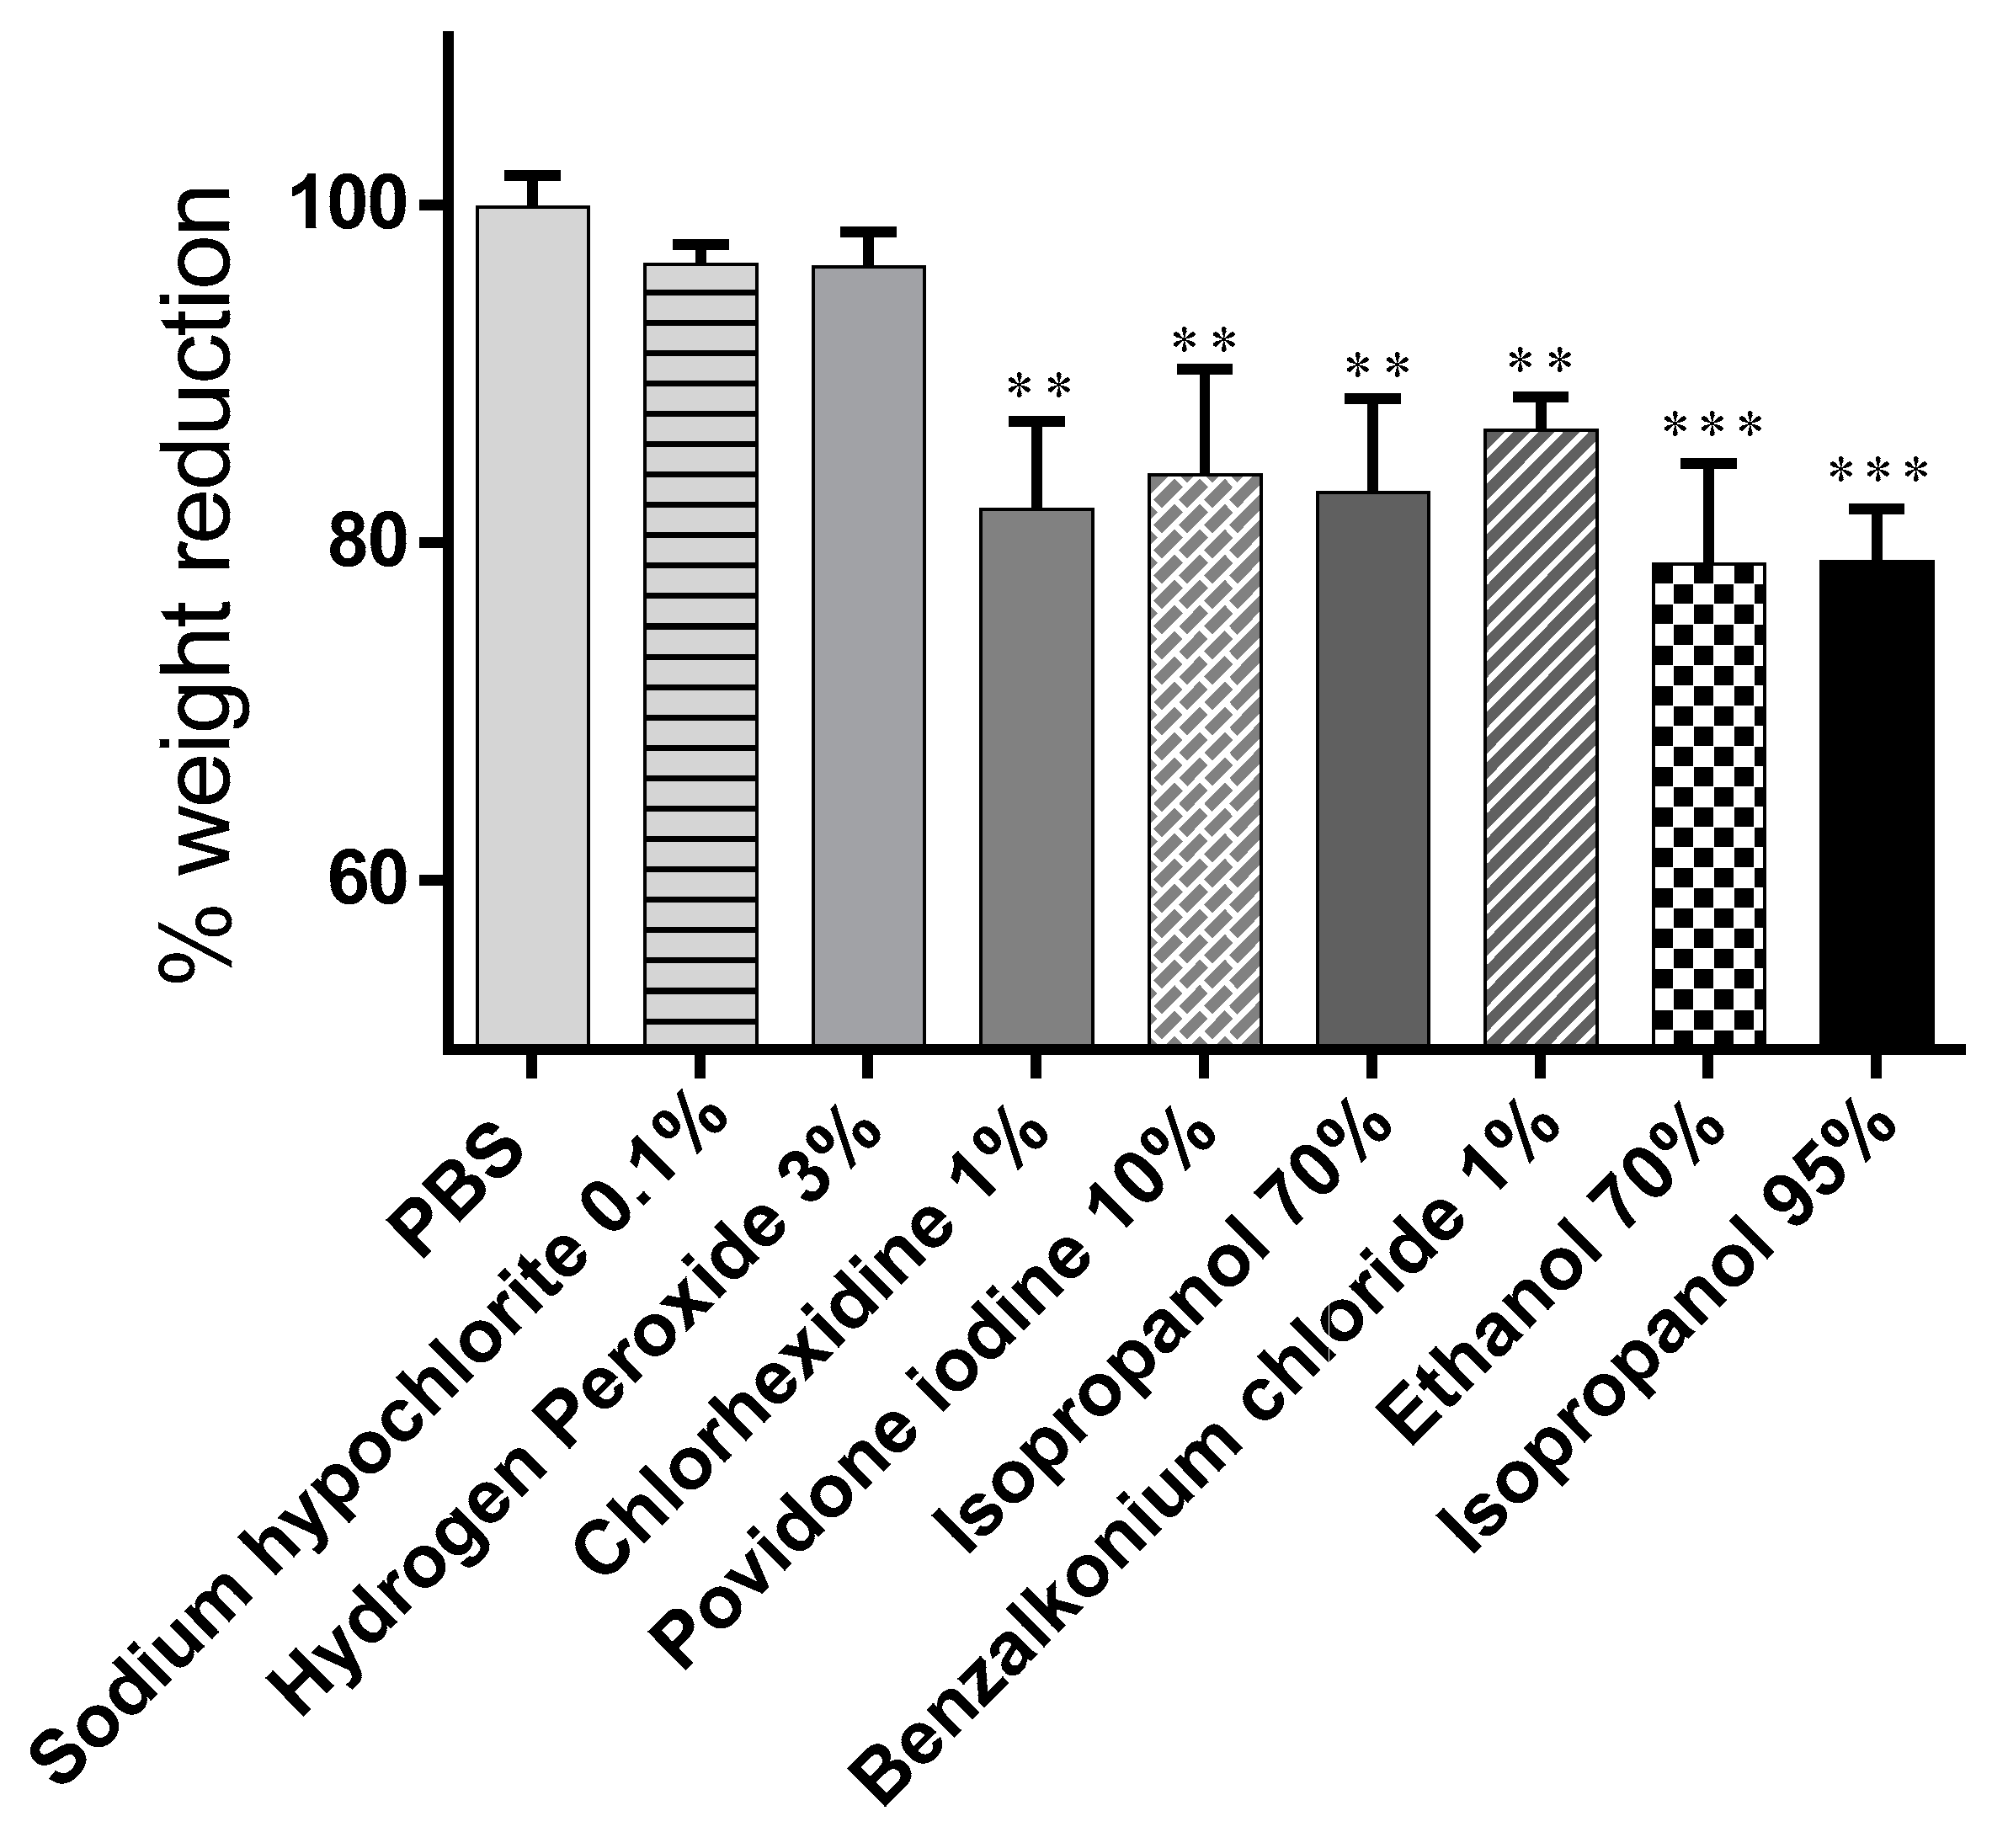
3.1.1. Bodyweight Variation
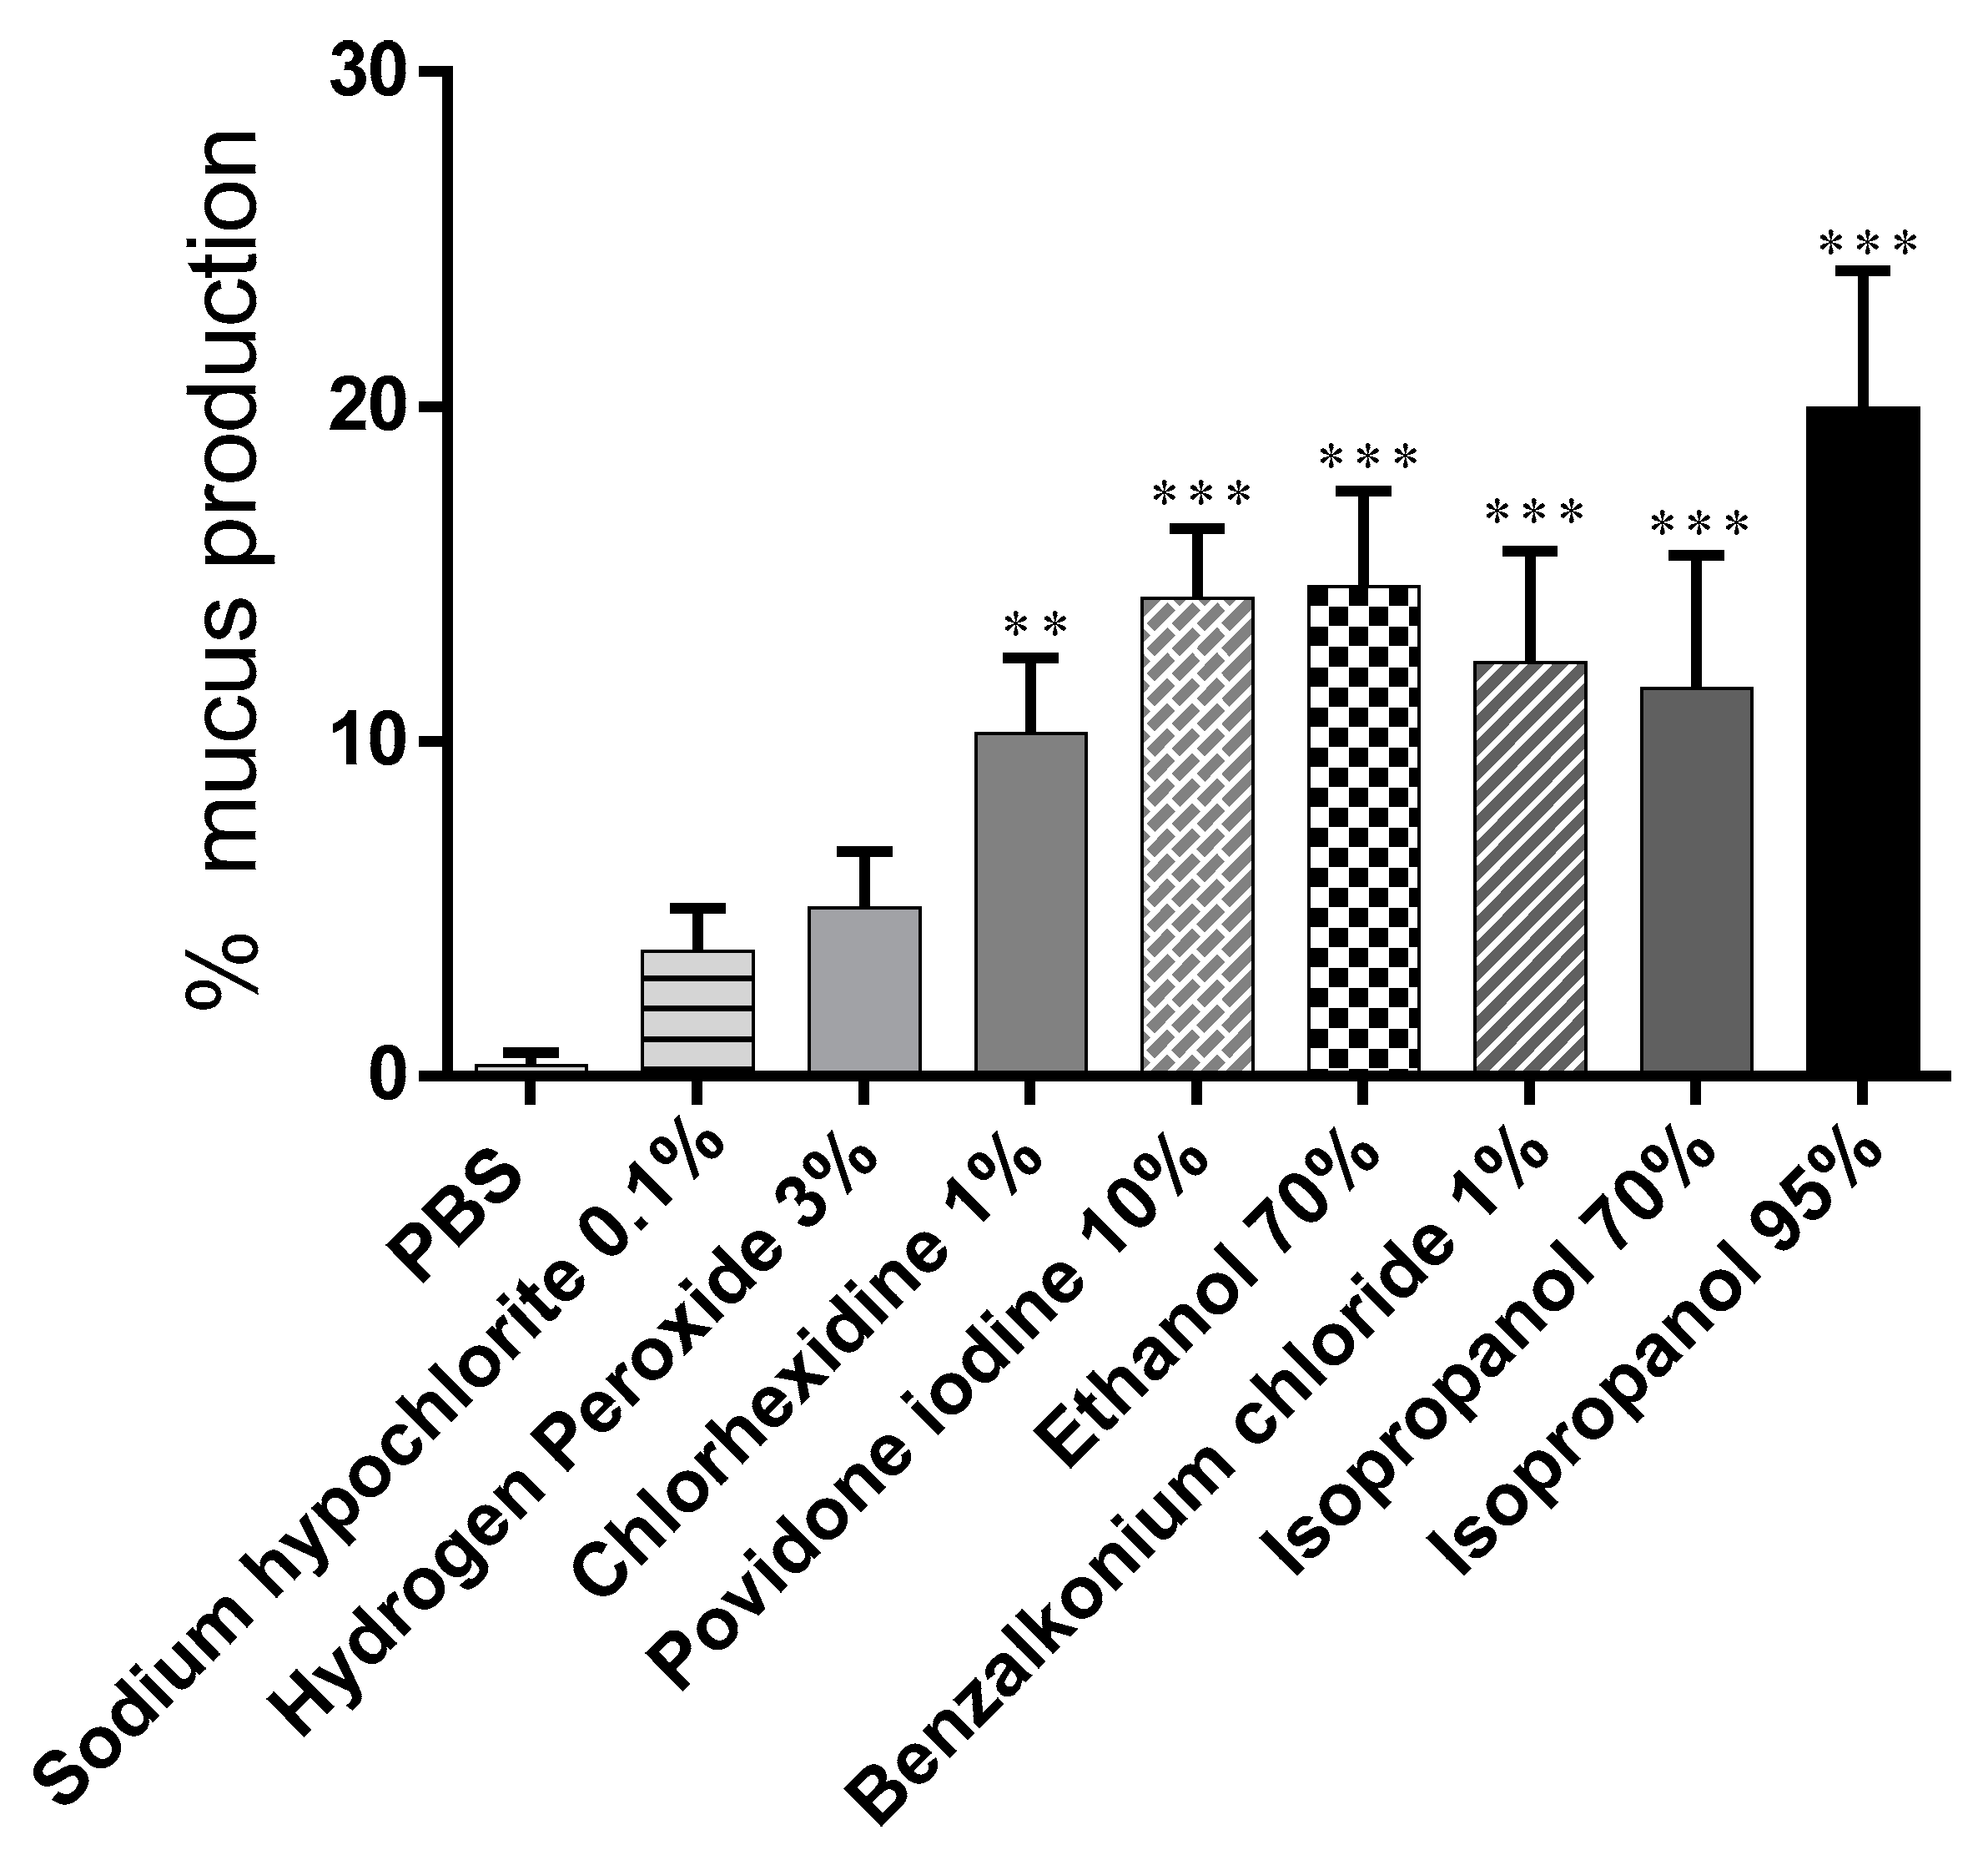
3.1.2. Mucus Production
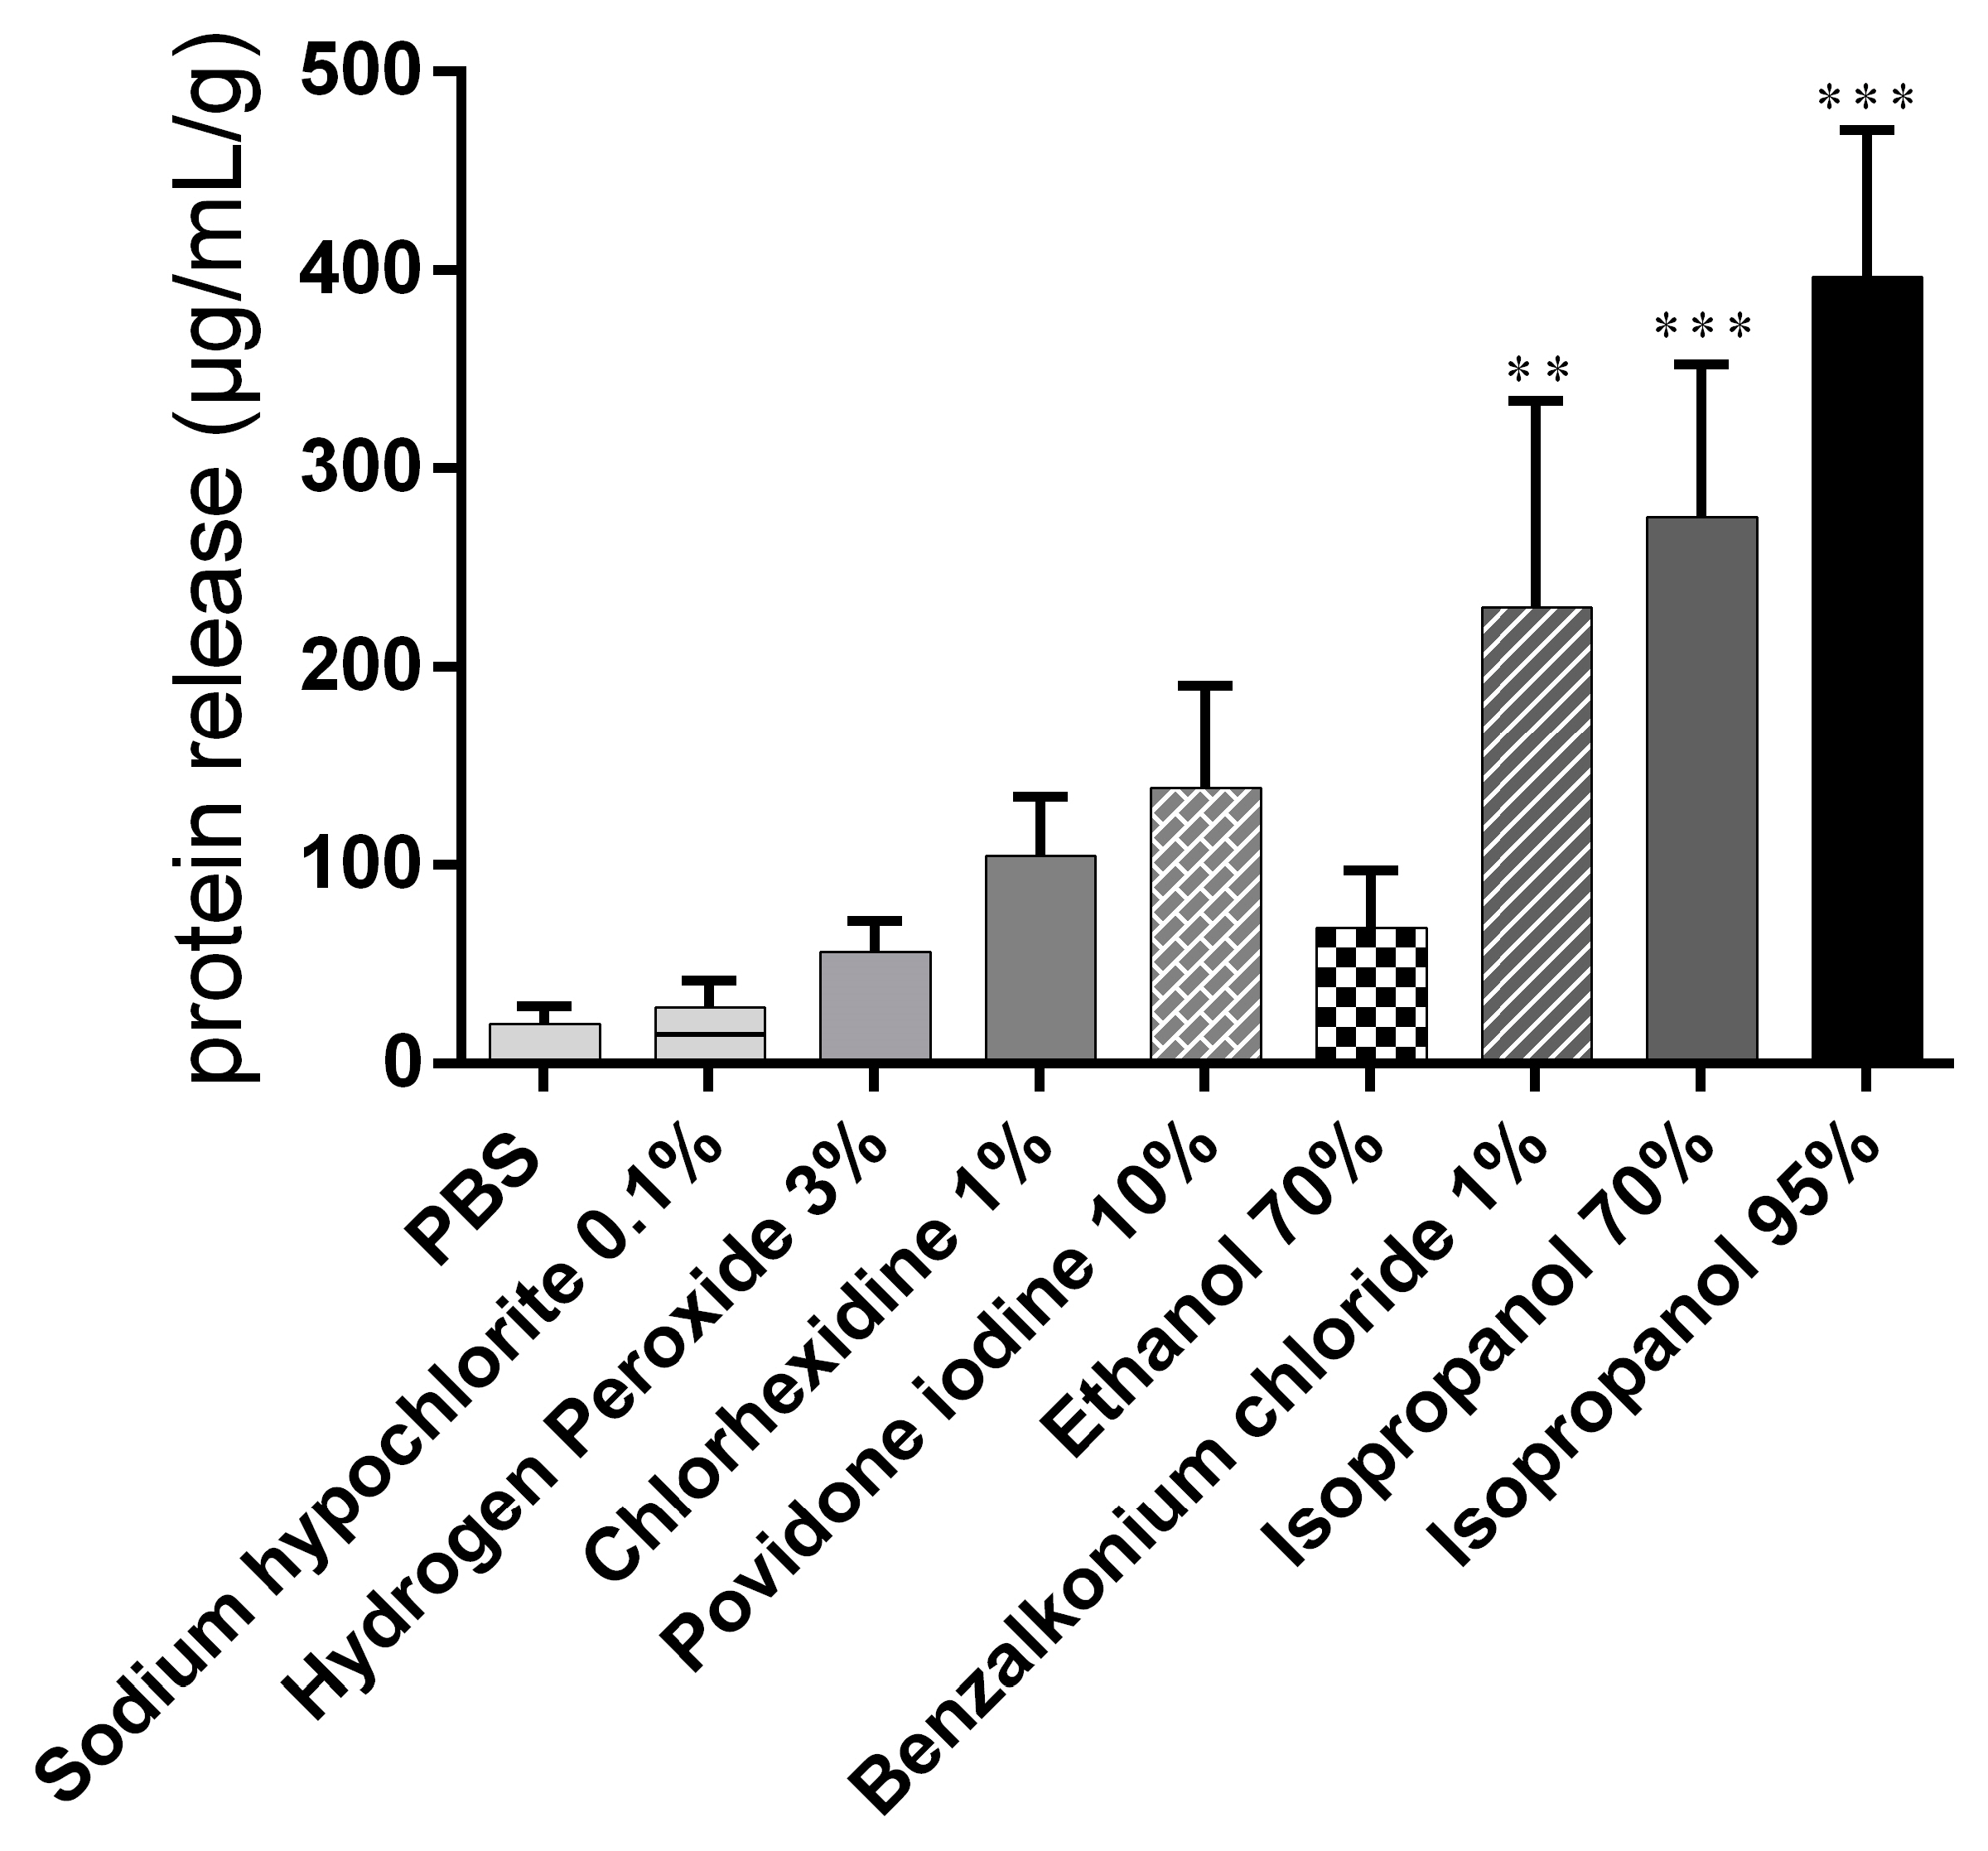
3.1.3. Protein Quantification
3.1.4. LDH
3.1.5. UV–VIS Spectra
3.2. Linear Discriminant Analysis
4. Discussion
5. Conclusions
Author Contributions
Funding
Institutional Review Board Statement
Informed Consent Statement
Data Availability Statement
Conflicts of Interest
References
- Drexler, M. What You Need to Know about Infectious Disease; National Academies Press (US): Washington, DC, USA, 2014. [Google Scholar]
- Lai, X.; Wang, X.; Yang, Q.; Xu, X.; Tang, Y.; Liu, C.; Tan, L.; Lai, R.; Wang, H.; Zhang, X. Will healthcare workers improve infection prevention and control behaviors as COVID-19 risk emerges and increases, in China? Antimicrob. Resist. Infect. Control 2020, 9, 1–9. [Google Scholar] [CrossRef] [PubMed]
- Kim, S.W.; Kang, S.I.; Shin, D.H.; Oh, S.Y.; Lee, C.W.; Yang, Y.; Son, Y.K.; Yang, H.-S.; Lee, B.-H.; An, H.-J. Potential of Cell-Free Supernatant from Lactobacillus plantarum NIBR97, Including Novel Bacteriocins, as a Natural Alternative to Chemical Disinfectants. Pharmaceuticals 2020, 13, 266. [Google Scholar] [CrossRef] [PubMed]
- WHO. Coronavirus (COVID-19) Dashboard. 2021. Available online: https://covid19.who.int/ (accessed on 22 March 2021).
- Malik, Y.A. Properties of coronavirus and SARS-CoV-2. Malays. J. Pathol. 2020, 42, 3–11. [Google Scholar] [PubMed]
- Petronio, G.P.; di Marco, R.; Costagliola, C. Do Ocular fluids represent a transmission route of SARS-CoV-2 infection? Front. Med. 2020, 7, 1–4. [Google Scholar]
- Carraturo, F.; del Giudice, C.; Morelli, M.; Cerullo, V.; Libralato, G.; Galdiero, E.; Guida, M. Persistence of SARS-CoV-2 in the environment and COVID-19 transmission risk from environmental matrices and surfaces. Environ. Pollut. 2020, 115010. [Google Scholar] [CrossRef]
- García-Ávila, F.; Valdiviezo-Gonzales, L.; Cadme-Galabay, M.; Gutiérrez-Ortega, H.; Altamirano-Cárdenas, L.; Zhindón-Arévalo, C.; del Pino, L.F. Considerations on water quality and the use of chlorine in times of SARS-CoV-2 (COVID-19) pandemic in the community. Case Stud. Chem. Environ. Eng. 2020, 100049. [Google Scholar] [CrossRef]
- Hussain, S.; Cheema, M.J.M.; Motahhir, S.; Iqbal, M.M.; Arshad, A.; Waqas, M.S.; Usman Khalid, M.; Malik, S. Proposed Design of Walk-Through Gate (WTG): Mitigating the Effect of COVID-19. Appl. Syst. Innov. 2020, 3, 41. [Google Scholar] [CrossRef]
- Gruppo di Lavoro ISS Prevenzione e Controllo delle Infezioni. Indicazioni ad Interim per la Sanificazione Degli Ambienti Interni nel Contesto Sanitario e Assistenziale per Prevenire la Trasmissione di SARS-CoV 2. 2020. Available online: https://www.iss.it/documents/20126/0/Rapporto+ISS+COVID-19+n.+20_2020+REV+2.pdf/afbbb63a-1f0f-9a11-6229-a13009cacd96?t=1594641502569 (accessed on 22 March 2021).
- WHO. Infection Prevention and Control Guidance for Long-Term Care Facilities in the Context of COVID-19: Interim Guidance. 2021. Available online: https://apps.who.int/iris/bitstream/handle/10665/338481/WHO-2019-nCoV-IPC_long_term_care-2021.1-eng.pdf?sequence=1&isAllowed=y (accessed on 22 March 2021).
- Disinfectants for Use Against SARS-CoV-2 (COVID-19); U.S. Environmental Protection Agency: Washington, DC, USA, 2020.
- Maris, P. Modes of action of disinfectants. Rev. Sci. Et Tech. (Int. Off. Epizoot.) 1995, 14, 47–55. [Google Scholar] [CrossRef] [PubMed]
- Chesné, J.; Cardoso, V.; Veiga-Fernandes, H. Neuro-immune regulation of mucosal physiology. Mucosal Immunol. 2019, 12, 10–20. [Google Scholar] [CrossRef] [Green Version]
- Marini, A.; Hengge, U. Important viral and bacterial infections of the skin and mucous membrane. Der Internist 2009, 50, 160–170. [Google Scholar] [CrossRef]
- Magnifico, I.; Petronio, G.; Venditti, N.; Cutuli, M.A.; Pietrangelo, L.; Vergalito, F.; Mangano, K.; Zella, D.; di Marco, R. Atopic dermatitis as a multifactorial skin disorder. Can the analysis of pathophysiological targets represent the winning therapeutic strategy? Pharmaceuticals 2020, 13, 411. [Google Scholar] [CrossRef] [PubMed]
- Adriaens, E.; Remon, J.P. Evaluation of an alternative mucosal irritation test using slugs. Toxicol. Appl. Pharmacol. 2002, 182, 169–175. [Google Scholar] [CrossRef] [PubMed]
- Mangano, K.; Vergalito, F.; Mammana, S.; Mariano, A.; de Pasquale, R.; Meloscia, A.; Bartollino, S.; Guerra, G.; Nicoletti, F.; di Marco, R. Evaluation of hyaluronic acid-P40 conjugated cream in a mouse model of dermatitis induced by oxazolone. Exp. Ther. Med. 2017, 14, 2439–2444. [Google Scholar] [CrossRef] [PubMed] [Green Version]
- Olsson, I.A.S.; Silva, S.P.d.; Townend, D.; Sandøe, P. Protecting animals and enabling research in the European Union: An overview of development and implementation of directive 2010/63/EU. ILAR J. 2017, 57, 347–357. [Google Scholar] [CrossRef] [Green Version]
- Cutuli, M.A.; Petronio Petronio, G.; Vergalito, F.; Magnifico, I.; Pietrangelo, L.; Venditti, N.; di Marco, R. Galleria mellonella as a consolidated in vivo model hosts: New developments in antibacterial strategies and novel drug testing. Virulence 2019, 10, 527–541. [Google Scholar] [CrossRef] [Green Version]
- Van Houte, D.E. De Ontwikkeling van een Alternatieve Mucosale Irritatietest; Optimization and Validation of An Alternative Mucosal Irritation Test, 2000; Pharmaceutical Care Ghent University: Ghent, Belgium, 2005. [Google Scholar]
- Jensen, K.; Engelke, S.; Simpson, S.J.; Mayntz, D.; Hunt, J. Balancing of specific nutrients and subsequent growth and body composition in the slug Arion lusitanicus. Physiol. Behav. 2013, 122, 84–92. [Google Scholar] [CrossRef] [Green Version]
- South, A. Terrestrial slugs: Biology, Ecology and Control; Chapman & Hall: London, UK, 1992. [Google Scholar]
- Verdugo, P.; Deyrup-Olsen, I.; Aitken, M.; Villalon, M.; Johnson, D. Molecular mechanism of mucin secretion: I. The role of intragranular charge shielding. J. Dent. Res. 1987, 66, 506–508. [Google Scholar] [CrossRef]
- Deyrup-Olsen, I.; Martin, A.W. Surface exudation in terrestrial slugs. Comp. Biochem. Physiol. Part. C Comp. Pharmacol. 1982, 72, 45–51. [Google Scholar] [CrossRef]
- Lenoir, J.; Bachert, C.; Remon, J.-P.; Adriaens, E. The slug mucosal irritation (SMI) assay: A tool for the evaluation of nasal discomfort. Toxicol. Vitr. 2013, 27, 1954–1961. [Google Scholar] [CrossRef] [PubMed]
- Kendall, R.; Lenoir, J.; Gerrard, S.; Scheuerle, R.L.; Slater, N.K.; Tuleu, C. Using the Slug Mucosal Irritation assay to investigate the tolerability of tablet excipients on human skin in the context of the use of a nipple shield delivery system. Pharm. Res. 2017, 34, 687–695. [Google Scholar] [CrossRef] [PubMed] [Green Version]
- Adriaens, E.; Guest, R.; Willoughby Sr, J.; Fochtman, P.; Kandarova, H.; Verstraelen, S.; van Rompay, A. CON4EI: Slug Mucosal Irritation (SMI) test method for hazard identification and labelling of serious eye damaging and eye irritating chemicals. Toxicol. Vitr. 2018, 49, 77–89. [Google Scholar] [CrossRef]
- Ceulemans, J.; Vermeire, A.; Adriaens, E.; Remon, J.P.; Ludwig, A. Evaluation of a mucoadhesive tablet for ocular use. J. Control. Release 2001, 77, 333–344. [Google Scholar] [CrossRef]
- Lenoir, J.; Adriaens, E.; Remon, J.P. New aspects of the Slug Mucosal Irritation assay: Predicting nasal stinging, itching and burning sensations. J. Appl. Toxicol. 2011, 31, 640–648. [Google Scholar] [CrossRef] [PubMed] [Green Version]
- Petit, J.-Y.; Doré, V.; Marignac, G.; Perrot, S. Assessment of ocular discomfort caused by 5 shampoos using the Slug Mucosal Irritation test. Toxicol. Vitr. 2017, 40, 243–247. [Google Scholar] [CrossRef]
- Adriaens, E.; Ameye, D.; Dhondt, M.; Foreman, P.; Remon, J.P. Evaluation of the mucosal irritation potency of co-spray dried Amioca®/poly (acrylic acid) and Amioca®/Carbopol® 974P mixtures. J. Control. Release 2003, 88, 393–399. [Google Scholar] [CrossRef]
- De Cock, L.J.; Lenoir, J.; de Koker, S.; Vermeersch, V.; Skirtach, A.G.; Dubruel, P.; Adriaens, E.; Vervaet, C.; Remon, J.P.; de Geest, B.G. Mucosal irritation potential of polyelectrolyte multilayer capsules. Biomaterials 2011, 32, 1967–1977. [Google Scholar] [CrossRef] [PubMed]
- Porfiryeva, N.N.; Nasibullin, S.F.; Abdullina, S.G.; Tukhbatullina, I.K.; Moustafine, R.I.; Khutoryanskiy, V.V. Acrylated Eudragit® E PO as a novel polymeric excipient with enhanced mucoadhesive properties for application in nasal drug delivery. Int. J. Pharm. 2019, 562, 241–248. [Google Scholar] [CrossRef] [PubMed]
- Adriaens, E.; Dierckens, K.; Bauters, T.G.; Nelis, H.J.; van Goethem, F.; Vanparys, P.; Remon, J.P. The mucosal toxicity of different benzalkonium chloride analogues evaluated with an alternative test using slugs. Pharm. Res. 2001, 18, 937–942. [Google Scholar] [CrossRef]
- Adriaens, E.; Remon, J.P. Mucosal irritation potential of personal lubricants relates to product osmolality as detected by the slug mucosal irritation assay. Sex. Transm. Dis. 2008, 35, 512–516. [Google Scholar] [CrossRef]
- Vandamme, K.; Melkebeek, V.; Cox, E.; Deforce, D.; Lenoir, J.; Adriaens, E.; Vervaet, C.; Remon, J.P. Influence of reaction medium during synthesis of Gantrez® AN 119 nanoparticles for oral vaccination. Eur. J. Pharm. Biopharm. 2010, 74, 202–208. [Google Scholar] [CrossRef]
- Callens, C.; Adriaens, E.; Dierckens, K.; Remon, J.P. Toxicological evaluation of a bioadhesive nasal powder containing a starch and Carbopol® 974 P on rabbit nasal mucosa and slug mucosa. J. Control. Release 2001, 76, 81–91. [Google Scholar] [CrossRef]
- Dhondt, M.M.; Adriaens, E.; Van Roey, J.; Remon, J.P. The evaluation of the local tolerance of vaginal formulations containing dapivirine using the Slug Mucosal Irritation test and the rabbit vaginal irritation test. Eur. J. Pharm. Biopharm. 2005, 60, 419–425. [Google Scholar] [CrossRef] [PubMed]
- Forcart, L. Limacus maculatus (Kaleniczenko) und Limacus flavus (Linnaeus). Mitt. Dtsch. Malakozool. Ges. 1986, 38, 21–23. [Google Scholar]
- Chelazzi, G.; le Voci, G.; Parpagnoli, D. Relative importance of airborne odours and trails in the group homing of Limacus flavus (Linnaeus) (Gastropoda, Pulmonata). J. Molluscan Stud. 1988, 54, 173–180. [Google Scholar] [CrossRef]
- Cook, A.; Shirbhate, R. The mucus producing glands and the distribution of the cilia of the pulmonate slug Limax pseudoflavus. J. Zool. 1983, 201, 97–116. [Google Scholar] [CrossRef]
- Chang, N.-S. Ultrastructural and Histochemical Studies on the Epithelial Cells and Mucus-producing Cells of Korean Slug (Limax flavus L.). Appl. Microsc. 1988, 18, 1–20. [Google Scholar]
- Khutoryanskaya, O.V.; Mayeva, Z.A.; Mun, G.A.; Khutoryanskiy, V.V. Designing temperature-responsive biocompatible copolymers and hydrogels based on 2-hydroxyethyl (meth) acrylates. Biomacromolecules 2008, 9, 3353–3361. [Google Scholar] [CrossRef] [PubMed]
- Dhondt, M.M.; Adriaens, E.; Pinceel, J.; Jordaens, K.; Backeljau, T.; Remon, J.P. Slug species-and population-specific effects on the end points of the Slug Mucosal Irritation test. Toxicol. Vitr. 2006, 20, 448–457. [Google Scholar] [CrossRef] [PubMed]
- Castillo, V.M. Limacus flavus (Linnaeus, 1758 Linnaeus, 1758 Linnaeus, 1758): Antecedentes de la especie Antecedentes de la especie. Amici Molluscarum 2020, 27, 21–26. [Google Scholar]
- WHO. Cleaning and Disinfection of Environmental Surfaces in the Context of COVID-19: Interim Guidance, 15 May 2020; World Health Organization: Geneva, Switzaerland, 2020; Available online: https://apps.who.int/iris/handle/10665/332096 (accessed on 22 March 2021).
- Lauritano, D.; Moreo, G.; Limongelli, L.; Nardone, M.; Carinci, F. Environmental Disinfection Strategies to Prevent Indirect Transmission of SARS-CoV2 in Healthcare Settings. Appl. Sci. 2020, 10, 6291. [Google Scholar] [CrossRef]
- Al-Gheethi, A.; Al-Sahari, M.; Abdul Malek, M.; Noman, E.; Al-Maqtari, Q.; Mohamed, R.; Talip, B.A.; Alkhadher, S.; Hossain, M. Disinfection Methods and Survival of SARS-CoV-2 in the Environment and Contaminated Materials: A Bibliometric Analysis. Sustainability 2020, 12, 7378. [Google Scholar] [CrossRef]
- Ijaz, M.; Brunner, A.; Sattar, S.; Nair, R.C.; Johnson-Lussenburg, C. Survival characteristics of airborne human coronavirus 229E. J. Gen. Virol. 1985, 66, 2743–2748. [Google Scholar] [CrossRef] [PubMed]
- Safari, Z.; Fouladi-Fard, R.; Vahidmoghadam, R.; Hosseini, M.R.; Mohammadbeigi, A.; Omidi Oskouei, A.; Rezaali, M.; Ferrante, M.; Fiore, M. Awareness and Performance towards Proper Use of Disinfectants to Prevent COVID-19: The Case of Iran. Int. J. Environ. Res. Public Health 2021, 18, 2099. [Google Scholar] [CrossRef] [PubMed]
- Van Doremalen, N.; Bushmaker, T.; Morris, D.H.; Holbrook, M.G.; Gamble, A.; Williamson, B.N.; Tamin, A.; Harcourt, J.L.; Thornburg, N.J.; Gerber, S.I. Aerosol and surface stability of SARS-CoV-2 as compared with SARS-CoV-1. N. Engl. J. Med. 2020, 382, 1564–1567. [Google Scholar] [CrossRef] [PubMed]
- Chang, A.; Schnall, A.H.; Law, R.; Bronstein, A.C.; Marraffa, J.M.; Spiller, H.A.; Hays, H.L.; Funk, A.R.; Mercurio-Zappala, M.; Calello, D.P. Cleaning and disinfectant chemical exposures and temporal associations with COVID-19—national poison data system, United States, 1 January–31 March 2020. Morb. Mortal. Wkly. Rep. 2020, 69, 496. [Google Scholar] [CrossRef] [PubMed] [Green Version]
- Babić, Ž.; Turk, R.; Macan, J. Toxicological aspects of increased use of surface and hand disinfectants in Croatia during the COVID-19 pandemic: A preliminary report. Arch. Ind. Hyg. Toxicol. 2020, 71, 261–264. [Google Scholar] [CrossRef]
- Casey, M.L.; Hawley, B.; Edwards, N.; Cox-Ganser, J.M.; Cummings, K.J. Health problems and disinfectant product exposure among staff at a large multispecialty hospital. Am. J. Infect. Control 2017, 45, 1133–1138. [Google Scholar] [CrossRef]
- Kim, J.-H.; Hwang, M.-Y.; Kim, Y.-j. A Potential Health Risk to Occupational User from Exposure to Biocidal Active Chemicals. Int. J. Environ. Res. Public Health 2020, 17, 8770. [Google Scholar] [CrossRef]
- Adriaens, E.; Bytheway, H.; de Wever, B.; Eschrich, D.; Guest, R.; Hansen, E.; Vanparys, P.; Schoeters, G.; Warren, N.; Weltens, R. Successful prevalidation of the slug mucosal irritation test to assess the eye irritation potency of chemicals. Toxicol. Vitr. 2008, 22, 1285–1296. [Google Scholar] [CrossRef]
- Gordon, D.G. Field Guide to the Slug; Sasquatch Books: Seattle, WA, USA, 1994. [Google Scholar]
- Jordaens, K.; Riel, P.V.; Geenen, S.; Verhagen, R.; Backeljau, T. Food-induced body pigmentation questions the taxonomic value of colour in the self-fertilizing slug Carinarion spp. J. Molluscan Stud. 2001, 67, 161–167. [Google Scholar] [CrossRef] [Green Version]
- Seki, K.; Wiwegweaw, A.; Asami, T. Fluorescent pigment distinguishes between sibling snail species. Zool. Sci. 2008, 25, 1212–1219. [Google Scholar] [CrossRef] [PubMed] [Green Version]
- Adriaens, E.; Remon, J.P. Gastropods as an evaluation tool for screening the irritating potency of absorption enhancers and drugs. Pharm. Res. 1999, 16, 1240–1244. [Google Scholar] [CrossRef] [PubMed]
- Izenman, A.J. Linear discriminant analysis. In Modern Multivariate Statistical Techniques; Springer: New York, NY, USA, 2013; pp. 237–280. [Google Scholar]
- Adriaens, E.; Dhondt, M.; Remon, J.P. Refinement of the Slug Mucosal Irritation test as an alternative screening test for eye irritation. Toxicol. Vitr. 2005, 19, 79–89. [Google Scholar] [CrossRef] [PubMed]


| Chemicals | Bodyweight Variation (w/w%) | Mucus Production (w/w%) | Protein Quantification (µg/mL)/g a | LDH (iu/l)/g b | λmax 420 (nm) |
|---|---|---|---|---|---|
| PBS | 100.00 ± 1.84 | 0.30 ± 0.41 | 20.07 ± 8.68 | - | 0.028 ± 0.006 |
| Sodium Hypochlorite 0.1% | 96.53 ± 1.15 | 3.73 ± 1.27 | 28.72 ± 13.36 | 0.57 ± 0.15 | 0.035 ± 0.005 |
| Hydrogen Peroxide 3% | 96.37 ± 2.05 | 5.03 ± 1.68 | 56.47 ± 15.21 | 0.47 ± 0.12 | 0.048 ± 0.006 |
| Chlorhexidine 1% | 82.04 ± 5.19 | 10.23 ± 2.28 | 104.90 ± 29.35 | 2.10 ± 0.73 | 0.103 ± 0.016 |
| Povidone Iodine 10% | 84.09 ± 6.22 | 14.29 ± 2.07 | 139.11 ± 51.58 | 2.28 ± 0.16 | 0.117 ± 0.016 |
| EtOH 70% | 78.78 ± 5.93 | 14.63 ± 2.85 | 68.64 ± 28.85 | 3.62 ± 0.75 | 0.070 ± 0.012 |
| BAC 1% | 86.68 ± 1.98 | 12.36 ± 3.32 | 230.02 ± 103.95 | 3.64 ± 0.90 | 0.301 ± 0.015 |
| Isopropanol 70% | 83.04 ± 5.54 | 11.58 ± 3.98 | 275.53 ± 76.64 | 3.51 ± 0.51 | 0.330 ± 0.020 |
| Isopropanol 95% | 78.95 ± 3.10 | 19.96 ± 4.08 | 396.87 ± 73.77 | 5.73 ± 1.13 | 0.394 ± 0.019 |
| Chemicals | % Correct LDA λmax 420 | % Correct LDA w/o λmax 420 | ∆% Correct (% Correct LDA λmax 420– % Correct LDA w/o λmax 420) |
|---|---|---|---|
| PBS | 100 | 100 | - |
| Sodium Hypochlorite 0.1% | 88.89 | 77.78 | 11.11 |
| Hydrogen Peroxide 3% | 77.77 | 66.67 | 11.11 |
| Chlorhexidine 1% | 88.89 | 88.89 | - |
| Povidone Iodine 10% | 100 | 66.67 | 33.33 |
| EtOH 70% | 100 | 88.89 | 11.11 |
| BAC 1% | 77.78 | 22.22 | 55.55 |
| Isopropanol 70% | 100 | 77.78 | 22.22 |
| Isopropanol 95% | 100 | 100 | - |
| Total | 92.59% | 76.54% | 16.05 |
| Chemicals | D2 PBS LDA λmax 420 | Range | Score | Grade |
|---|---|---|---|---|
| PBS | 5 | 0 to 5 | 0 | none |
| Sodium Hypochlorite 0.1% | 11 | 11 to 20 | 1 | low |
| Hydrogen Peroxide 3% | 20 | |||
| Chlorhexidine 1% | 132 | 20 to 132 | 2 | mild |
| Povidone Iodine 10% | 155 | 132 to 155 | 3 | average |
| EtOH 70% | 196 | 155 to 196 | 4 | average-high |
| BAC 1% | 878 | 196 to 878 | 5 | high |
| Isopropanol 70% | 1031 | 878 to 1031 | 6 | very high |
| Isopropanol 95% | 1676 | 1031 to 1676 | 7 | extremely high |
Publisher’s Note: MDPI stays neutral with regard to jurisdictional claims in published maps and institutional affiliations. |
© 2021 by the authors. Licensee MDPI, Basel, Switzerland. This article is an open access article distributed under the terms and conditions of the Creative Commons Attribution (CC BY) license (https://creativecommons.org/licenses/by/4.0/).
Share and Cite
Cutuli, M.A.; Guarnieri, A.; Pietrangelo, L.; Magnifico, I.; Venditti, N.; Recchia, L.; Mangano, K.; Nicoletti, F.; Di Marco, R.; Petronio Petronio, G. Potential Mucosal Irritation Discrimination of Surface Disinfectants Employed against SARS-CoV-2 by Limacus flavus Slug Mucosal Irritation Assay. Biomedicines 2021, 9, 424. https://0-doi-org.brum.beds.ac.uk/10.3390/biomedicines9040424
Cutuli MA, Guarnieri A, Pietrangelo L, Magnifico I, Venditti N, Recchia L, Mangano K, Nicoletti F, Di Marco R, Petronio Petronio G. Potential Mucosal Irritation Discrimination of Surface Disinfectants Employed against SARS-CoV-2 by Limacus flavus Slug Mucosal Irritation Assay. Biomedicines. 2021; 9(4):424. https://0-doi-org.brum.beds.ac.uk/10.3390/biomedicines9040424
Chicago/Turabian StyleCutuli, Marco Alfio, Antonio Guarnieri, Laura Pietrangelo, Irene Magnifico, Noemi Venditti, Laura Recchia, Katia Mangano, Ferdinando Nicoletti, Roberto Di Marco, and Giulio Petronio Petronio. 2021. "Potential Mucosal Irritation Discrimination of Surface Disinfectants Employed against SARS-CoV-2 by Limacus flavus Slug Mucosal Irritation Assay" Biomedicines 9, no. 4: 424. https://0-doi-org.brum.beds.ac.uk/10.3390/biomedicines9040424