Machine Learning to Improve the Sensing of Biomolecules by Conical Track-Etched Nanopore


 , , , and
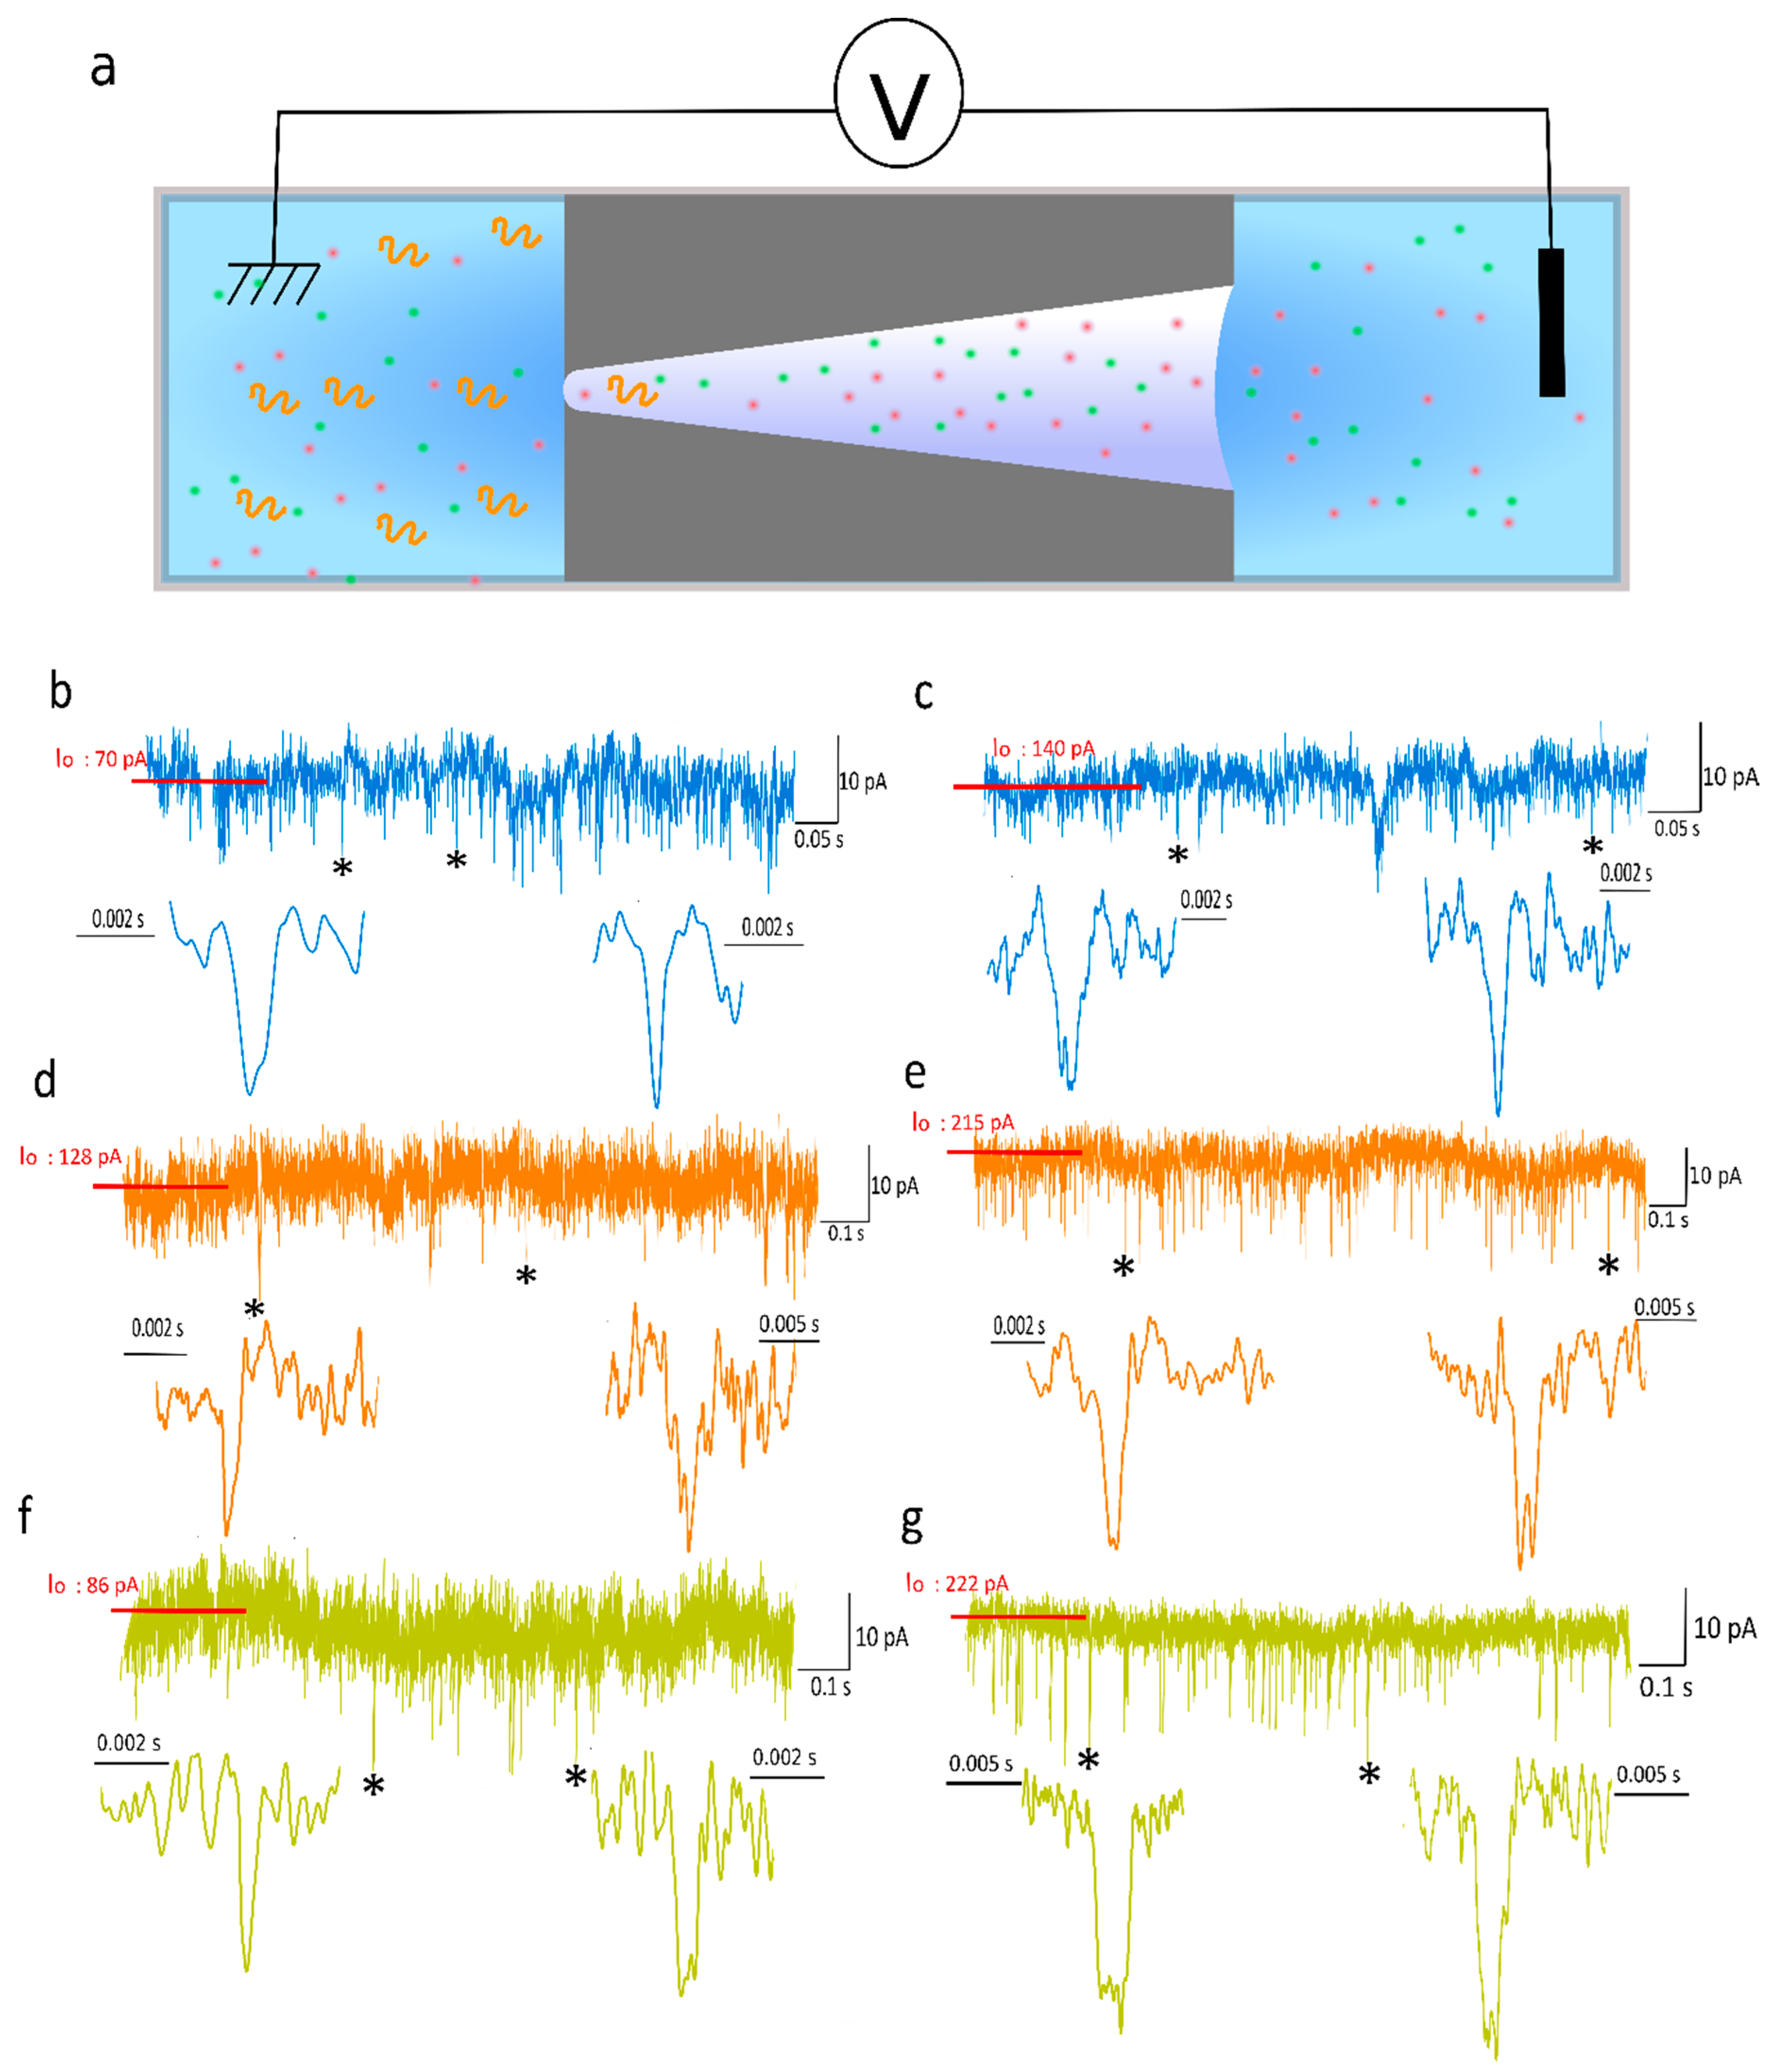
Abstract
:1. Introduction
2. Material and Methods
2.1. Material
2.2. Track-Etched Nanopore Design
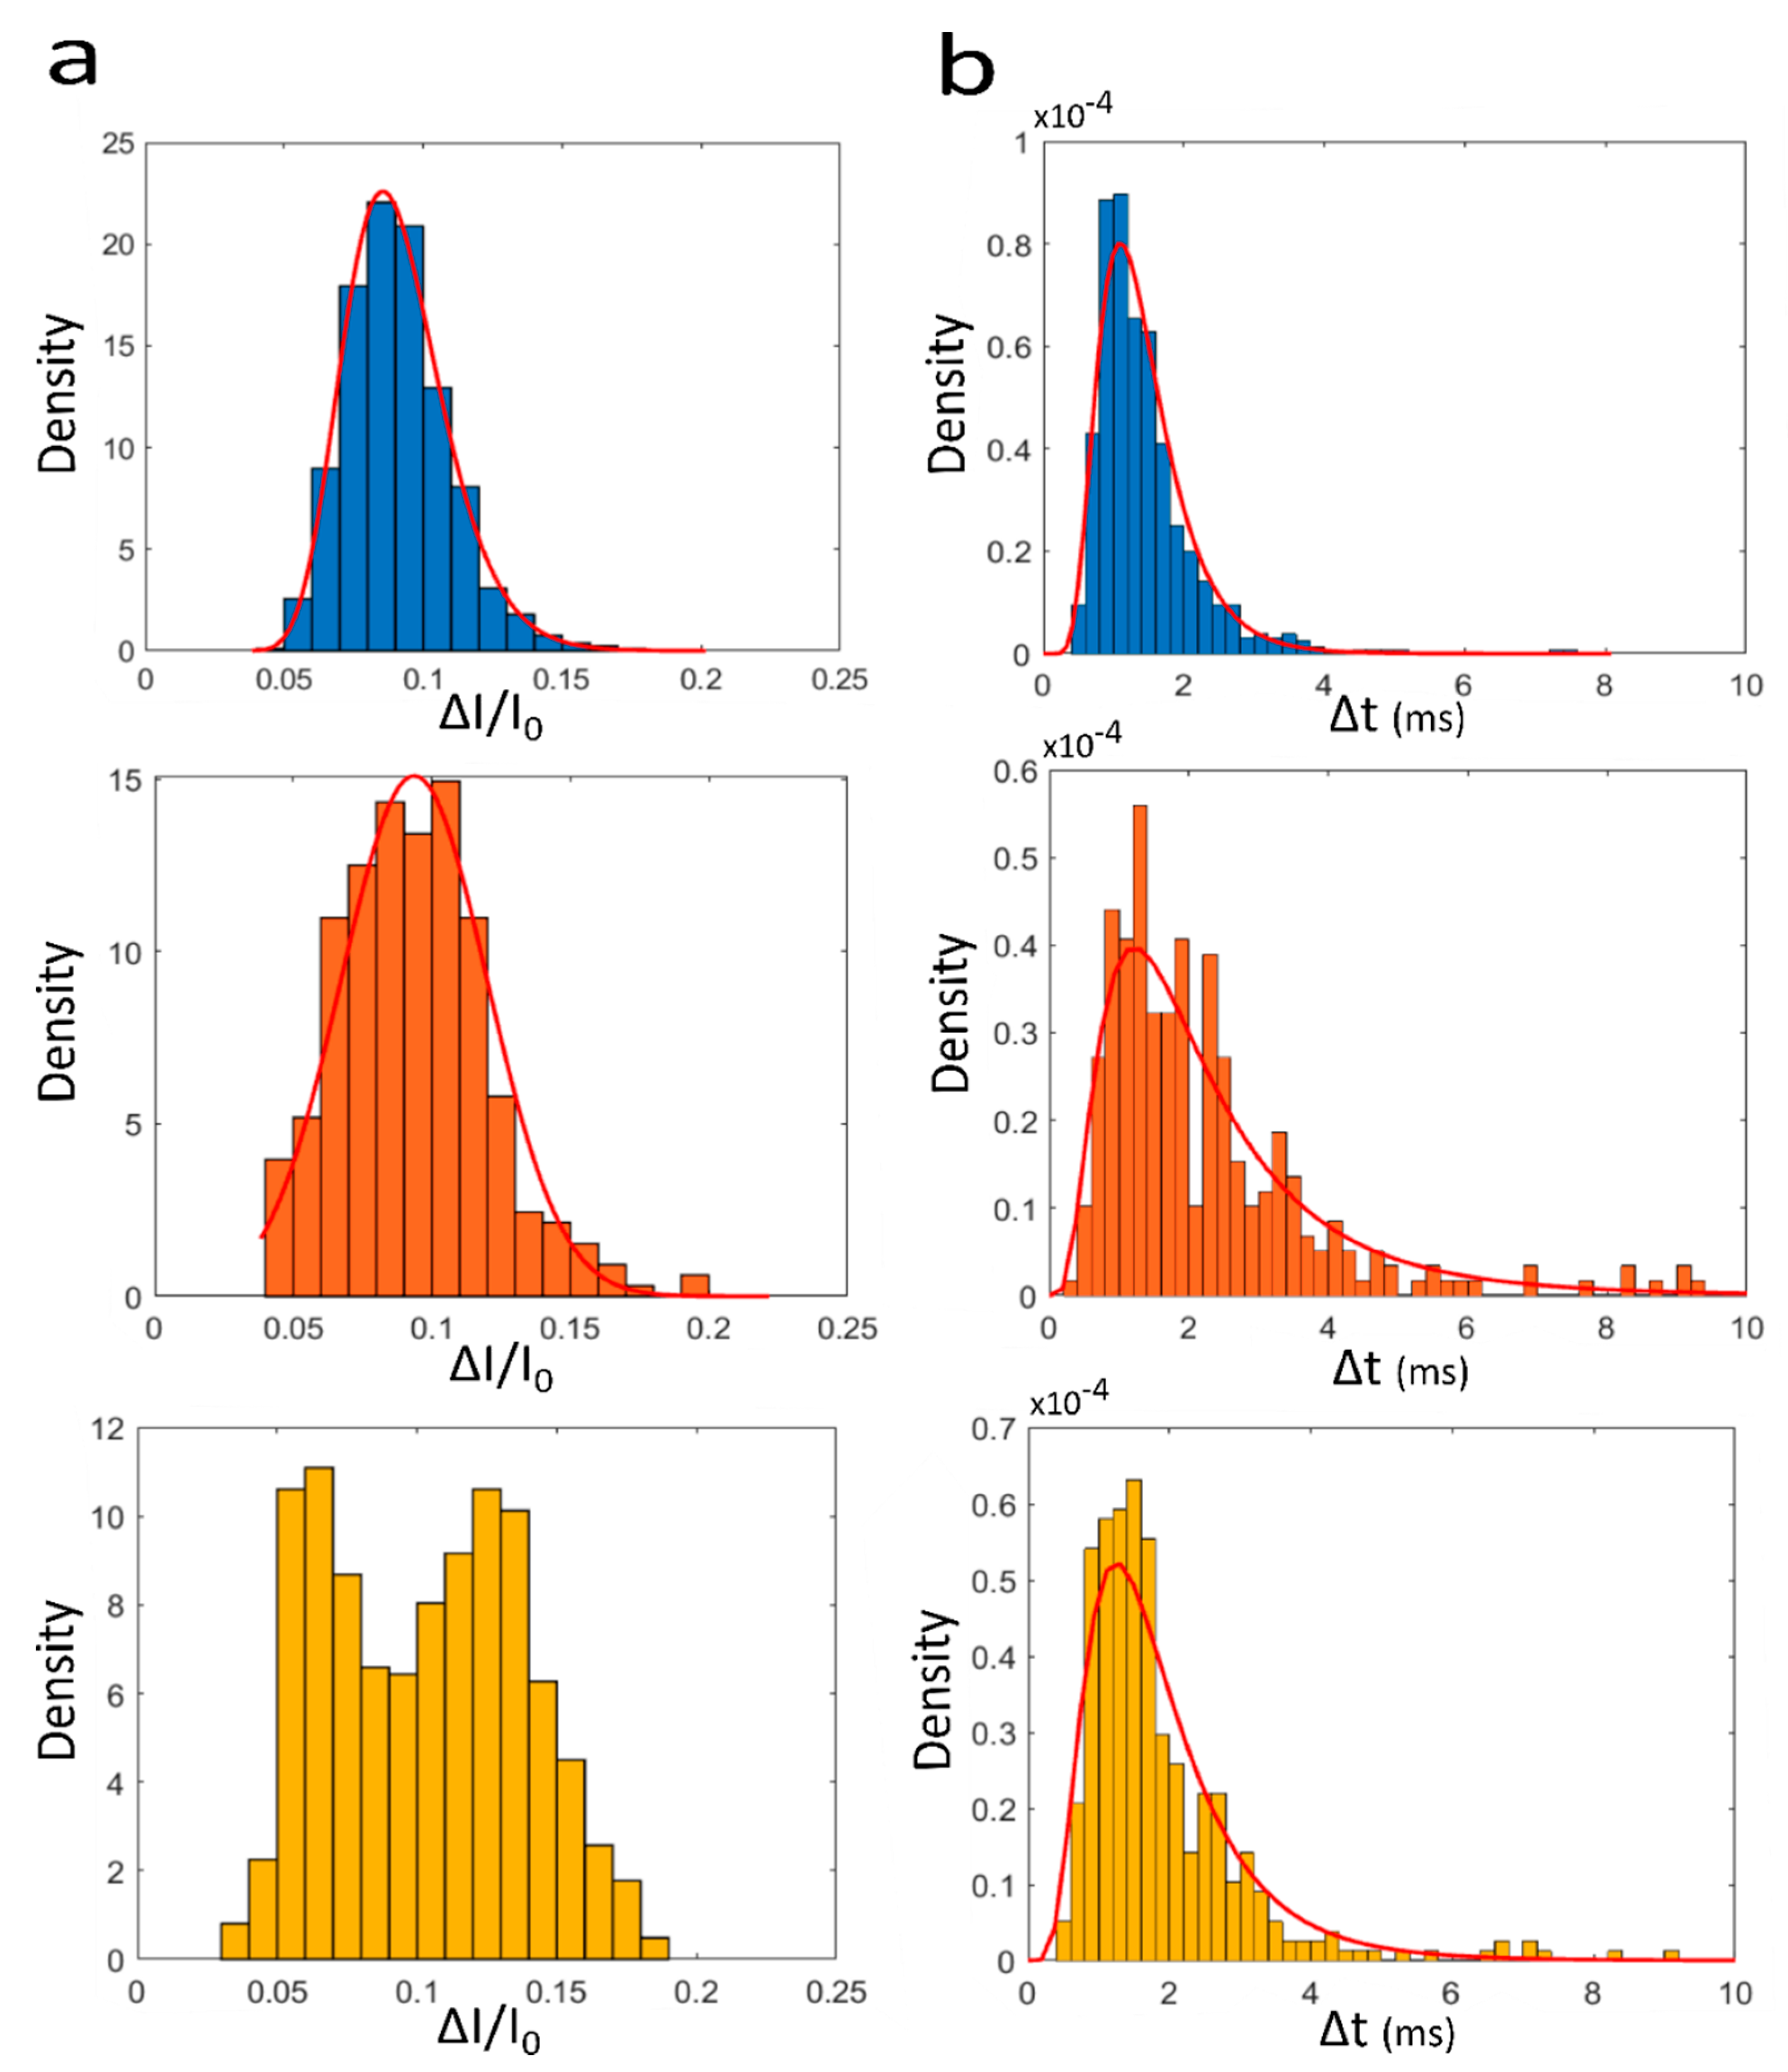
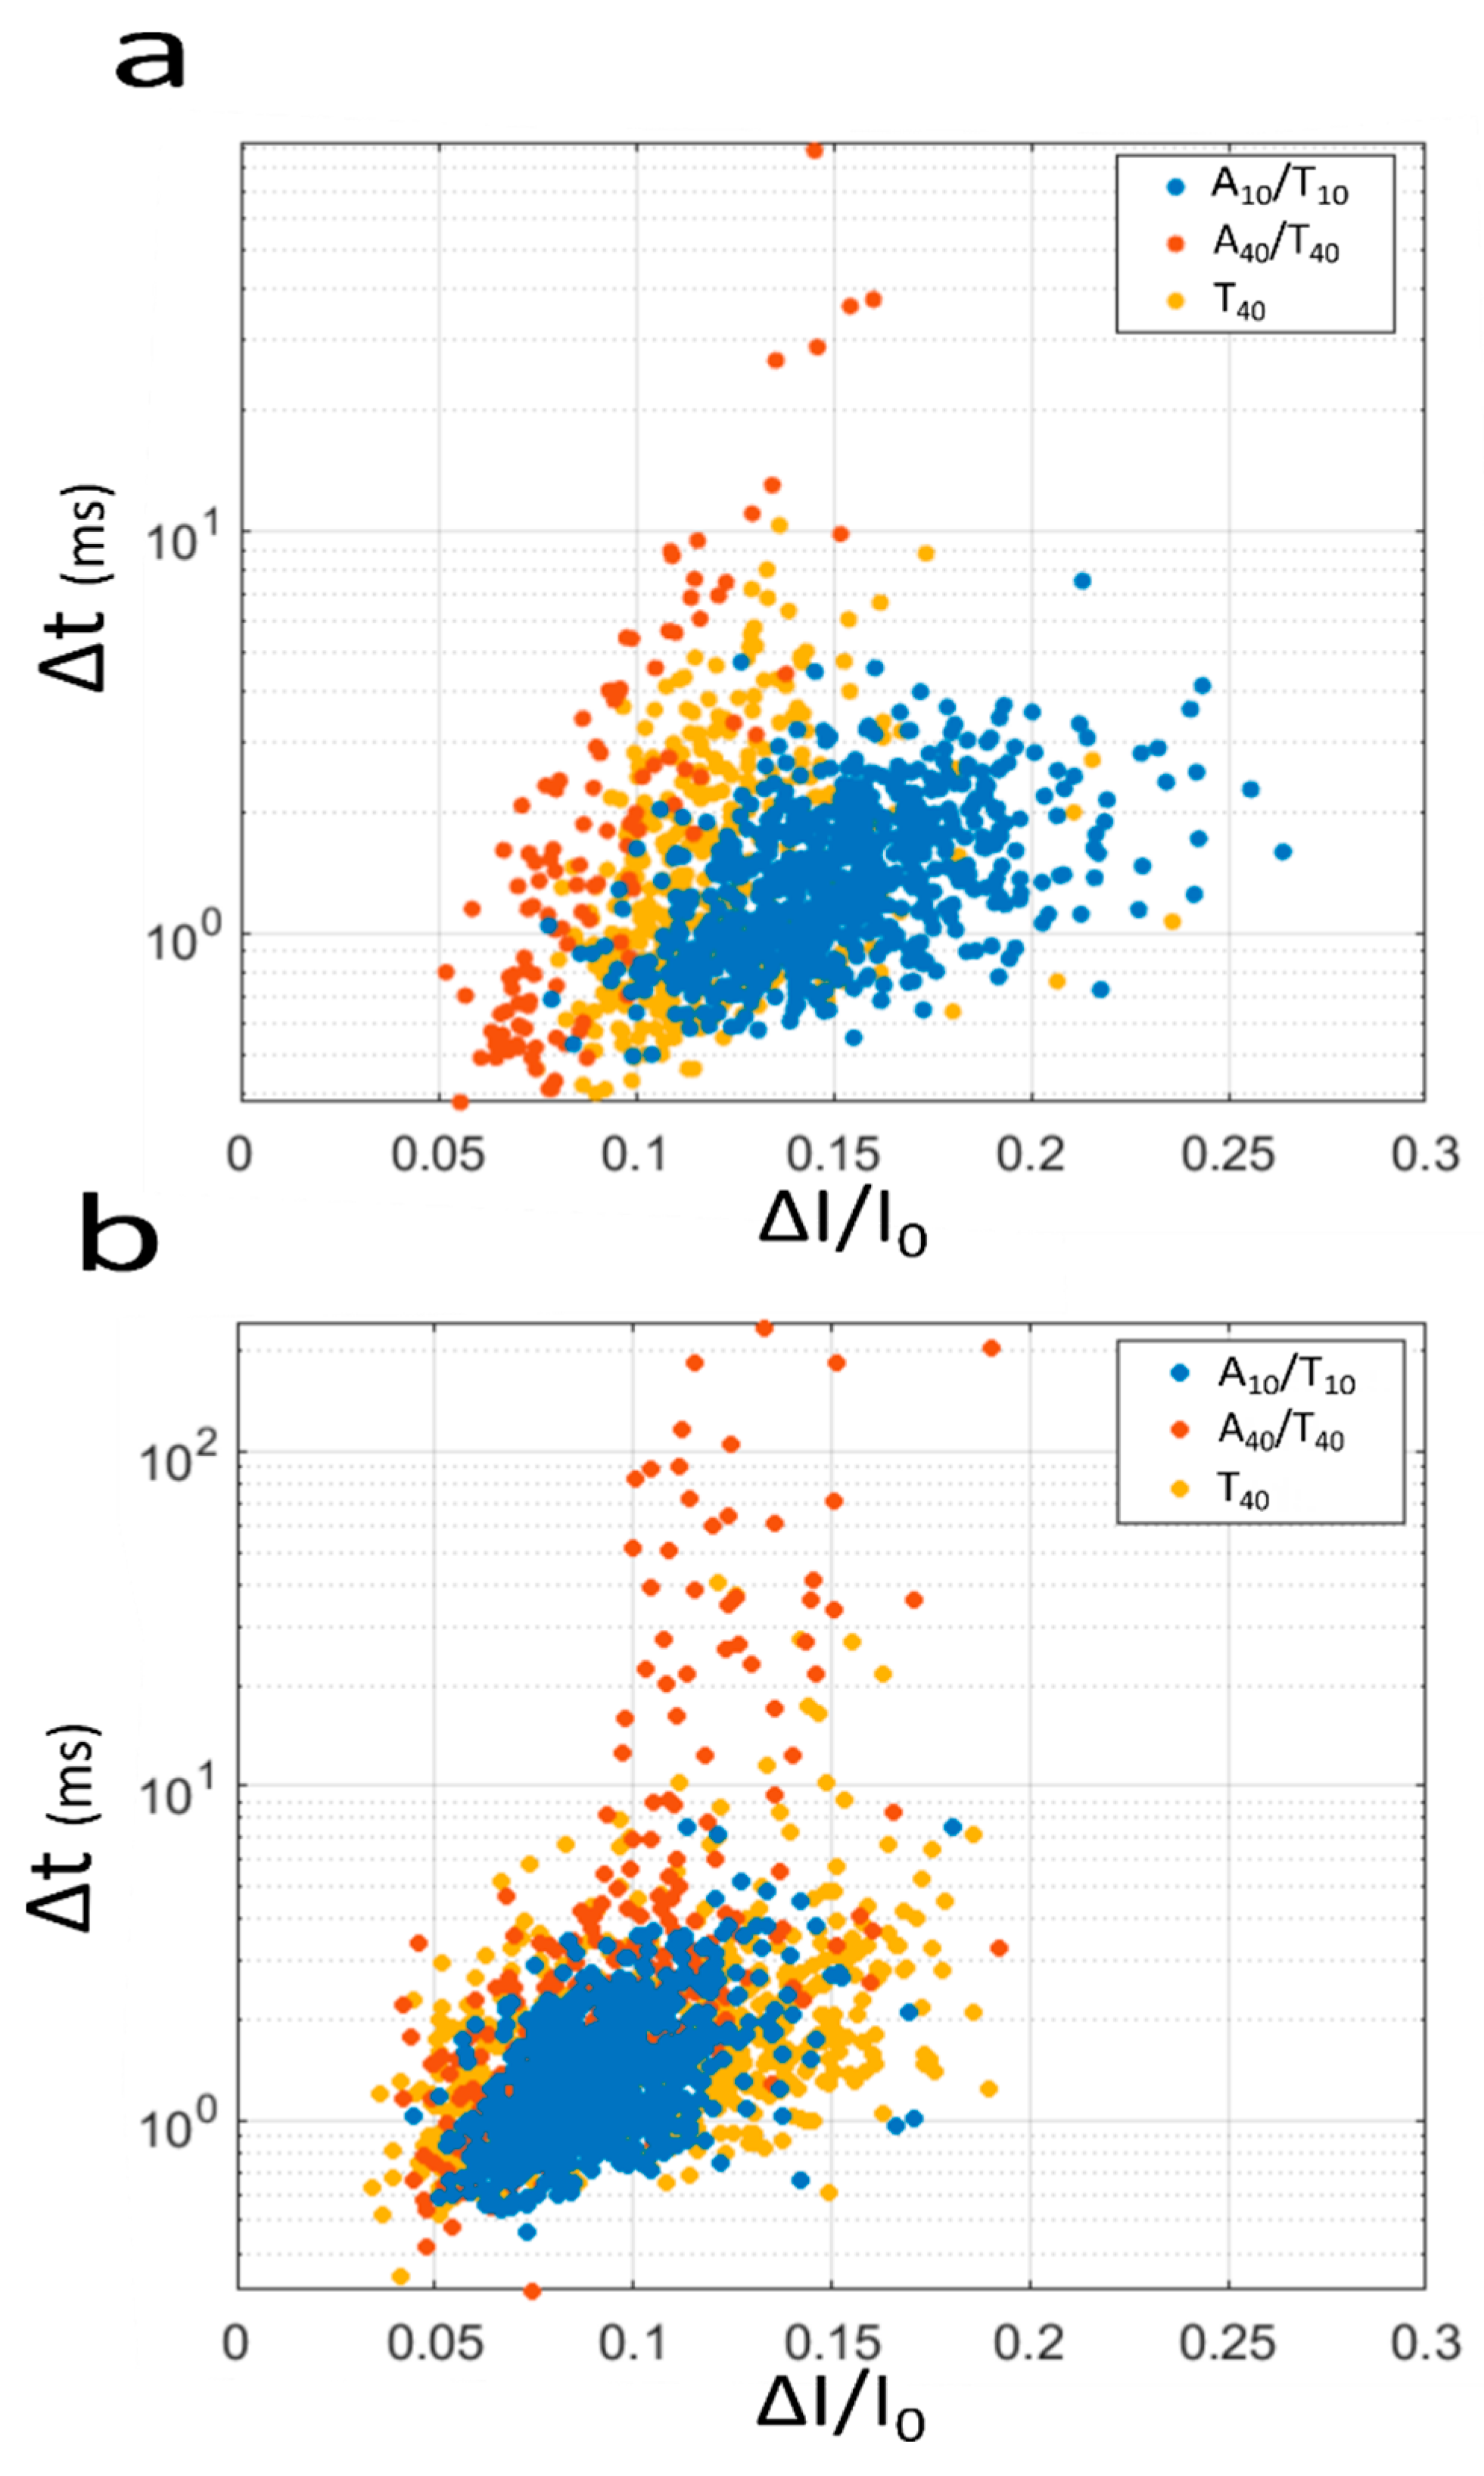
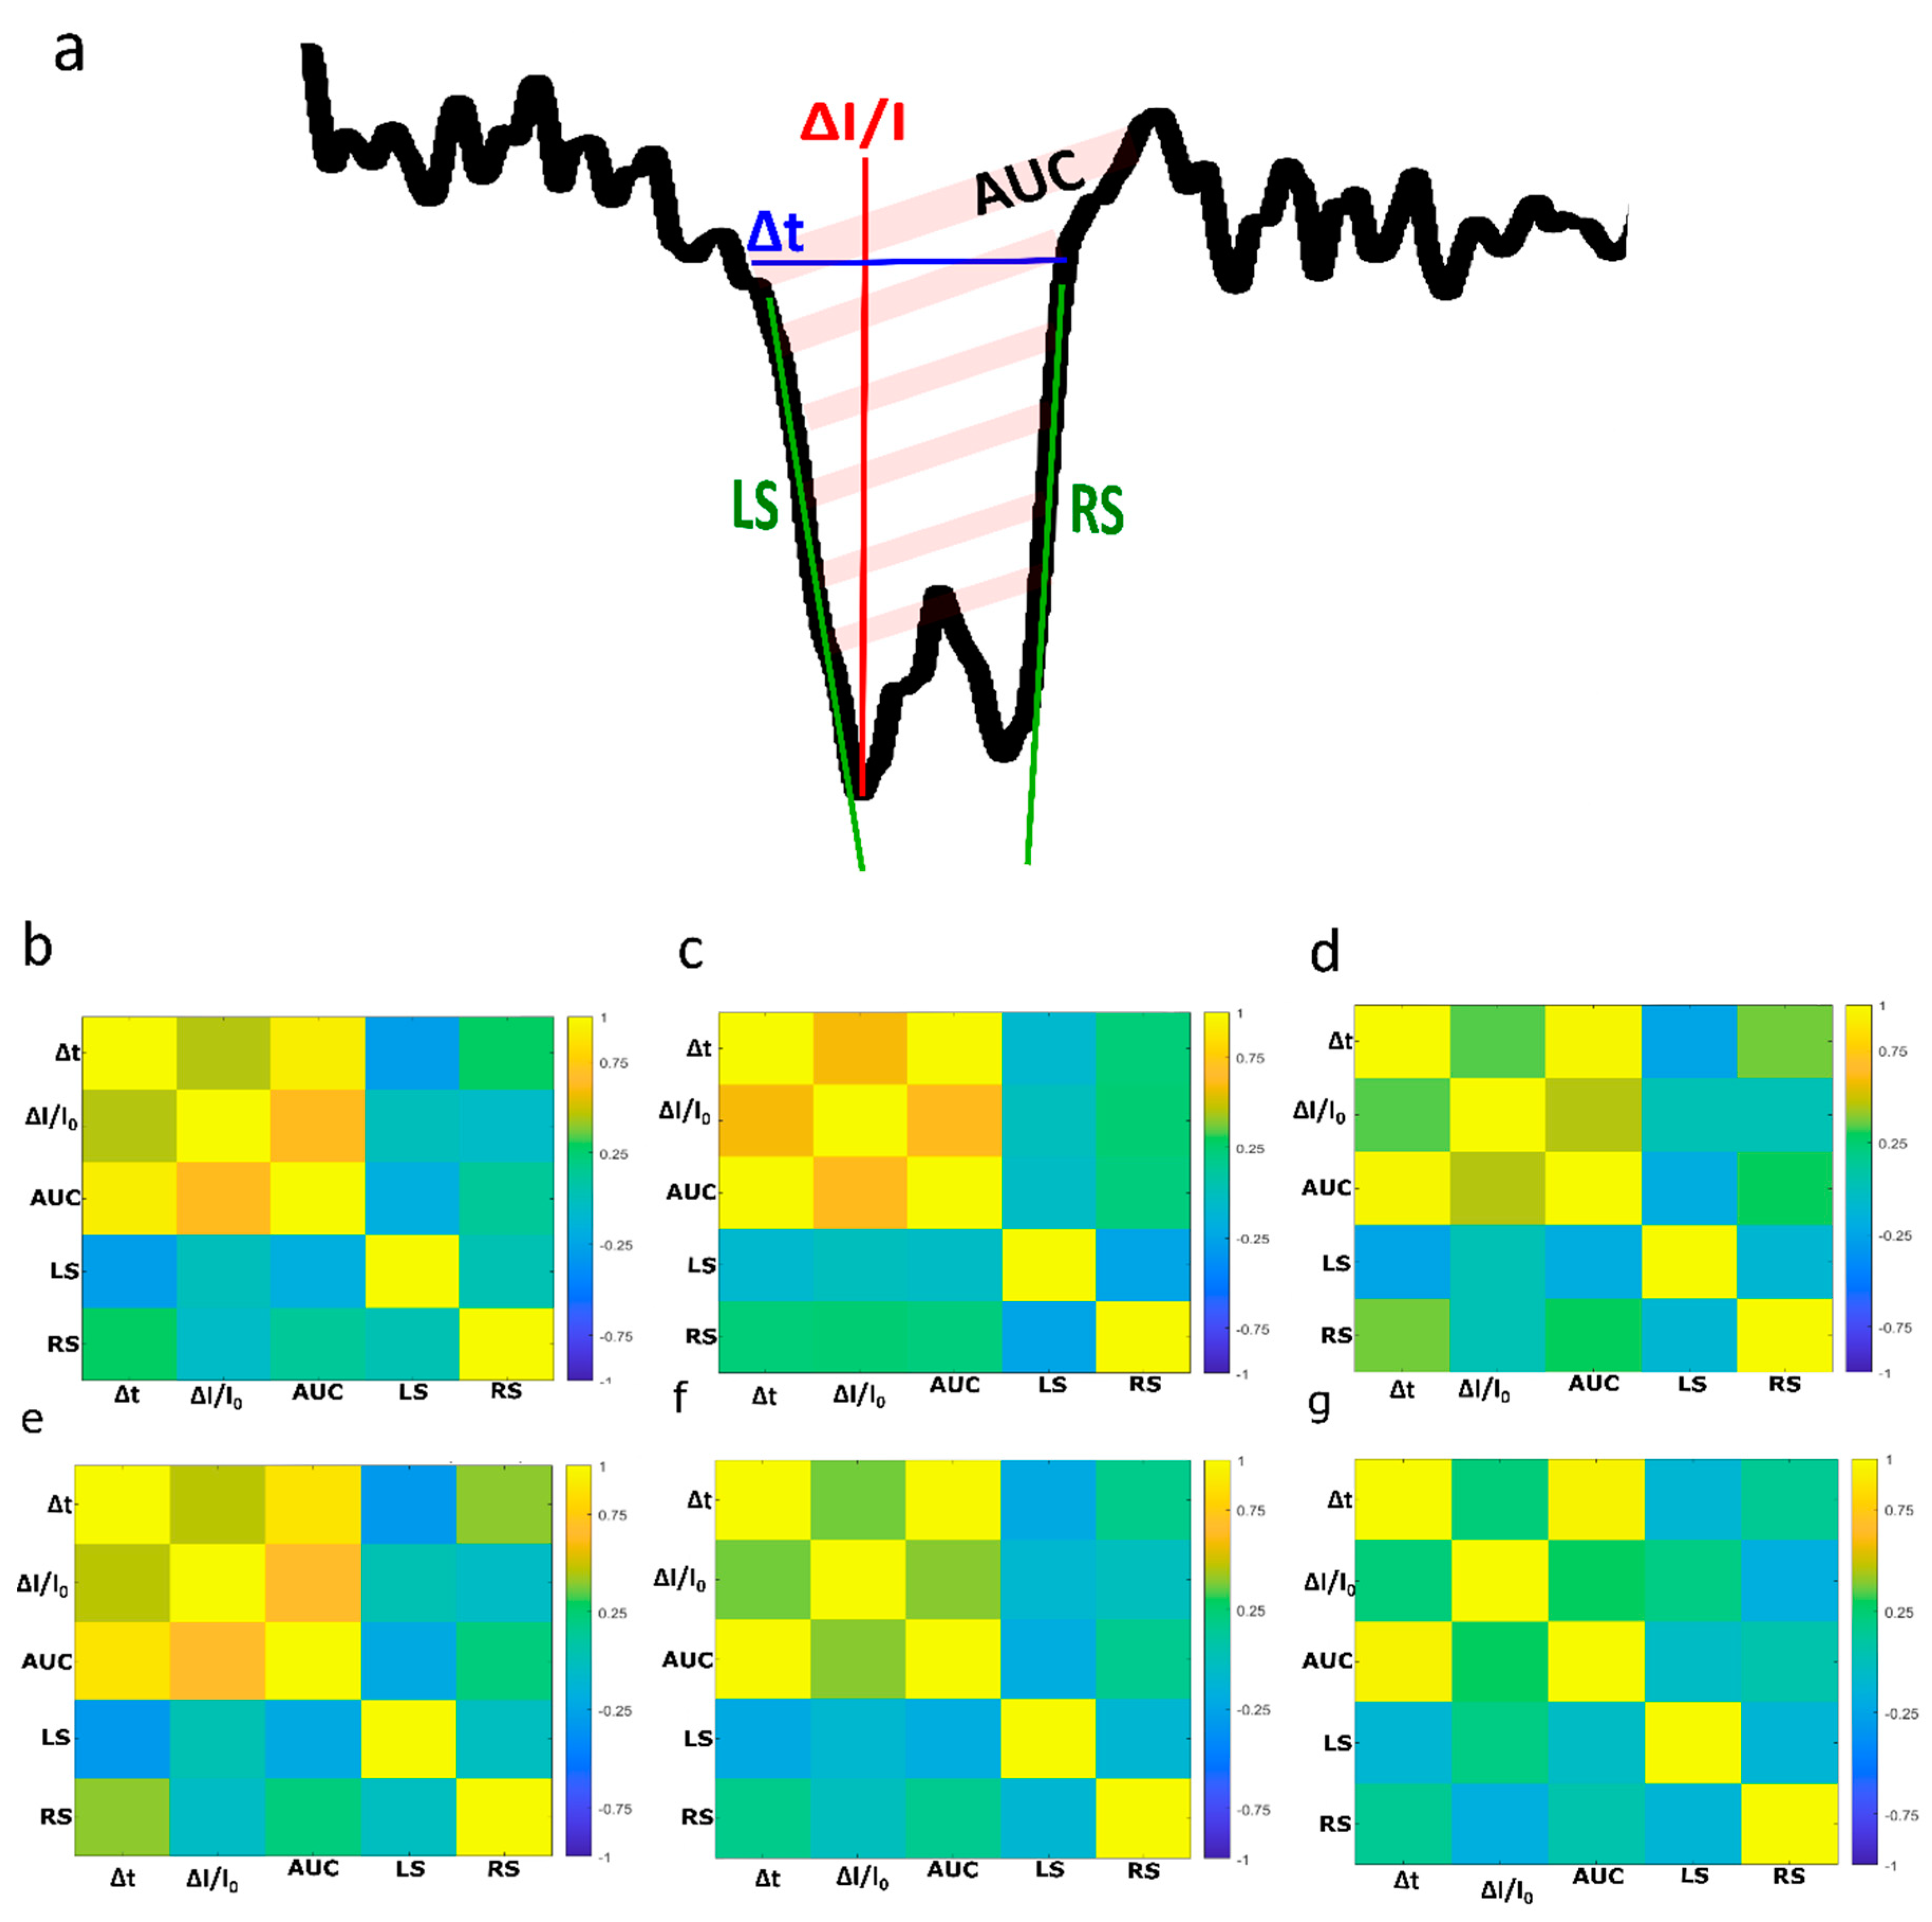
2.3. DNA Detection and Analysis
3. Results and Discussion
4. Conclusions
Supplementary Materials
Author Contributions
Funding
Acknowledgments
Conflicts of Interest
References
- Deamer, D.; Akeson, M.; Branton, D. Three decades of nanopore sequencing. Nat. Biotechnol. 2016, 34, 518–524. [Google Scholar] [CrossRef]
- Kasianowicz, J.J.; Brandin, E.; Branton, D.; Deamer, D.W. Characterization of individual polynucleotide molecules using a membrane channel. Proc. Natl. Acad. Sci. USA 1996, 93, 13770–13773. [Google Scholar] [CrossRef] [Green Version]
- Manrao, E.A.; Derrington, I.M.; Laszlo, A.H.; Langford, K.W.; Hopper, M.K.; Gillgren, N.; Pavlenok, M.; Niederweis, M.; Gundlach, J.H. Reading DNA at single-nucleotide resolution with a mutant MspA nanopore and phi29 DNA polymerase. Nat. Biotechnol. 2012, 30, 349–353. [Google Scholar] [CrossRef] [PubMed] [Green Version]
- Wloka, C.; Mutter, N.L.; Soskine, M.; Maglia, G. Alpha-Helical Fragaceatoxin C Nanopore Engineered for Double-Stranded and Single-Stranded Nucleic Acid Analysis. Angew. Chem. Int. Ed. Engl. 2016, 55, 12494–12498. [Google Scholar] [CrossRef] [PubMed]
- Van der Verren, S.E.; van Gerven, N.; Jonckheere, W.; Hambley, R.; Singh, P.; Kilgour, J.; Jordan, M.; Wallace, E.J.; Jayasinghe, L.; Remaut, H. A dual-constriction biological nanopore resolves homonucleotide sequences with high fidelity. Nat. Biotechnol. 2020. [Google Scholar] [CrossRef]
- Cressiot, B.; Bacri, L.; Pelta, J. The Promise of Nanopore Technology: Advances in the Discrimination of Protein Sequences and Chemical Modifications. Small Methods 2020, 2000090. [Google Scholar] [CrossRef]
- Asandei, A.; Di Muccio, G.; Schiopu, I.; Mereuta, L.; Dragomir, I.S.; Chinappi, M.; Luchian, T. Nanopore-Based Protein Sequencing Using Biopores: Current Achievements and Open Challenges. Small Methods 2020, 1900595. [Google Scholar] [CrossRef]
- Ding, Y.; Fleming, A.M.; White, H.S.; Burrows, C.J. Internal vs fishhook hairpin DNA: Unzipping locations and mechanisms in the α-hemolysin nanopore. J. Phys. Chem. B 2014, 118, 12873–12882. [Google Scholar] [CrossRef] [Green Version]
- Mereuta, L.; Asandei, A.; Schiopu, I.; Park, Y.; Luchian, T. Nanopore-Assisted, Sequence-Specific Detection, and Single-Molecule Hybridization Analysis of Short, Single-Stranded DNAs. Anal. Chem. 2019, 91, 8630–8637. [Google Scholar] [CrossRef]
- Ciuca, A.; Asandei, A.; Schiopu, I.; Apetrei, A.; Mereuta, L.; Seo, C.H.; Park, Y.; Luchian, T. Single-Molecule, Real-Time Dissecting of Peptide Nucleic Acid–DNA Duplexes with a Protein Nanopore Tweezer. Anal. Chem. 2018, 90, 7682–7690. [Google Scholar] [CrossRef]
- Perera, R.T.; Fleming, A.M.; Peterson, A.M.; Heemstra, J.M.; Burrows, C.J.; White, H.S. Unzipping of A-Form DNA-RNA, A-Form DNA-PNA, and B-Form DNA-DNA in the α-Hemolysin Nanopore. Biophys. J. 2016, 110, 306–314. [Google Scholar] [CrossRef] [PubMed] [Green Version]
- Hornblower, B.; Coombs, A.; Whitaker, R.D.; Kolomeisky, A.; Picone, S.J.; Meller, A.; Akeson, M. Single-molecule analysis of DNA-protein complexes using nanopores. Nat. Methods 2007, 4, 315–317. [Google Scholar] [CrossRef] [PubMed]
- Li, J.; Stein, D.; McMullan, C.; Branton, D.; Aziz, M.J.; Golovchenko, J.A. Ion-beam sculpting at nanometre length scales. Nature 2001, 412, 166–169. [Google Scholar] [CrossRef] [Green Version]
- Li, J.; Gershow, M.; Stein, D.; Brandin, E.; Golovchenko, J.A. DNA molecules and configurations in a solid-state nanopore microscope. Nat. Mater. 2003, 2, 611–615. [Google Scholar] [CrossRef]
- Harrell, C.C.; Lee, S.B.; Martin, C.R. Synthetic single-nanopore and nanotube membranes. Anal. Chem. 2003, 75, 6861–6867. [Google Scholar] [CrossRef] [PubMed]
- Heins, E.A.; Siwy, Z.S.; Baker, L.A.; Martin, C.R. Detecting single porphyrin molecules in a conically shaped synthetic nanopore. Nano Lett. 2005, 5, 1824–1829. [Google Scholar] [CrossRef]
- Liu, K.; Feng, J.; Kis, A.; Radenovic, A. Atomically thin molybdenum disulfide nanopores with high sensitivity for DNA translocation. ACS Nano 2014, 8, 2504–2511. [Google Scholar] [CrossRef]
- Schneider, G.F.; Kowalczyk, S.W.; Calado, V.E.; Pandraud, G.; Zandbergen, H.W.; Vandersypen, L.M.K.; Dekker, C. DNA translocation through graphene nanopores. Nano Lett. 2010, 10, 3163–3167. [Google Scholar] [CrossRef] [Green Version]
- Hall, A.R.; Scott, A.; Rotem, D.; Mehta, K.K.; Bayley, H.; Dekker, C. Hybrid pore formation by directed insertion of α-haemolysin into solid-state nanopores. Nat. Nanotechnol. 2010, 5, 874–877. [Google Scholar] [CrossRef] [Green Version]
- Giamblanco, N.; Janot, J.-M.; Gubbiotti, A.; Chinappi, M.; Balme, S. Characterization of Food Amyloid Protein Digestion by Conical Nanopore. Small Methods 2020, 1900703. [Google Scholar] [CrossRef]
- Ma, T.; Janot, J.-M.; Balme, S. Track-Etched Nanopore/Membrane: From Fundamental to Applications. Small Methods 2020, 2000366. [Google Scholar] [CrossRef]
- Lepoitevin, M.; Ma, T.; Bechelany, M.; Janot, J.-M.; Balme, S. Functionalization of single solid state nanopores to mimic biological ion channels: A review. Adv. Colloid Interface Sci. 2017, 250, 195–213. [Google Scholar] [CrossRef]
- Feng, J.; Liu, K.; Bulushev, R.D.; Khlybov, S.; Dumcenco, D.; Kis, A.; Radenovic, A. Identification of single nucleotides in MoS2 nanopores. Nat. Nanotechnol. 2015, 10, 1070–1076. [Google Scholar] [CrossRef] [PubMed]
- Thakur, M.; Macha, M.; Chernev, A.; Graf, M.; Lihter, M.; Deen, J.; Tripathi, M.; Kis, A.; Radenovic, A. Wafer-Scale Fabrication of Nanopore Devices for Single-Molecule DNA Biosensing using MoS 2. Small Methods 2020, 2000072. [Google Scholar] [CrossRef]
- Kwok, H.; Briggs, K.; Tabard-Cossa, V. Nanopore fabrication by controlled dielectric breakdown. PLoS ONE 2014, 9, e92880. [Google Scholar] [CrossRef] [PubMed]
- Briggs, K.; Kwok, H.; Tabard-Cossa, V. Automated fabrication of 2-nm solid-state nanopores for nucleic acid analysis. Small 2014, 10, 2077–2086. [Google Scholar] [CrossRef]
- Balme, S.; Coulon, P.E.; Lepoitevin, M.; Charlot, B.; Yandrapalli, N.; Favard, C.; Muriaux, D.; Bechelany, M.; Janot, J.-M. Influence of Adsorption on Proteins and Amyloid Detection by Silicon Nitride Nanopore. Langmuir 2016, 32, 8916–8925. [Google Scholar] [CrossRef] [PubMed]
- Kowalczyk, S.W.; Hall, A.R.; Dekker, C. Detection of local protein structures along DNA using solid-state nanopores. Nano Lett. 2010, 10, 324–328. [Google Scholar] [CrossRef]
- Larkin, J.; Henley, R.; Bell, D.C.; Cohen-Karni, T.; Rosenstein, J.K.; Wanunu, M. Slow DNA transport through nanopores in hafnium oxide membranes. ACS Nano 2013, 7, 10121–10128. [Google Scholar] [CrossRef] [Green Version]
- Venta, K.; Shemer, G.; Puster, M.; Rodríguez-Manzo, J.A.; Balan, A.; Rosenstein, J.K.; Shepard, K.; Drndić, M. Differentiation of short, single-stranded DNA homopolymers in solid-state nanopores. ACS Nano 2013, 7, 4629–4636. [Google Scholar] [CrossRef]
- Wei, R.; Gatterdam, V.; Wieneke, R.; Tampé, R.; Rant, U. Stochastic sensing of proteins with receptor-modified solid-state nanopores. Nat. Nanotechnol. 2012, 7, 257–263. [Google Scholar] [CrossRef] [PubMed]
- Smeets, R.M.M.; Keyser, U.F.; Krapf, D.; Wu, M.-Y.; Dekker, N.H.; Dekker, C. Salt dependence of ion transport and DNA translocation through solid-state nanopores. Nano Lett. 2006, 6, 89–95. [Google Scholar] [CrossRef] [PubMed]
- Giamblanco, N.; Coglitore, D.; Janot, J.-M.; Coulon, P.E.; Charlot, B.; Balme, S. Detection of protein aggregate morphology through single antifouling nanopore. Sens. Actuators B Chem. 2018, 260, 736–745. [Google Scholar] [CrossRef]
- Plesa, C.; Verschueren, D.; Pud, S.; van der Torre, J.; Ruitenberg, J.W.; Witteveen, M.J.; Jonsson, M.P.; Grosberg, A.Y.; Rabin, Y.; Dekker, C. Direct observation of DNA knots using a solid-state nanopore. Nat. Nanotechnol. 2016, 11, 1093–1097. [Google Scholar] [CrossRef] [PubMed] [Green Version]
- Plesa, C.; Ruitenberg, J.W.; Witteveen, M.J.; Dekker, C. Detection of Individual Proteins Bound along DNA Using Solid-State Nanopores. Nano Lett. 2015, 15, 3153–3158. [Google Scholar] [CrossRef] [PubMed]
- Kumar Sharma, R.; Agrawal, I.; Dai, L.; Doyle, P.S.; Garaj, S. Complex DNA knots detected with a nanopore sensor. Nat. Commun. 2019, 10, 4473. [Google Scholar] [CrossRef]
- Mara, A.; Siwy, Z.; Trautmann, C.; Wan, J.; Kamme, F. An Asymmetric Polymer Nanopore for Single Molecule Detection. Nano Lett. 2004, 4, 497–501. [Google Scholar] [CrossRef]
- Cabello-Aguilar, S.; Balme, S.; Chaaya, A.A.; Bechelany, M.; Balanzat, E.; Janot, J.-M.; Pochat-Bohatier, C.; Miele, P.; Dejardin, P. Slow translocation of polynucleotides and their discrimination by α-hemolysin inside a single track-etched nanopore designed by atomic layer deposition. Nanoscale 2013, 5, 9582–9586. [Google Scholar] [CrossRef]
- Harrell, C.C.; Choi, Y.; Horne, L.P.; Baker, L.A.; Siwy, Z.S.; Martin, C.R. Resistive-pulse DNA detection with a conical nanopore sensor. Langmuir 2006, 22, 10837–10843. [Google Scholar] [CrossRef]
- Thangaraj, V.; Lepoitevin, M.; Smietana, M.; Balanzat, E.; Bechelany, M.; Janot, J.-M.; Vasseur, J.-J.; Subramanian, S.; Balme, S. Detection of short ssDNA and dsDNA by current-voltage measurements using conical nanopores coated with Al2O3 by atomic layer deposition. Microchim. Acta 2016, 183, 1011–1017. [Google Scholar] [CrossRef]
- Kececi, K.; San, N.; Kaya, D. Nanopore detection of double stranded DNA using a track-etched polycarbonate membrane. Talanta 2015, 144, 268–274. [Google Scholar] [CrossRef] [PubMed]
- Kaya, D.; Dinler, A.; San, N.; Kececi, K. Effect of Pore Geometry on Resistive-Pulse Sensing of DNA Using Track-Etched PET Nanopore Membrane. Electrochim. Acta 2016, 202, 157–165. [Google Scholar] [CrossRef]
- Giamblanco, N.; Fichou, Y.; Janot, J.-M.; Balanzat, E.; Han, S.; Balme, S. Mechanisms of Heparin-Induced Tau Aggregation Revealed by a Single Nanopore. ACS Sens. 2020, 5, 1158–1167. [Google Scholar] [CrossRef] [PubMed]
- Zhang, Y.; Chen, X.; Wang, C.; Roozbahani, G.M.; Chang, H.-C.; Guan, X. Chemically functionalized conical PET nanopore for protein detection at the single-molecule level. Biosens. Bioelectron. 2020, 165, 112289. [Google Scholar] [CrossRef]
- Namuduri, S.; Narayanan, B.N.; Davuluru, V.S.P.; Burton, L.; Bhansali, S. Review—Deep Learning Methods for Sensor Based Predictive Maintenance and Future Perspectives for Electrochemical Sensors. J. Electrochem. Soc. 2020, 167, 37552. [Google Scholar] [CrossRef]
- Gonzalez-Navarro, F.F.; Stilianova-Stoytcheva, M.; Renteria-Gutierrez, L.; Belanche-Muñoz, L.A.; Flores-Rios, B.L.; Ibarra-Esquer, J.E. Glucose Oxidase Biosensor Modeling and Predictors Optimization by Machine Learning Methods. Sensors 2016, 16, 1483. [Google Scholar] [CrossRef] [Green Version]
- LaPierre, N.; Egan, R.; Wang, W.; Wang, Z. De novo Nanopore read quality improvement using deep learning. BMC Bioinform. 2019, 20, 552. [Google Scholar] [CrossRef] [Green Version]
- Smith, M.A.; Ersavas, T.; Ferguson, J.M.; Liu, H.; Lucas, M.C.; Begik, O.; Bojarski, L.; Barton, K.; Novoa, E.M. Barcoding and demultiplexing Oxford Nanopore native RNA sequencing reads with deep residual learning. BioRxiv 2019. [Google Scholar] [CrossRef] [Green Version]
- Zeng, J.; Cai, H.; Peng, H.; Wang, H.; Zhang, Y.; Akutsu, T. Causalcall: Nanopore Basecalling Using a Temporal Convolutional Network. Front. Genet. 2019, 10, 1332. [Google Scholar] [CrossRef] [Green Version]
- Landry, M.; Winters-Hilt, S. Analysis of nanopore detector measurements using Machine-Learning methods, with application to single-molecule kinetic analysis. BMC Bioinform. 2007, 8, 12. [Google Scholar] [CrossRef] [Green Version]
- Winters-Hilt, S.; Landry, M.; Akeson, M.; Tanase, M.; Amin, I.; Coombs, A.; Morales, E.; Millet, J.; Baribault, C.; Sendamangalam, S. Cheminformatics methods for novel nanopore analysis of HIV DNA termini. BMC Bioinform. 2006, 7, 22. [Google Scholar] [CrossRef] [PubMed] [Green Version]
- Vercoutere, W.; Winters-Hilt, S.; Olsen, H.; Deamer, D.; Haussler, D.; Akeson, M. Rapid discrimination among individual DNA hairpin molecules at single-nucleotide resolution using an ion channel. Nat. Biotechnol. 2001, 19, 248–252. [Google Scholar] [CrossRef] [PubMed]
- Nivala, J.; Mulroney, L.; Li, G.; Schreiber, J.; Akeson, M. Discrimination among protein variants using an unfoldase-coupled nanopore. ACS Nano 2014, 8, 12365–12375. [Google Scholar] [CrossRef] [PubMed]
- Liu, Q.; Fang, L.; Yu, G.; Wang, D.; Xiao, C.-L.; Wang, K. Detection of DNA base modifications by deep recurrent neural network on Oxford Nanopore sequencing data. Nat. Commun. 2019, 10, 2449. [Google Scholar] [CrossRef] [PubMed] [Green Version]
- Wescoe, Z.L.; Schreiber, J.; Akeson, M. Nanopores discriminate among five C5-cytosine variants in DNA. J. Am. Chem. Soc. 2014, 136, 16582–16587. [Google Scholar] [CrossRef] [Green Version]
- Lepoitevin, M.; Jamilloux, B.; Bechelany, M.; Balanzat, E.; Janot, J.-M.; Balme, S. Fast and reversible functionalization of a single nanopore based on layer-by-layer polyelectrolyte self-assembly for tuning current rectification and designing sensors. RSC Adv. 2016, 6, 32228–32233. [Google Scholar] [CrossRef]
- Bayley, H.; Martin, C.R. Resistive-Pulse Sensing-From Microbes to Molecules. Chem. Rev. 2000, 100, 2575–2594. [Google Scholar] [CrossRef]
- Luo, L.; German, S.R.; Lan, W.-J.; Holden, D.A.; Mega, T.L.; White, H.S. Resistive-pulse analysis of nanoparticles. Annu. Rev. Anal. Chem. (Palo Alto Calif.) 2014, 7, 513–535. [Google Scholar] [CrossRef]
- DeBlois, R.W.; Bean, C.P. Counting and Sizing of Submicron Particles by the Resistive Pulse Technique. Rev. Sci. Instrum. 1970, 41, 909–916. [Google Scholar] [CrossRef]
- Holden, D.A.; Watkins, J.J.; White, H.S. Resistive-pulse detection of multilamellar liposomes. Langmuir 2012, 28, 7572–7577. [Google Scholar] [CrossRef]
- Yang, L.; Yamamoto, T. Quantification of Virus Particles Using Nanopore-Based Resistive-Pulse Sensing Techniques. Front. Microbiol. 2016, 7, 1500. [Google Scholar] [CrossRef] [PubMed] [Green Version]
- Larkin, J.; Henley, R.Y.; Muthukumar, M.; Rosenstein, J.K.; Wanunu, M. High-bandwidth protein analysis using solid-state nanopores. Biophys. J. 2014, 106, 696–704. [Google Scholar] [CrossRef] [PubMed] [Green Version]
- Storm, A.J.; Storm, C.; Chen, J.; Zandbergen, H.; Joanny, J.-F.; Dekker, C. Fast DNA translocation through a solid-state nanopore. Nano Lett. 2005, 5, 1193–1197. [Google Scholar] [CrossRef] [PubMed] [Green Version]


© 2020 by the authors. Licensee MDPI, Basel, Switzerland. This article is an open access article distributed under the terms and conditions of the Creative Commons Attribution (CC BY) license (http://creativecommons.org/licenses/by/4.0/).
Share and Cite
Meyer, N.; Janot, J.-M.; Lepoitevin, M.; Smietana, M.; Vasseur, J.-J.; Torrent, J.; Balme, S. Machine Learning to Improve the Sensing of Biomolecules by Conical Track-Etched Nanopore. Biosensors 2020, 10, 140. https://0-doi-org.brum.beds.ac.uk/10.3390/bios10100140
Meyer N, Janot J-M, Lepoitevin M, Smietana M, Vasseur J-J, Torrent J, Balme S. Machine Learning to Improve the Sensing of Biomolecules by Conical Track-Etched Nanopore. Biosensors. 2020; 10(10):140. https://0-doi-org.brum.beds.ac.uk/10.3390/bios10100140
Chicago/Turabian StyleMeyer, Nathan, Jean-Marc Janot, Mathilde Lepoitevin, Michaël Smietana, Jean-Jacques Vasseur, Joan Torrent, and Sébastien Balme. 2020. "Machine Learning to Improve the Sensing of Biomolecules by Conical Track-Etched Nanopore" Biosensors 10, no. 10: 140. https://0-doi-org.brum.beds.ac.uk/10.3390/bios10100140