Detection of Lethal Bronzing Disease in Cabbage Palms (Sabal palmetto) Using a Low-Cost Electronic Nose


 ,
,
Abstract
:
1. Introduction
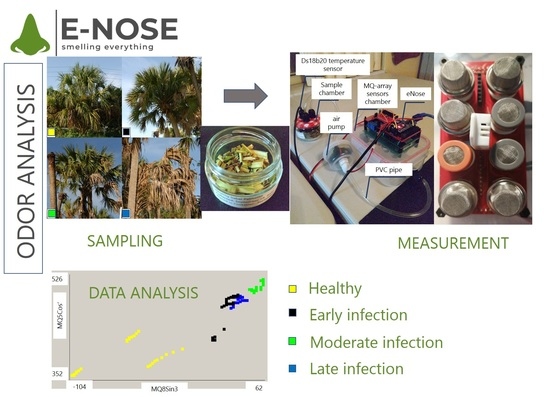
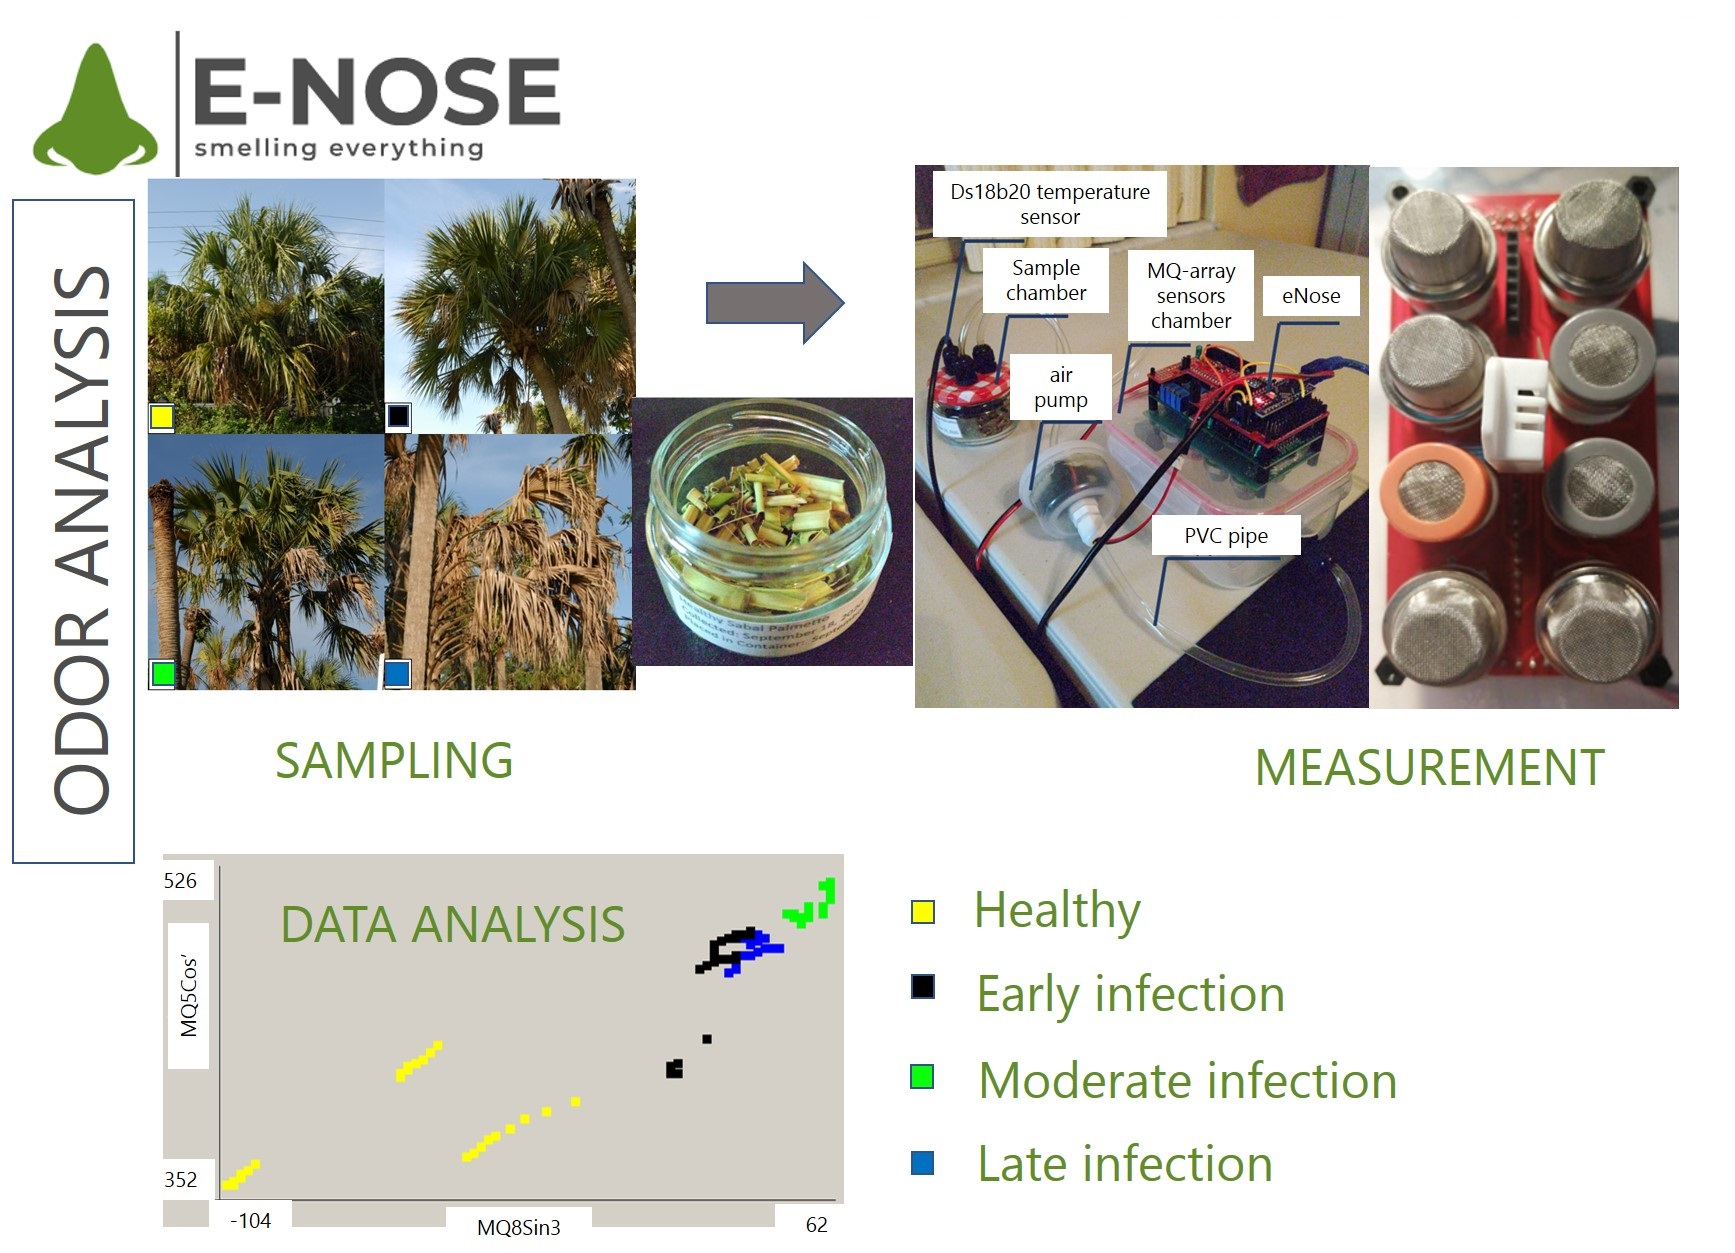
2. Materials and Methods
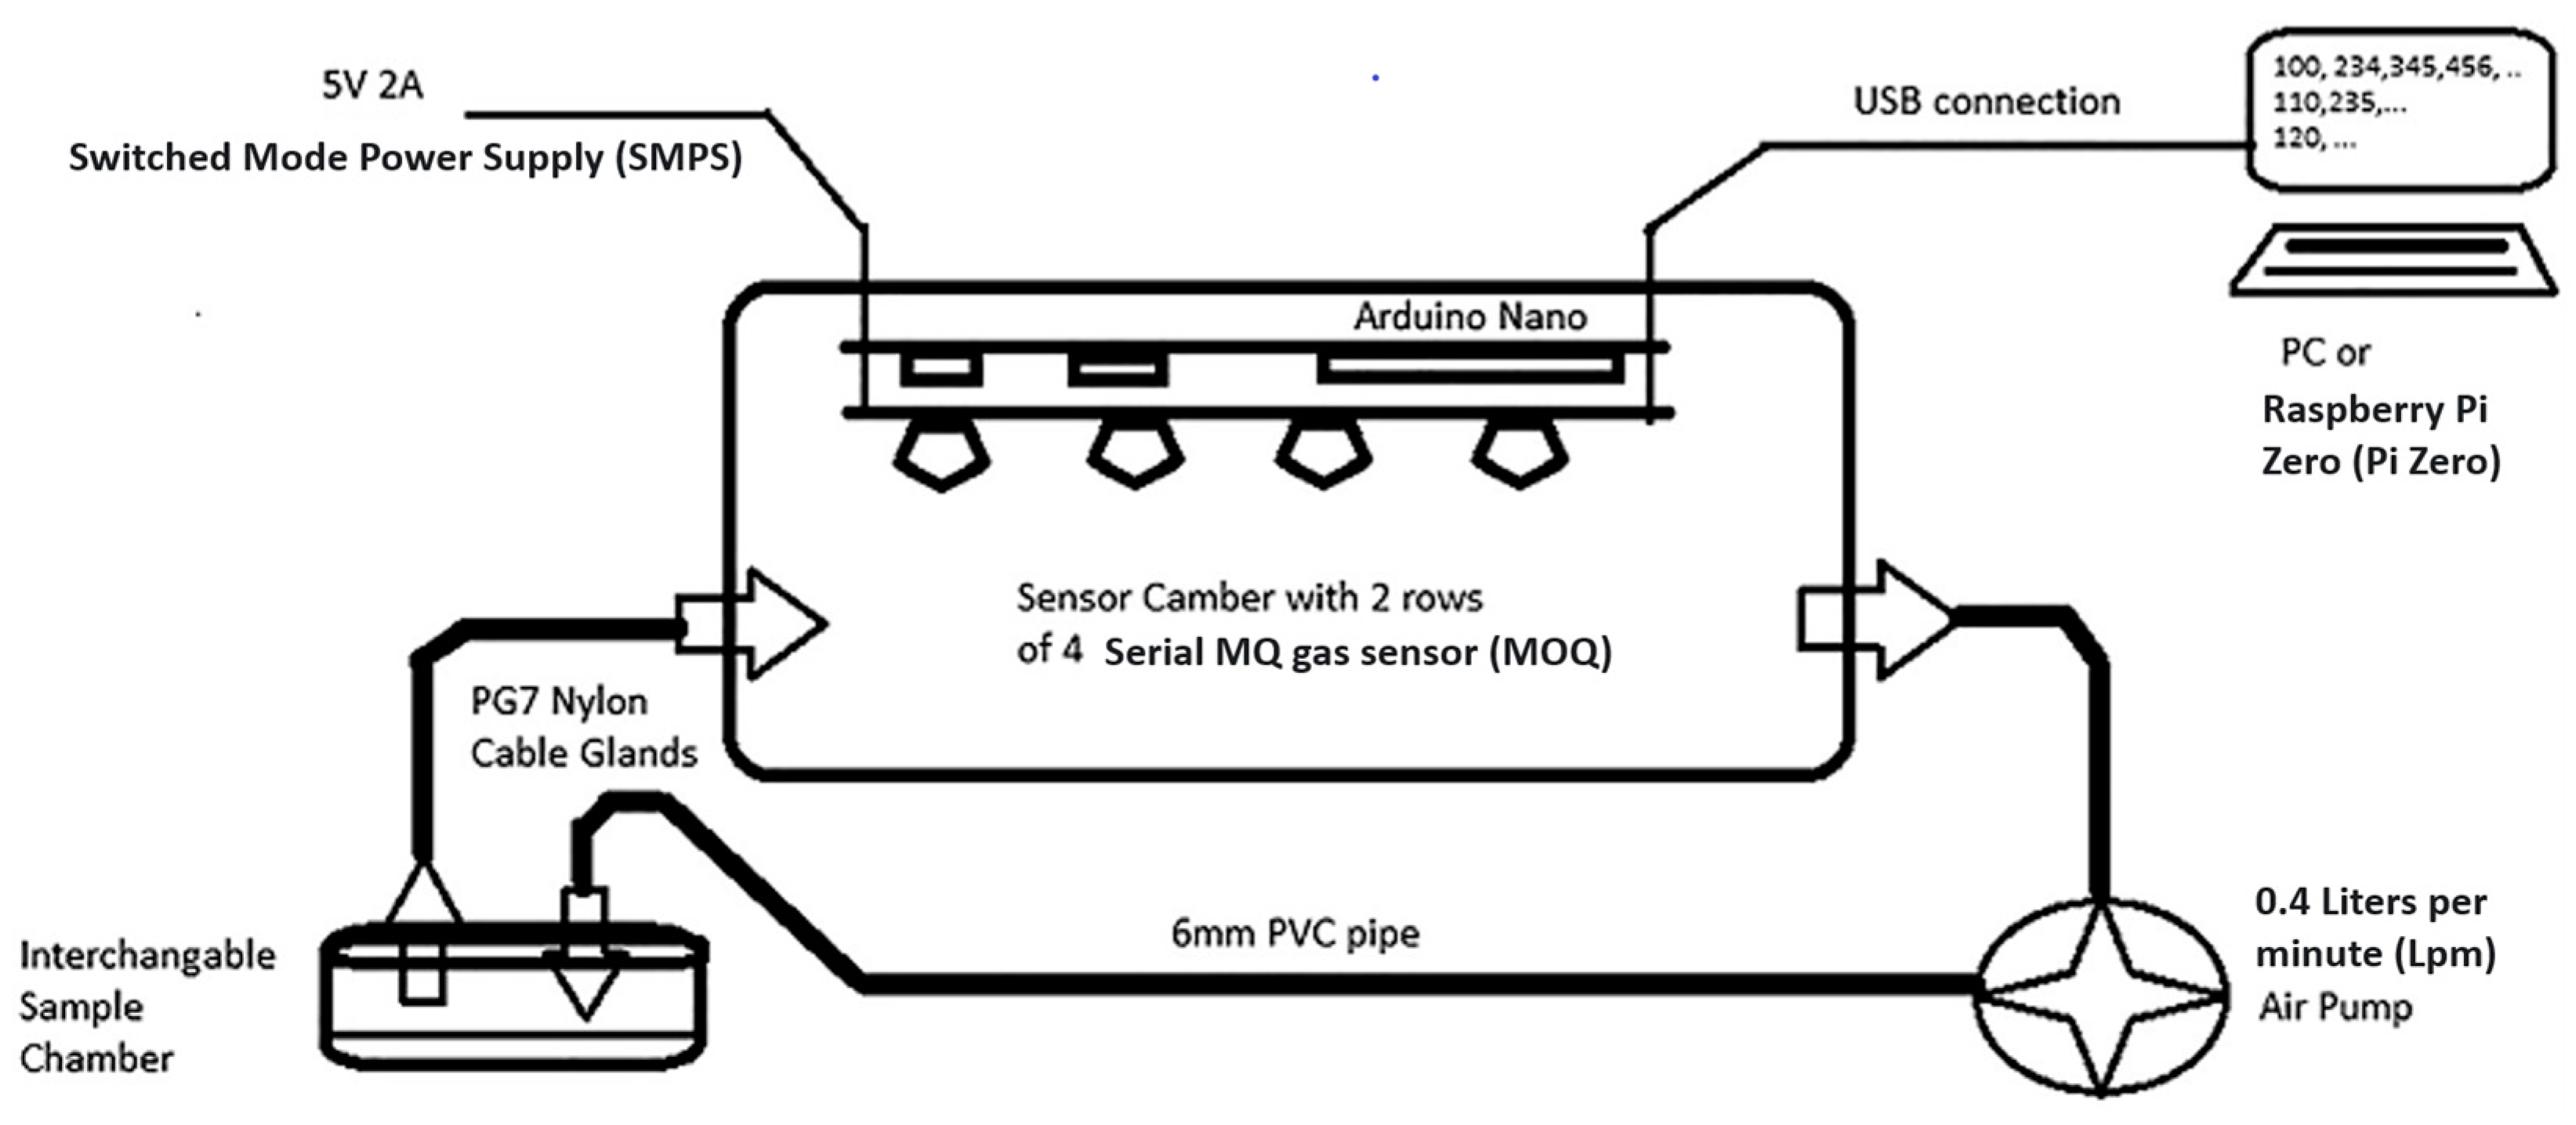
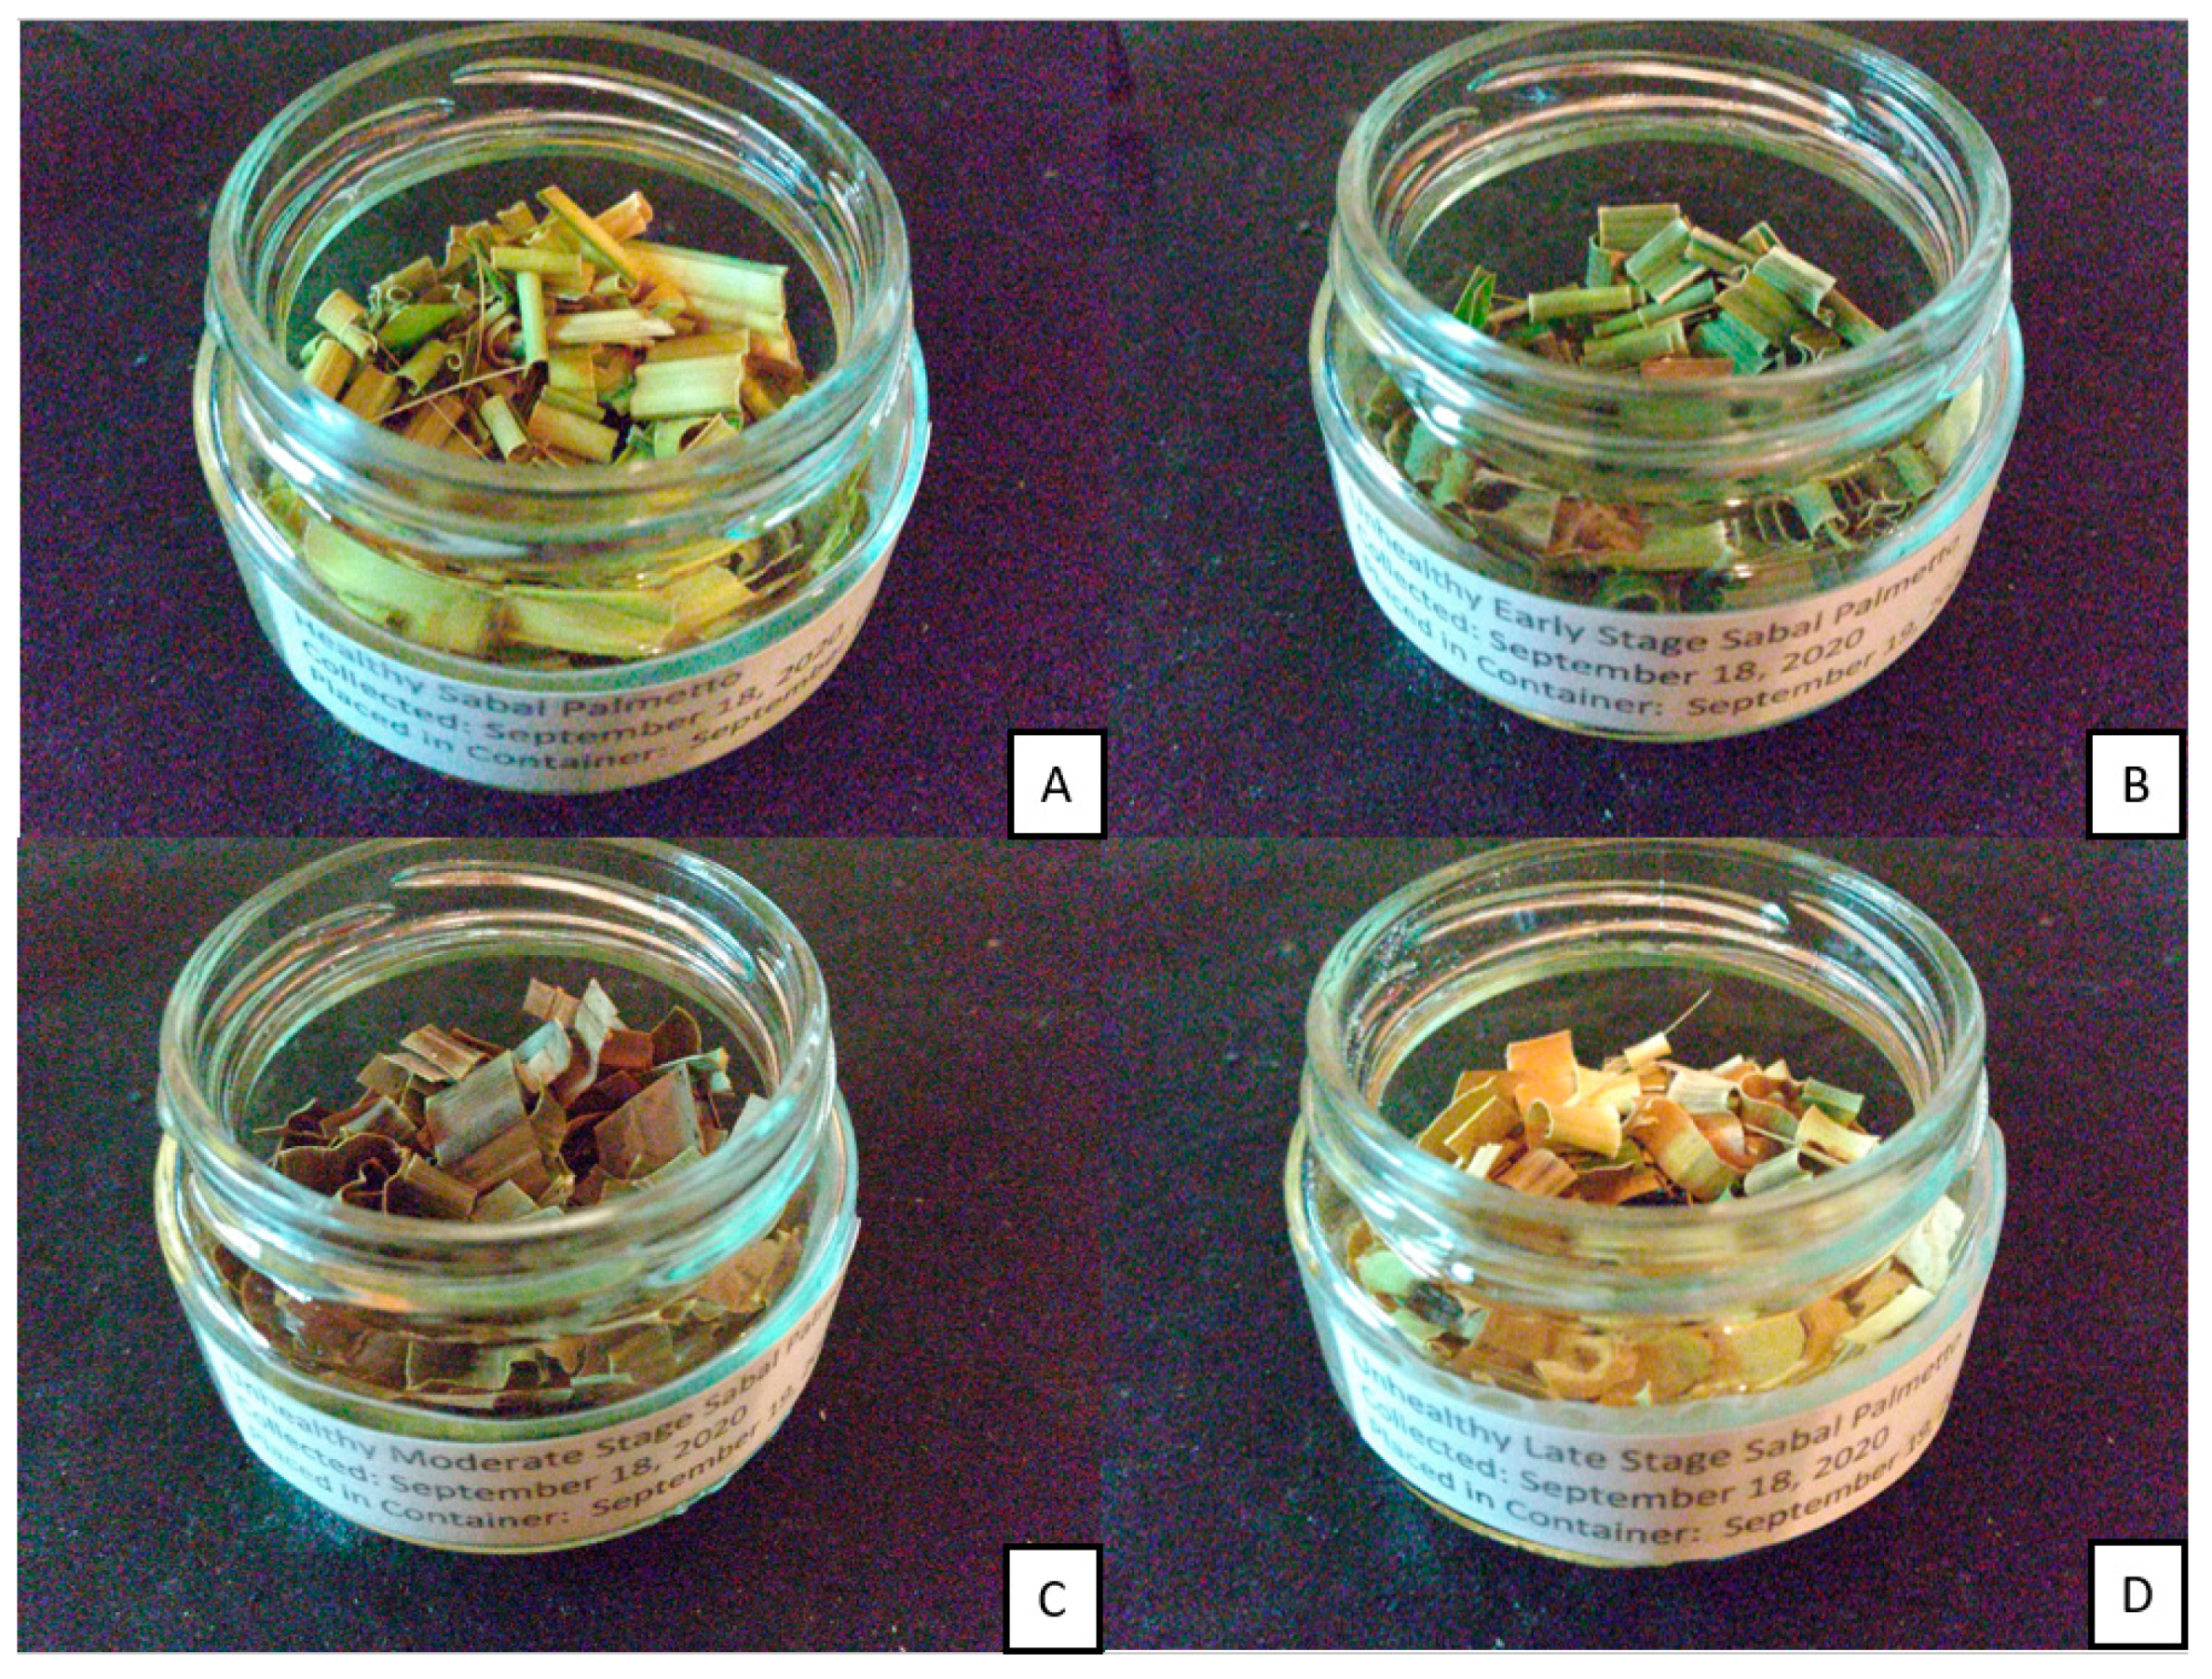
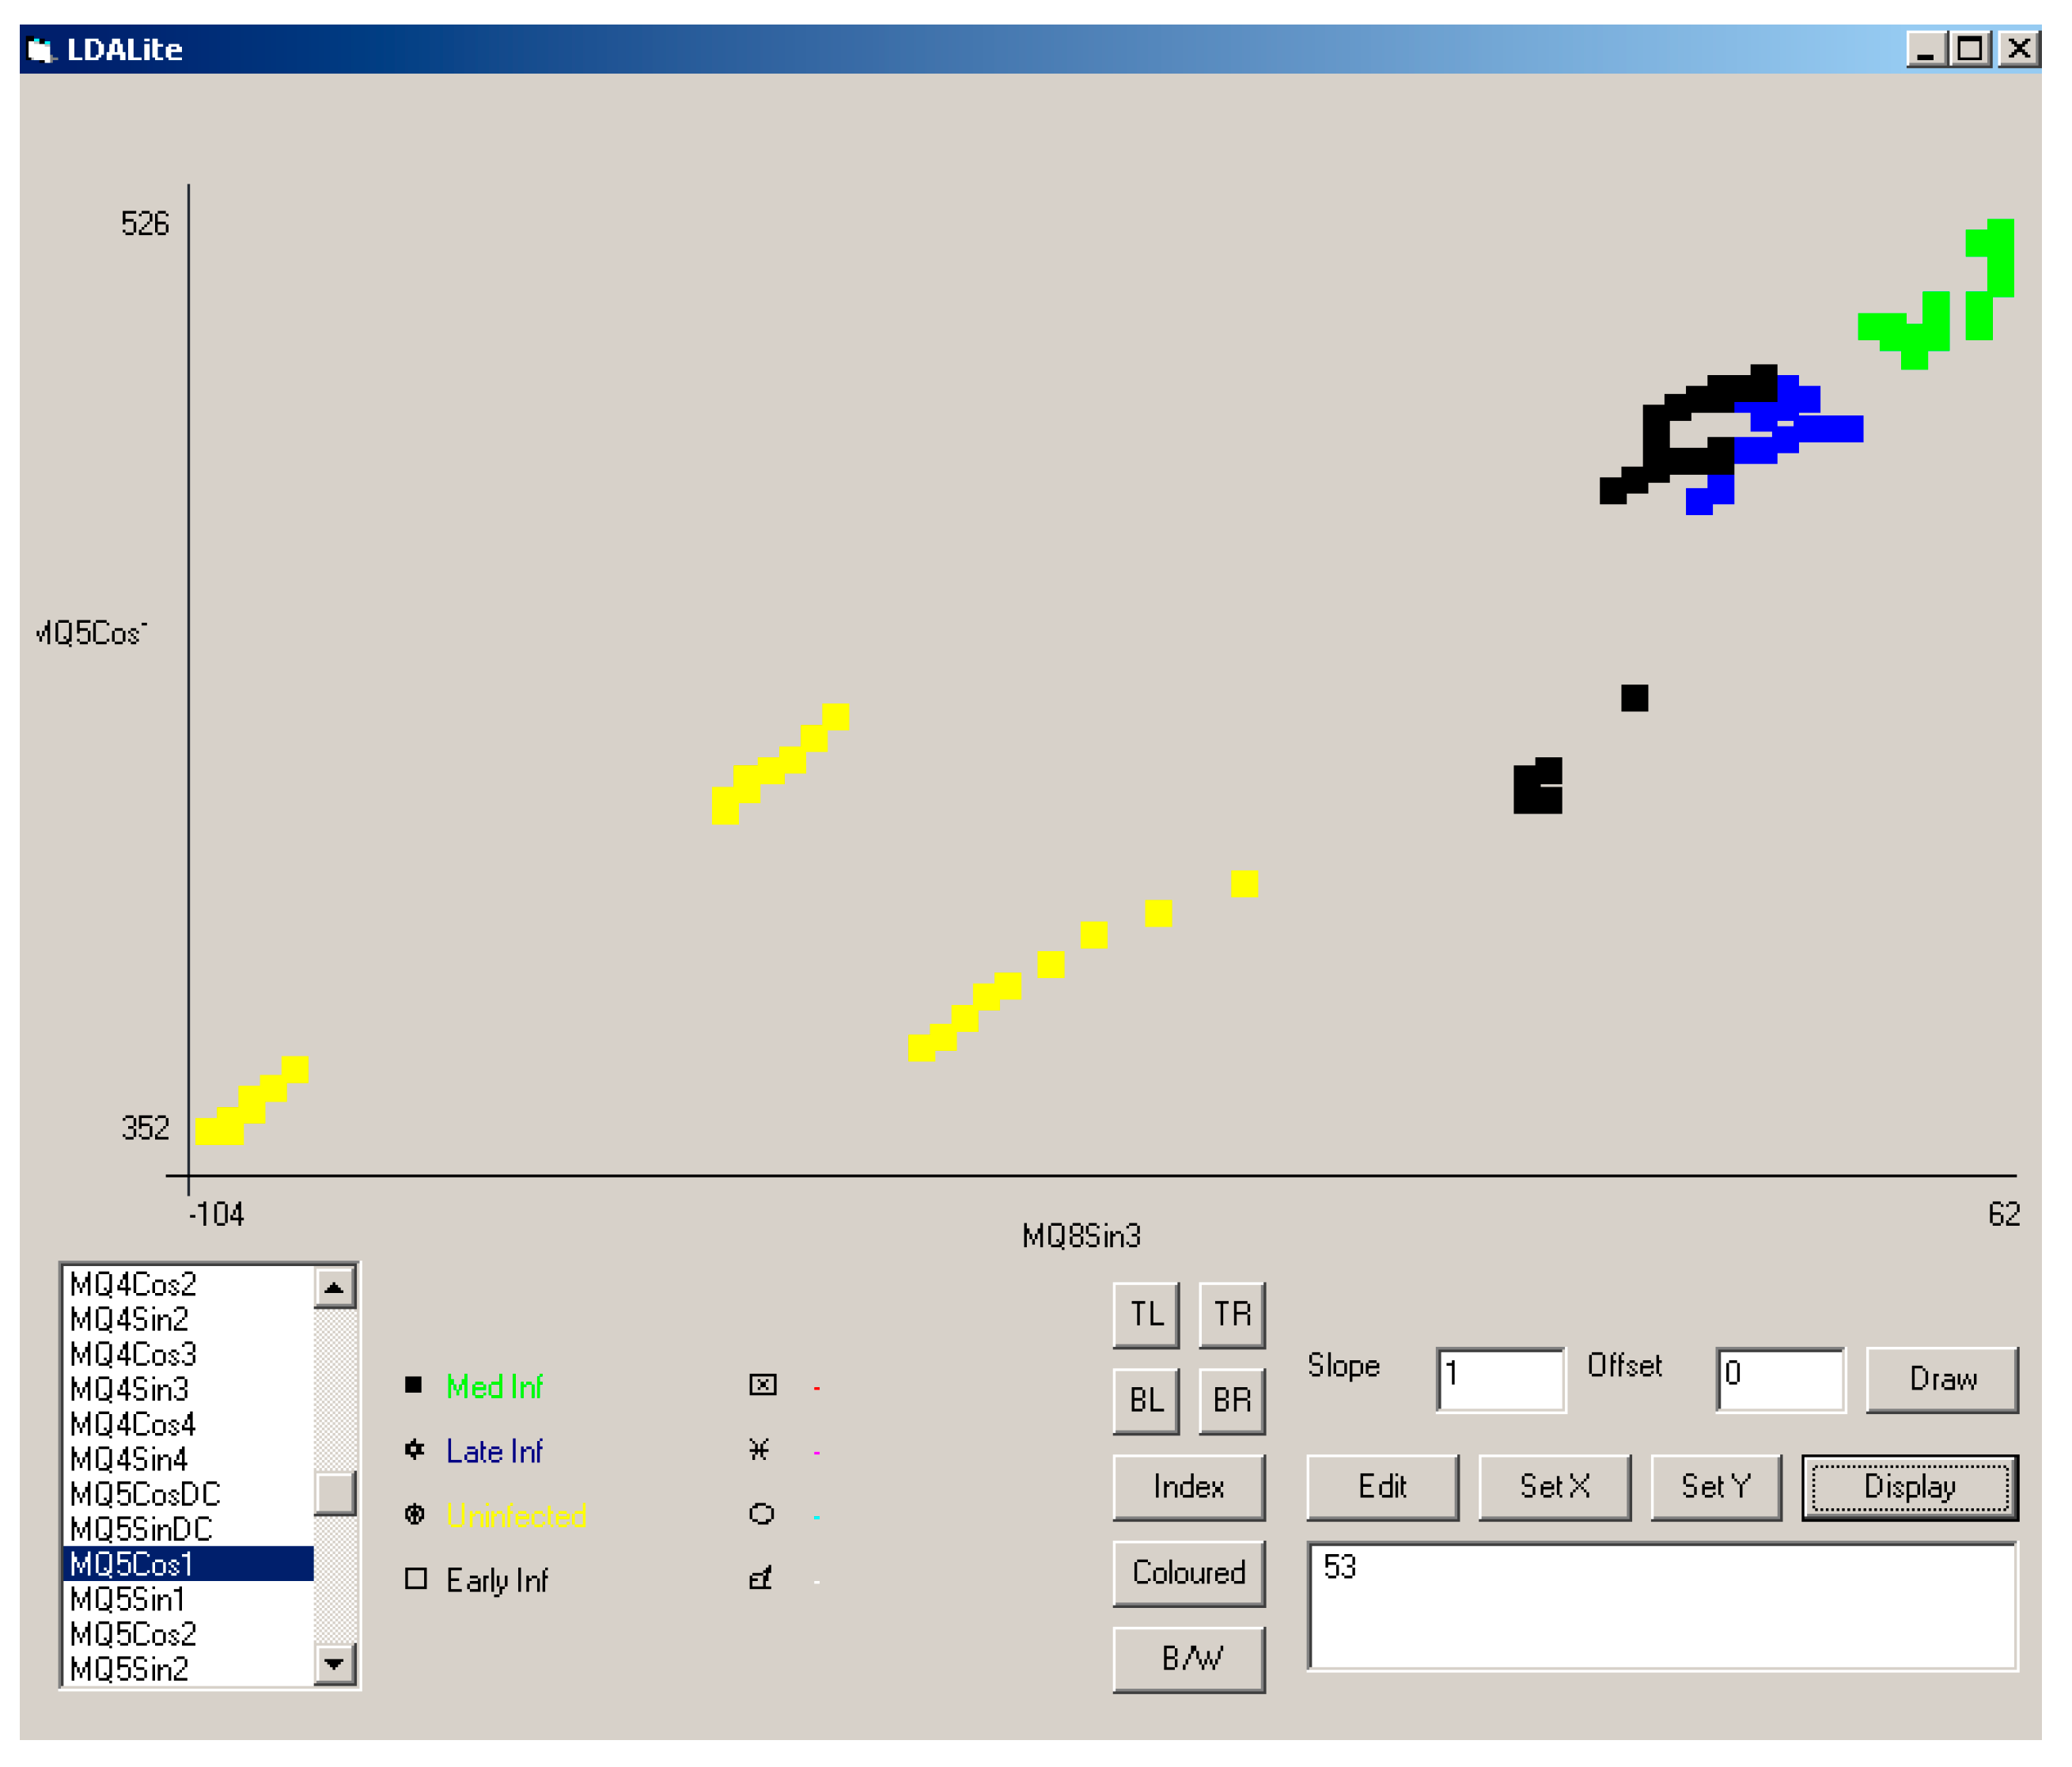
2.1. Sample Selection and Confirmation of Infection Status
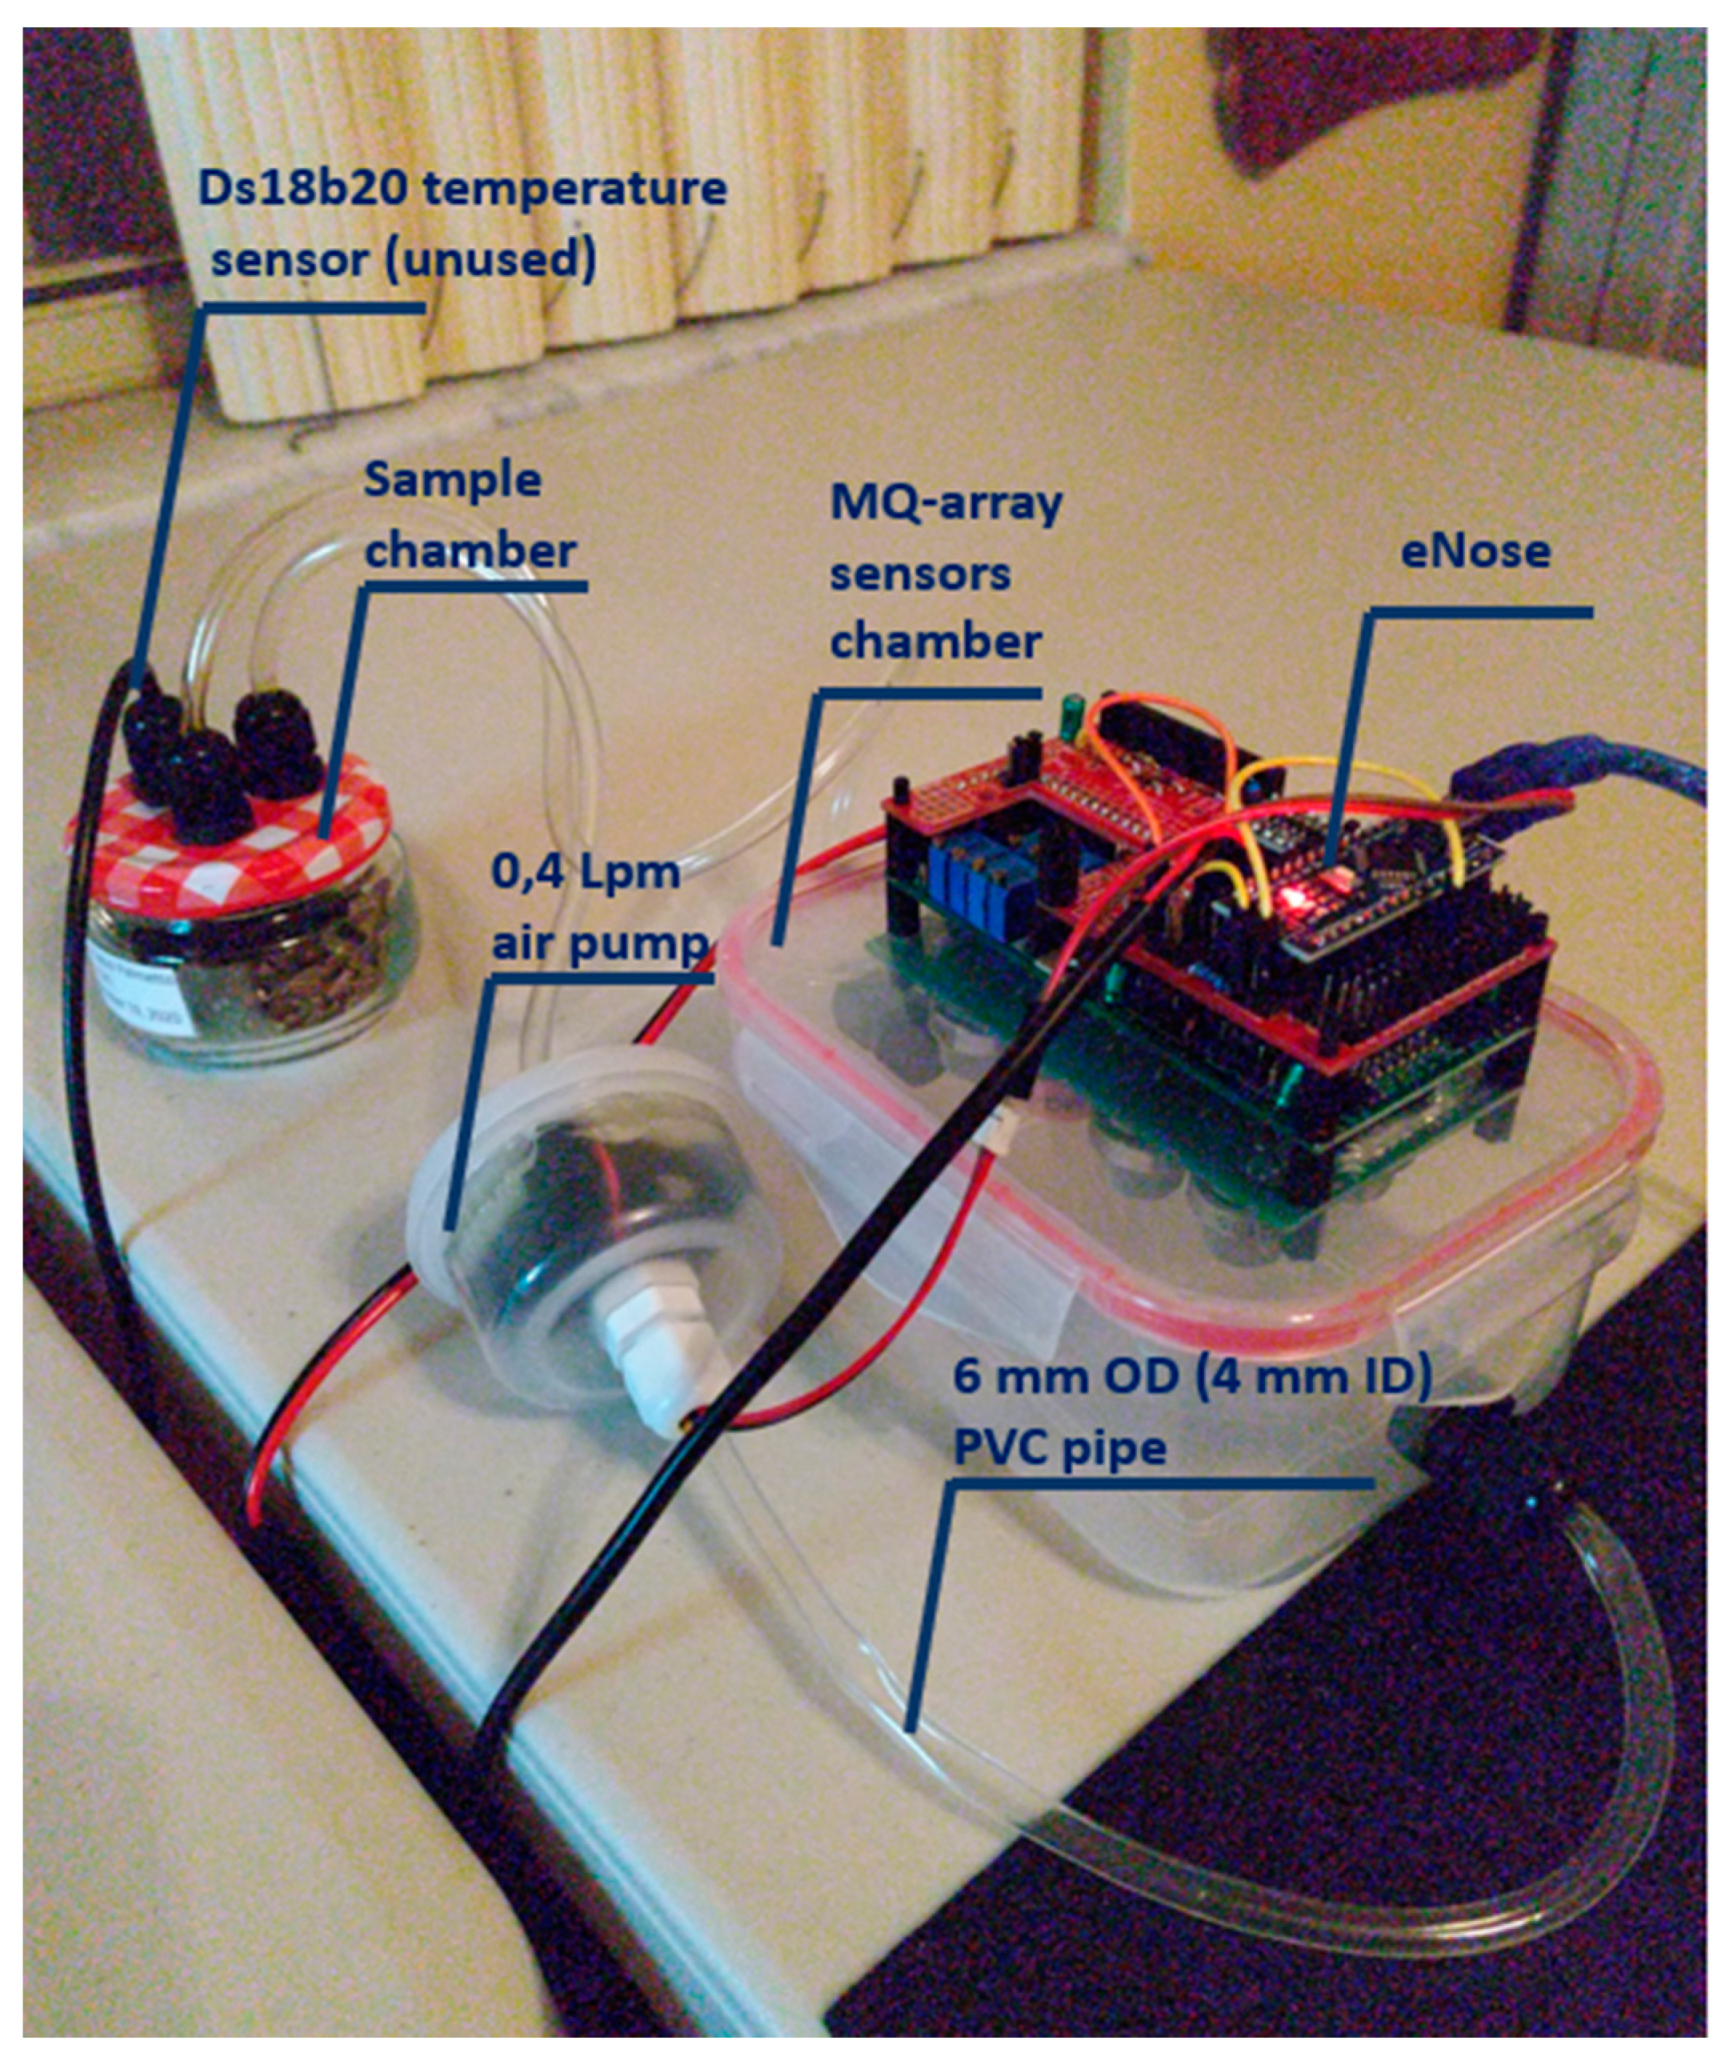
2.2. eNose
2.3. Experiment Condition
2.4. Discrete Fourier Transform (DFT)
2.5. Data Analysis
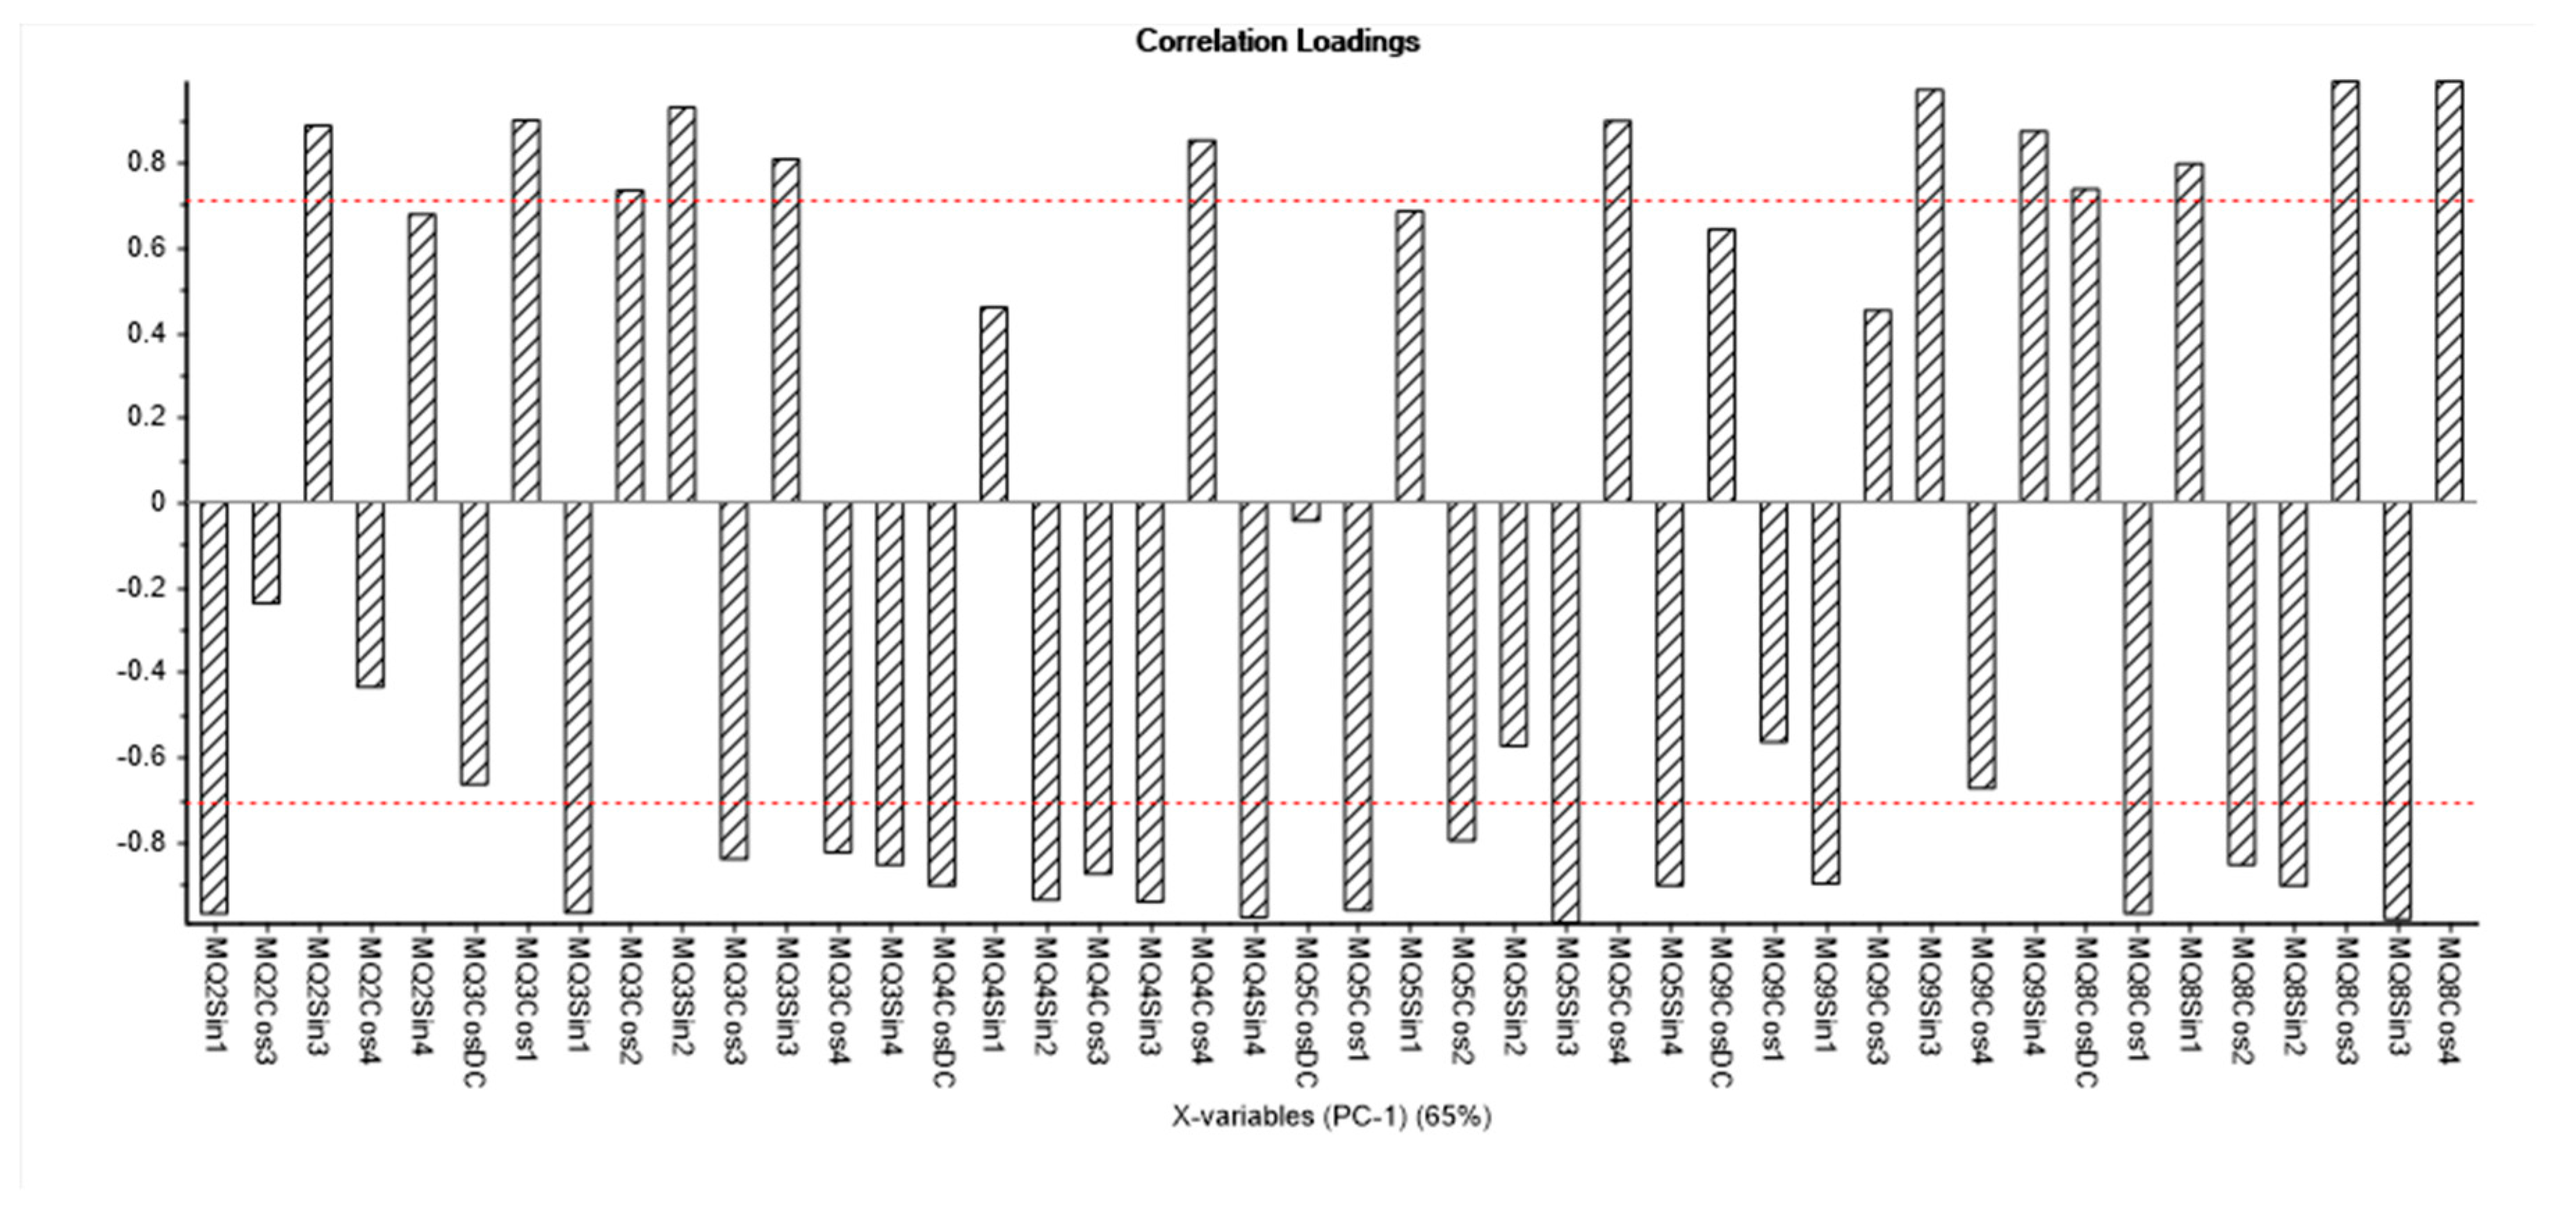
2.6. PCA
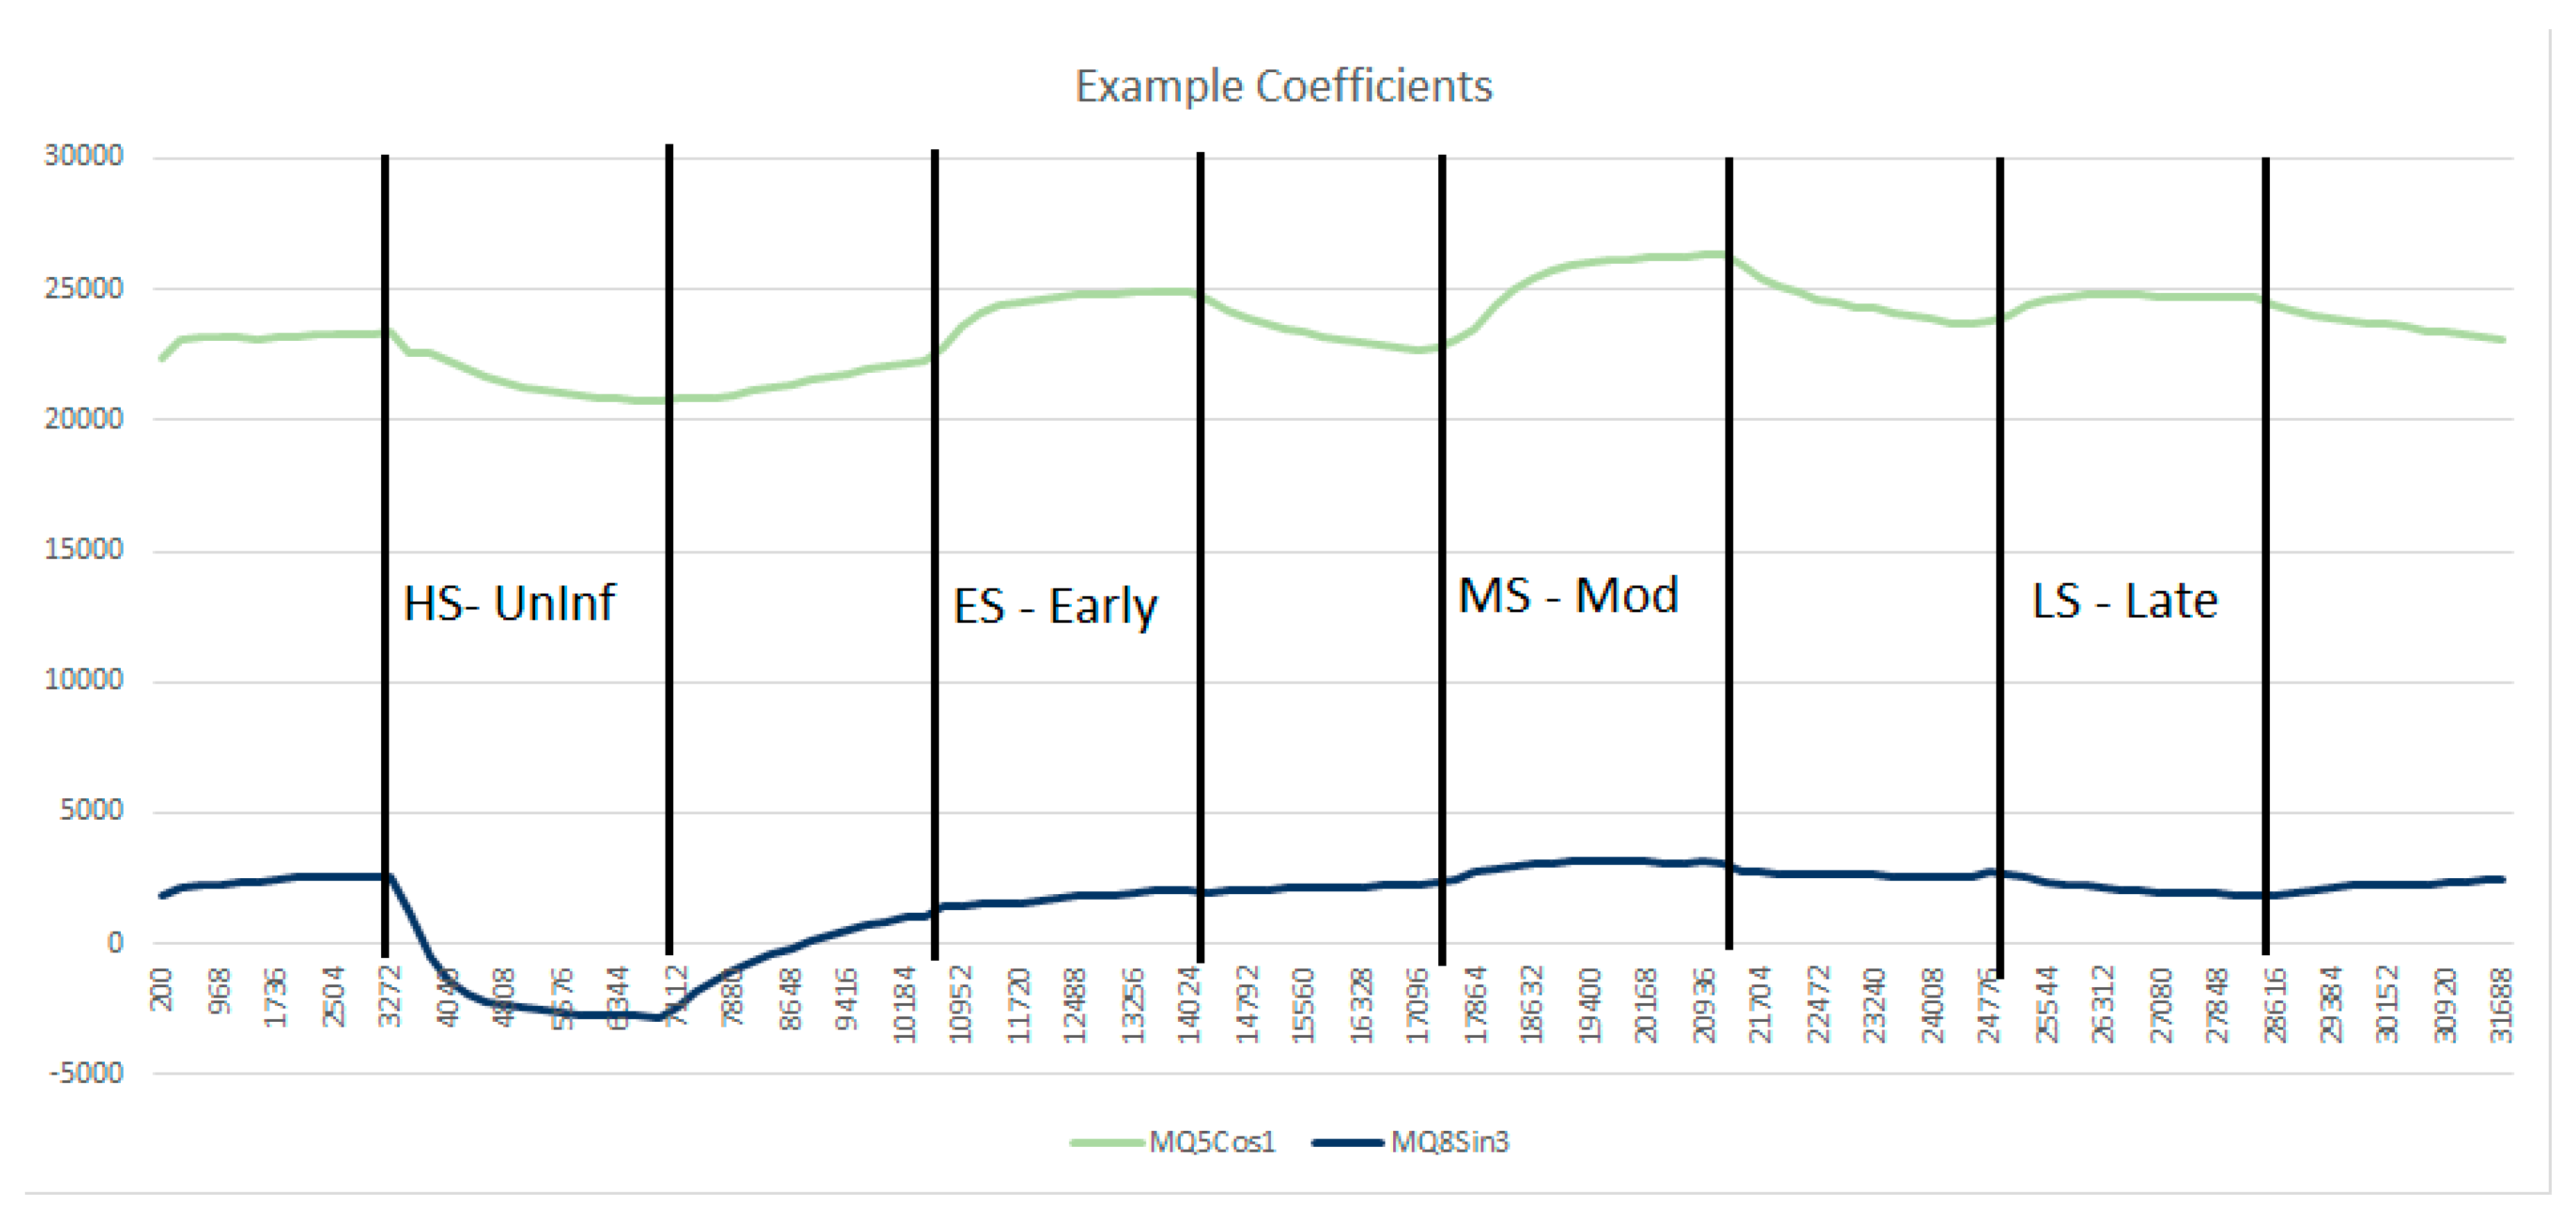
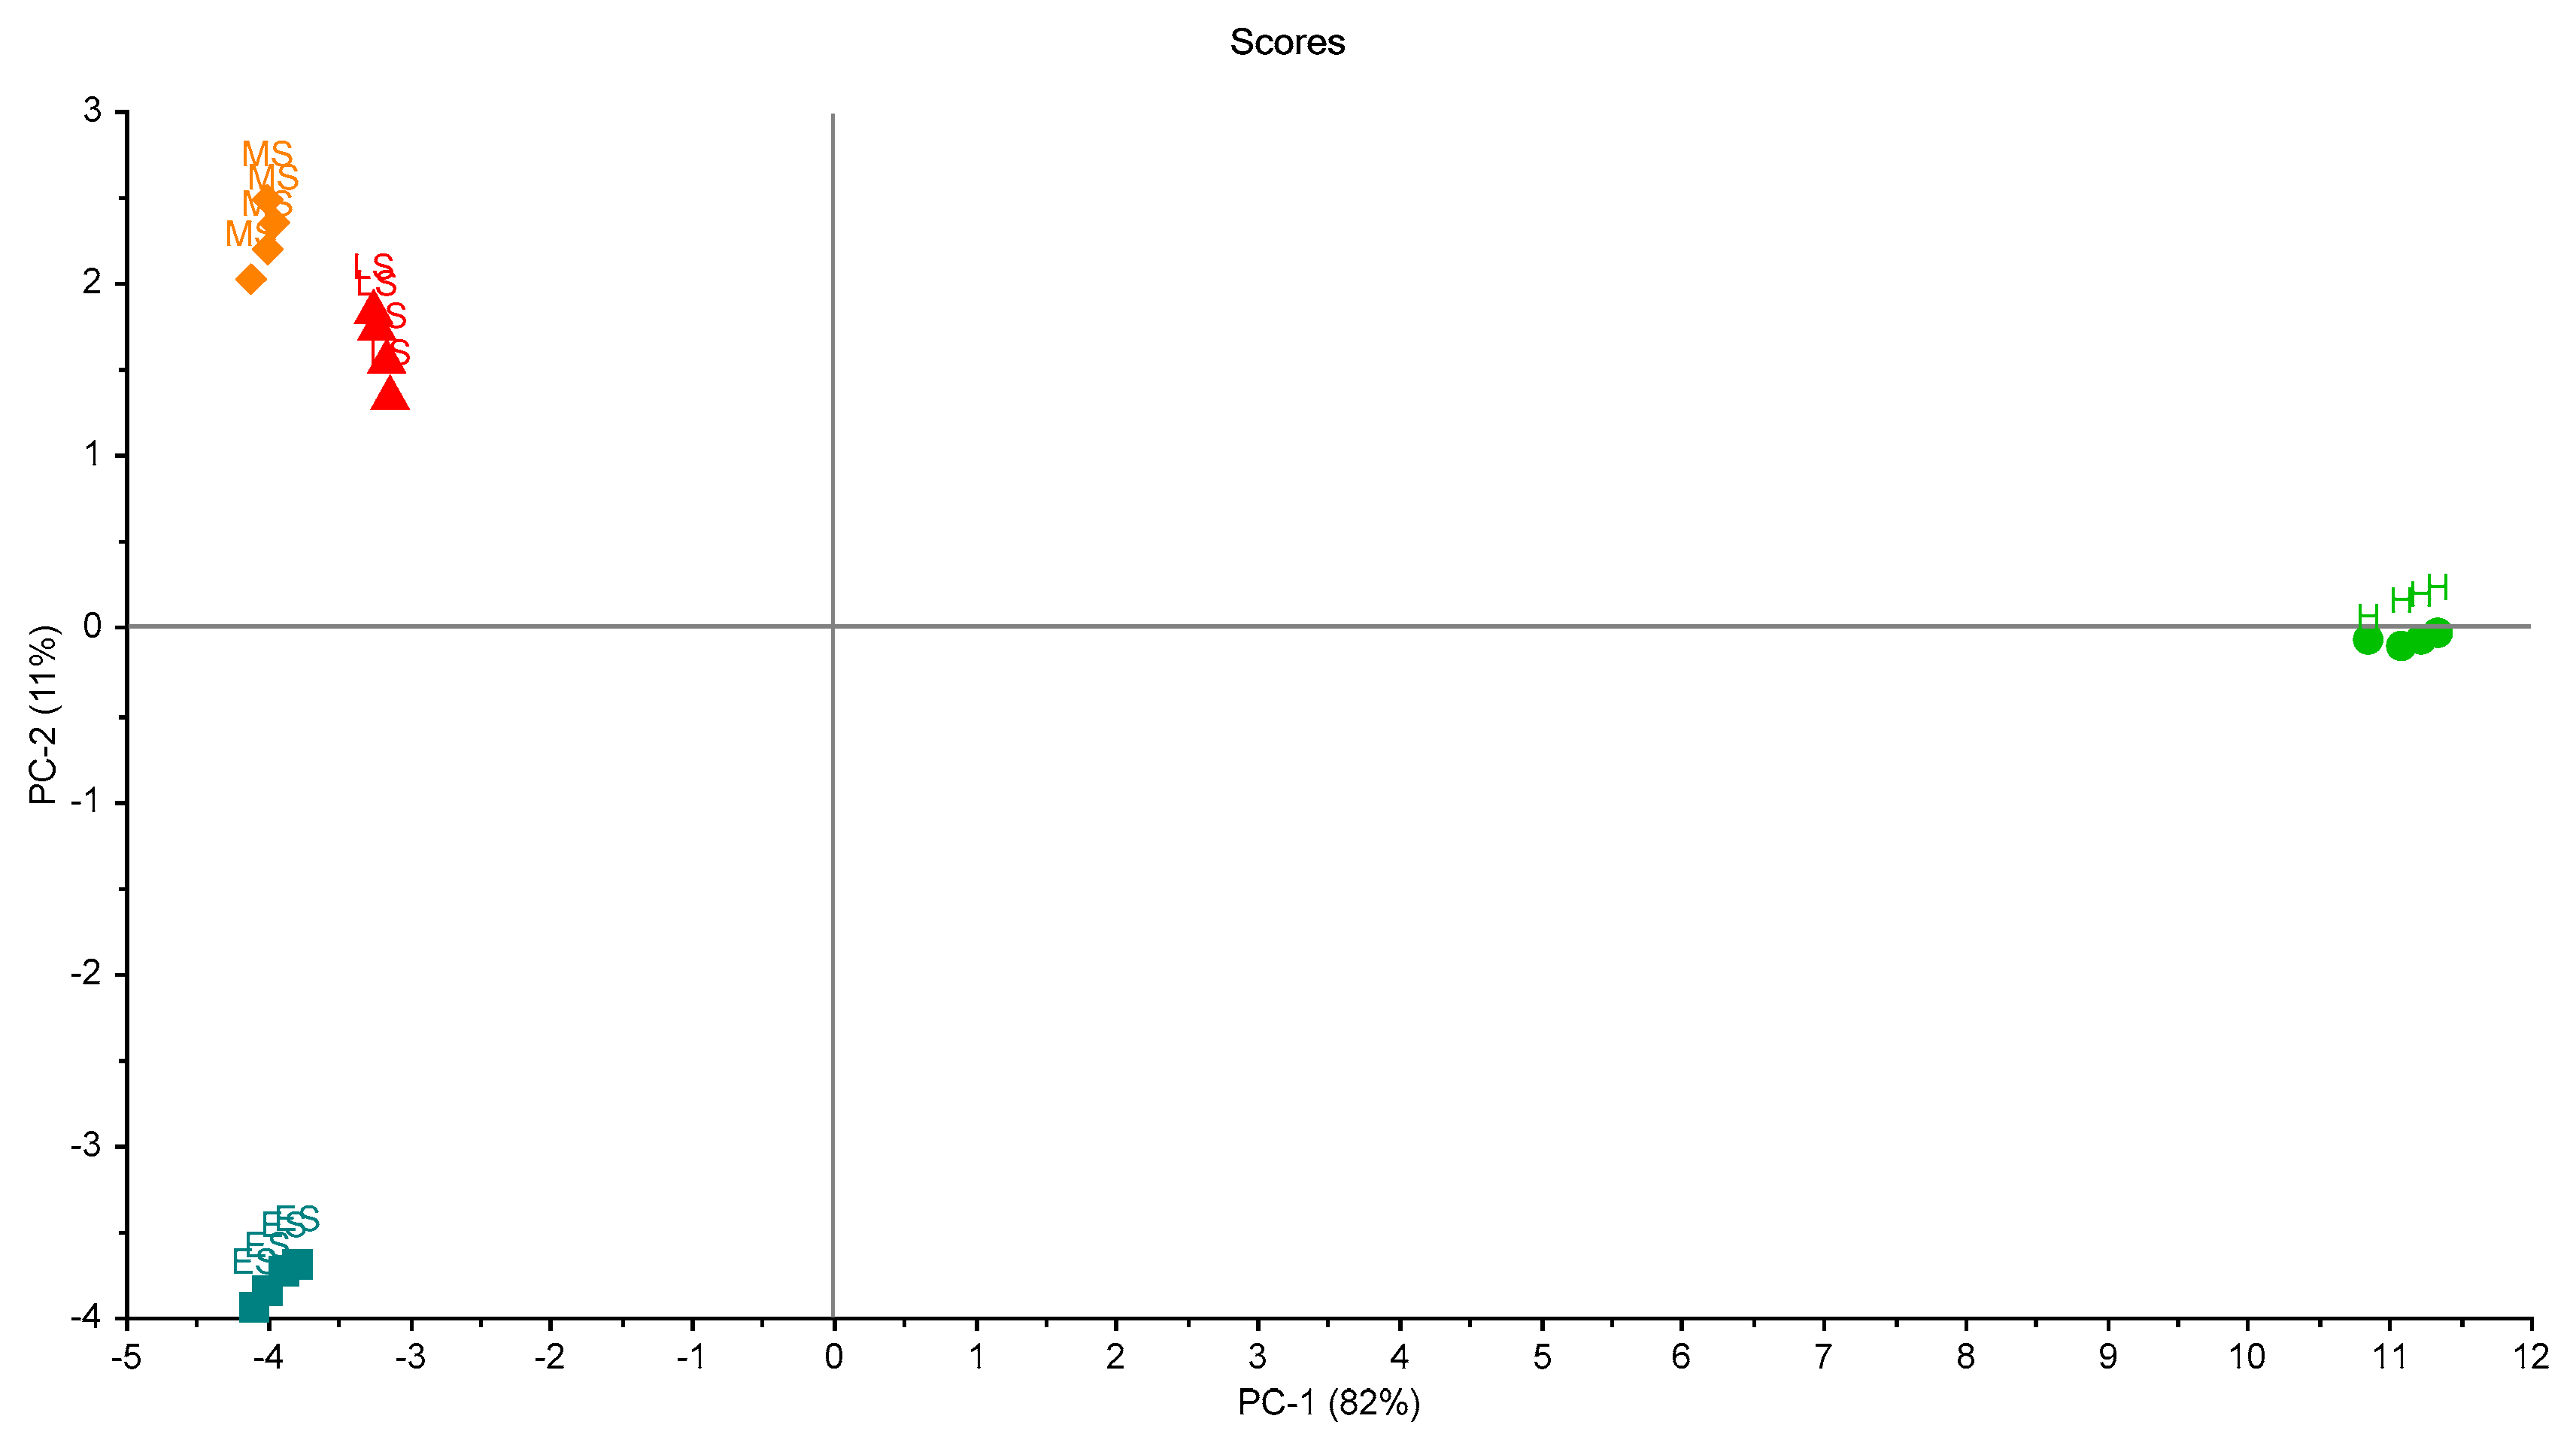
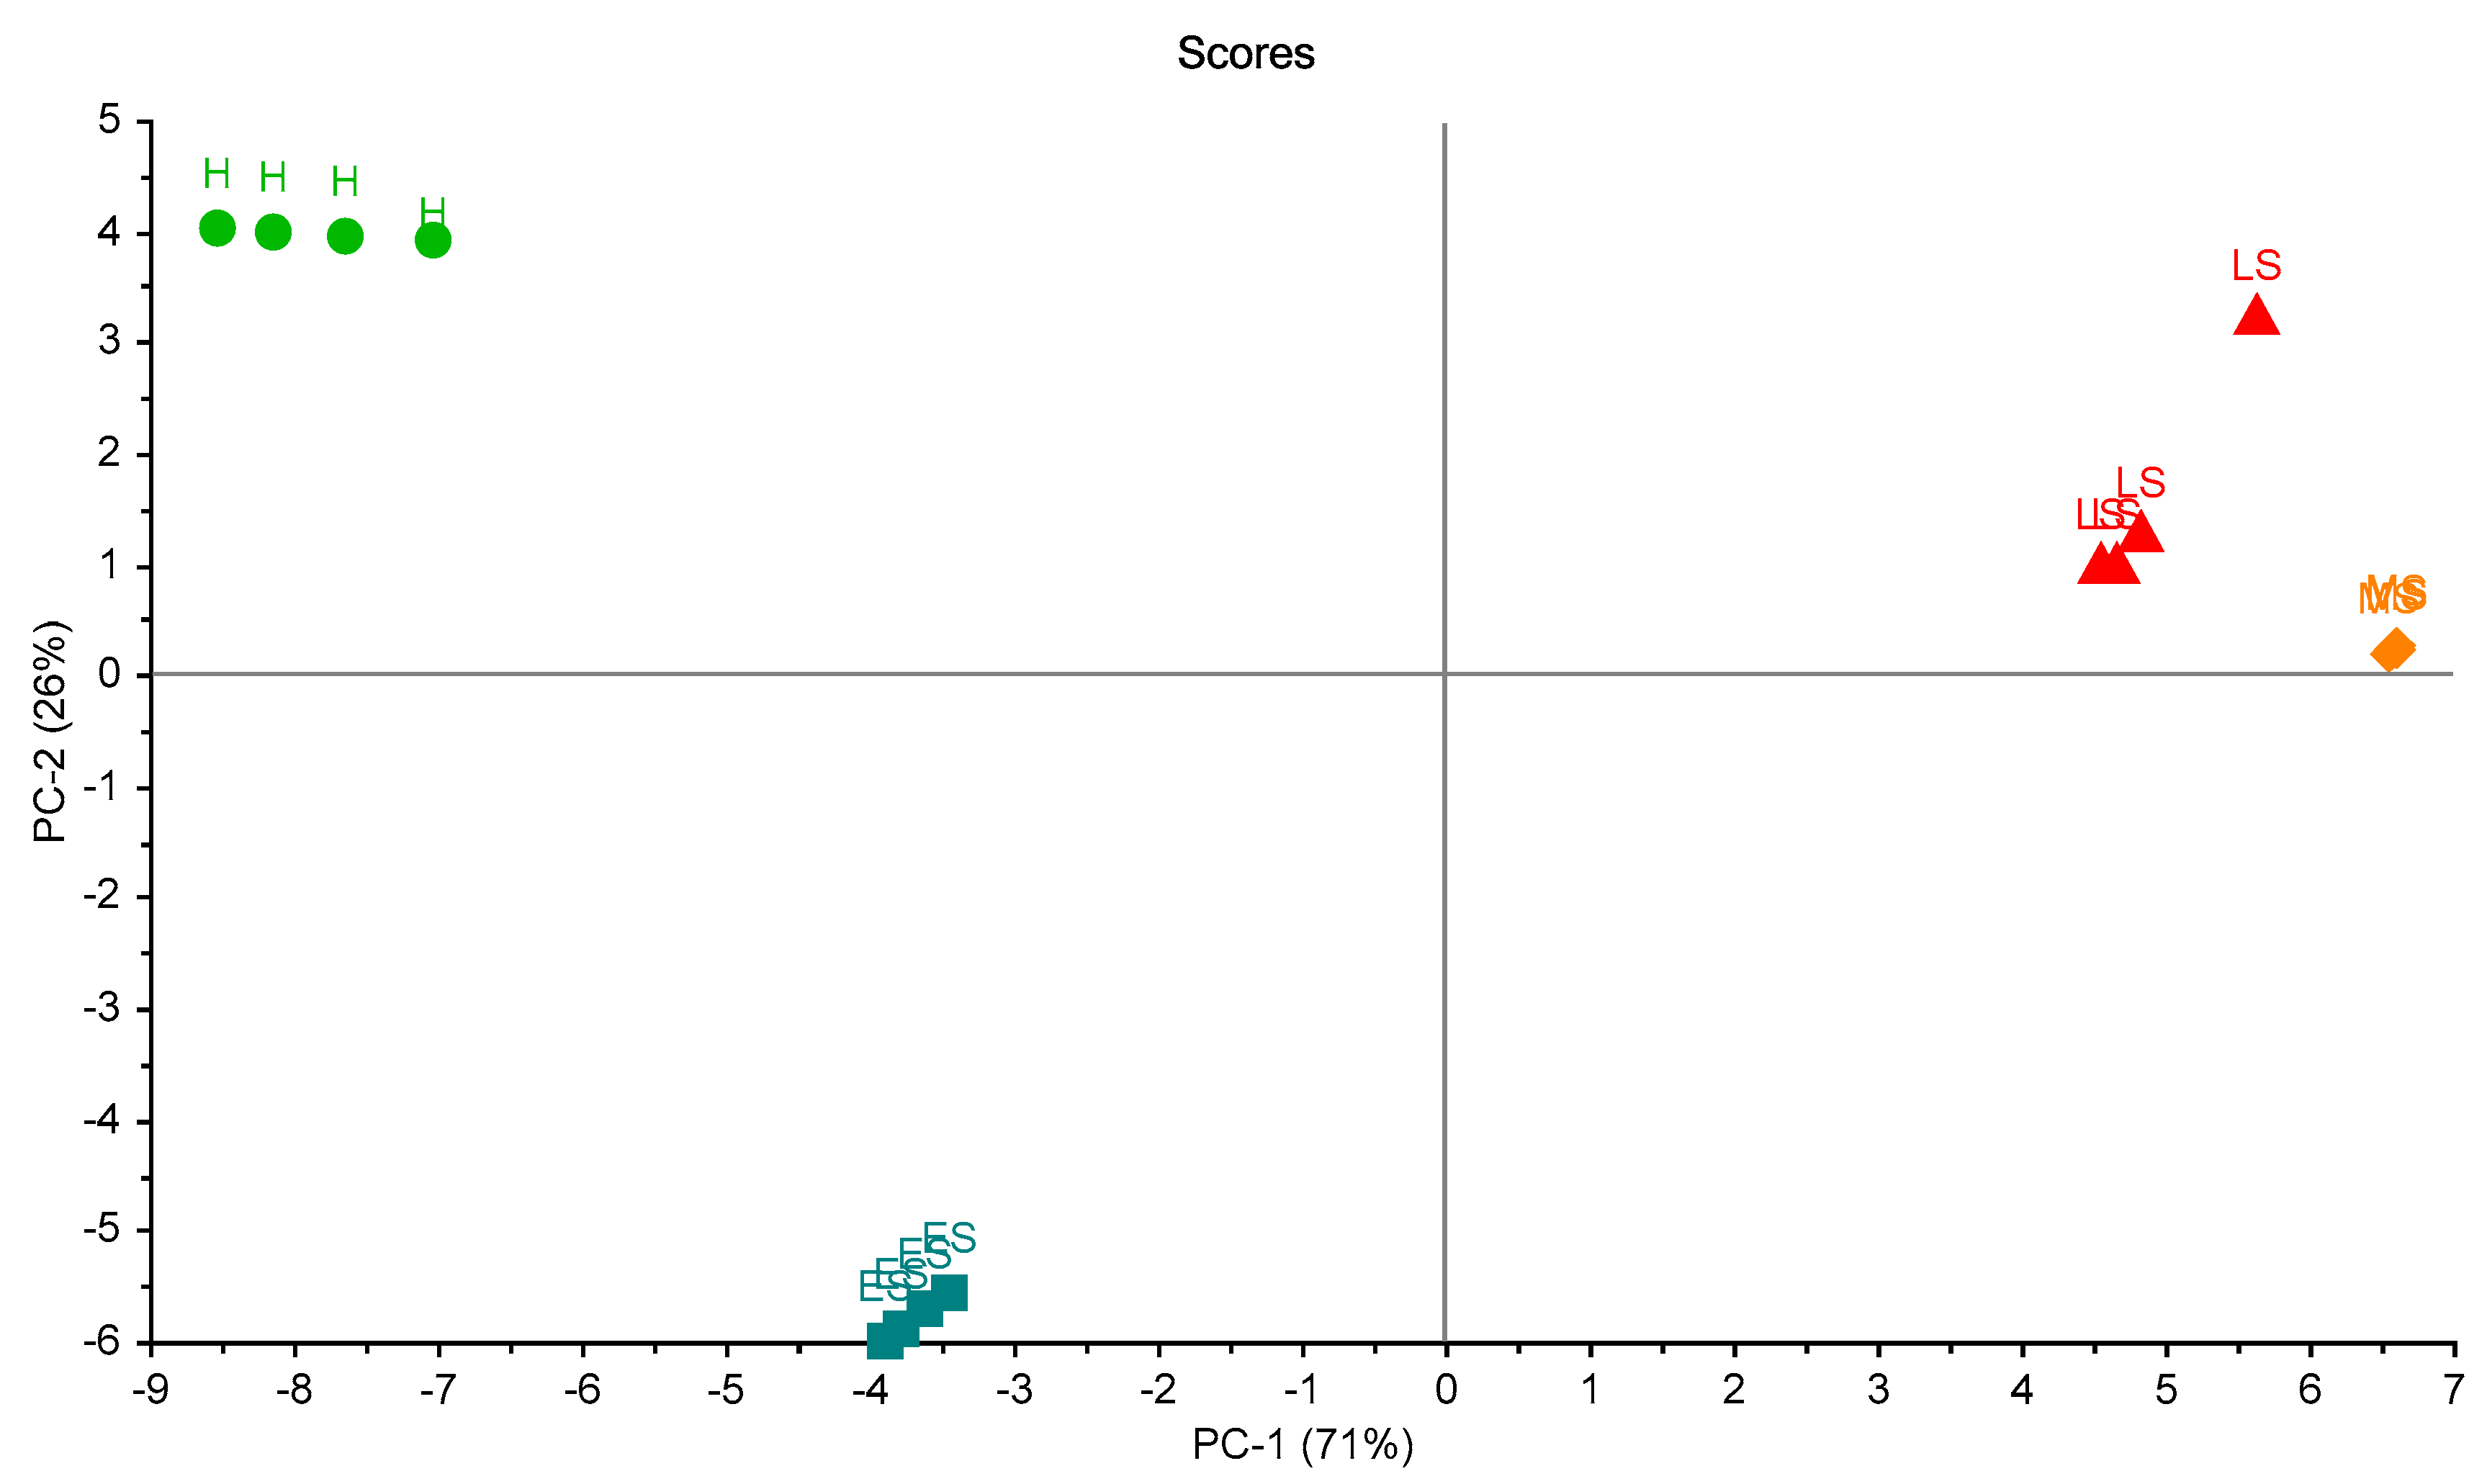
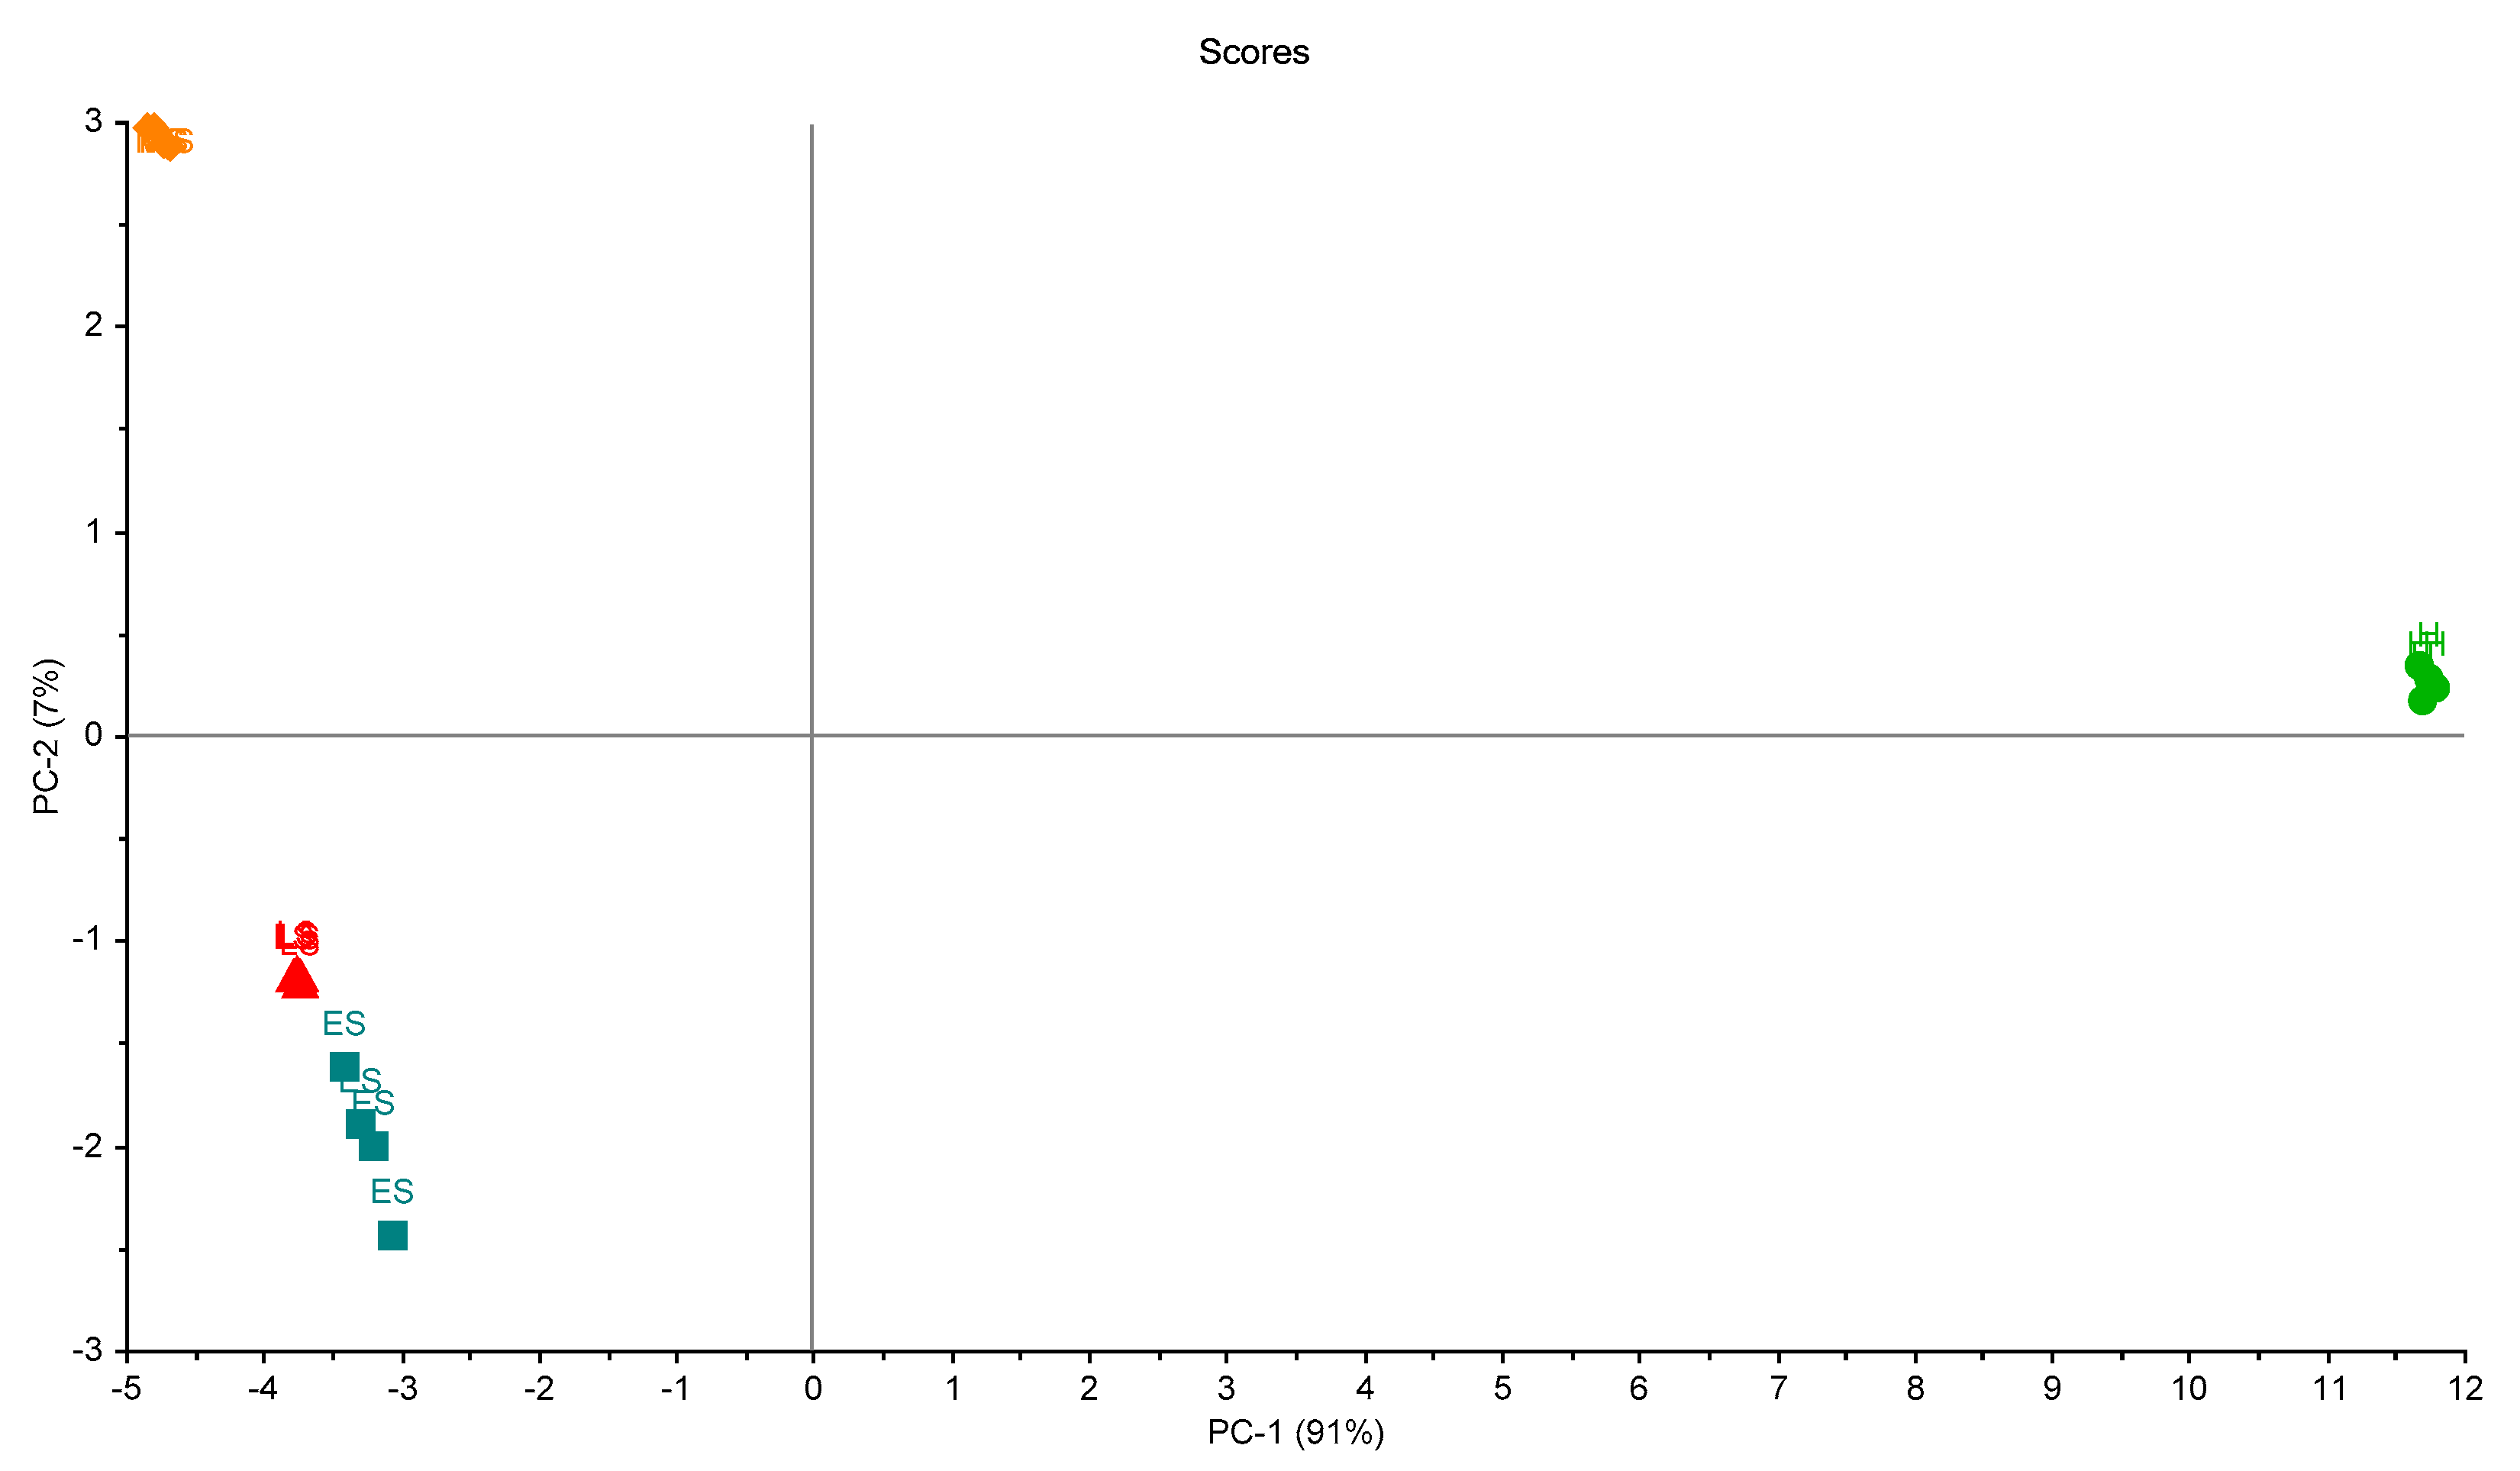
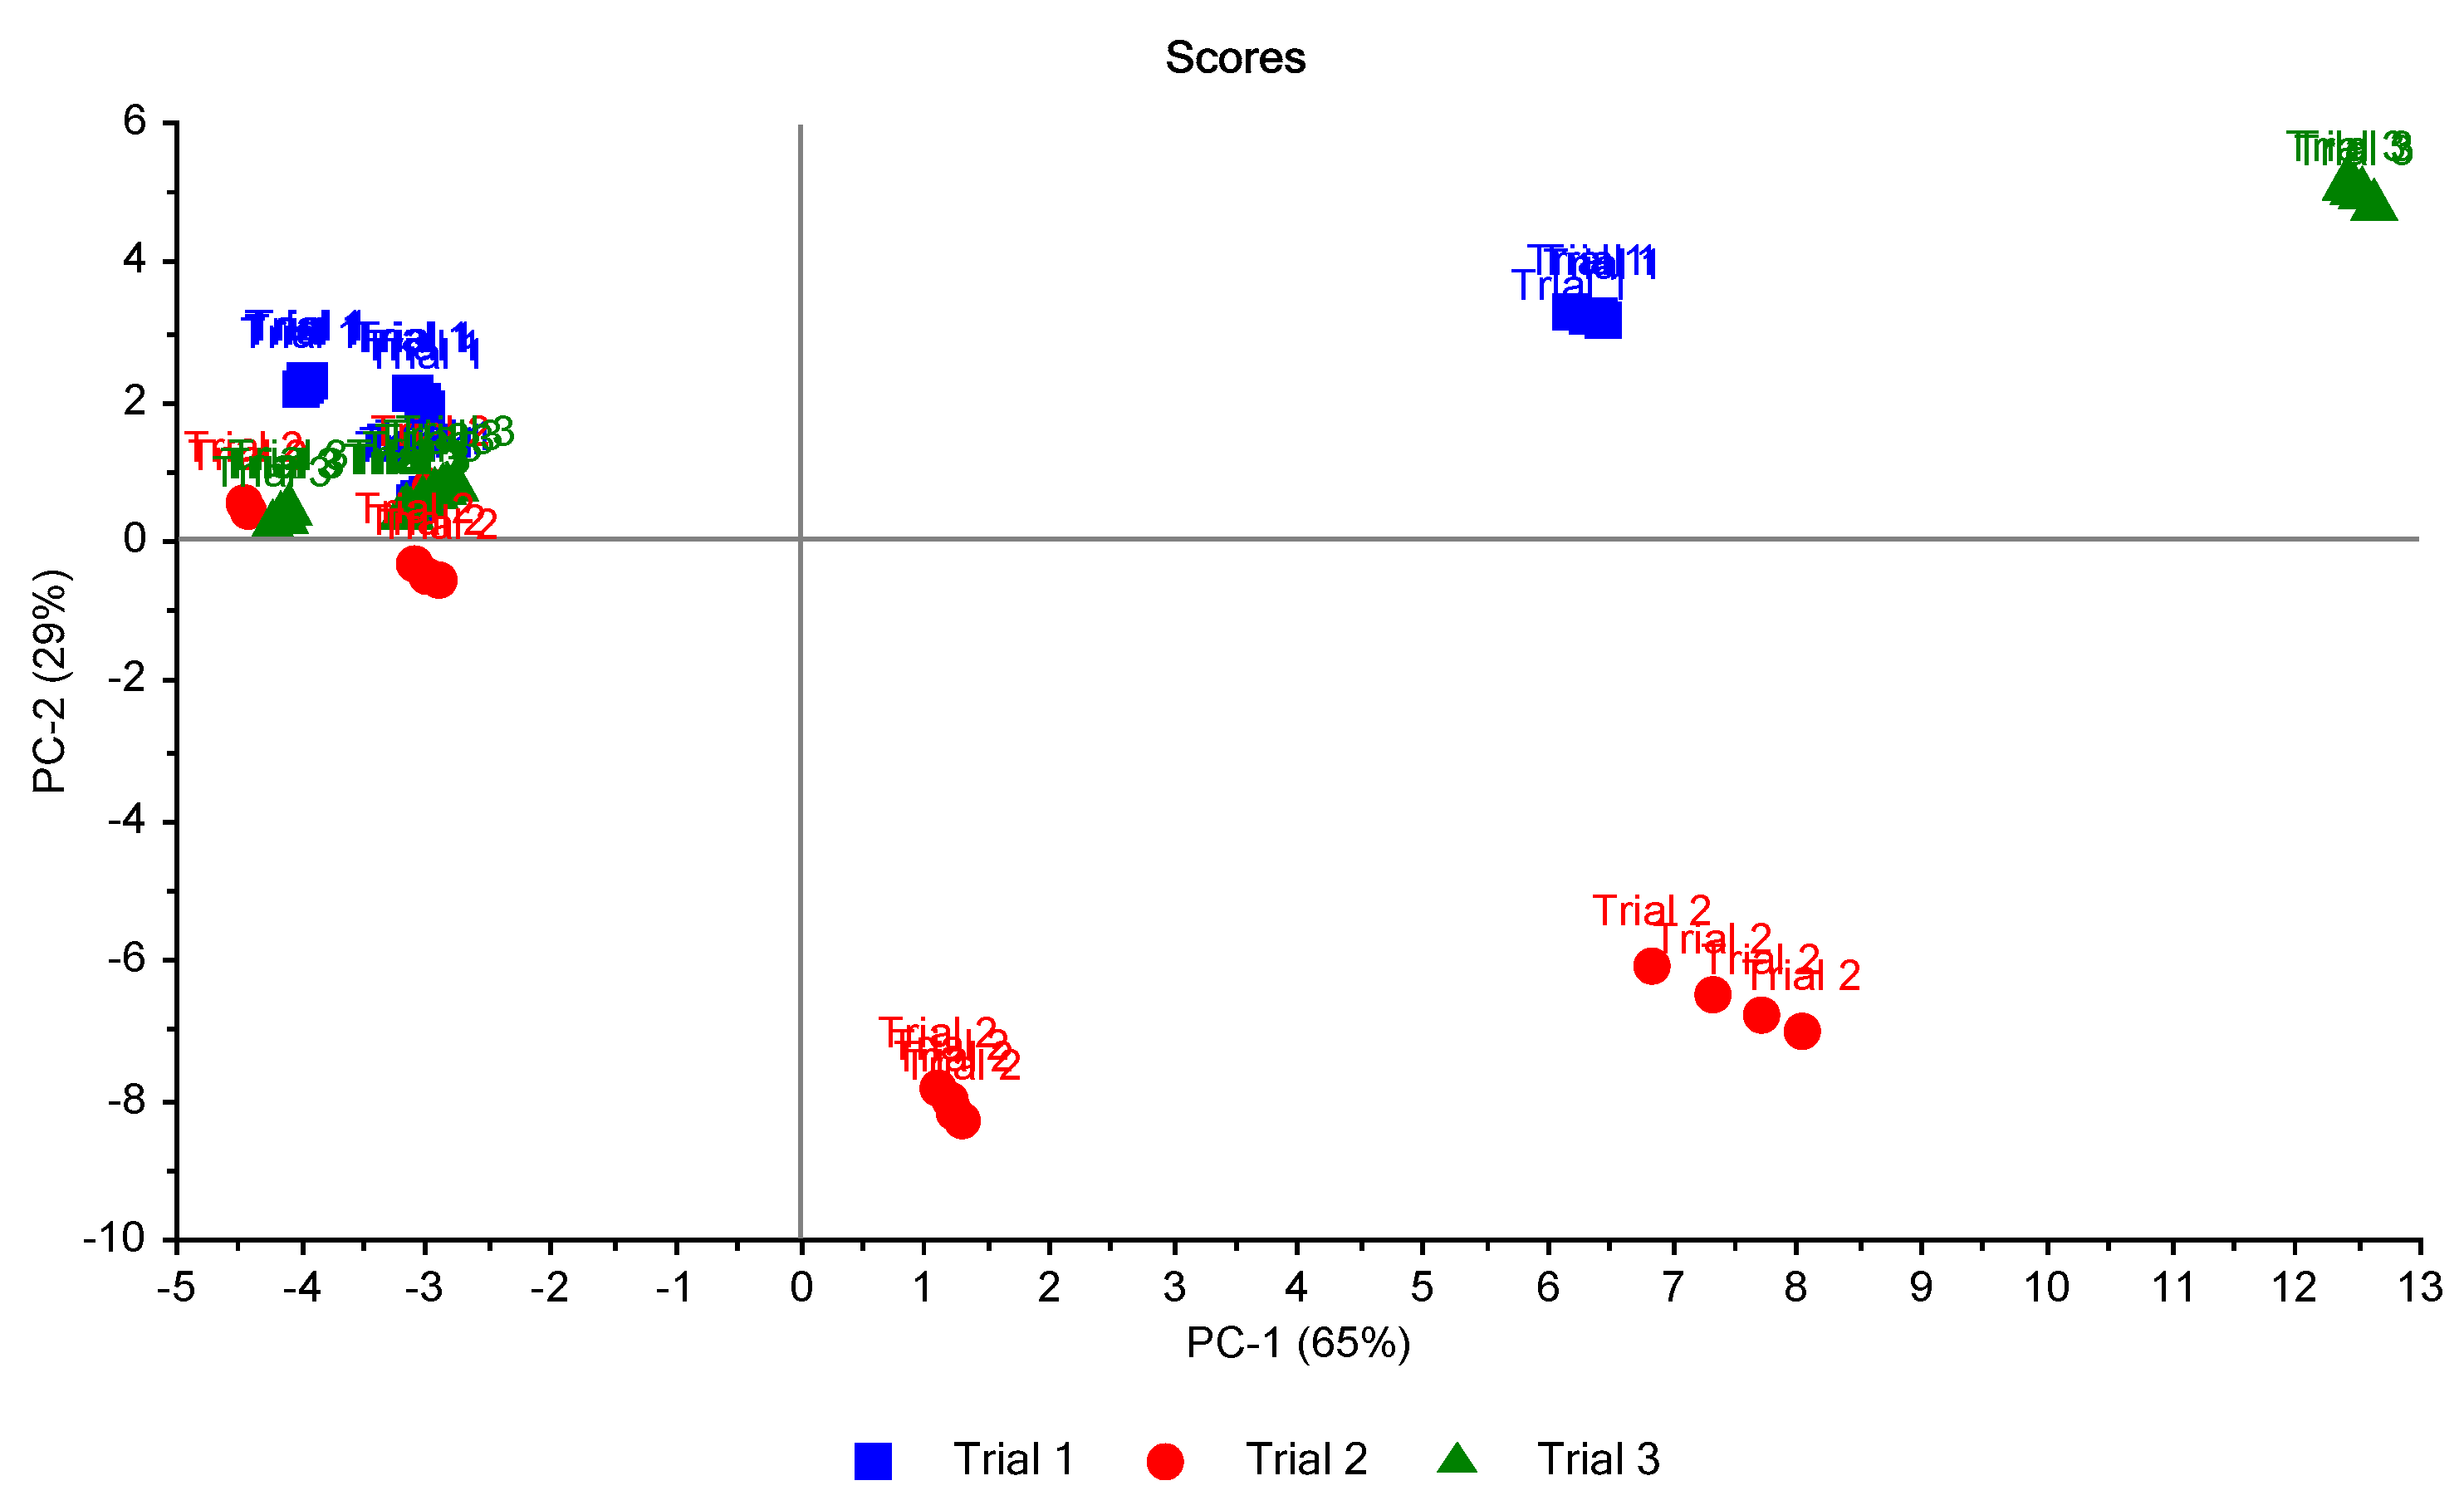
3. Results and Discussion
4. Conclusions
- The use of low-cost sensors solution is open and allows connection to other devices with standardized outputs on the market.
- It is possible to differentiate infected palms and healthy palms.
- The developed software could be enhanced to include a data server that responds to requests from a data cloud platform or other devices such as mobile phones, tablets, etc.
- The stored data (historical and real-time) can be deposited on dashboards accessible by the web on any browser and are very intuitive to interpret.
- This device is a suitable solution for quick detection of this disease after a ‘training’ period of the device.
Author Contributions
Funding
Acknowledgments
Conflicts of Interest
References
- McCoy, R.E. Lethal Decline of Phoenix Palms in Texas Associated with Mycoplasmalike Organisms. Plant Dis. 1980, 64, 1038. [Google Scholar] [CrossRef]
- Harrison, N.A.; Helmick, E.E.; Elliott, M.L. Lethal yellowing-type diseases of palms associated with phytoplasmas newly identified in Florida, USA. Ann. Appl. Biol. 2008, 153, 85–94. [Google Scholar] [CrossRef]
- Harrison, N.A.; Helmick, E.E.; Elliott, M.L. First report of a phytoplasma-associated lethal decline of Sabal palmetto in Florida, USA. Plant Pathol. 2009, 58, 792. [Google Scholar]
- Jeyaprakash, A.; Sutton, B.D.; Halbert, S.E.; Schubert, T.S. First Report of a 16SrIV-D Phytoplasma Associated with Texas Phoenix Palm Decline on Pigmy Date Palm ( Phoenix roebelenii ) in Florida. Plant Dis. 2011, 95, 1475. [Google Scholar] [CrossRef] [PubMed]
- Bahder, B.W.; Helmick, E.E.; Mou, D.F.; Harrison, N.A.; Davis, R. Digital PCR technology for detection of palm-infecting phytoplasmas belonging to group 16SrIV that occur in Florida. Plant Dis. 2018, 102, 1008–1014. [Google Scholar] [CrossRef] [PubMed]
- Bahder, B.W.; Soto, N.; Mou, D.F.; Humphries, A.R.; Helmick, E.E. Quantification and distribution of the 16SrIV-D phytoplasma in the wild date palm, phoenix sylvestris, at different stages of decline using quantitative PCR (qPCR) Analysis. Plant Dis. 2020, 104, 1328–1334. [Google Scholar] [CrossRef]
- Harrison, N.; Elliott, M. Texas Phoenix Palm Decline. In Circular PP-243; University of Florida: Gainesville, FL, USA, 2009. [Google Scholar]
- Maramorosch, K.; Hunt, P. LETHAL YELLOWING DISEASE OF COCONUT AND OTHER PALMS. In Mycoplasma Diseases of Trees and Shrubs; Elsevier: Amsterdam, The Netherlands, 1981; pp. 185–210. [Google Scholar]
- Bahder, B.W.; Helmick, E.E.; Harrison, N.A. Detecting and differentiating phytoplasmas belonging to subgroups 16SrIV-A and 16SrIV-D associated with lethal declines of palms in florida using qPCR and high-resolution melt analysis (HRMA). Plant Dis. 2017, 101, 1449–1454. [Google Scholar] [CrossRef]
- Bahder, B.W.; Soto, N.; Komondy, L.; Mou, D.F.; Humphries, A.R.; Helmick, E.E. Detection and quantification of the 16SrIV-D phytoplasma in leaf tissue of common ornamental palm species in florida using qPCR and dPCR. Plant Dis. 2019, 103, 1918–1922. [Google Scholar] [CrossRef]
- Sankaran, S.; Mishra, A.; Ehsani, R.; Davis, C. A review of advanced techniques for detecting plant diseases. Comput. Electron. Agric. 2010, 72, 1–13. [Google Scholar]
- Wilson, A.D. Noninvasive early disease diagnosis by electronic-nose and related VOC-detection devices. Biosensors 2020, 10, 73. [Google Scholar]
- Karakaya, D.; Ulucan, O.; Turkan, M. Electronic Nose and Its Applications: A Survey. Int. J. Autom. Comput. 2020, 17, 179–209. [Google Scholar] [CrossRef] [Green Version]
- Zhan, X.; Wang, Z.; Yang, M.; Luo, Z.; Wang, Y.; Li, G. An electronic nose-based assistive diagnostic prototype for lung cancer detection with conformal prediction. Meas. J. Int. Meas. Confed. 2020, 158, 107588. [Google Scholar] [CrossRef]
- Matsumoto, K.; Murakami, Y.; Shimizu, Y.; Hirayama, T.; Ishikawa, W.; Iwamura, M. Electronic nose to distinguish bladder cancer by urinary odour feature: A pilot study. Cancer Biomark. 2020, 28, 33–39. [Google Scholar] [CrossRef] [PubMed]
- Esfahani, S.; Wicaksono, A.; Mozdiak, E.; Arasaradnam, R.P.; Covington, J.A. Non-invasive diagnosis of diabetes by volatile organic compounds in urine using FAIMs and FOX4000 electronic nose. Biosensors 2018, 8, 121. [Google Scholar] [CrossRef] [Green Version]
- Sanaeifar, A.; Mohtasebi, S.S.; Ghasemi-Varnamkhasti, M.; Ahmadi, H.; Lozano, J. Development and application of a new low cost electronic nose for the ripeness monitoring of banana using computational techniques (PCA, LDA, SIMCA, and SVM). Czech J. Food Sci. 2014, 32, 538–548. [Google Scholar] [CrossRef] [Green Version]
- Gonzalez Viejo, C.; Fuentes, S.; Godbole, A.; Widdicombe, B.; Unnithan, R.R. Development of a low-cost e-nose to assess aroma profiles: An artificial intelligence application to assess beer quality. Sens. Actuators B Chem. 2020, 308, 127688. [Google Scholar] [CrossRef]
- Giungato, P.; Laiola, E.; Nicolardi, V. Evaluation of Industrial Roasting Degree of Coffee Beans by Using an Electronic Nose and a Stepwise Backward Selection of Predictors. Food Anal. Methods 2017, 10, 3424–3433. [Google Scholar] [CrossRef]
- Konduru, T.; Rains, G.C.; Li, C. A customized metal oxide semiconductor-based gas sensor array for onion quality evaluation: System development and characterization. Sensors 2015, 15, 1252–1273. [Google Scholar] [CrossRef] [Green Version]
- Wilson, A.D. Review of Electronic-nose Technologies and Algorithms to Detect Hazardous Chemicals in the Environment. Procedia Technol. 2012, 1, 453–463. [Google Scholar] [CrossRef] [Green Version]
- Herrero, J.L.; Lozano, J.; Santos, J.P.; Suárez, J.I. On-line classification of pollutants in water using wireless portable electronic noses. Chemosphere 2016, 152, 107–116. [Google Scholar] [CrossRef]
- Lozano, J.; Santos, J.P.; Suárez, J.I.; Arroyo, P.; Herrero, J.L.; Martín, A. Detection of pollutants in water samples with a wireless hand-held e-nose. In Procedia Engineering; Elsevier: Amsterdam, The Netherlands, 2014; Volume 87, pp. 556–559. [Google Scholar]
- Torres-Tello, J.; Guaman, A.V.; Ko, S.-B. Improving the Detection of Explosives in a MOX Chemical Sensors Array with LSTM Networks. IEEE Sens. J. 2020, 20, 14302–14309. [Google Scholar] [CrossRef]
- Ratchapakorn, N.; Ariyakul, Y. Development of a Low-cost Explosive Vapor Detector Using Metal Oxide Gas Sensors. In Proceedings of the ICSEC 2017—21st International Computer Science and Engineering Conference, Bangkok, Thailand, 15–18 November 2017; pp. 316–319. [Google Scholar]
- Dan Wilson, A. Annals of Clinical Case Reports Electronic-nose Devices-Potential for Noninvasive Early Disease-Detection Applications OPEN ACCESS. Ann. Clin. Case Rep. 2017, 2, 1401. [Google Scholar]
- Maniscalco, M.; Motta, A. Clinical and Inflammatory Phenotyping: Can Electronic Nose and NMR-based Metabolomics Work at the Bedside? Arch. Med. Res. 2018, 49, 74–76. [Google Scholar] [PubMed]
- Macías Macías, M.; Agudo, J.E.; García Manso, A.; García Orellana, C.J.; González Velasco, H.M.; Gallardo Caballero, R.A. Compact and low cost electronic nose for aroma detection. Sensors 2013, 13, 5528–5541. [Google Scholar] [PubMed] [Green Version]
- Majchrzak, T.; Wojnowski, W.; Dymerski, T.; Gebicki, J.; Namiesnik, J. Electronic noses in classification and quality control of edible oils: A review. Food Chem. 2018, 246, 192–201. [Google Scholar] [CrossRef] [PubMed]
- Tang, K.; Chiu, S.; Pan, C.; Hsieh, H.; Liang, Y.; Liu, S. Development of a portable electronic nose system for the detection and classification of fruity odors. Sensors 2010, 10, 9179–9193. [Google Scholar] [PubMed] [Green Version]
- Trirongjitmoah, S.; Juengmunkong, Z.; Srikulnath, K.; Somboon, P. Classification of garlic cultivars using an electronic nose. Comput. Electron. Agric. 2015, 113, 148–153. [Google Scholar]
- Chansongkram, W.; Nimsuk, N. Development of a wireless electronic nose capable of measuring odors both in open and closed systems. Proc. Comput. Sci. 2016, 86, 192–195. [Google Scholar]
- Oates, M.J.; Fox, P.; Sanchez-Rodriguez, L.; Carbonell-Barrachina, Á.A.; Ruiz-Canales, A. DFT based classification of olive oil type using a sinusoidally heated, low cost electronic nose. Comput. Electron. Agric. 2018, 155, 348–358. [Google Scholar] [CrossRef]
- Zaid, A.; Abu-Khalaf, N.; Mudalal, S.; Petracci, M. Differentiation between Normal and White Striped Turkey Breasts by Visible/Near Infrared Spectroscopy and Multivariate Data Analysis. Food Sci. Anim. Resour. 2020, 40, 96–105. [Google Scholar] [CrossRef] [Green Version]
- Nagy, A.S.; Polanco Risquet, A.; Martínez de la Cotera, O.L.; Carralero Ibargollen, O. Medición simultánea de gases con sensores MQ. Ing. Electrónica Automática Comun. 2020, 41, 34–43. [Google Scholar]
- Gajdosik, L. The derivation of the electrical conductance/temperature dependency for tin dioxide gas sensor. Adv. Electr. Electron. Eng. 2014, 12, 529–536. [Google Scholar] [CrossRef]
- Abu-Khalaf, N.; Hmidat, M. Visible/Near Infrared (VIS/NIR) spectroscopy as an optical sensor for evaluating olive oil quality. Comput. Electron. Agric. 2020, 173, 105445. [Google Scholar] [CrossRef]
- Taha, H.; Nawaf Abu-Khalaf, N. Quality control for herbal medicinal plants using a sensor array (an electronic tongue). In Proceedings of the 7th International Conference of Biotechnology, Environment and Engineering Sciences (ICBE7), Stockholm, Sweden, 26 June 2020; pp. 25–33. [Google Scholar] [CrossRef]


| Sample | Ct | Tm |
|---|---|---|
| Healthy/asymptomatic palm (HS) | No Ct | 62.0 ± 0.2 |
| Early symptomatic palm (ES) | 22.2 ± 0.3 | 79.8 ± 0.1 |
| Moderate symptomatic palm (MS) | 22.9 ± 0.4 | 79.8 ± 0.1 |
| Late symptomatic palm (LS) | 24.1 ± 0.3 | 79.8 ± 0.0 |
| 16SrIV-D positive control | 21.9 ± 0.2 | 79.8 ± 0.0 |
| Healthy control | No Ct | 60.0 ± 0.2 |
| Water control | No Ct | 54.5 ± 0.2 |
Publisher’s Note: MDPI stays neutral with regard to jurisdictional claims in published maps and institutional affiliations. |
© 2020 by the authors. Licensee MDPI, Basel, Switzerland. This article is an open access article distributed under the terms and conditions of the Creative Commons Attribution (CC BY) license (http://creativecommons.org/licenses/by/4.0/).
Share and Cite
Oates, M.J.; Abu-Khalaf, N.; Molina-Cabrera, C.; Ruiz-Canales, A.; Ramos, J.; Bahder, B.W. Detection of Lethal Bronzing Disease in Cabbage Palms (Sabal palmetto) Using a Low-Cost Electronic Nose. Biosensors 2020, 10, 188. https://0-doi-org.brum.beds.ac.uk/10.3390/bios10110188
Oates MJ, Abu-Khalaf N, Molina-Cabrera C, Ruiz-Canales A, Ramos J, Bahder BW. Detection of Lethal Bronzing Disease in Cabbage Palms (Sabal palmetto) Using a Low-Cost Electronic Nose. Biosensors. 2020; 10(11):188. https://0-doi-org.brum.beds.ac.uk/10.3390/bios10110188
Chicago/Turabian StyleOates, Martin J., Nawaf Abu-Khalaf, Carlos Molina-Cabrera, Antonio Ruiz-Canales, Jose Ramos, and Brian W. Bahder. 2020. "Detection of Lethal Bronzing Disease in Cabbage Palms (Sabal palmetto) Using a Low-Cost Electronic Nose" Biosensors 10, no. 11: 188. https://0-doi-org.brum.beds.ac.uk/10.3390/bios10110188