Resonance Energy Transfer to Track the Motion of Lanthanide Ions—What Drives the Intermixing in Core-Shell Upconverting Nanoparticles?

 , , and
Abstract
:1. Introduction
2. Materials and Methods
2.1. Materials
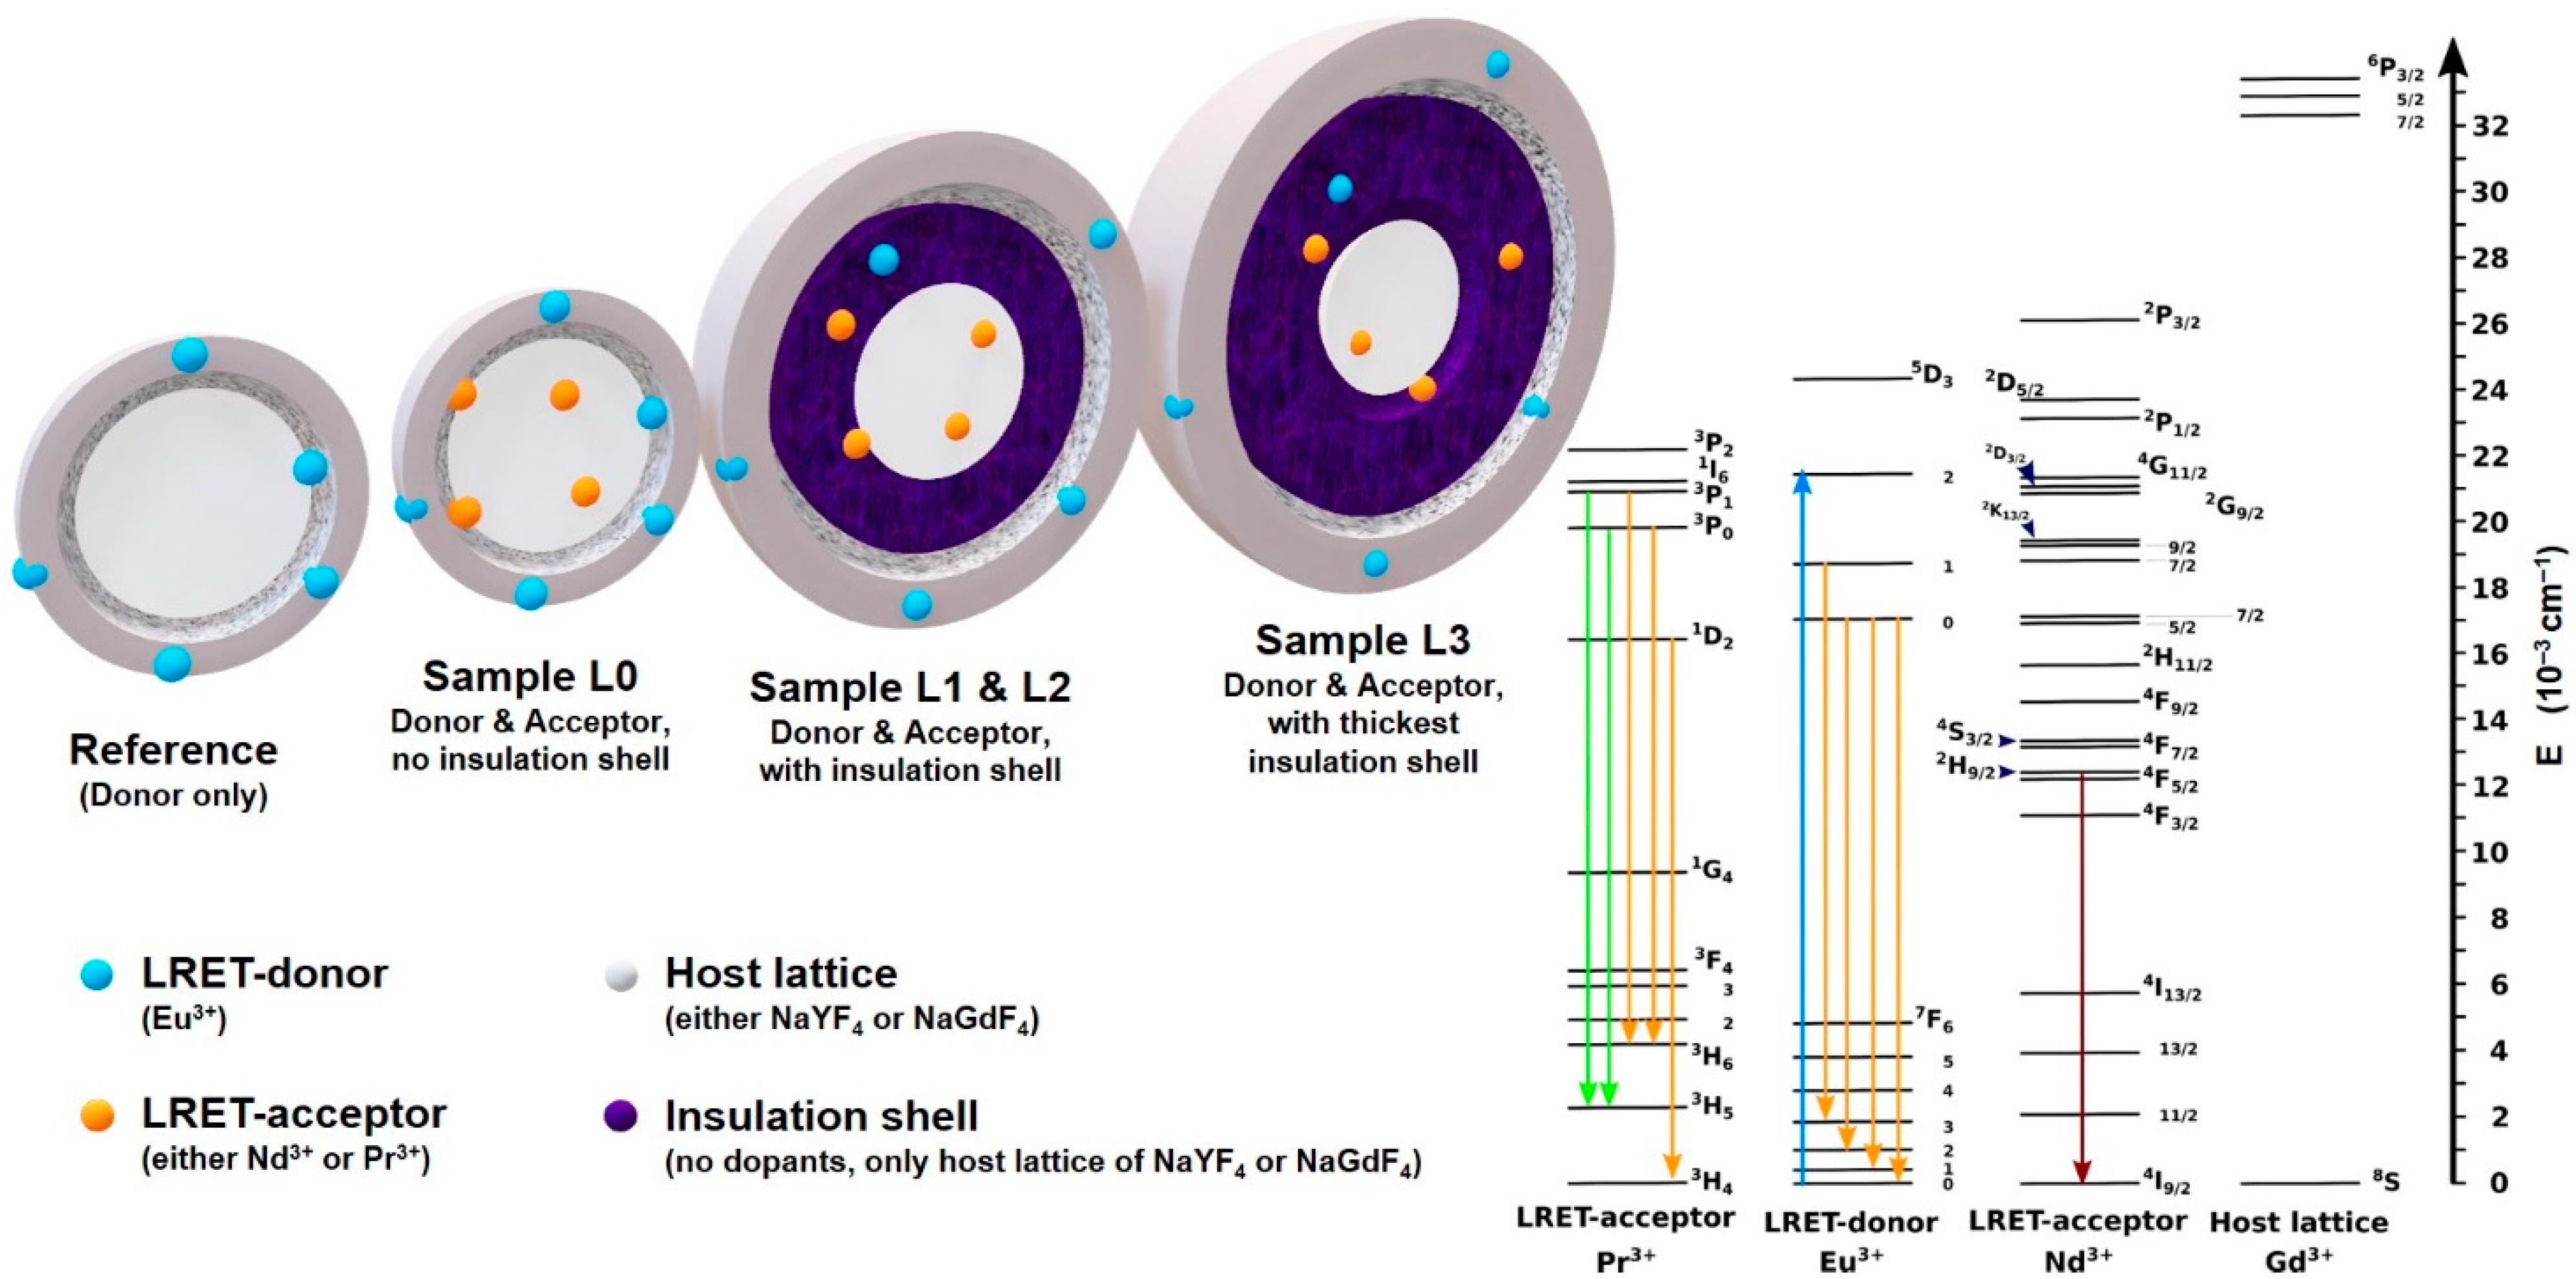
2.2. Concept of This Study
- Set Y300: Core = NaYF4:Pr20% @ Shell = NaYF4 @ Shell = NaYF4:Eu5%;
- Set Gd300: Core = NaGdF4:Nd20% @ Shell = NaGdF4 @ Shell = NaGdF4:Eu5%;
2.3. Nanoparticle Synthesis
2.3.1. Core Synthesis of NaREF4 (UCNP)
2.3.2. Shell-Precursor Synthesis of NaREF4 and NaREF4:Eu
2.3.3. Core-Shell and Core-Shell-Shell Synthesis
2.4. Luminescence Emission Spectroscopy
2.5. Size (TEM) and Structural (XRD) Characterization
2.6. Theory
3. Results
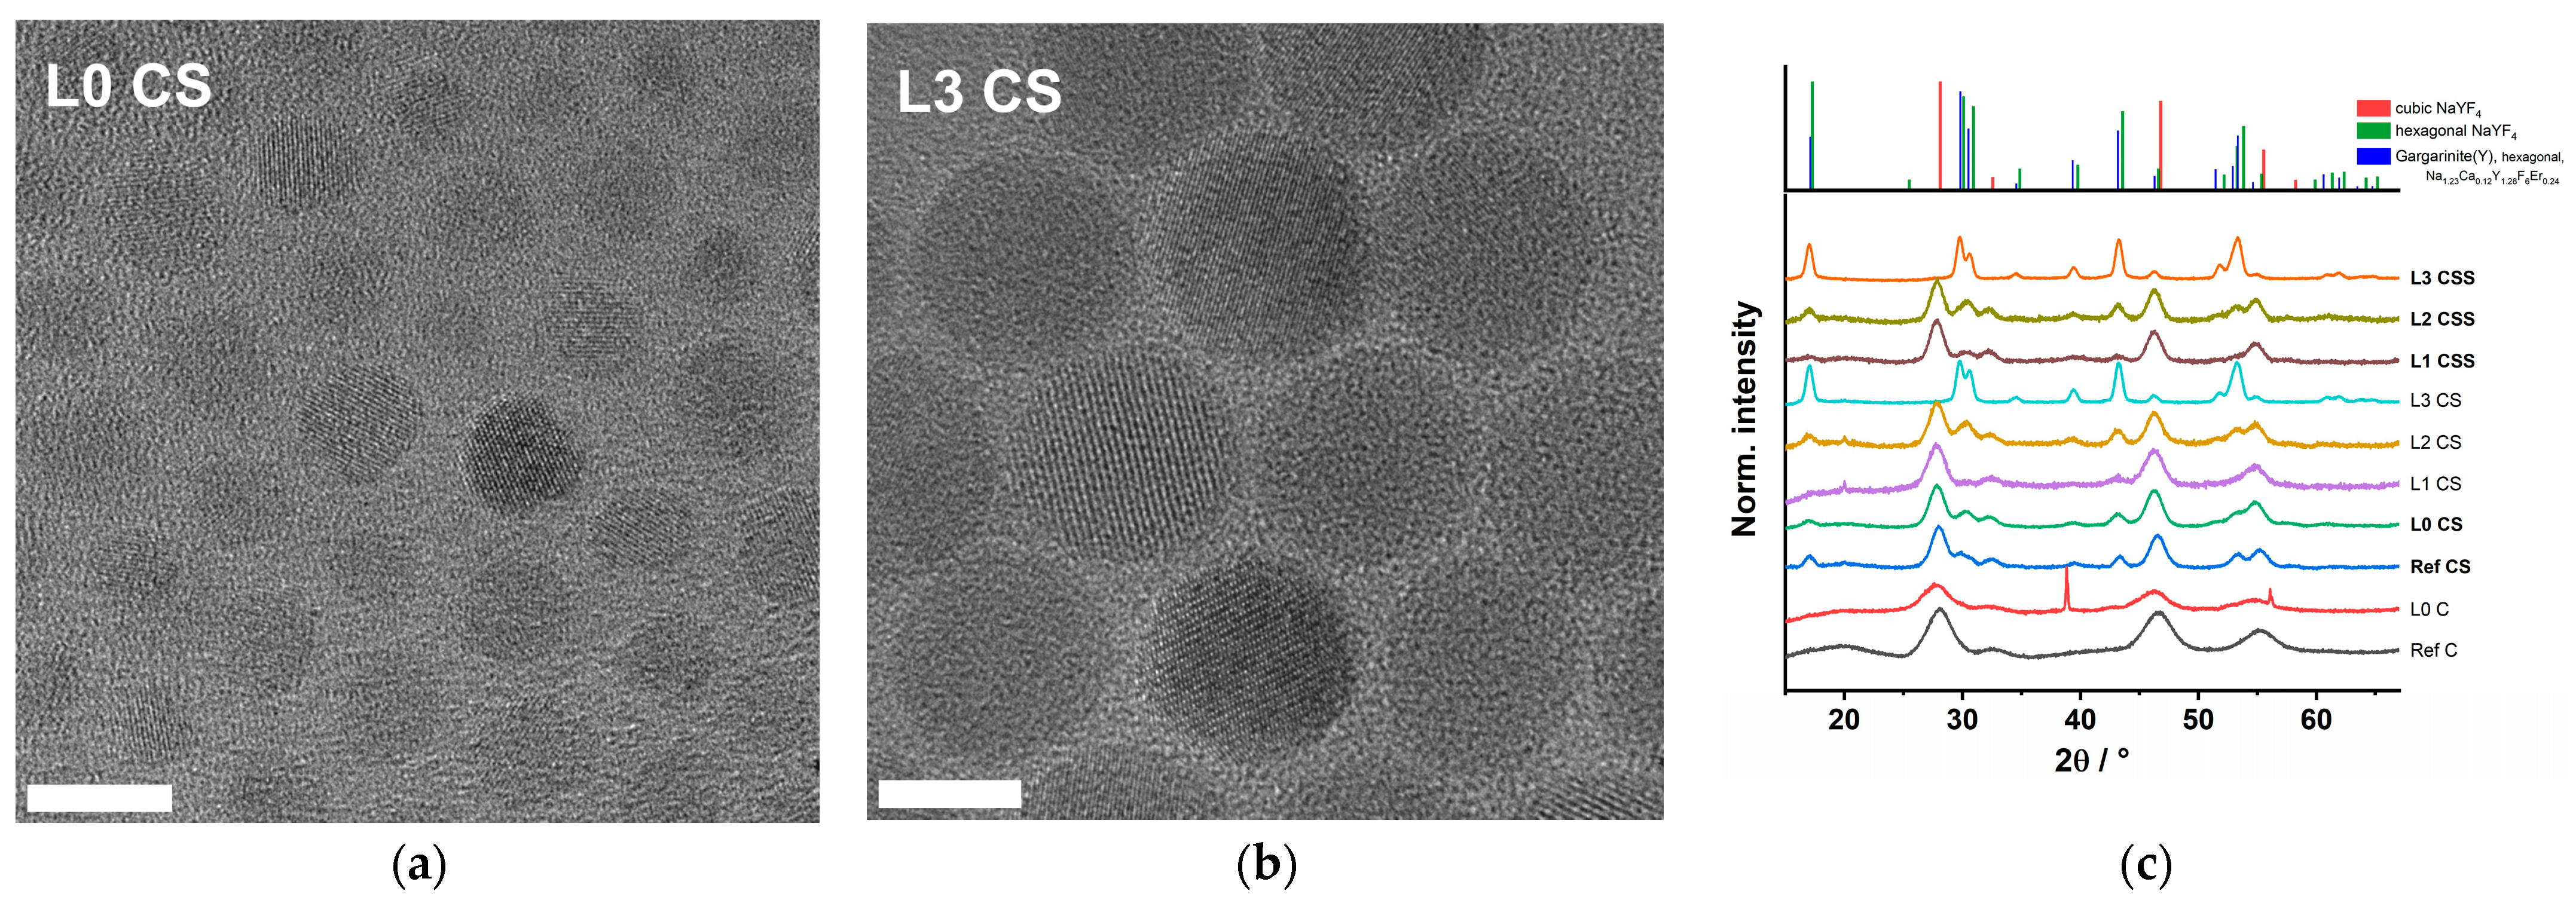
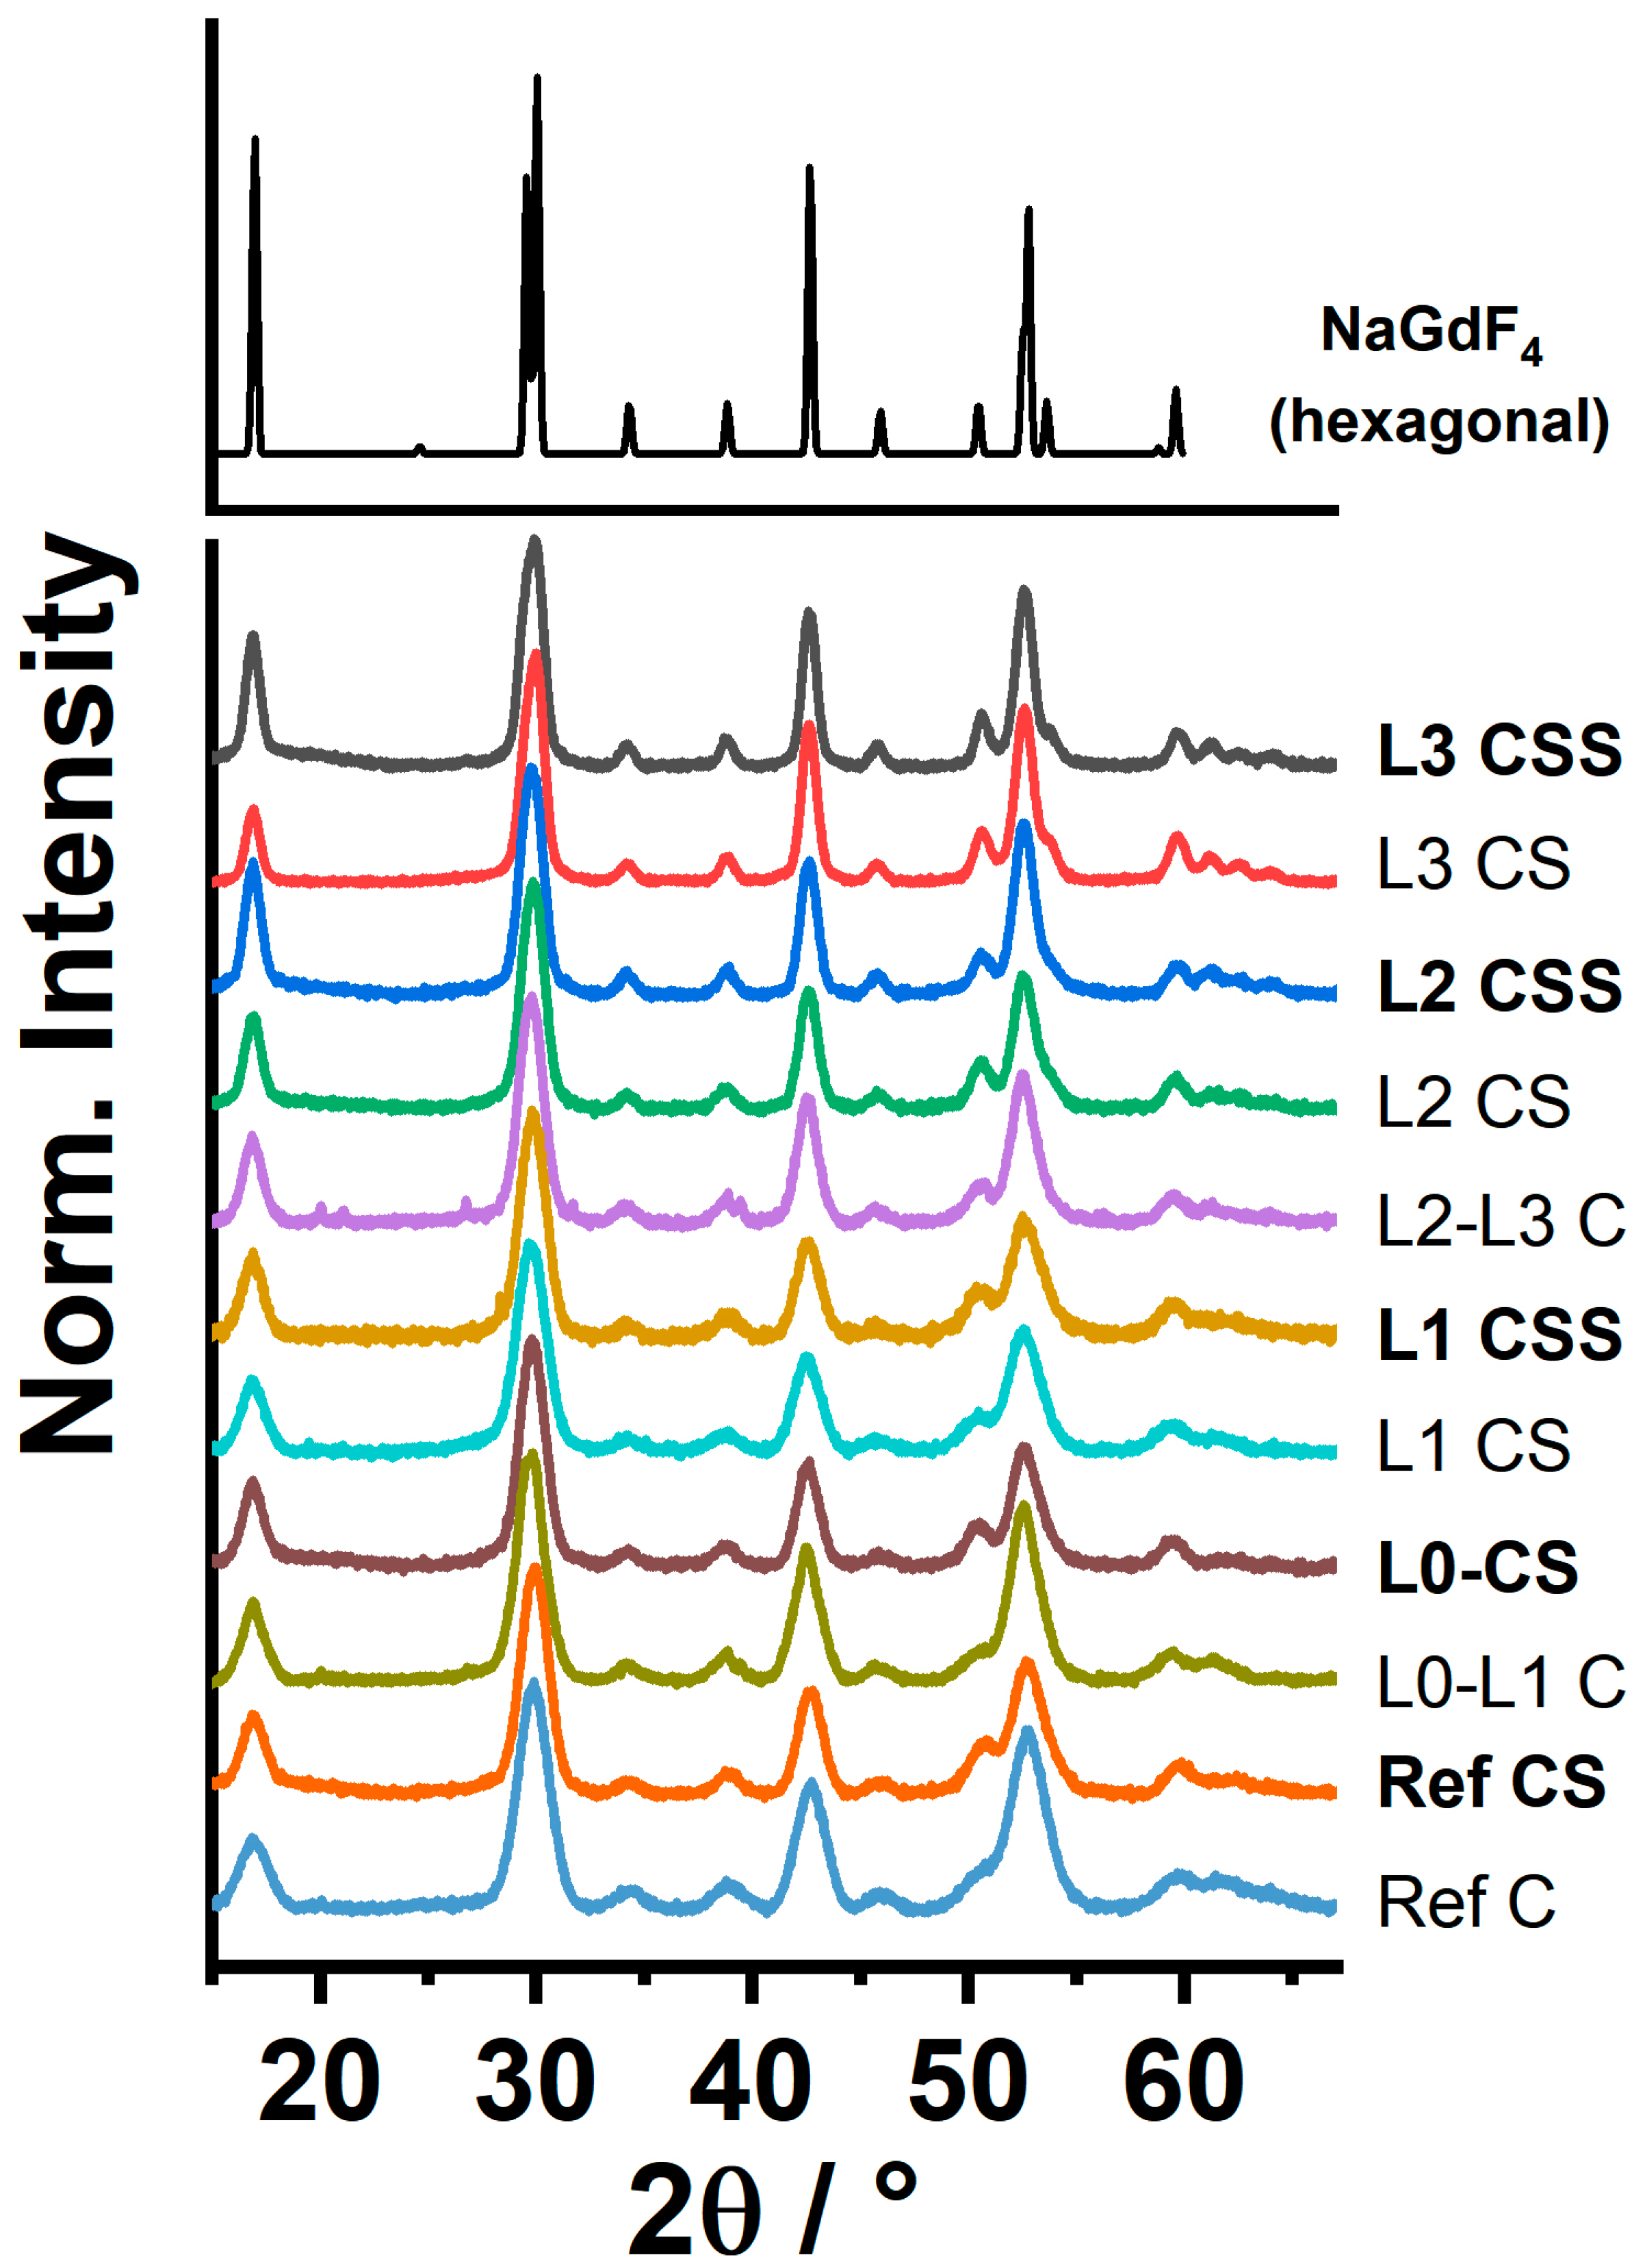
3.1. Structural Characterization
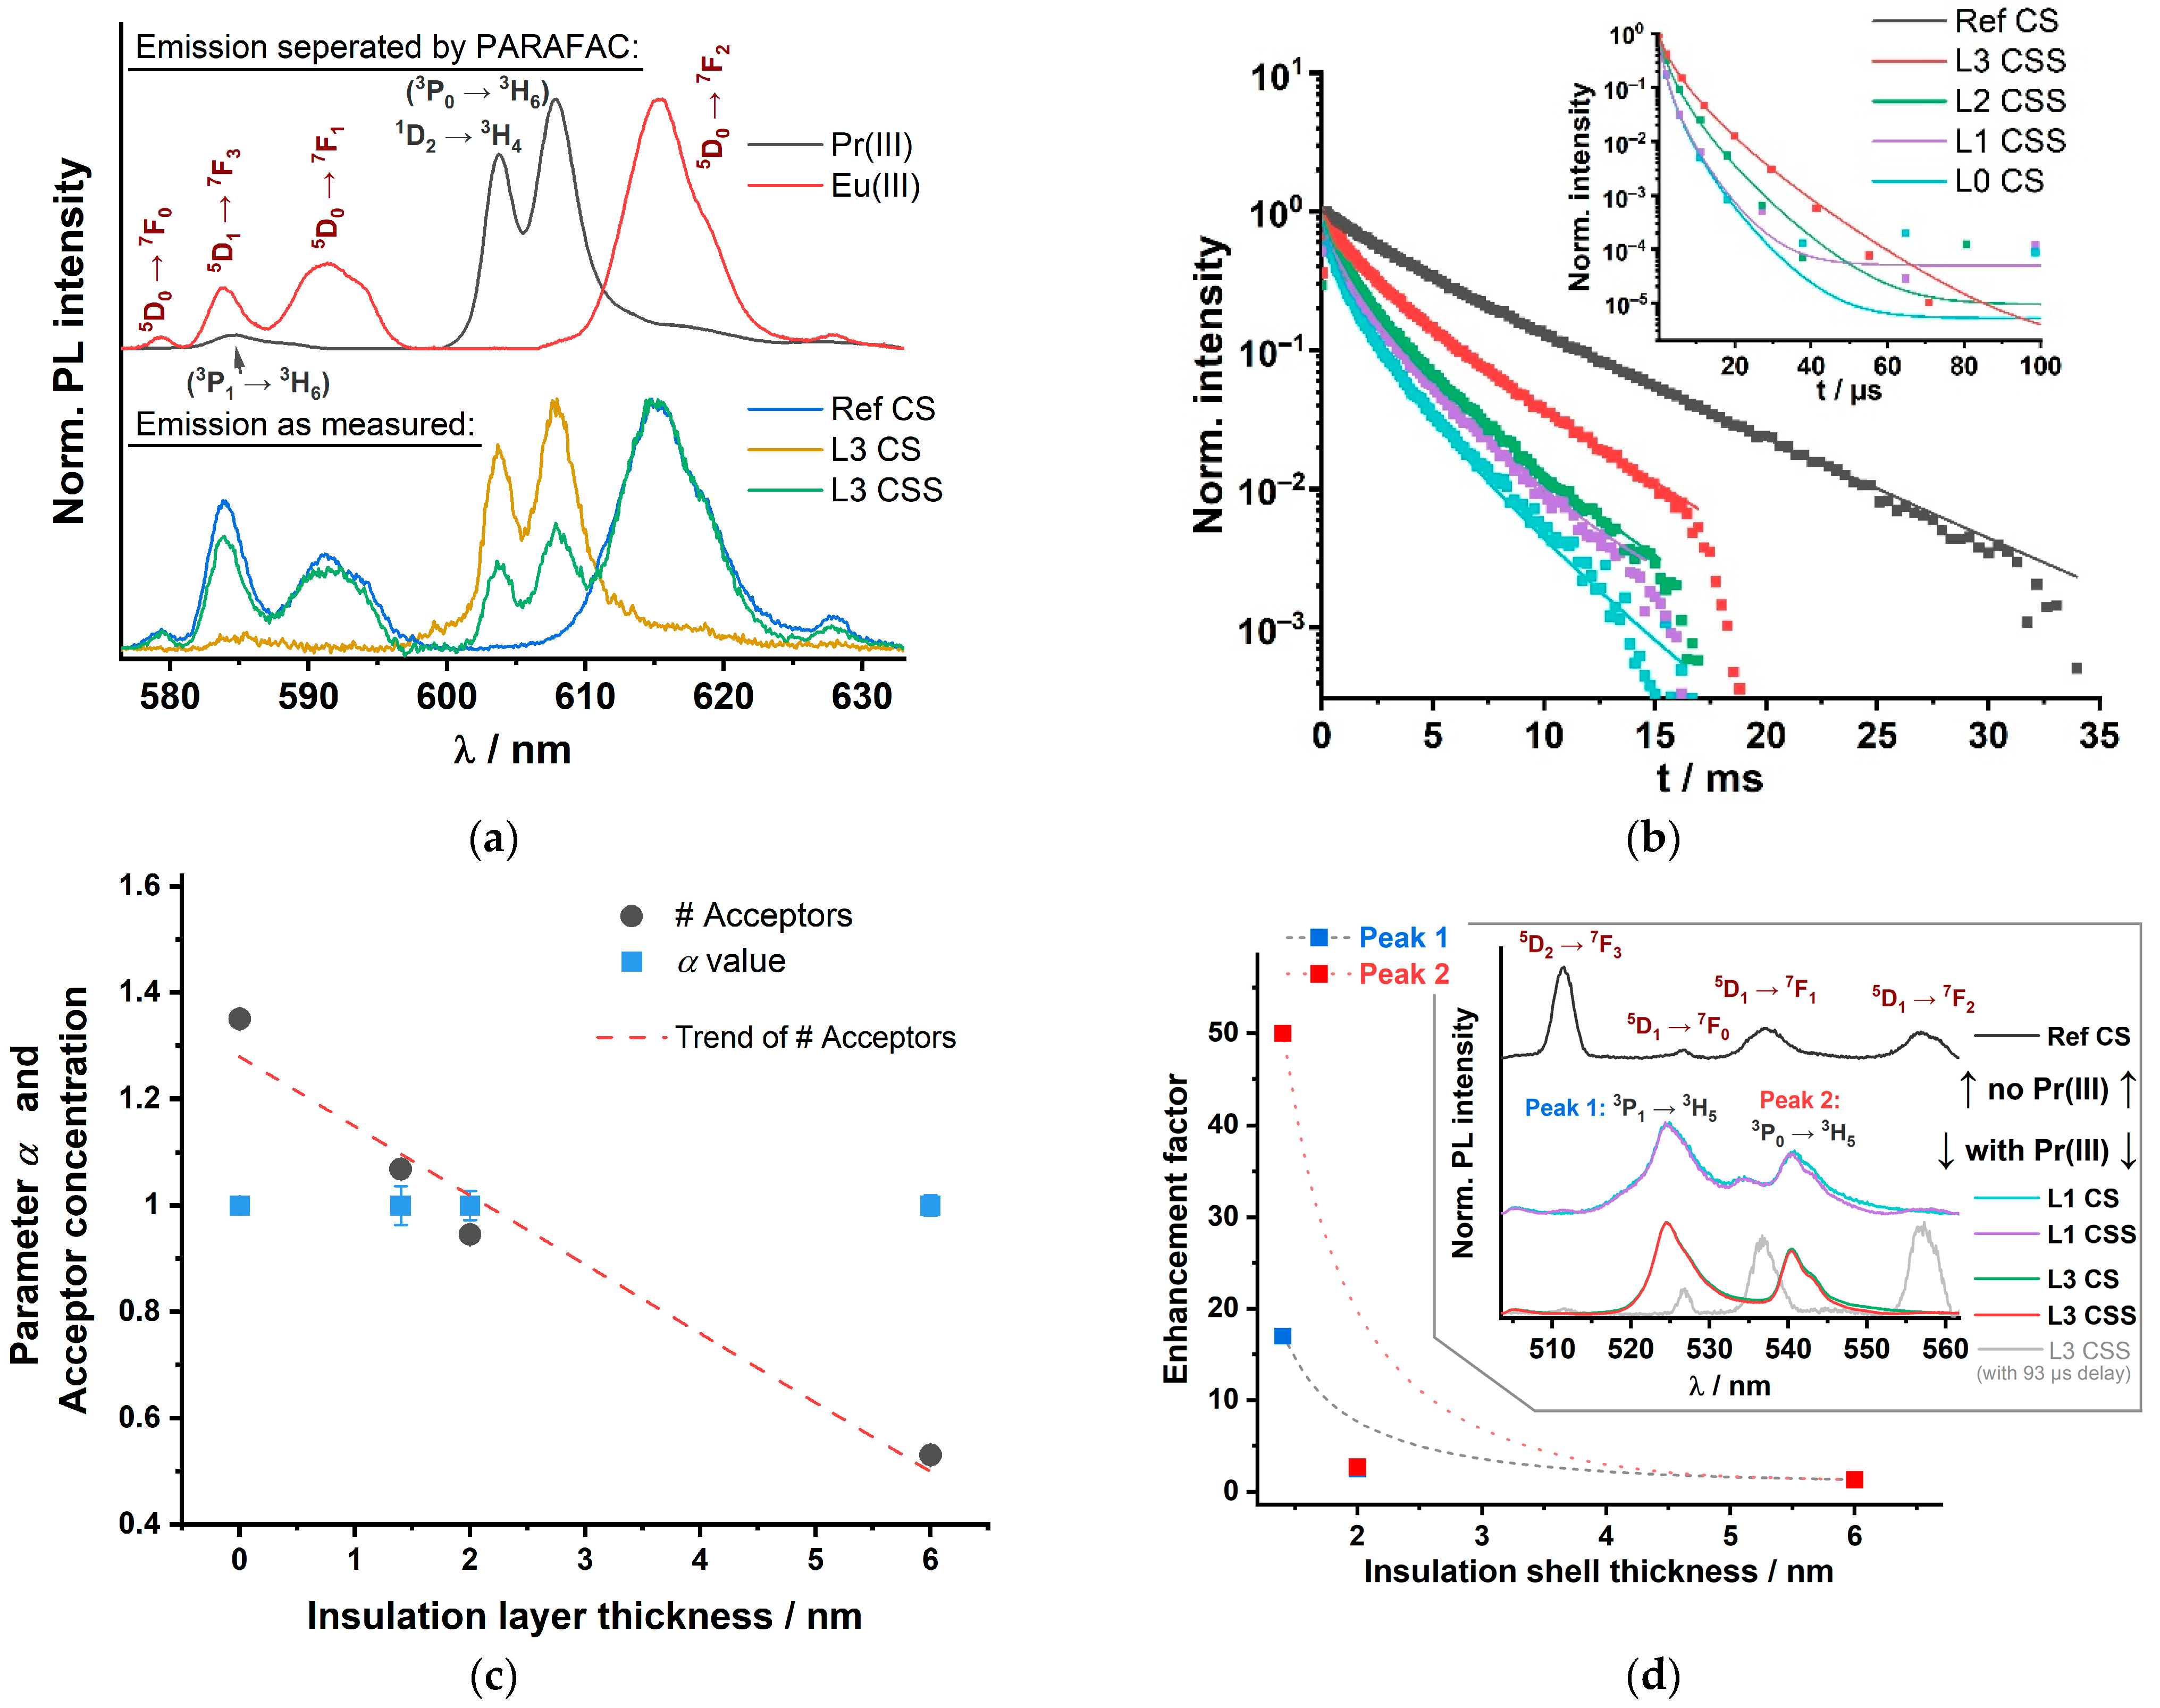
3.2. Luminescence of Set Y300
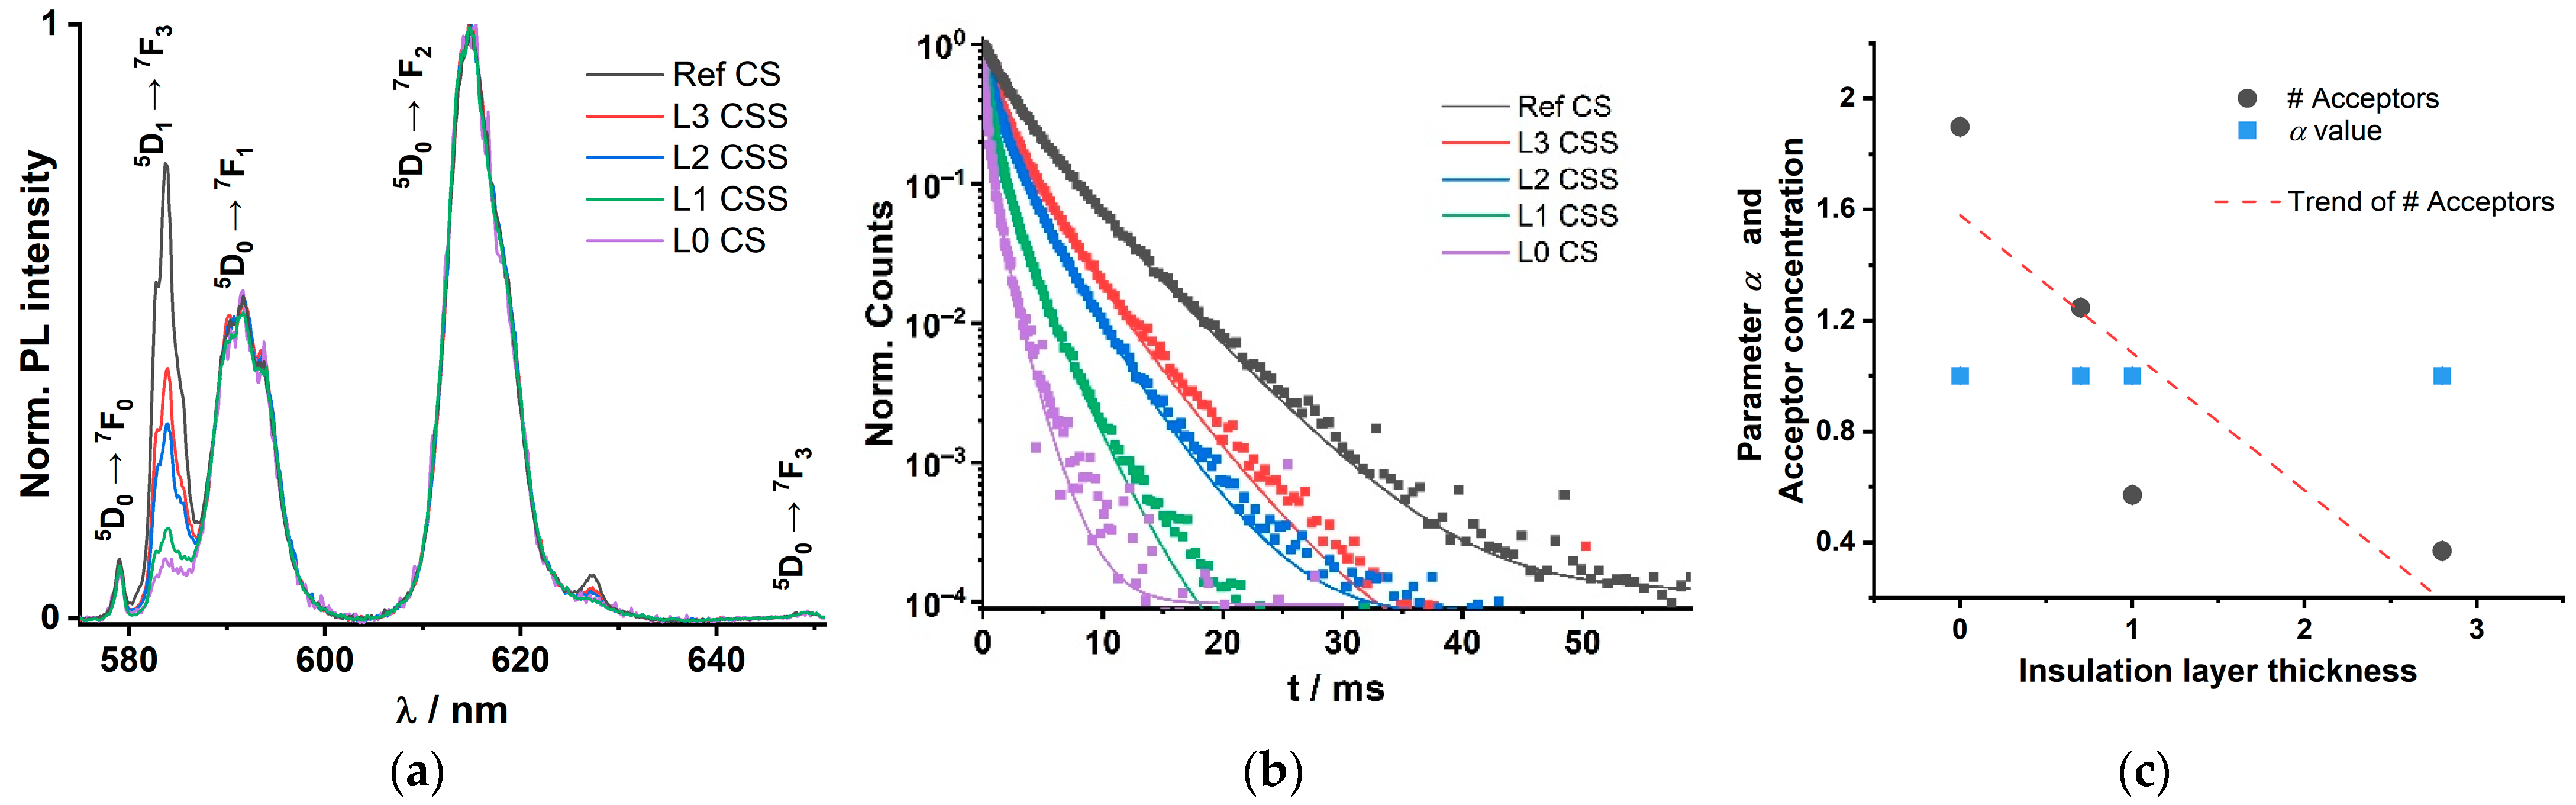
3.3. Luminescence of Set Gd300
4. Discussion
4.1. Structural Characterization
4.2. LRET
5. Conclusions
Author Contributions
Funding
Conflicts of Interest
Appendix A

| Set Y300-UCNP (NaYF4; ϑ = 320 °C) | Sample Composition | Diameter of Core-Shell (CS) Samples/nm | Insulation Shell Thickness/nm |
| Y300-UCNP L0 CS 1 | NaYF4:Yb18%, Pr2% @ NaYF4:Eu5% | 9.3 ± 2.2 | → 0 |
| Y300-UCNP L1 CSS 1 | NaYF4:Yb18%, Pr2% @ NaYF4 @ NaYF4:Eu5% | 9.5 ± 2.7 | → 0.7 |
| Y300-UCNP L2 CSS 2 | as above | 26 ± 1.7 (87%) 15 ± 0.9 (13%) | → 9.3 → 3.8 |
| Y300-UCNP L3 CSS 2 | as above | 14.2 ± 4.5 | → 3.4 |
| Set Gd200 (NaGdF4; ϑ = 220 °C) | Sample Composition | Diameter of Core-Shell (CS) Samples/nm | Insulation Shell Thickness/nm |
| Gd200 L0 CS 3 | NaGdF4:Nd @ NaGdF4:Eu | 3.9 ± 0.3 | → 0 |
| Gd200 L1 CSS 3 | NaGdF4:Nd @ NaGdF4 @ NaGdF4:Eu | 3.8 ± 0.4 | → (−) 3.4 |
| Gd200 L2 CSS 4 | as above | 4.1 ± 0.5 | → (−) 3.3 |
| Gd200 L3 CSS 4 | as above | 4.5 ± 0.6 | → (−) 3.1 |


| Eu(III) Luminescence at 616 nm (5D0 → 7F2) | ||||||
|---|---|---|---|---|---|---|
| Ref CS (Donor Only) | τ (Donor)/µs | ±Er | β | ±Er | ||
| 4540.11 | 37.65 | 0.90 | 0.01 | |||
| #acceptor | ±Er | γ | ±Er | α | ±Er | |
| L0 CS | 1.35 | 0.01 | 1.20 | 0.01 | 1.00 | 0.02 |
| L1 CSS | 1.07 | 0.02 | 0.95 | 0.02 | 1.00 | 0.04 |
| L2 CSS | 0.95 | 0.01 | 0.84 | 0.01 | 1.00 | 0.03 |
| L3 CSS | 0.53 | 0.01 | 0.47 | 0.01 | 1.00 | 0.02 |
| τ/µs | ±Er | β | ±Er | |||
| Ref CS | 4540.11 | 37.65 | 0.90 | 0.01 | ||
| L3 CSS | 1949.52 | 18.22 | 0.74 | 0.01 | ||
| L2 CSS | 1089.24 | 11.53 | 0.68 | 0.01 | ||
| L1 CSS | 928.10 | 10.09 | 0.66 | 0.01 | ||
| L0 CS | 623.73 | 16.29 | 0.60 | 0.01 | ||
| Pr(III) Luminescence at 608 nm (1D2 → 3H4) [CSS Samples, with Eu(III)] | ||||||
| τAD/µs | ±Er | βAD | ±Er | |||
| L3 CSS | 1.94 | 0.04 | 0.66 | 0.01 | ||
| L2 CSS | 1.02 | 0.06 | 0.6 | 0.02 | ||
| L1 CSS | 0.34 | 0.06 | 0.51 | 0.03 | ||
| L0 CS | 0.32 | 0.05 | 0.51 | 0.03 | ||
| Pr(III) Luminescence at 608 nm (1D2 → 3H4) [CS Samples → No Eu(III)] | ||||||
| τA/µs | ±Er | βA | ±Er | |||
| L3 CS | 1.26 | 0.01 | 0.59 | 1.26 | ||
| L2 CS | 0.33 | 0.01 | 0.49 | 0.33 | ||
| L1 CS | 0.03 | 0.01 | 0.39 | 0.03 | ||
| L0 C | 0.08 | 0.04 | 0.52 | 0.08 | ||
| Enhancement Factor for τ(CSS/AD)/τ(CS/A) of Pr(III) Luminescence at 608 nm (1D2 → 3H4) | ||||||
| L3 CSS/CS | 1.94 µs/1.26 µs → 1.5 | |||||
| L2 CSS/CS | 1.02 µs/0.33 µs → 3.1 | |||||
| L1 CSS/CS | 0.34 µs/0.03 µs → 11.3 | |||||
| L0 CS/C | 0.32 µs/0.08 µs → 4.0 | |||||
| Set Y300 | Core-Shell: without Eu(III) | Core-Shell-Shell: with Eu(III) | Pr(III) PL Enhancement τ(CSS/AD)/τ(CS/A) | ||
|---|---|---|---|---|---|
| τA/µs | Heterogeneity Parameter βA | τAD/µs | Heterogeneity Parameter βAD | ||
| Peak 1: L3 | 1.51 ± 0.01 | 0.61 ± 0.01 | 1.91 ± 0.02 | 0.64 ± 0.01 | 1.3 |
| Peak 1: L2 | 0.35 ± 0.01 | 0.49 ± 0.01 | 0.88 ± 0.01 | 0.56 ± 0.01 | 2.5 |
| Peak 1: L1 | 0.02 ± 0.01 | 0.34 ± 0.02 | 0.37 ± 0.02 | 0.51 ± 0.01 | 17 |
| Peak 1: L0 | 0.01 ± 0.01 | 0.35 ± 0.04 | Not measured | Not measured | |
| Peak 2: L3 | 1.52 ± 0.01 | 0.62 ± 0.01 | 1.91 ± 0.02 | 0.64 ± 0.01 | 1.3 |
| Peak 2: L2 | 0.37 ± 0.01 | 0.49 ± 0.01 | 1.01 ± 0.03 | 0.60 ± 0.01 | 2.7 |
| Peak 2: L1 | 0.01 ± 0.01 | 0.43 ± 0.03 | 0.50 ± 0.03 | 0.57 ± 0.01 | 50 |
| Peak 2: L0 | 0.01 ± 0.01 | 0.51 ± 0.06 | Not measured | Not measured | |
| Eu(III) Luminescence at 616 nm (5D0 → 7F2), λex = 465 nm | ||||||
|---|---|---|---|---|---|---|
| τ(Donor)/µs | ±Er | β | ±Er | |||
| Ref CS (Donor only) | 2813.85 | 22.00 | 0.82 | 0.01 | ||
| #acceptor | ±Er | γ | ±Er | α | ±Er | |
| L0 CS | 1.90 | 0.02 | 1.68 | 0.02 | 1.00 | 0.02 |
| L1 CSS | 1.25 | 0.02 | 1.11 | 0.02 | 1.00 | 0.02 |
| L2 CSS | 0.57 | 0.01 | 0.51 | 0.01 | 1.00 | 0.02 |
| L3 CSS | 0.37 | 0.01 | 0.33 | 0.01 | 1.00 | 0.03 |
| τ/µs | ±Er | β | ±Er | |||
| Ref CS | 2813.85 | 22.00 | 0.82 | 0.01 | ||
| L3 CSS | 1504.81 | 13.52 | 0.73 | 0.01 | ||
| L2 CSS | 1155.81 | 9.73 | 0.72 | 0.01 | ||
| L1 CSS | 506.79 | 5.97 | 0.65 | 0.01 | ||
| L0 CS | 232.70 | 5.732 | 0.59 | 0.01 | ||
References
- Zhu, X.; Zhang, J.; Liu, J.; Zhang, Y. Recent Progress of Rare-Earth Doped Upconversion Nanoparticles: Synthesis, Optimization, and Applications. Adv. Sci. 2019, 6, 1901358. [Google Scholar] [CrossRef] [Green Version]
- Tessitore, G.; Mandl, G.A.; Brik, M.G.; Park, W.; Capobianco, J.A. Recent insights into upconverting nanoparticles: Spectroscopy, modeling, and routes to improved luminescence. Nanoscale 2019, 11, 12015–12029. [Google Scholar] [CrossRef]
- Naccache, R.; Yu, Q.; Capobianco, J.A. The Fluoride host: Nucleation, growth, and upconversion of lanthanide-doped nanoparticles. Adv. Opt. Mater. 2015, 3, 482–509. [Google Scholar] [CrossRef]
- Würth, C.; Kaiser, M.; Wilhelm, S.; Grauel, B.; Hirsch, T.; Resch-Genger, U. Excitation power dependent population pathways and absolute quantum yields of upconversion nanoparticles in different solvents. Nanoscale 2017, 9, 4283–4294. [Google Scholar] [CrossRef]
- DaCosta, M.V.; Doughan, S.; Han, Y.; Krull, U.J. Lanthanide upconversion nanoparticles and applications in bioassays and bioimaging: A review. Anal. Chim. Acta 2014, 832, 1–33. [Google Scholar] [CrossRef]
- Chen, G.; Qiu, H.; Prasad, P.N.; Chen, X. Upconversion nanoparticles: Design, nanochemistry, and applications in theranostics. Chem. Rev. 2014, 114, 5161–5214. [Google Scholar] [CrossRef]
- Muhr, V.; Wilhelm, S.; Hirsch, T.; Wolfbeis, O.S. Upconversion nanoparticles: From hydrophobic to hydrophilic surfaces. Acc. Chem. Res. 2014, 47, 3481–3493. [Google Scholar] [CrossRef] [PubMed]
- Andresen, E.; Resch-Genger, U.; Schäferling, M. Surface Modifications for Photon-Upconversion-Based Energy-Transfer Nanoprobes. Langmuir 2019, 35, 5093–5113. [Google Scholar] [CrossRef] [PubMed]
- Gorris, H.H.; Wolfbeis, O.S. Photon-upconverting nanoparticles for optical encoding and multiplexing of cells, biomolecules, and microspheres. Angew. Chem.-Int. Ed. 2013, 52, 3584–3600. [Google Scholar] [CrossRef] [PubMed]
- Hudry, D.; Busko, D.; Popescu, R.; Gerthsen, D.; Abeykoon, A.M.M.; Kübel, C.; Bergfeldt, T.; Richards, B.S. Direct Evidence of Significant Cation Intermixing in Upconverting Core@Shell Nanocrystals: Toward a New Crystallochemical Model. Chem. Mater. 2017, 29, 9238–9246. [Google Scholar] [CrossRef]
- Hudry, D.; Popescu, R.; Diaz-Lopez, M.; Abeykoon, A.M.M.; Bordet, P.; Gerthsen, D.; Howard, I.A.; Richards, B.S. Interface disorder in large single- and multi-shell upconverting nanocrystals. J. Mater. Chem. C 2019, 7, 1164–1172. [Google Scholar] [CrossRef]
- Hudry, D.; Busko, D.; Popescu, R.; Gerthsen, D.; Howard, I.A.; Richards, B.S. An enhanced energy migration strategy in upconverting nanocrystals: Color-tuning with high quantum yield. J. Mater. Chem. C 2019, 7, 7371–7377. [Google Scholar] [CrossRef]
- Hudry, D.; Howard, I.A.; Popescu, R.; Gerthsen, D.; Richards, B.S. Structure-Property Relationships in Lanthanide-Doped Upconverting Nanocrystals: Recent Advances in Understanding Core–Shell Structures. Adv. Mater. 2019, 31, 1900623. [Google Scholar] [CrossRef]
- Diogenis, I.M.S.; Rodrigues, E.M.; Mazali, I.O.; Sigoli, F.A. Spectroscopic evidence of preferential excitation of interfacial EuIII by interfacial energy transfer process on core@shell nanoparticles. J. Lumin. 2021, 232, 117848. [Google Scholar] [CrossRef]
- Liu, L.; Li, X.; Fan, Y.; Wang, C.; El-Toni, A.M.; Alhoshan, M.S.; Zhao, D.; Zhang, F. Elemental Migration in Core/Shell Structured Lanthanide Doped Nanoparticles. Chem. Mater. 2019, 31, 5608–5615. [Google Scholar] [CrossRef]
- Chen, B.; Peng, D.; Chen, X.; Qiao, X.; Fan, X.; Wang, F. Establishing the structural integrity of core-shell nanoparticles against elemental migration using luminescent lanthanide probes. Angew. Chem.-Int. Ed. 2015, 54, 12788–12790. [Google Scholar] [CrossRef]
- Dong, H.; Sun, L.D.; Li, L.D.; Si, R.; Liu, R.; Yan, C.H. Selective cation exchange enabled growth of lanthanide core/shell nanoparticles with dissimilar structure. J. Am. Chem. Soc. 2017, 139, 18492–18495. [Google Scholar] [CrossRef] [PubMed]
- Goldschmidt, V.M. Die Gesetze der Krystallochemie. Naturwissenschaften 1926, 14, 477–485. [Google Scholar] [CrossRef]
- Bastian, P.U.; Nacak, S.; Roddatis, V.; Kumke, M.U. Tracking the motion of lanthanide ions within core–shell–shell NaYF4 nanocrystals via resonance energy transfer. J. Phys. Chem. C 2020, 124, 11229–11238. [Google Scholar] [CrossRef]
- Horrocks, W.D.W.; Sudnick, D.R. Lanthanide ion luminescence probes of the structure of biological macromolecules. Acc. Chem. Res. 1981, 14, 384–392. [Google Scholar] [CrossRef]
- Wang, F.; Han, Y.; Lim, C.S.; Lu, Y.; Wang, J.; Xu, J.; Chen, H.; Zhang, C.; Hong, M.; Liu, X. Simultaneous phase and size control of upconversion nanocrystals through lanthanide doping. Nature 2010, 463, 1061–1065. [Google Scholar] [CrossRef] [PubMed]
- Liu, Q.; Sun, Y.; Yang, T.; Feng, W.; Li, C.; Li, F. Sub-10 nm hexagonal lanthanide-doped NaLuF 4 upconversion nanocrystals for sensitive bioimaging in vivo. J. Am. Chem. Soc. 2011, 133, 17122–17125. [Google Scholar] [CrossRef] [PubMed]
- Jia, H.; Zhou, Y.; Li, X.; Li, Y.; Zhang, W.; Fu, H.; Zhao, J.; Pan, L.; Liu, X.; Qiu, J. Synthesis and phase transformation of NaGdF4:Yb-Er thin films using electro-deposition method at moderate temperatures. CrystEngComm 2018, 20, 6919–6924. [Google Scholar] [CrossRef]
- Park, Y.I.; Kim, H.M.; Kim, J.H.; Moon, K.C.; Yoo, B.; Lee, K.T.; Lee, N.; Choi, Y.; Park, W.; Ling, D.; et al. Theranostic probe based on lanthanide-doped nanoparticles for simultaneous in vivo dual-modal imaging and photodynamic therapy. Adv. Mater. 2012, 24, 5755–5761. [Google Scholar] [CrossRef] [PubMed]
- Annapurna, K.; Dwivedi, R.N.; Buddhudu, S. Energy transfer luminescence in (Eu3+,Nd3+): Tellurite glass. Opt. Mater. 2000, 13, 381–388. [Google Scholar] [CrossRef]
- Sharp, E.J.; Weber, M.J.; Cleek, G. Energy transfer and fluorescence quenching in Eu- and Nd-doped silicate glasses. J. Appl. Phys. 1970, 41, 364–369. [Google Scholar] [CrossRef]
- Abad Galán, L.; Sobolev, A.N.; Skelton, B.W.; Zysman-Colman, E.; Ogden, M.I.; Massi, M. Energy transfer between Eu3+ and Nd3+ in near-infrared emitting β-triketonate coordination polymers. Dalt. Trans. 2018, 47, 12345–12352. [Google Scholar] [CrossRef] [Green Version]
- Joshi, J.C.; Pandey, N.C.; Joshi, B.C.; Belwal, R.; Joshi, J. Quantum efficiency of Diffusion-Limited Energy Transfer from Eu3+ → Nd3+ in Borate Glass. J. Solid State Chem. 1978, 23, 135–139. [Google Scholar] [CrossRef]
- Kandpal, H.C.; Tripathi, H.B. Non-radiative energy transfer from Eu3+ to Pr3+ and Eu3+ to Er3+ in DMSO. Solid State Commun. 1979, 29, 103–107. [Google Scholar] [CrossRef]
- Chen, Y.; Wang, J.; Liu, C.; Tang, J.; Kuang, X.; Wu, M.; Su, Q. UV-Vis-NIR luminescence properties and energy transfer mechanism of LiSrPO4:Eu2+, Pr3+ suitable for solar spectral convertor. Opt. Express 2013, 21, 3161. [Google Scholar] [CrossRef]
- Li, Y.; Wang, J.; Wang, X.M.; Pan, F.; Zhou, T.; Xie, R.J. Colour tuning via crystalline site-selected energy transfer in a Sr2SiO4:Eu2+,Pr3+ phosphor. J. Mater. Chem. C 2017, 5, 1022–1026. [Google Scholar] [CrossRef]
- Da Gama, A.A.S.; De Sá, G.F.; Porcher, P.; Caro, P. Energy levels of Nd3+ in LiYF4. J. Chem. Phys. 1981, 75, 2583–2587. [Google Scholar] [CrossRef]
- Runowski, M.; Woźny, P.; Martín, I.R.; Lavín, V.; Lis, S. Praseodymium doped YF3:Pr3+ nanoparticles as optical thermometer based on luminescence intensity ratio (LIR)—Studies in visible and NIR range. J. Lumin. 2019, 214, 116571. [Google Scholar] [CrossRef]
- Hao, S.; Shao, W.; Qiu, H.; Shang, Y.; Fan, R.; Guo, X.; Zhao, L.; Chen, G.; Yang, C. Tuning the size and upconversion emission of NaYF4:Yb3+/Pr3+ nanoparticles through Yb3+ doping. RSC Adv. 2014, 4, 56302–56306. [Google Scholar] [CrossRef]
- Dieke, G.H.; Crosswhite, H.M. The Spectra of the Doubly and Triply Ionized Rare Earths. Appl. Opt. 1963, 2, 675–686. [Google Scholar] [CrossRef]
- Carnall, W.T.; Fields, P.R.; Rajnak, K. Electronic Energy Levels in the Trivalent Lanthanide Aquo Ions. I. Pr3+, Nd3+, Pm3+, Sm3+, Dy3+, Ho3+, Er3+, and Tm3+. J. Chem. Phys. 1968, 49, 4424–4442. [Google Scholar] [CrossRef]
- Carnall, W.T.; Fields, P.R.; Rajnak, K. Electronic Energy Levels of the Trivalent Lanthanide Aquo Ions. IV. Eu3+. J. Chem. Phys. 1968, 49, 4450–4455. [Google Scholar] [CrossRef]
- Nakazawa, E.; Shionoya, S. Energy transfer between trivalent rare-earth ions in inorganic solids. J. Chem. Phys. 1967, 47, 3267–3270. [Google Scholar] [CrossRef]
- Hesse, J.; Klier, D.T.; Sgarzi, M.; Nsubuga, A.; Bauer, C.; Grenzer, J.; Hübner, R.; Wislicenus, M.; Joshi, T.; Kumke, M.U.; et al. Rapid Synthesis of Sub-10 nm Hexagonal NaYF4-Based Upconverting Nanoparticles using Therminol® 66. ChemistryOpen 2018, 7, 159–168. [Google Scholar] [CrossRef] [Green Version]
- Aebischer, A.; Hostettler, M.; Hauser, J.; Krämer, K.; Weber, T.; Güdel, H.U.; Bürgi, H.B. Structural and spectroscopic characterization of active sites in a family of light-emitting sodium lanthanide tetrafluorides. Angew. Chem.-Int. Ed. 2006, 45, 2802–2806. [Google Scholar] [CrossRef]
- Szefczyk, B.; Roszak, R.; Roszak, S. Structure of the hexagonal NaYF4 phase from first-principles molecular dynamics. RSC Adv. 2014, 4, 22526–22535. [Google Scholar] [CrossRef]
- Grzechnik, A.; Bouvier, P.; Mezouar, M.; Mathews, M.D.; Tyagi, A.K.; Köhler, J. Hexagonal Na1.5Y1.5F6 at high pressures. J. Solid State Chem. 2002, 165, 159–164. [Google Scholar] [CrossRef]
- Krämer, K.W.; Biner, D.; Frei, G.; Güdel, H.U.; Hehlen, M.P.; Lüthi, S.R. Hexagonal Sodium Yttrium Fluoride Based Green and Blue Emitting Upconversion Phosphors. Chem. Mater. 2004, 16, 1244–1251. [Google Scholar] [CrossRef]
- Burns, J.H. Crystal Structure of Hexagonal Sodium Neodymium Fluoride and Related Compounds. Inorg. Chem. 1965, 4, 881–886. [Google Scholar] [CrossRef]
- Mackenzie, L.E.; Goode, J.A.; Vakurov, A.; Nampi, P.P.; Saha, S.; Jose, G.; Millner, P.A. The theoretical molecular weight of NaYF4: RE upconversion nanoparticles. Sci. Rep. 2018, 8, 1106. [Google Scholar] [CrossRef] [Green Version]
- Wu, X.; Zhan, S.; Han, J.; Liu, Y. Nanoscale Ultrasensitive Temperature Sensing Based on Upconversion Nanoparticles with Lattice Self-Adaptation. Nano Lett. 2021, 21, 272–278. [Google Scholar] [CrossRef]
- Valeur, B. Molecular Fluorescence—Principles and Applications; Wiley-VCH Verlag: Weinheim, Germany, 2002; ISBN 352729919X. [Google Scholar]
- Benny Lee, K.C.; Siegel, J.; Webb, S.E.D.; Lévêque-Fort, S.; Cole, M.J.; Jones, R.; Dowling, K.; Lever, M.J.; French, P.M.W. Application of the stretched exponential function to fluorescence lifetime imaging. Biophys. J. 2001, 81, 1265–1274. [Google Scholar] [CrossRef] [Green Version]
- Li, K.Y.; Liu, L.Y.; Wang, R.Z.; Xiao, S.G.; Zhou, H.; Yan, H. Broadband sensitization of downconversion phosphor YPO4 by optimizing TiO2 substitution in host lattice co-doped with Pr3+-Yb3+ ion-couple. J. Appl. Phys. 2014, 115, 123103. [Google Scholar] [CrossRef]
- Chen, X.P.; Huang, X.Y.; Zhang, Q.Y. Concentration-dependent near-infrared quantum cutting in NaYF4:Pr3+, Yb3+ phosphor. J. Appl. Phys. 2009, 106, 063518. [Google Scholar] [CrossRef]
- Binnemans, K. Interpretation of europium(III) spectra. Coord. Chem. Rev. 2015, 295, 1–45. [Google Scholar] [CrossRef] [Green Version]
- Rabouw, F.T.; Prins, P.T.; Norris, D.J. Europium-Doped NaYF4 Nanocrystals as Probes for the Electric and Magnetic Local Density of Optical States throughout the Visible Spectral Range. Nano Lett. 2016, 16, 7254–7260. [Google Scholar] [CrossRef] [Green Version]
- Bro, R. PARAFAC tutorial and applications. Chemom. Intell. Lab. Syst. 1997, 38, 149–171. [Google Scholar] [CrossRef]
- Görller-Walrand, C.; Binnemans, K. Rationalization of Crystal-Field Parametrization. In Handbook on the Physics and Chemistry of Rare Earths; Gschneidner, K.A., Eyring, L., Eds.; Elsevier: Amsterdam, The Netherlands, 1996; pp. 173–178. [Google Scholar]
- Voss, B.; Haase, M. Intrinsic focusing of the particle size distribution in colloids containing nanocrystals of two different crystal phases. ACS Nano 2013, 7, 11242–11254. [Google Scholar] [CrossRef] [PubMed]
- Rinkel, T.; Nordmann, J.; Raj, A.N.; Haase, M.; Val’kovskii, M.D.; Sobolev, B.P.; Park, J.; Hwang, N.; Hyeon, T.; Cohen, B.E.; et al. Ostwald-ripening and particle size focussing of sub-10 nm NaYF4 upconversion nanocrystals. Nanoscale 2014, 6, 14523–14530. [Google Scholar] [CrossRef] [PubMed] [Green Version]
- Dühnen, S.; Haase, M. Study on the Intermixing of Core and Shell in NaEuF4/NaGdF4 Core/Shell Nanocrystals. Chem. Mater. 2015, 27, 8375–8386. [Google Scholar] [CrossRef]
- Rinkel, T.; Raj, A.N.; Dühnen, S.; Haase, M. Synthesis of 10 nm β-NaYF4:Yb, Er/NaYF4 core/shell upconversion nanocrystals with 5 nm particle cores. Angew. Chem.-Int. Ed. 2016, 55, 1164–1167. [Google Scholar] [CrossRef]
- Huheey, J.E.; Keiter, E.A.; Keiter, R.L. Anorganische Chemie—Prinzipien von Struktur und Reaktivität; Steudel, R., Ed.; de Gruyter GmbH: Berlin, Germany; Boston, MA, USA, 2012; ISBN 9783110249071. [Google Scholar]
- Pfiffner, O.A.; Engi, M.; Schlunegger, F.; Mezger, K.; Diamond, L. Erdwissenschaften. In Erdwissenschaften; utb GmbH: Bavaria, Germany, 2016; p. 285. [Google Scholar]
- Oh, N.; Shim, M. Metal oleate induced etching and growth of semiconductor nanocrystals, nanorods, and their heterostructures. J. Am. Chem. Soc. 2016, 138, 10444–10451. [Google Scholar] [CrossRef] [PubMed]
- Liu, D.; Xu, X.; Du, Y.; Qin, X.; Zhang, Y.; Ma, C.; Wen, S.; Ren, W.; Goldys, E.M.; Piper, J.A.; et al. Three-dimensional controlled growth of monodisperse sub-50 nm heterogeneous nanocrystals. Nat. Commun. 2016, 7, 10254. [Google Scholar] [CrossRef] [Green Version]


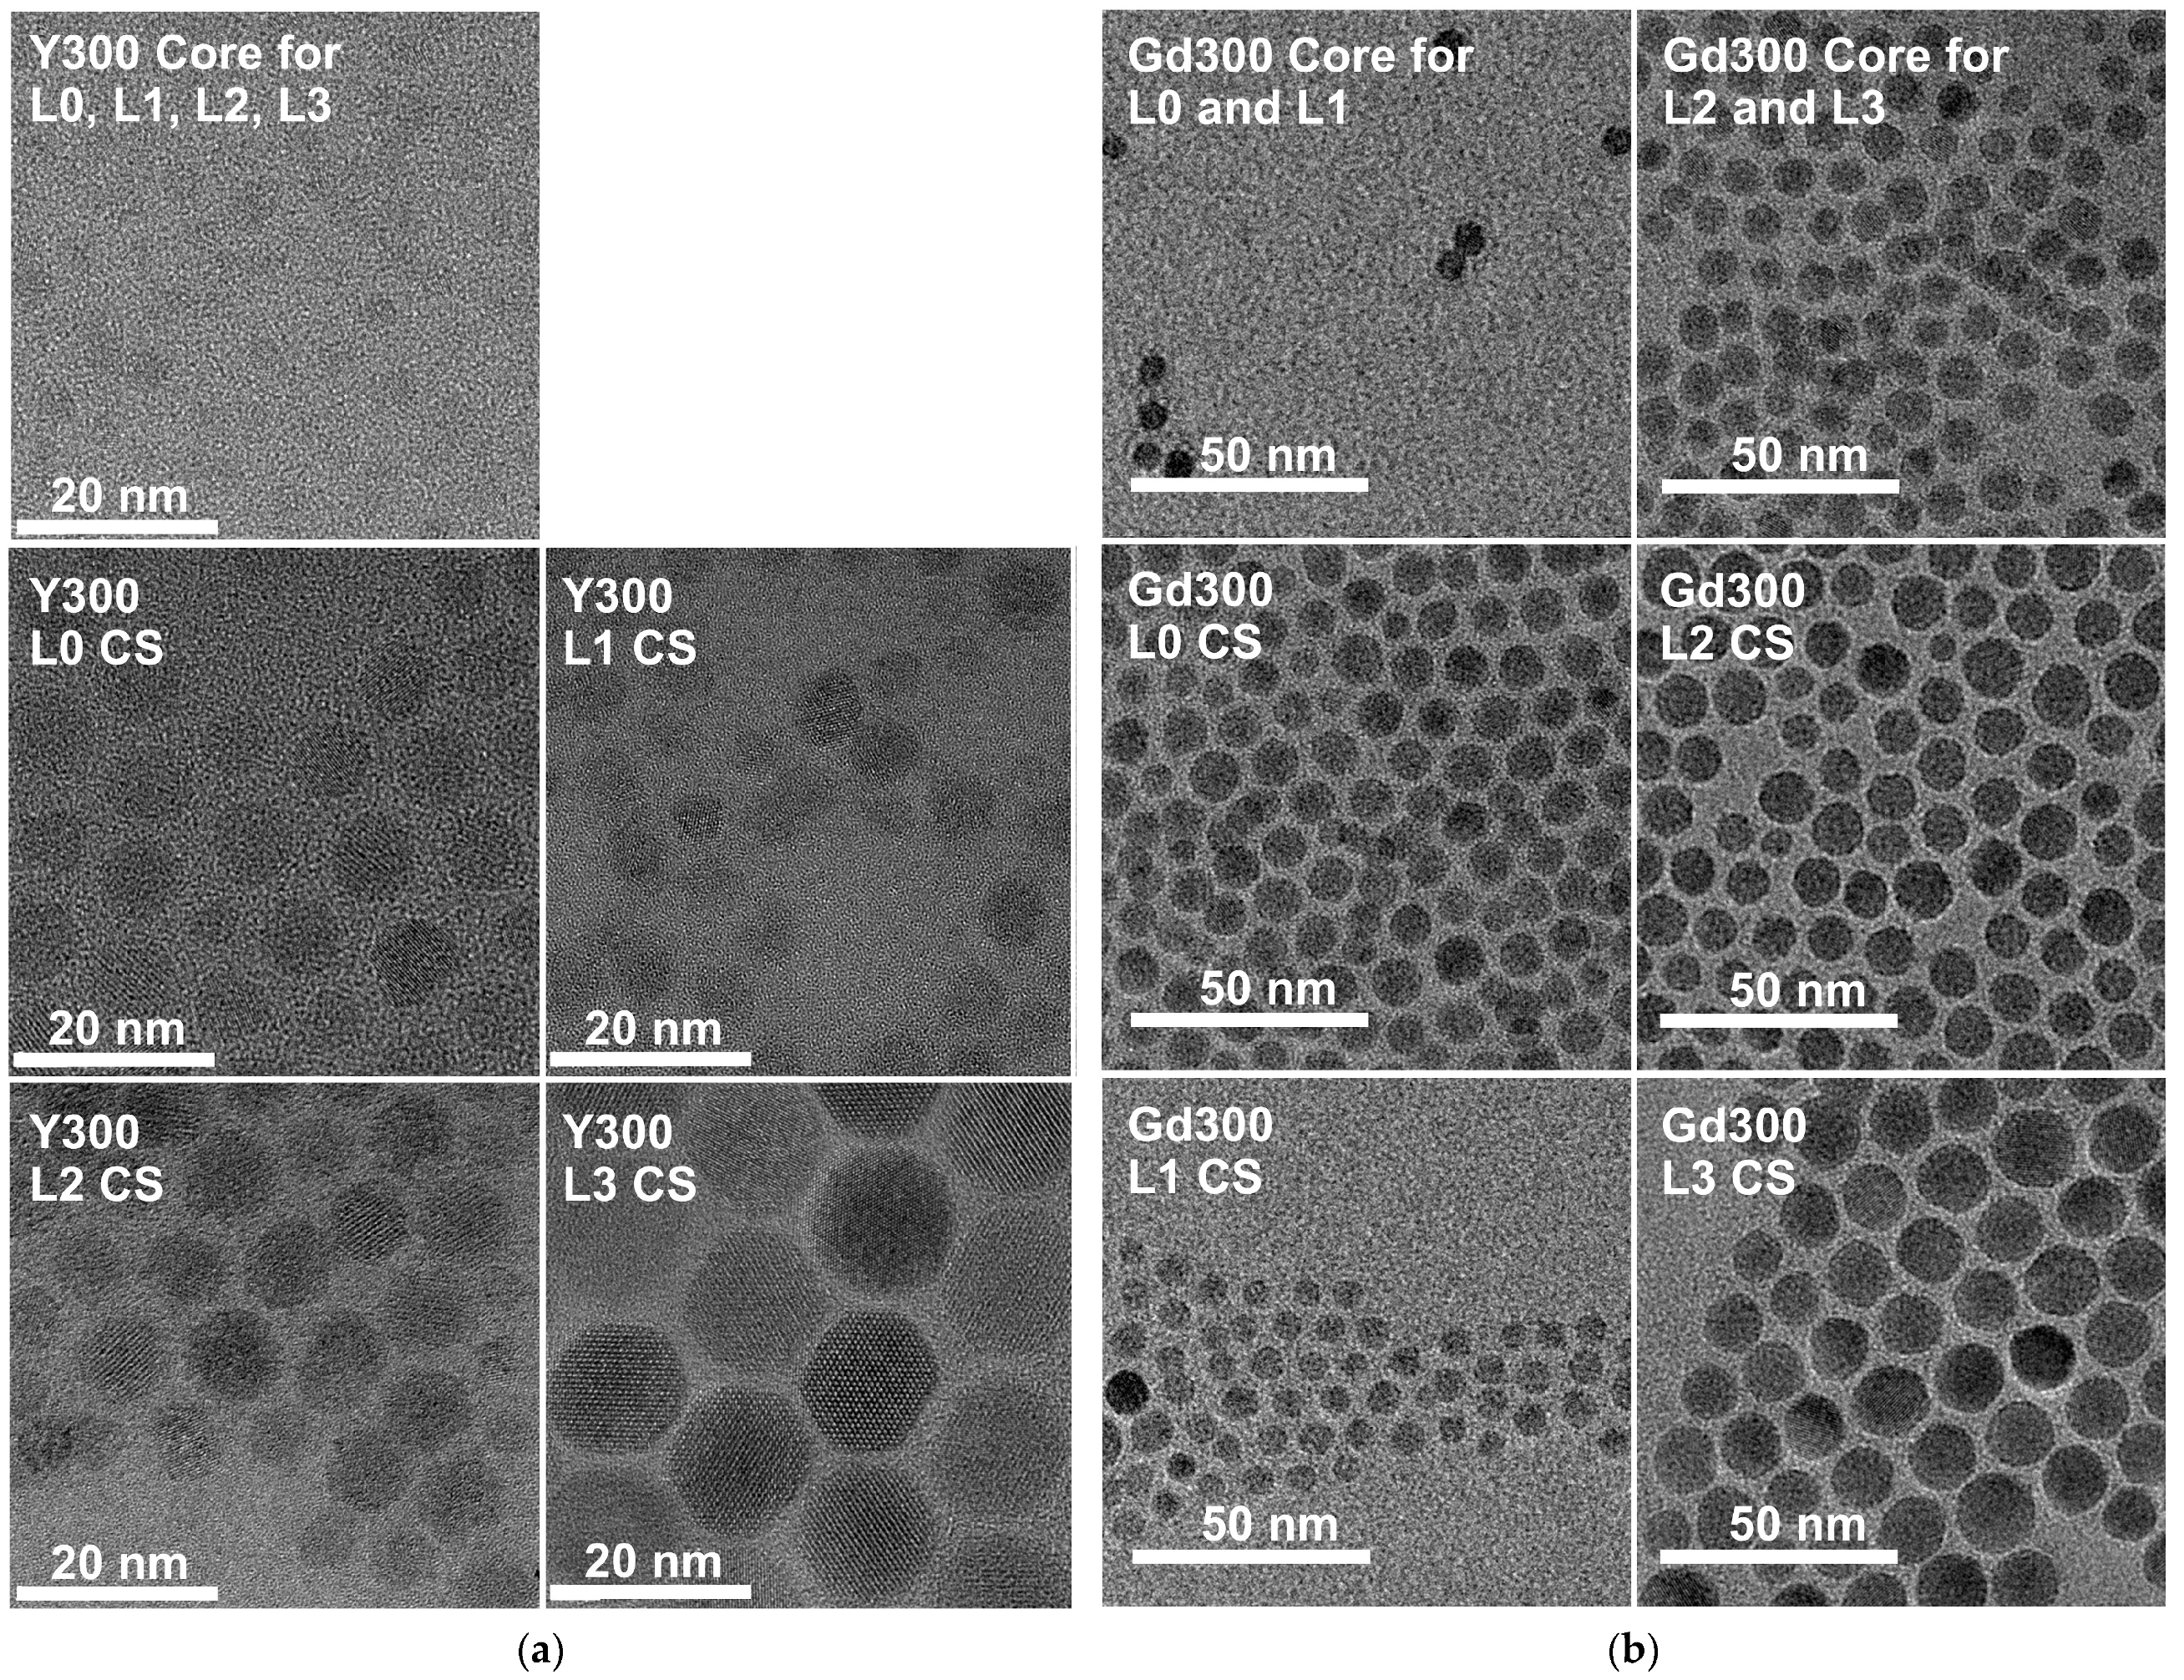
| Set Y300 (NaYF4; ϑ = 320 °C) | Sample Composition | Diameter of Core-Shell (CS) Samples/nm | Insulation Shell Thickness/nm |
| Y300 Ref CS | NaYF4 @ NaYF4:Eu | -/- | -/- |
| Y300 L0 CS 1 | NaYF4:Pr @ NaYF4:Eu | 7.7 ± 1.5 | 0 |
| Y300 L1 CSS 1 | NaYF4:Pr @ NaYF4 @ NaYF4:Eu | 6.5 ± 1.3 | 1.4 ± 0.7 |
| Y300 L2 CSS 1 | vide supra | 7.7 ± 1.4 | 2.0 ± 0.8 |
| Y300 L3 CSS 1 | vide supra | 15.7 ± 1.0 | 6.0 ± 0.5 |
| Set Gd300 (NaGdF4; ϑ = 320 °C) | Sample Composition | Diameter of Core-Shell (CS) Samples/nm | Insulation Shell Thickness/nm |
| Gd300 Ref CS | NaGdF4 @ NaGdF4:Eu | -/- | -/- |
| Gd300 L0 CS 2 | NaGdF4:Nd @ NaGdF4:Eu | 8.9 ± 1.5 | 0 |
| Gd300 L1 CSS 2 | NaGdF4:Nd @ NaGdF4 @ NaGdF4:Eu | 7.1 ± 0.4 | 0.7 ± 0.5 |
| Gd300 L2 CSS 3 | vide supra | 10.8 ± 1.5 | 1.0 ± 1.0 |
| Gd300 L3 CSS 3 | vide supra | 14.4 ± 1.5 | 2.8 ± 1.0 |
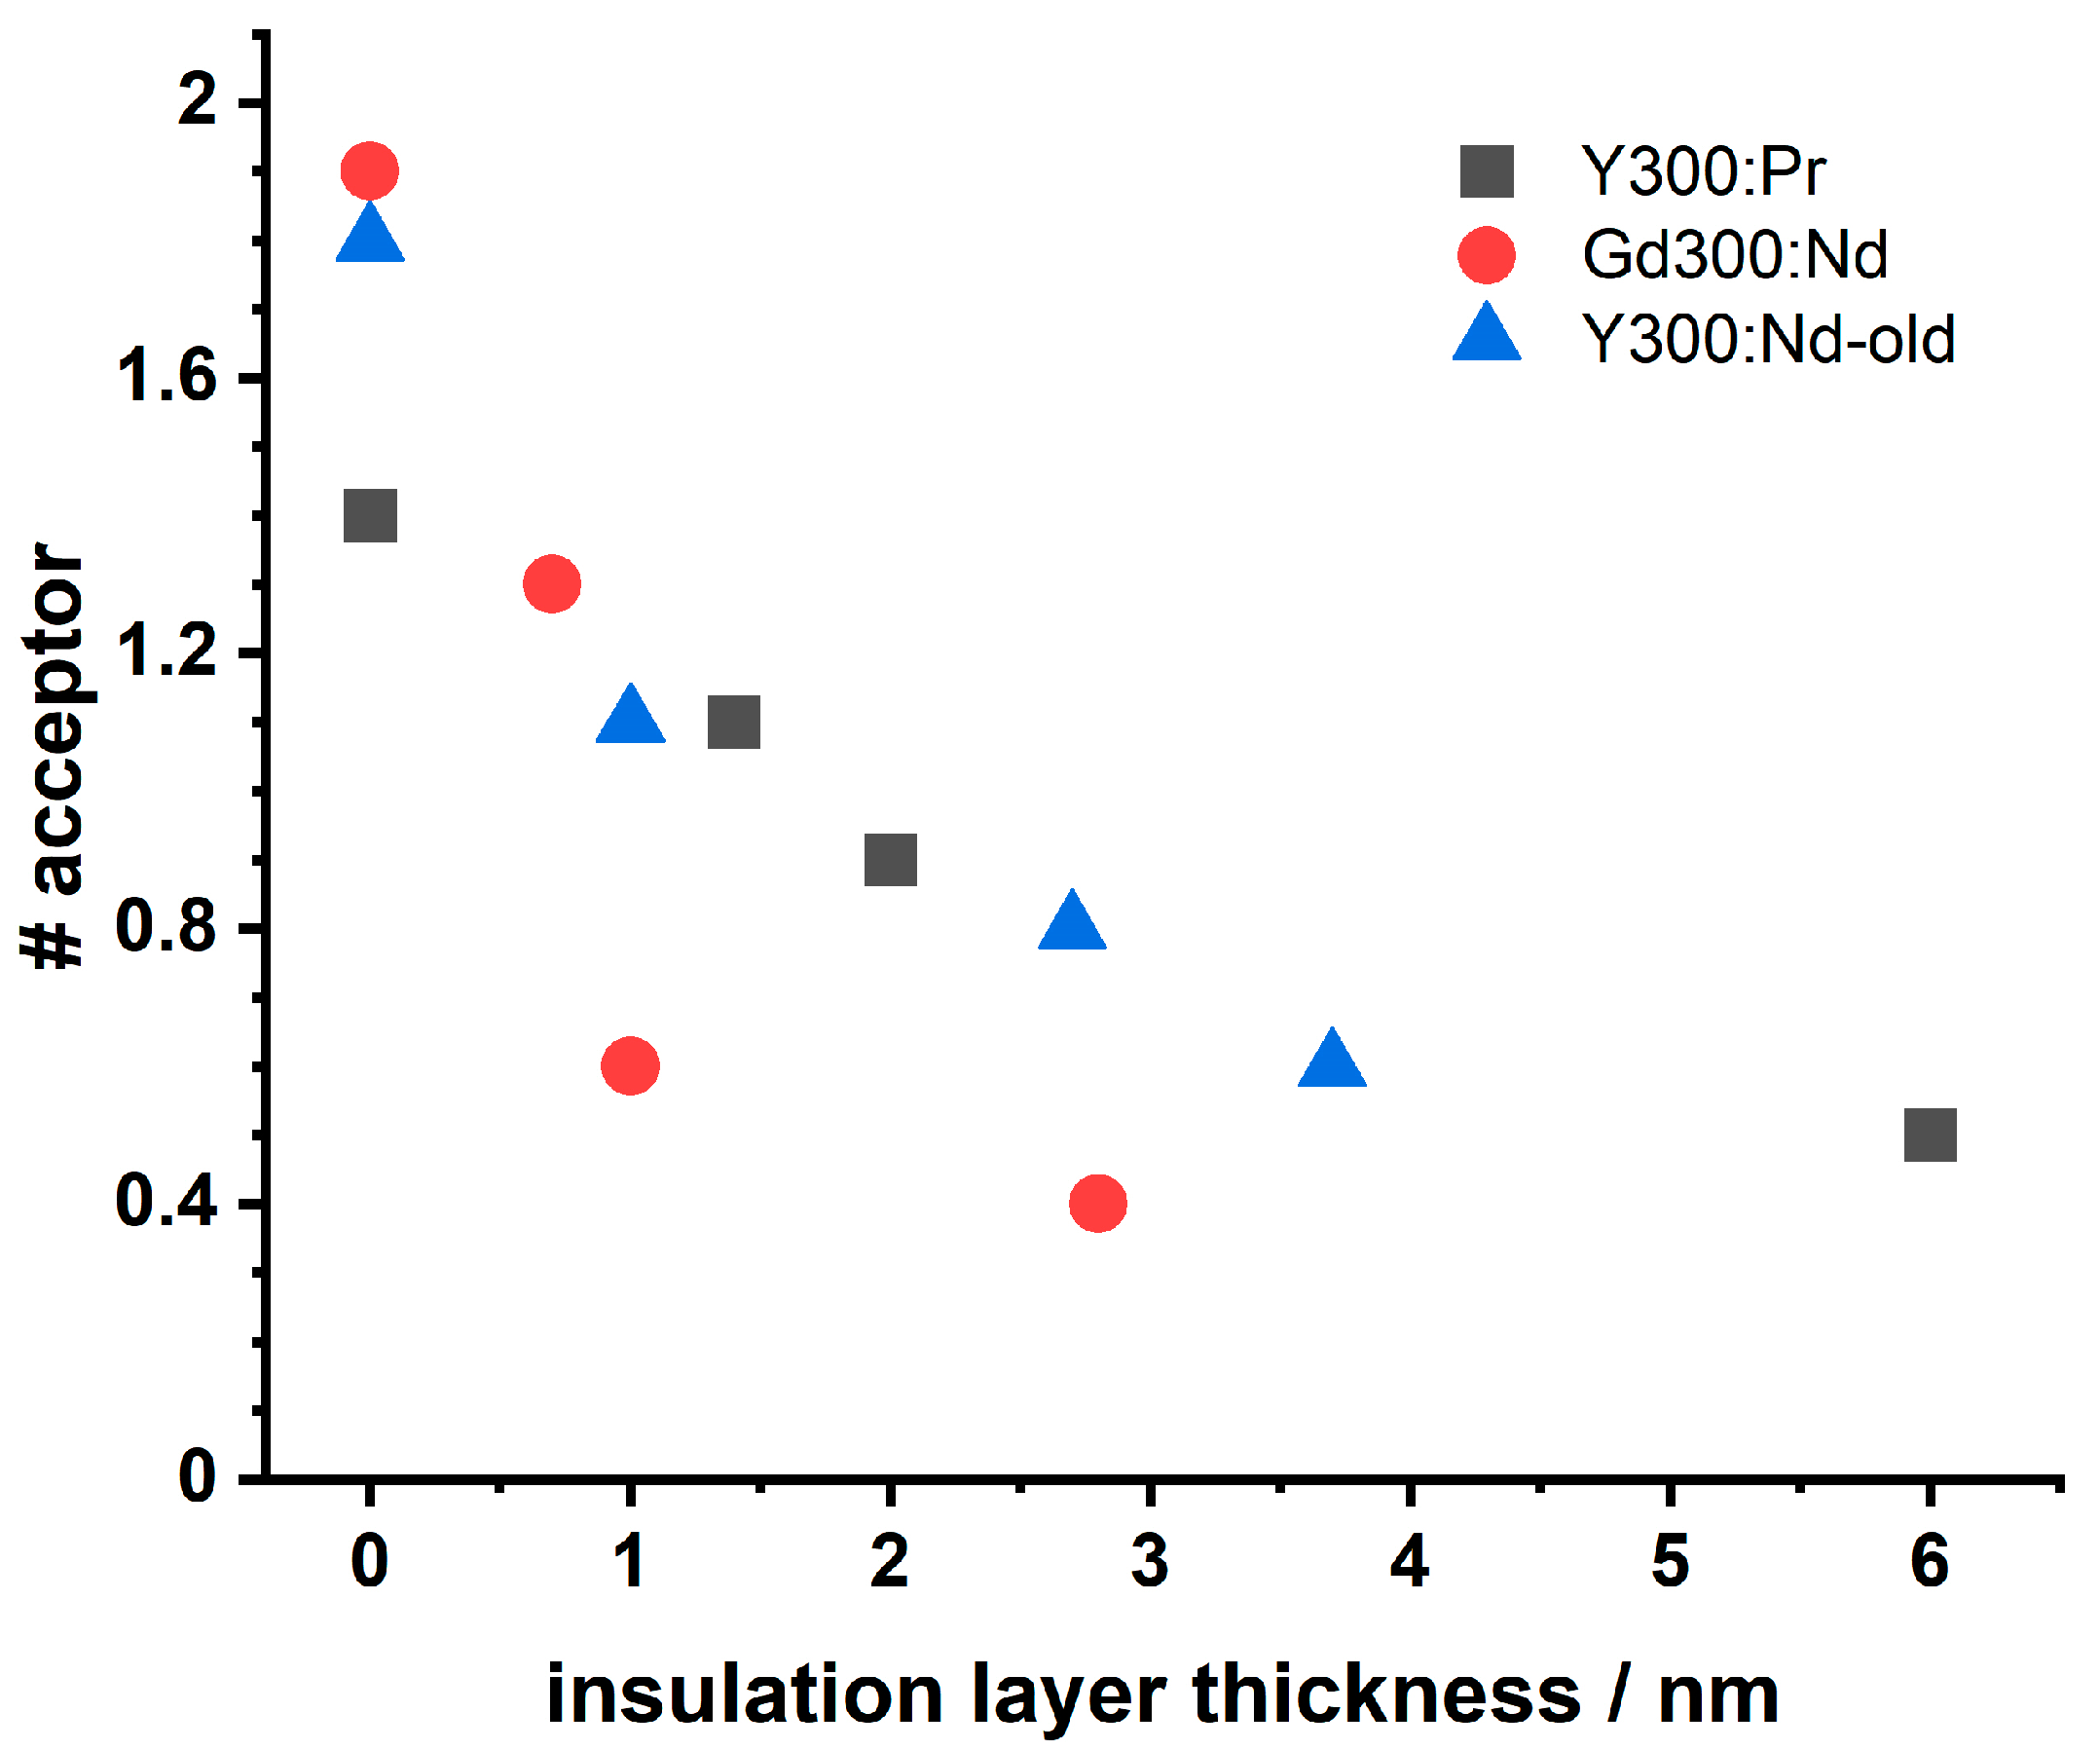
| Set Y300 | Ref CS | L3 CSS | L2 CSS | L1 CSS | L0 CS |
|---|---|---|---|---|---|
| Insulation shell thickness/nm | -/- | 6.0 | 2.0 | 1.4 | 0 |
| #acceptors | -/- | 0.5 | 0.9 | 1.1 | 1.4 |
| Eu(III) PL decay time τ/µs | 4540 | 1950 | 1089 | 928 | 624 |
| ELRET | 0.57 | 0.76 | 0.80 | 0.86 | |
| Pr(III) PL decay time τAD/µs (for CSS, w/Eu(III)) | -/- | 1.9 | 1.0 | 0.3 | 0.3 |
| Pr(III) PL decay time τA/µs (for CS, w/o Eu(III)) | 1.3 | 0.3 | 0.03 | 0.08 | |
| Pr(III) PL enhancement by Eu(III) presence | 1.5 | 3 | 11 | 4 |
| Set Gd300 | Ref CS | L3 CSS | L2 CSS | L1 CSS | L0 CS |
|---|---|---|---|---|---|
| Insulation shell thickness/nm | -/- | 2.8 | 1.0 | 0.7 | 0 |
| #acceptors | -/- | 0.4 | 0.6 | 1.3 | 1.9 |
| Eu(III) PL decay time τ/µs | 2814 | 1505 | 1156 | 507 | 233 |
| ELRET | 0.47 | 0.59 | 0.82 | 0.92 |
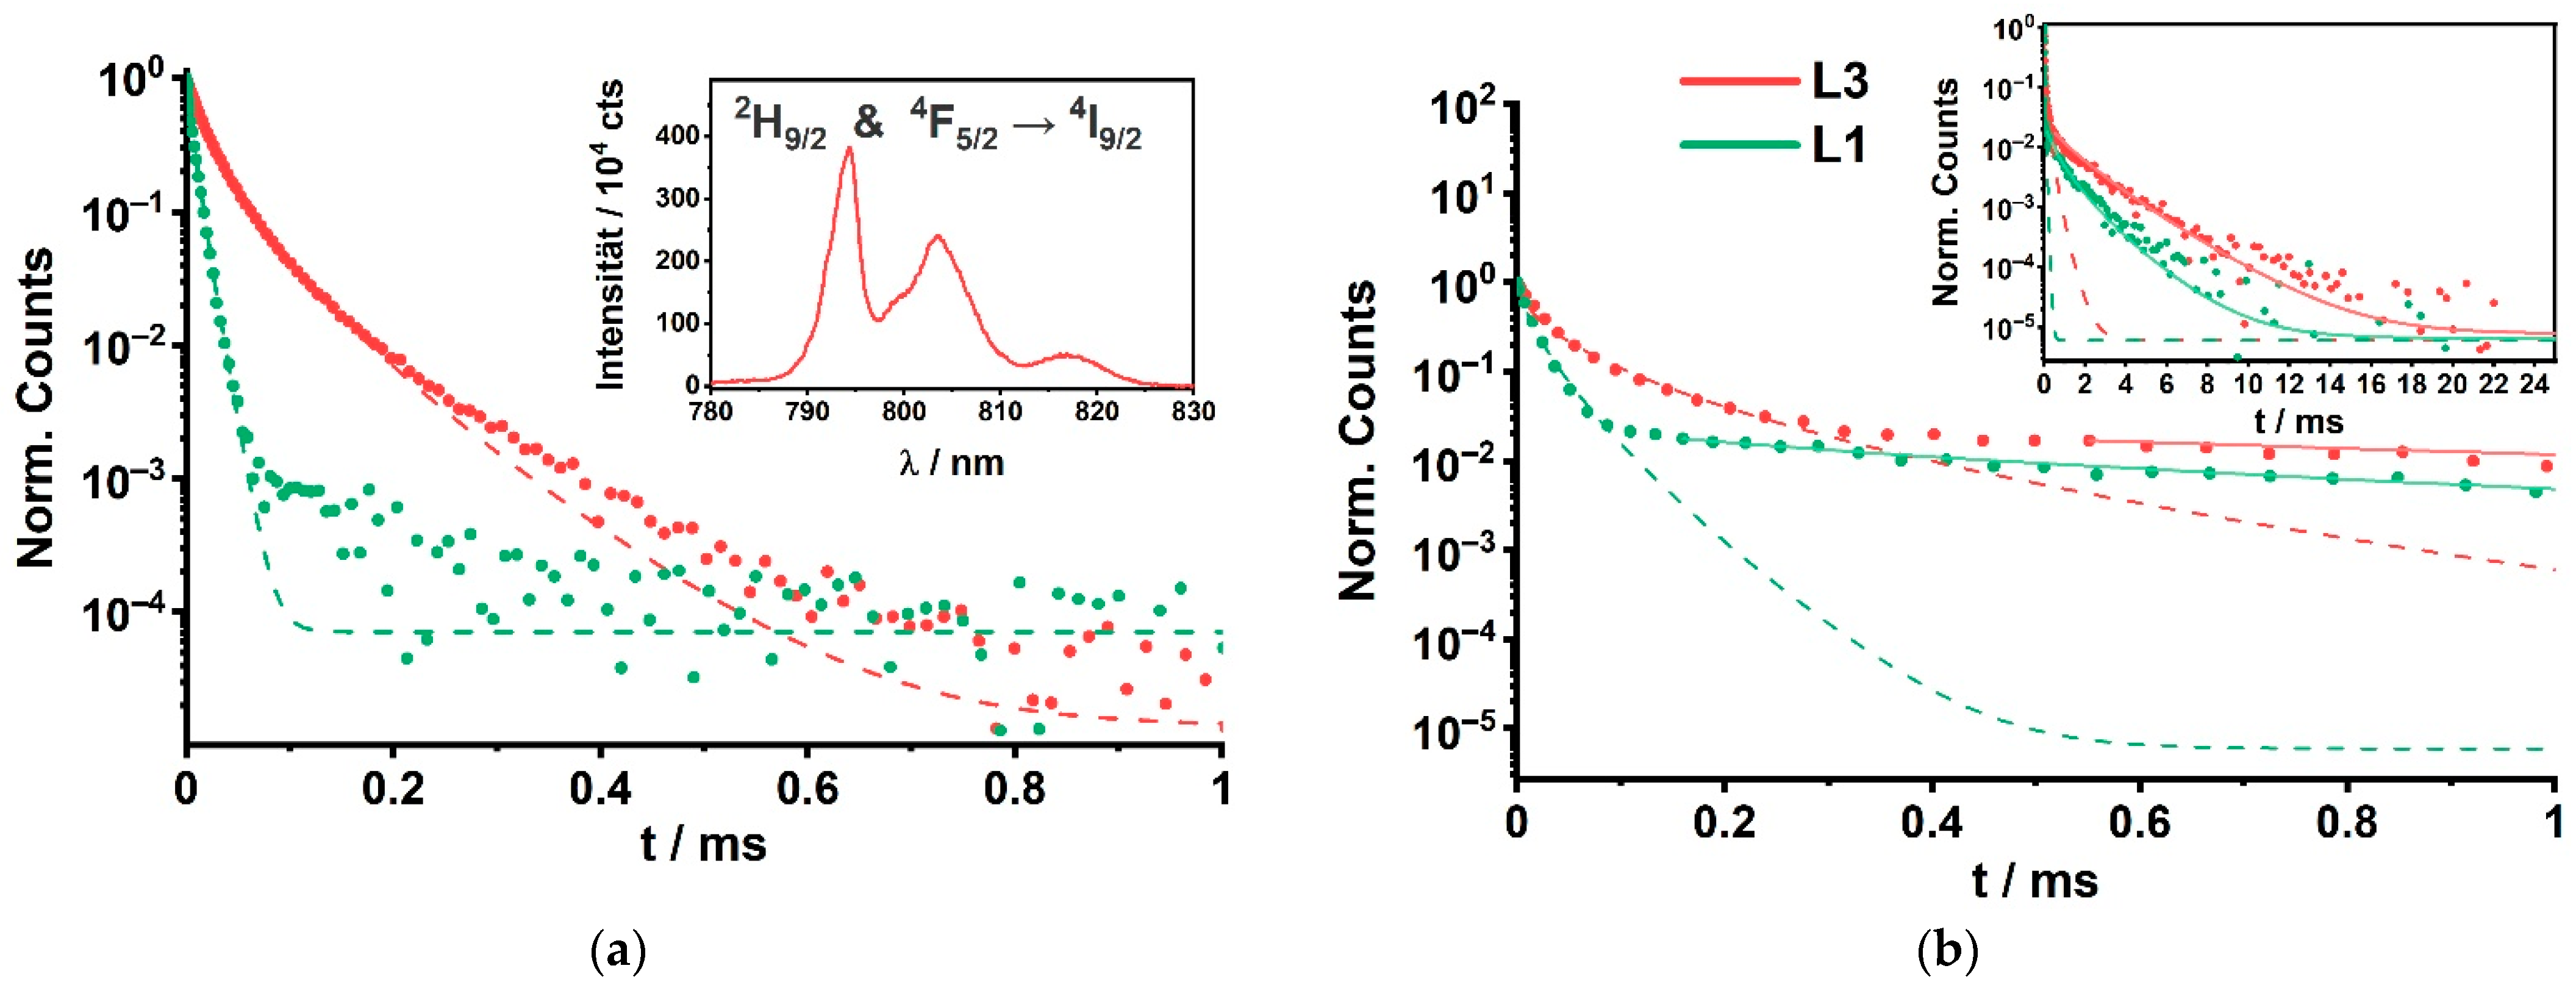
| Gd300 | Core-Shell: no Eu(III) | Core-Shell-Shell: with Eu(III) | Nd(III) PL Enhancement | ||
|---|---|---|---|---|---|
| τA/µs | Heterogeneity Parameter β | τAD/µs | Heterogeneity Parameter β | τ(CSS)/τ(CS) = τAD/τA | |
| L3 | 16.0 ± 0.2 | 0.64 ± 0.01 | 19.3 ± 3.7 1036 ± 166 | 0.51 ± 0.04 0.78 ± 0.06 | 1.2 65 |
| L1 | 6.3 ± 0.1 | 0.86 ± 0.01 | 12.0 ± 2.5 374 ± 72 | 0.68 ± 0.08 0.64 ± 0.05 | 1.9 59 |
Publisher’s Note: MDPI stays neutral with regard to jurisdictional claims in published maps and institutional affiliations. |
© 2021 by the authors. Licensee MDPI, Basel, Switzerland. This article is an open access article distributed under the terms and conditions of the Creative Commons Attribution (CC BY) license (https://creativecommons.org/licenses/by/4.0/).
Share and Cite
Bastian, P.U.; Robel, N.; Schmidt, P.; Schrumpf, T.; Günter, C.; Roddatis, V.; Kumke, M.U. Resonance Energy Transfer to Track the Motion of Lanthanide Ions—What Drives the Intermixing in Core-Shell Upconverting Nanoparticles? Biosensors 2021, 11, 515. https://0-doi-org.brum.beds.ac.uk/10.3390/bios11120515
Bastian PU, Robel N, Schmidt P, Schrumpf T, Günter C, Roddatis V, Kumke MU. Resonance Energy Transfer to Track the Motion of Lanthanide Ions—What Drives the Intermixing in Core-Shell Upconverting Nanoparticles? Biosensors. 2021; 11(12):515. https://0-doi-org.brum.beds.ac.uk/10.3390/bios11120515
Chicago/Turabian StyleBastian, Philipp U., Nathalie Robel, Peter Schmidt, Tim Schrumpf, Christina Günter, Vladimir Roddatis, and Michael U. Kumke. 2021. "Resonance Energy Transfer to Track the Motion of Lanthanide Ions—What Drives the Intermixing in Core-Shell Upconverting Nanoparticles?" Biosensors 11, no. 12: 515. https://0-doi-org.brum.beds.ac.uk/10.3390/bios11120515