A Biosensor Platform for Point-of-Care SARS-CoV-2 Screening

 ,
,  ,
,  and
and 
Abstract
:
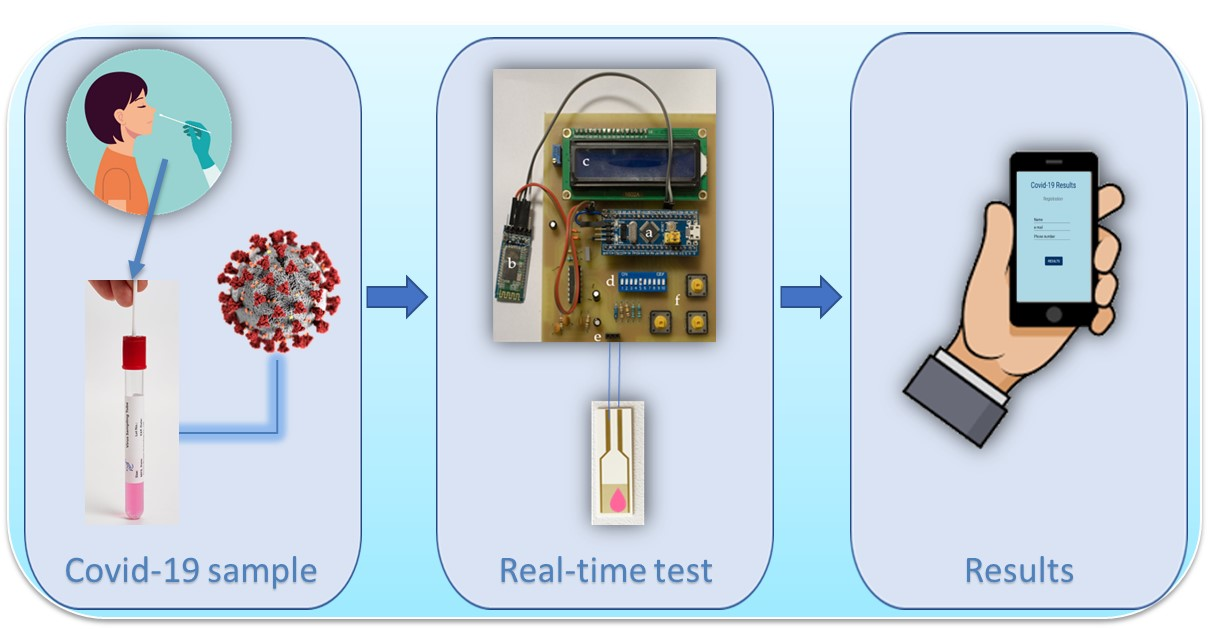
1. Introduction
2. Materials and Methods
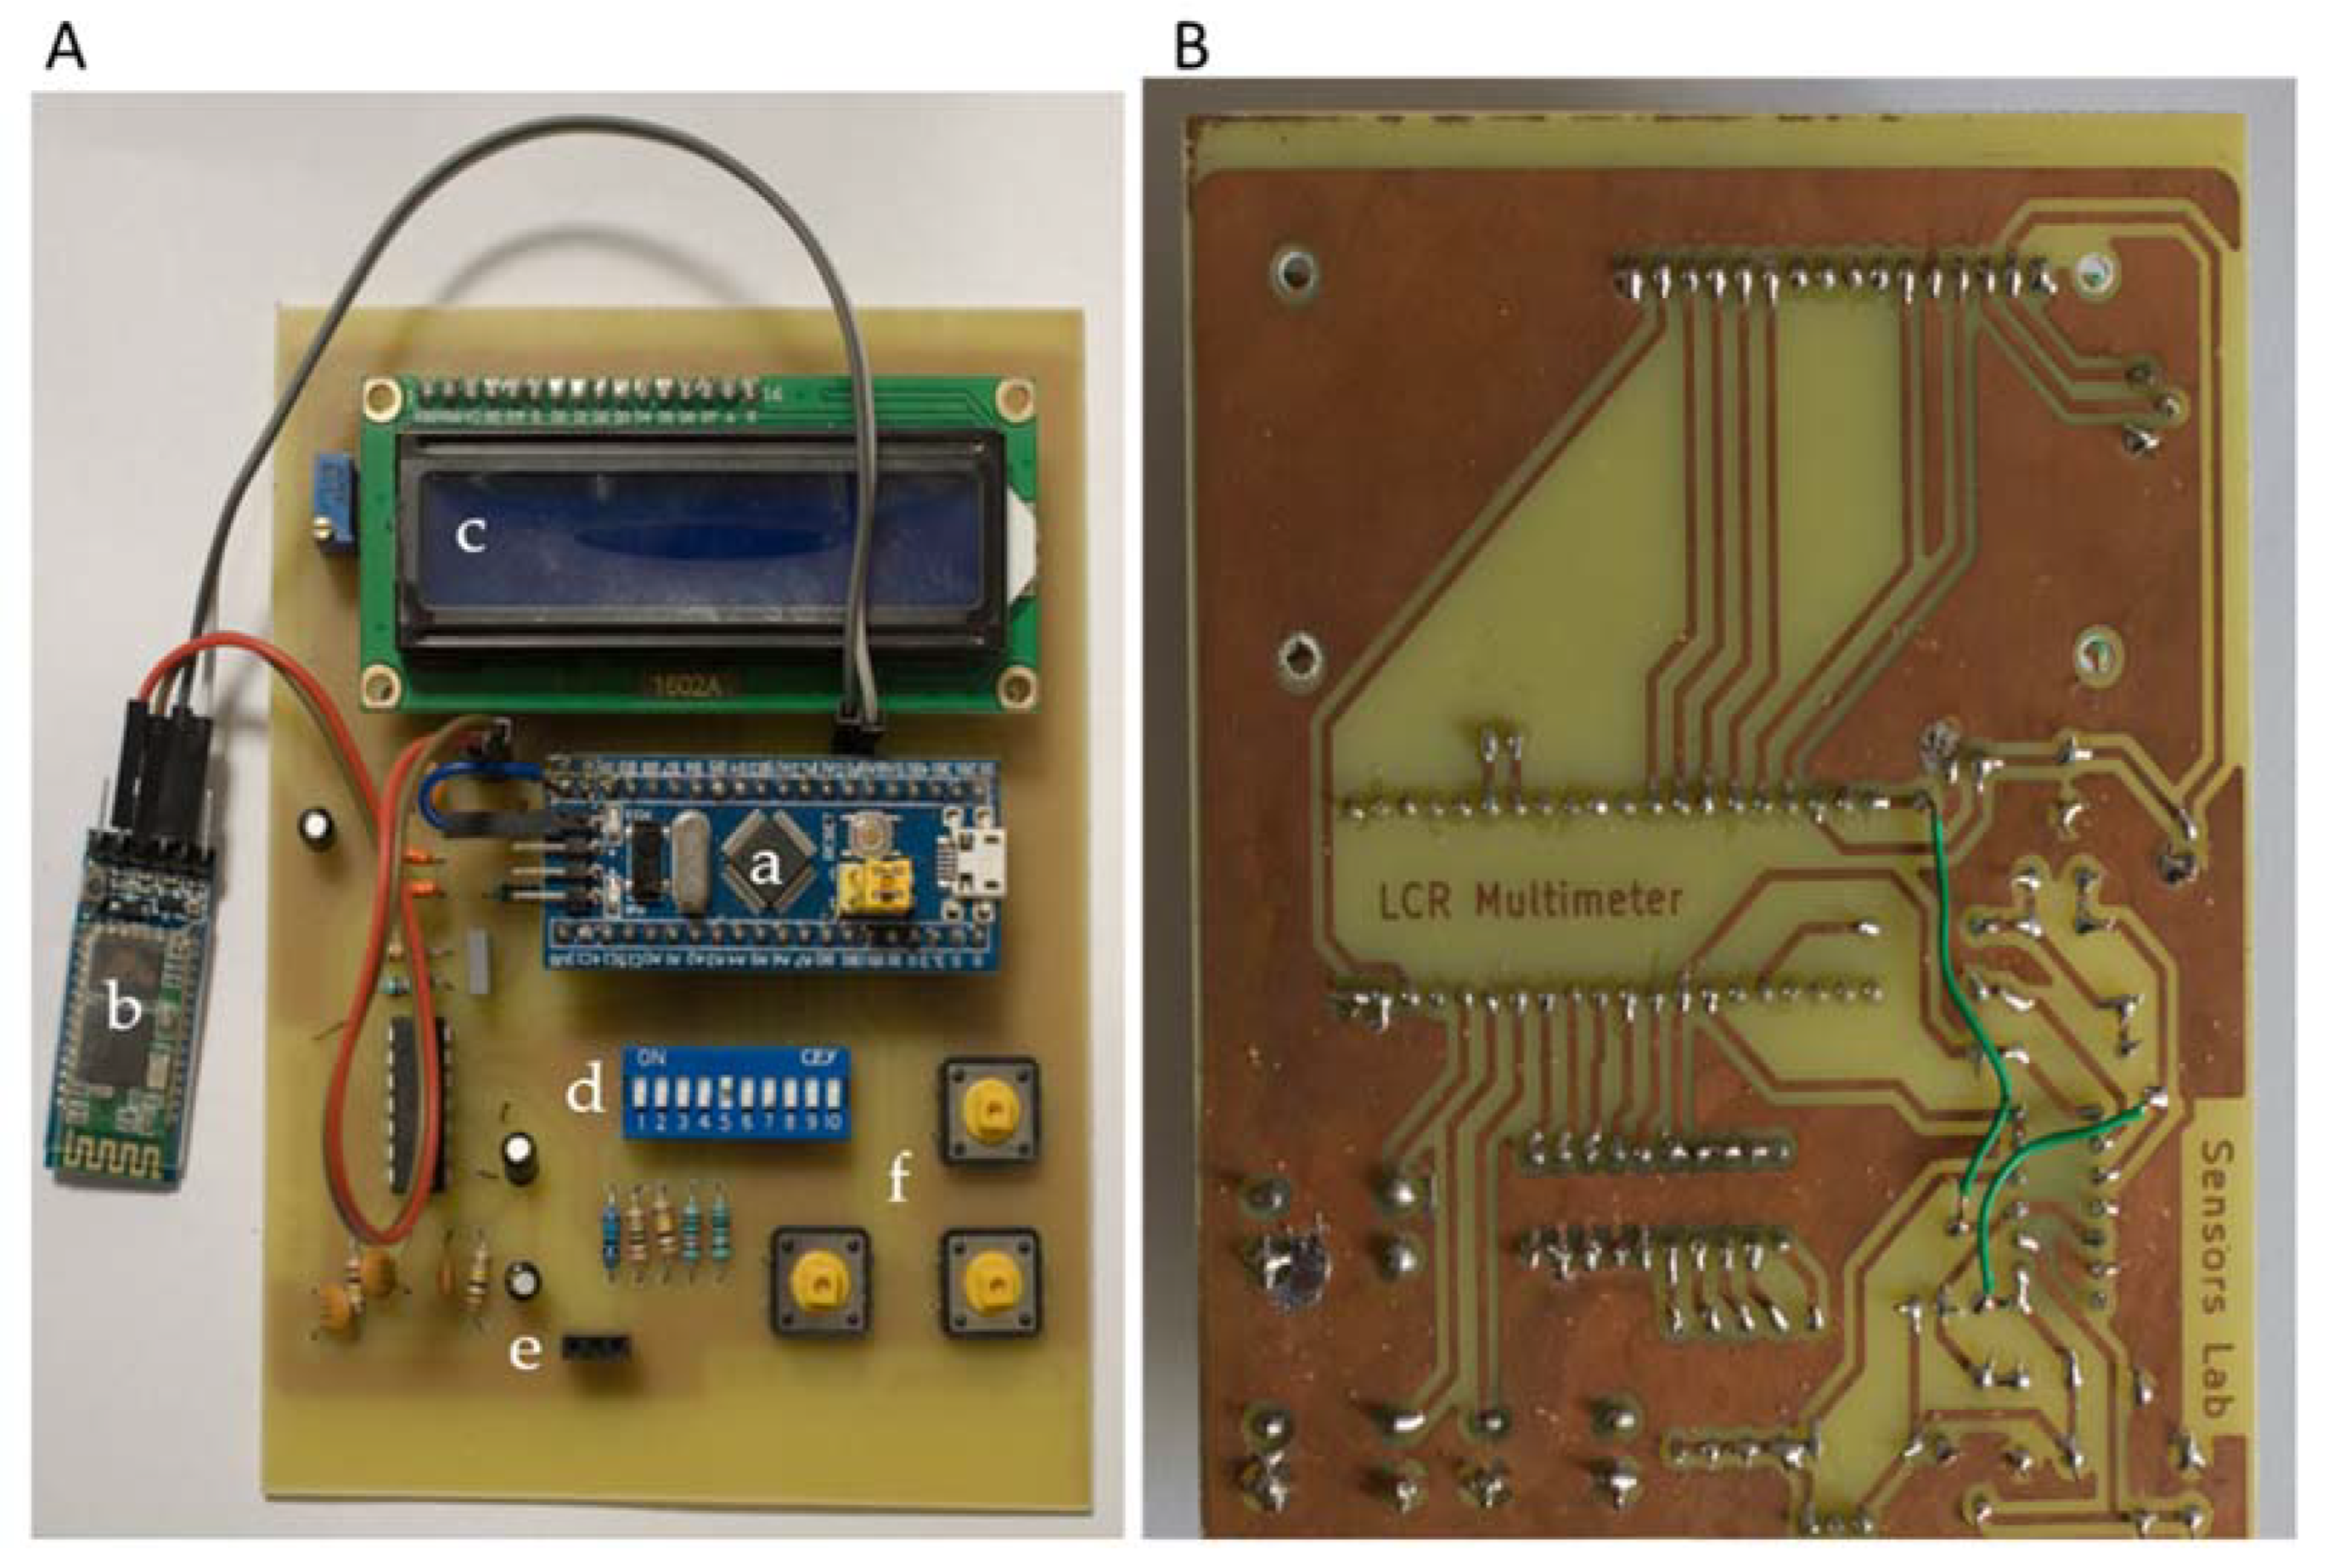
2.1. Biosensor Preparation
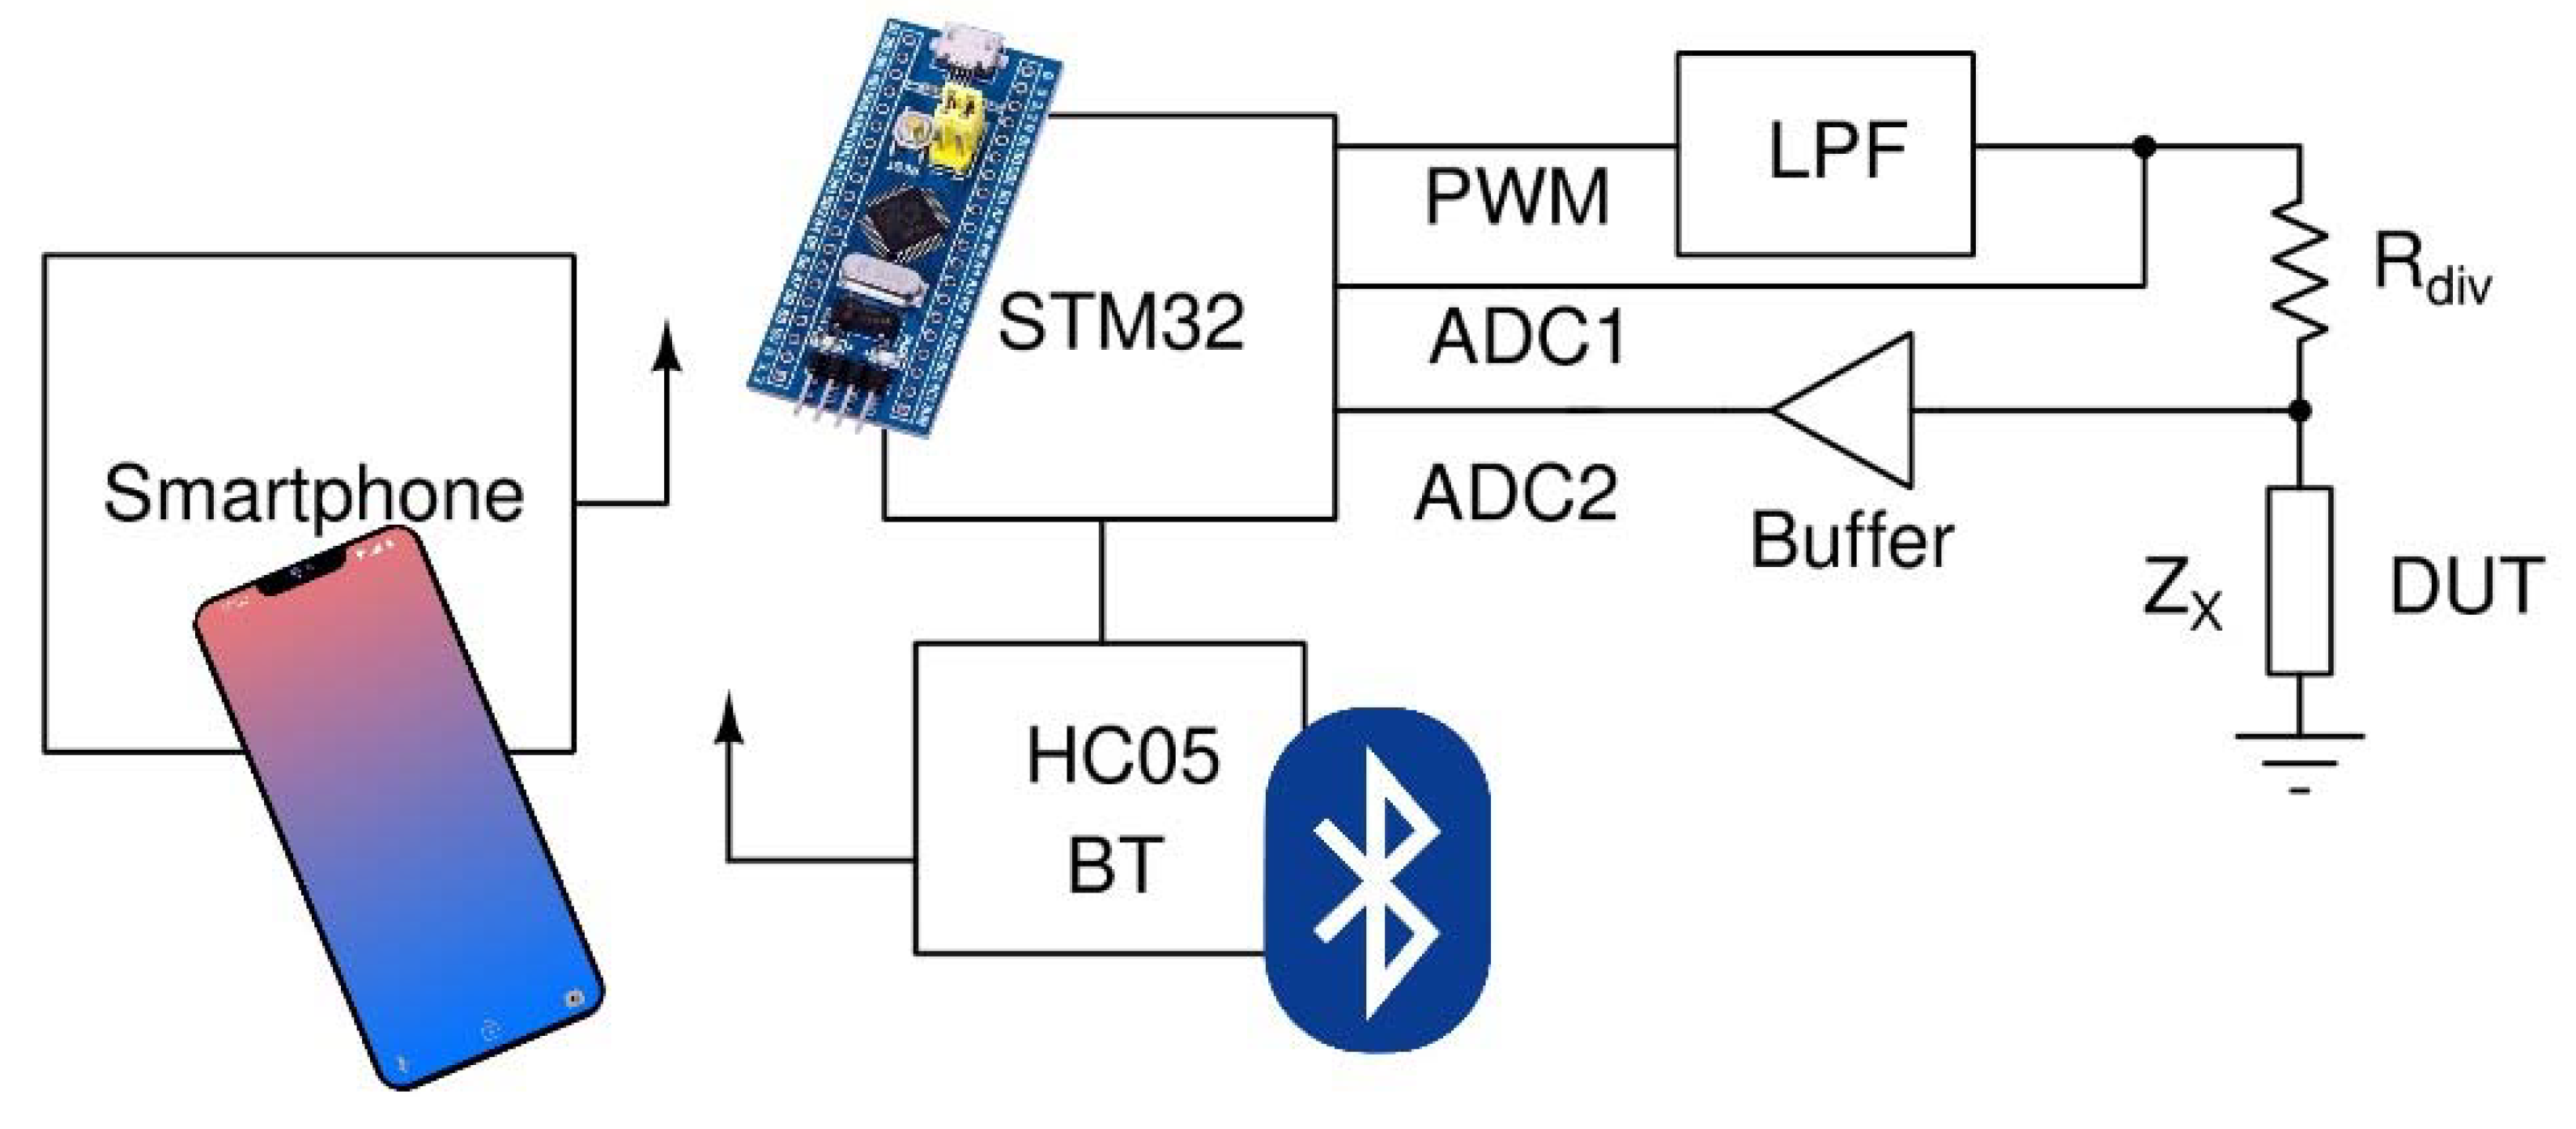
2.2. Readout Circuit
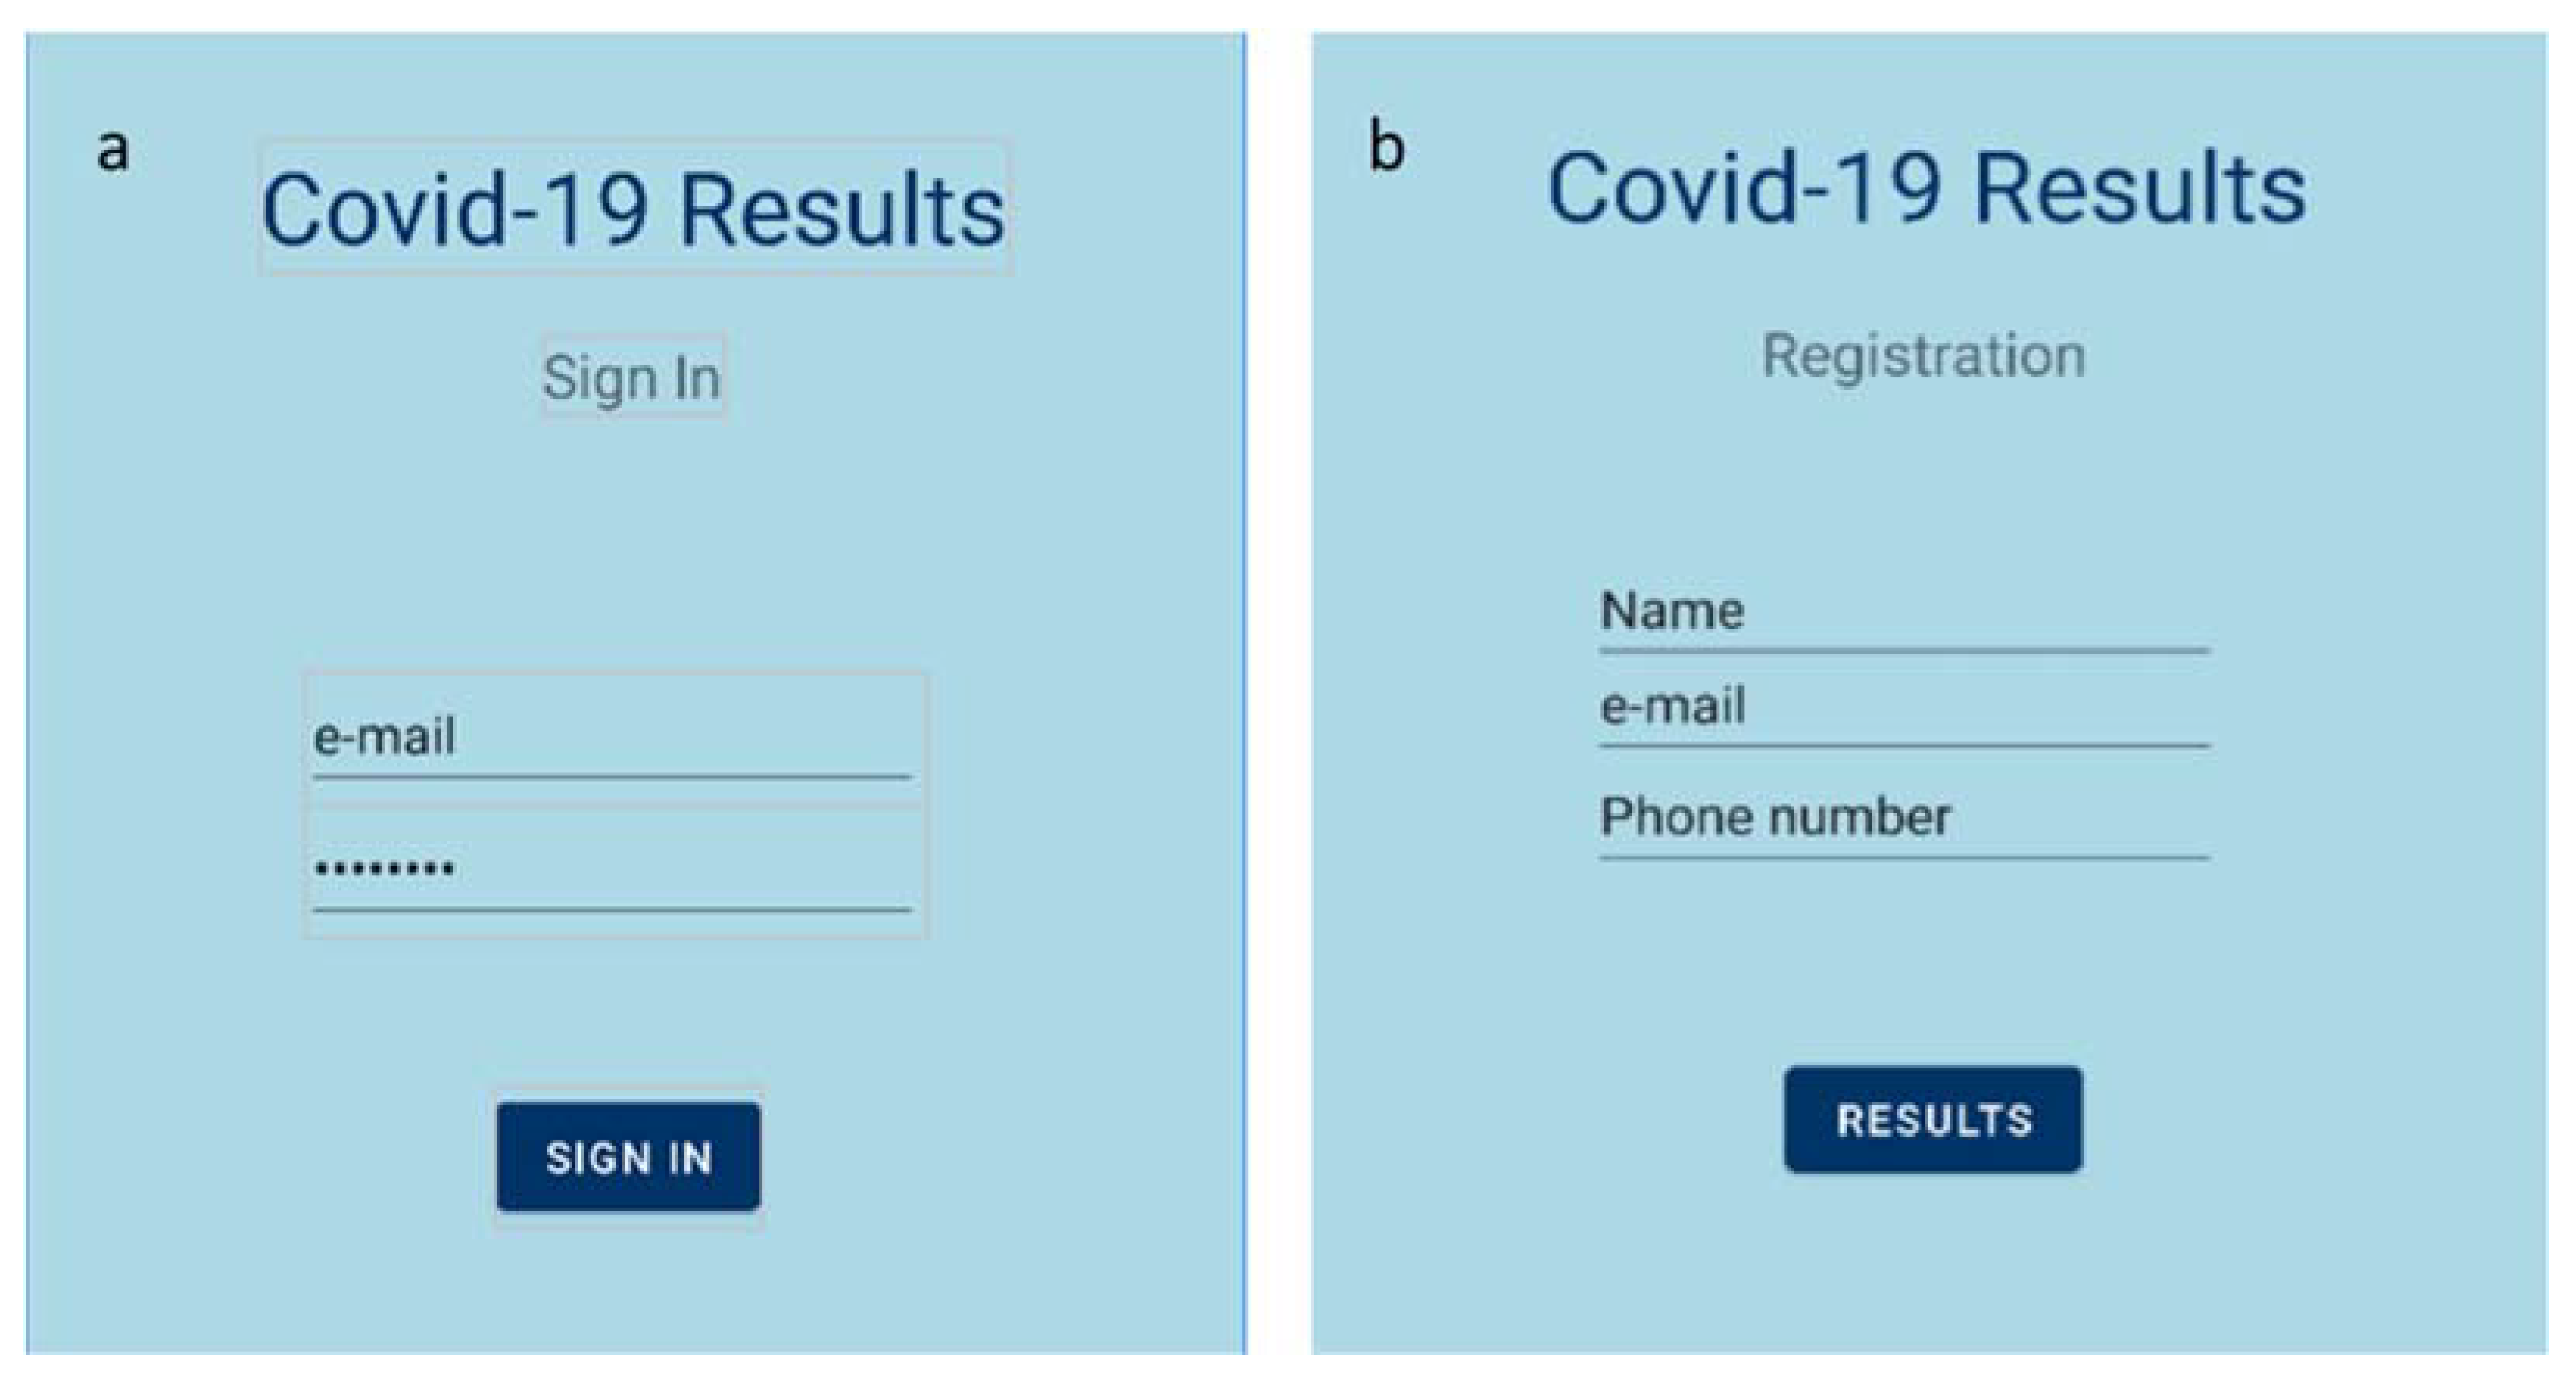
2.3. Mobile Application
2.4. Swab Sample Collection and Biomedical Ethics Issues
3. Results and Discussion
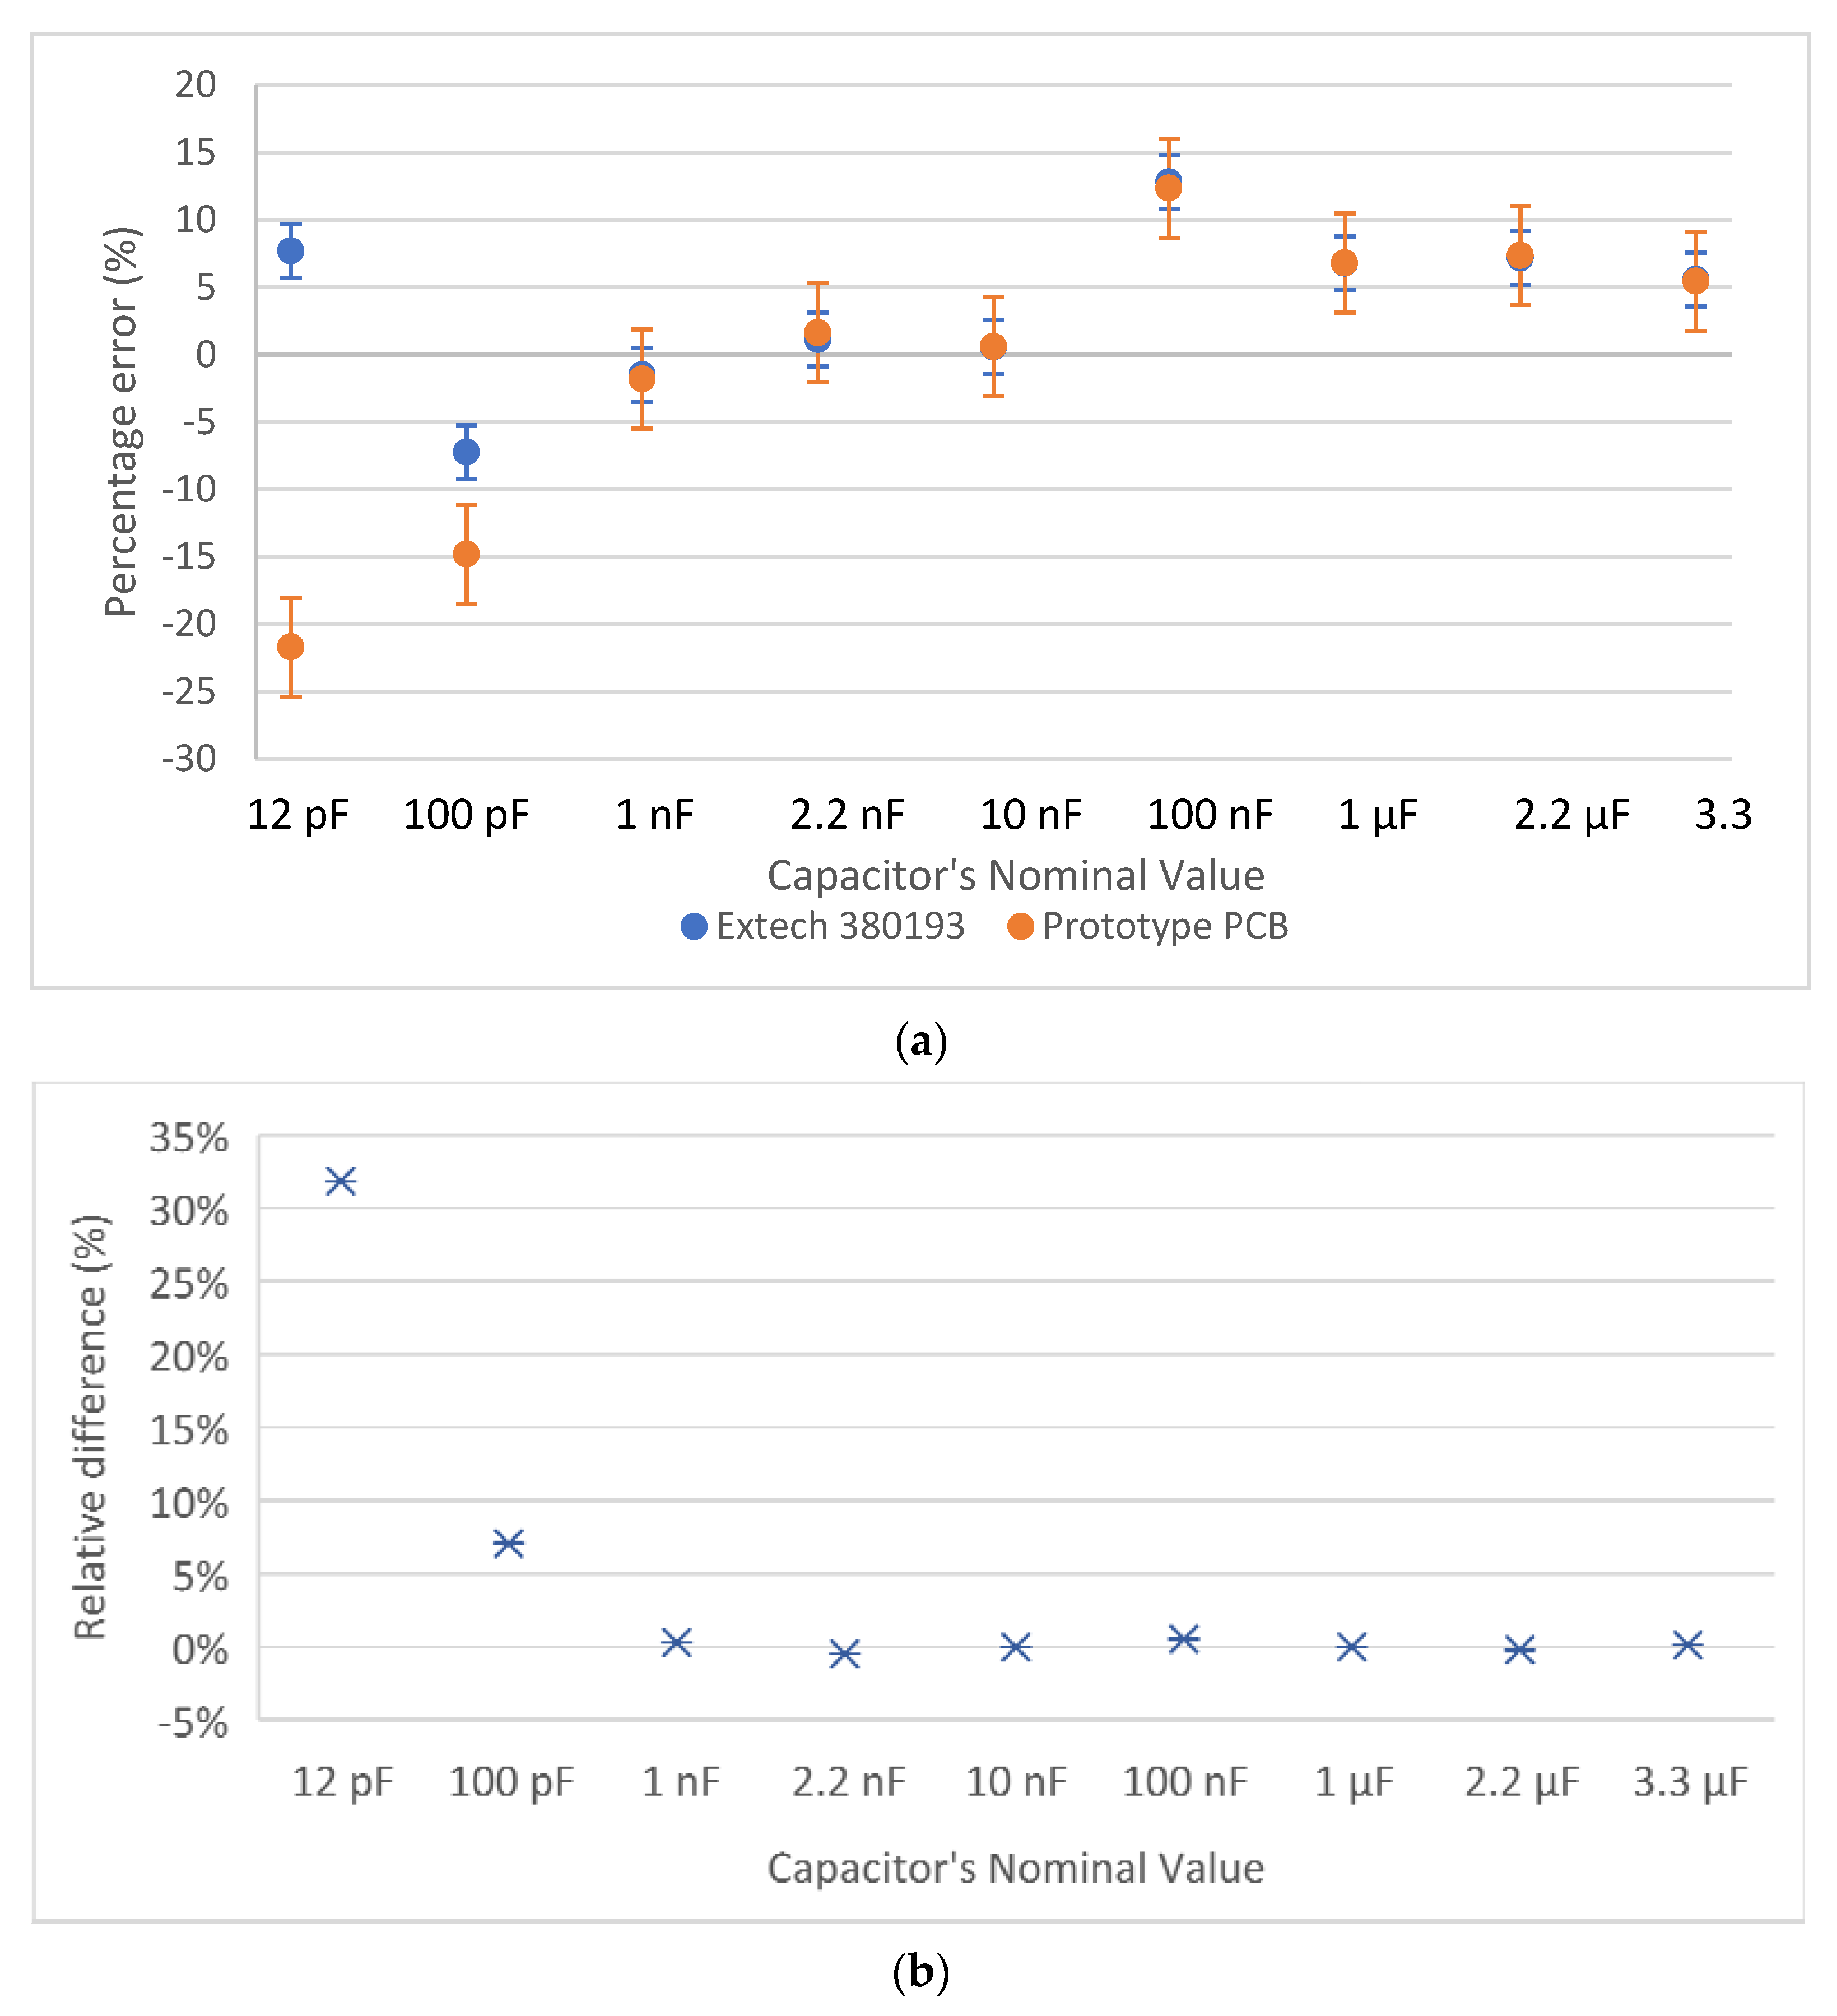
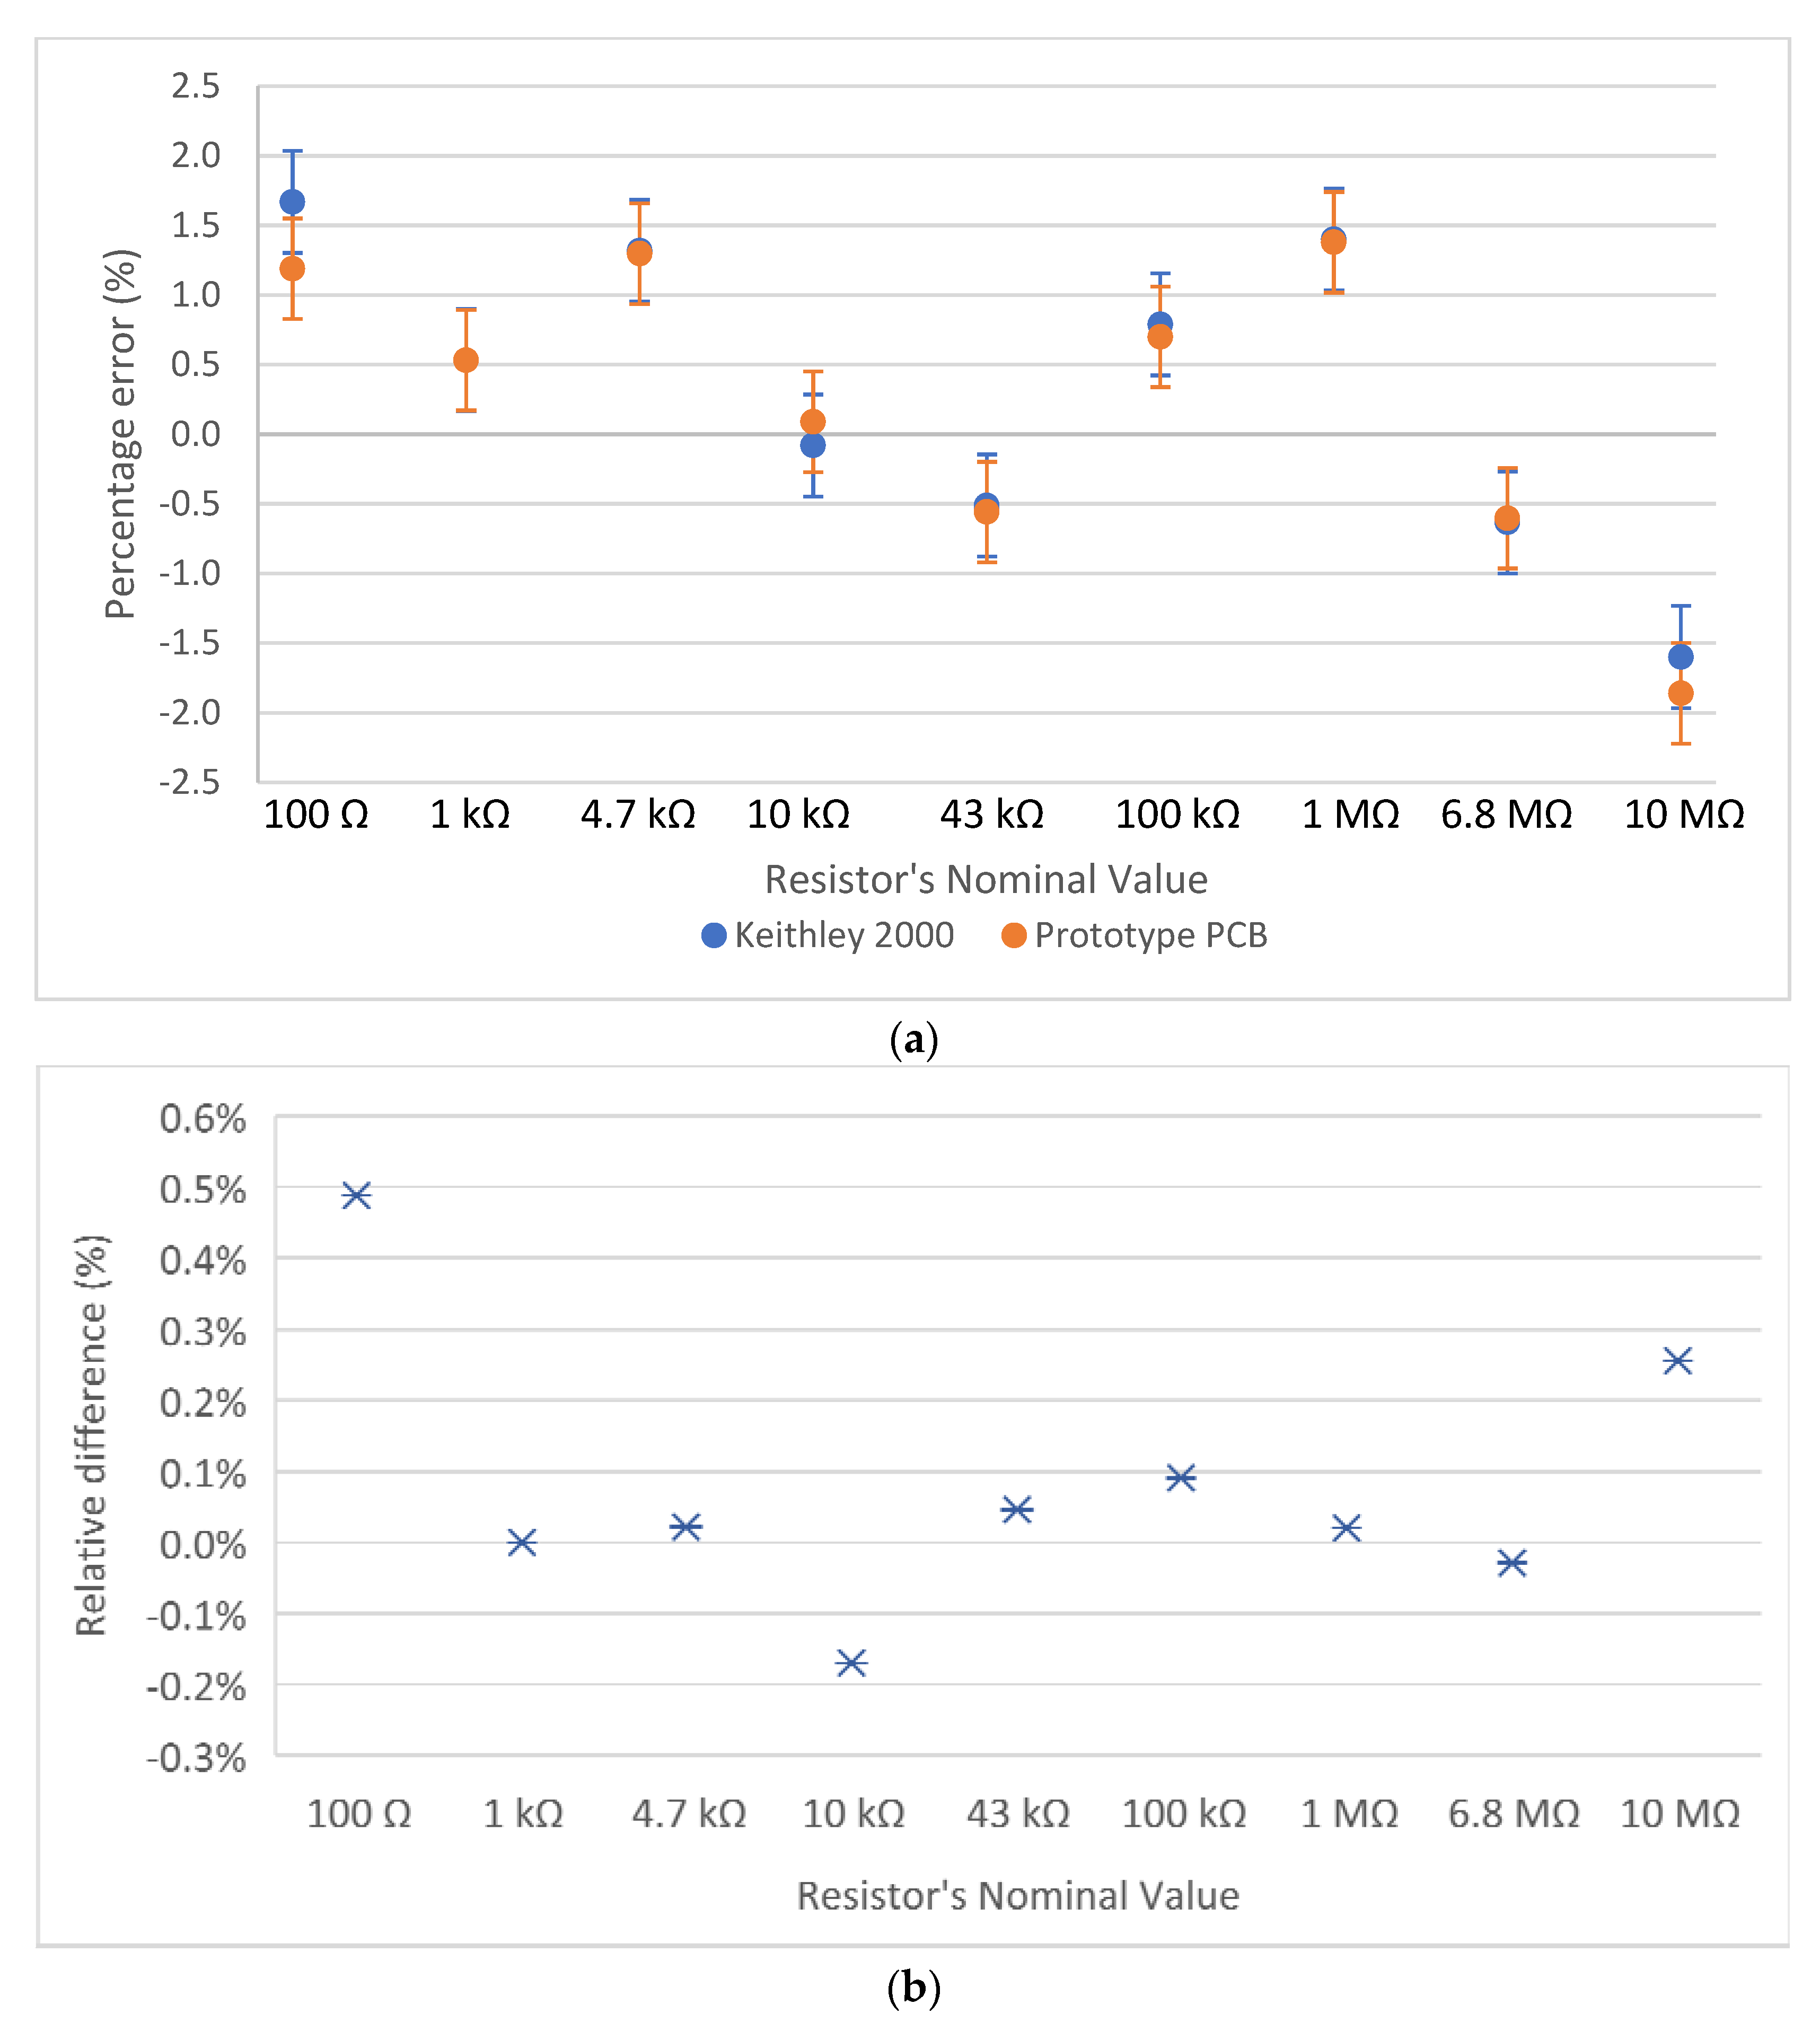
3.1. Readout Circuit Calibration
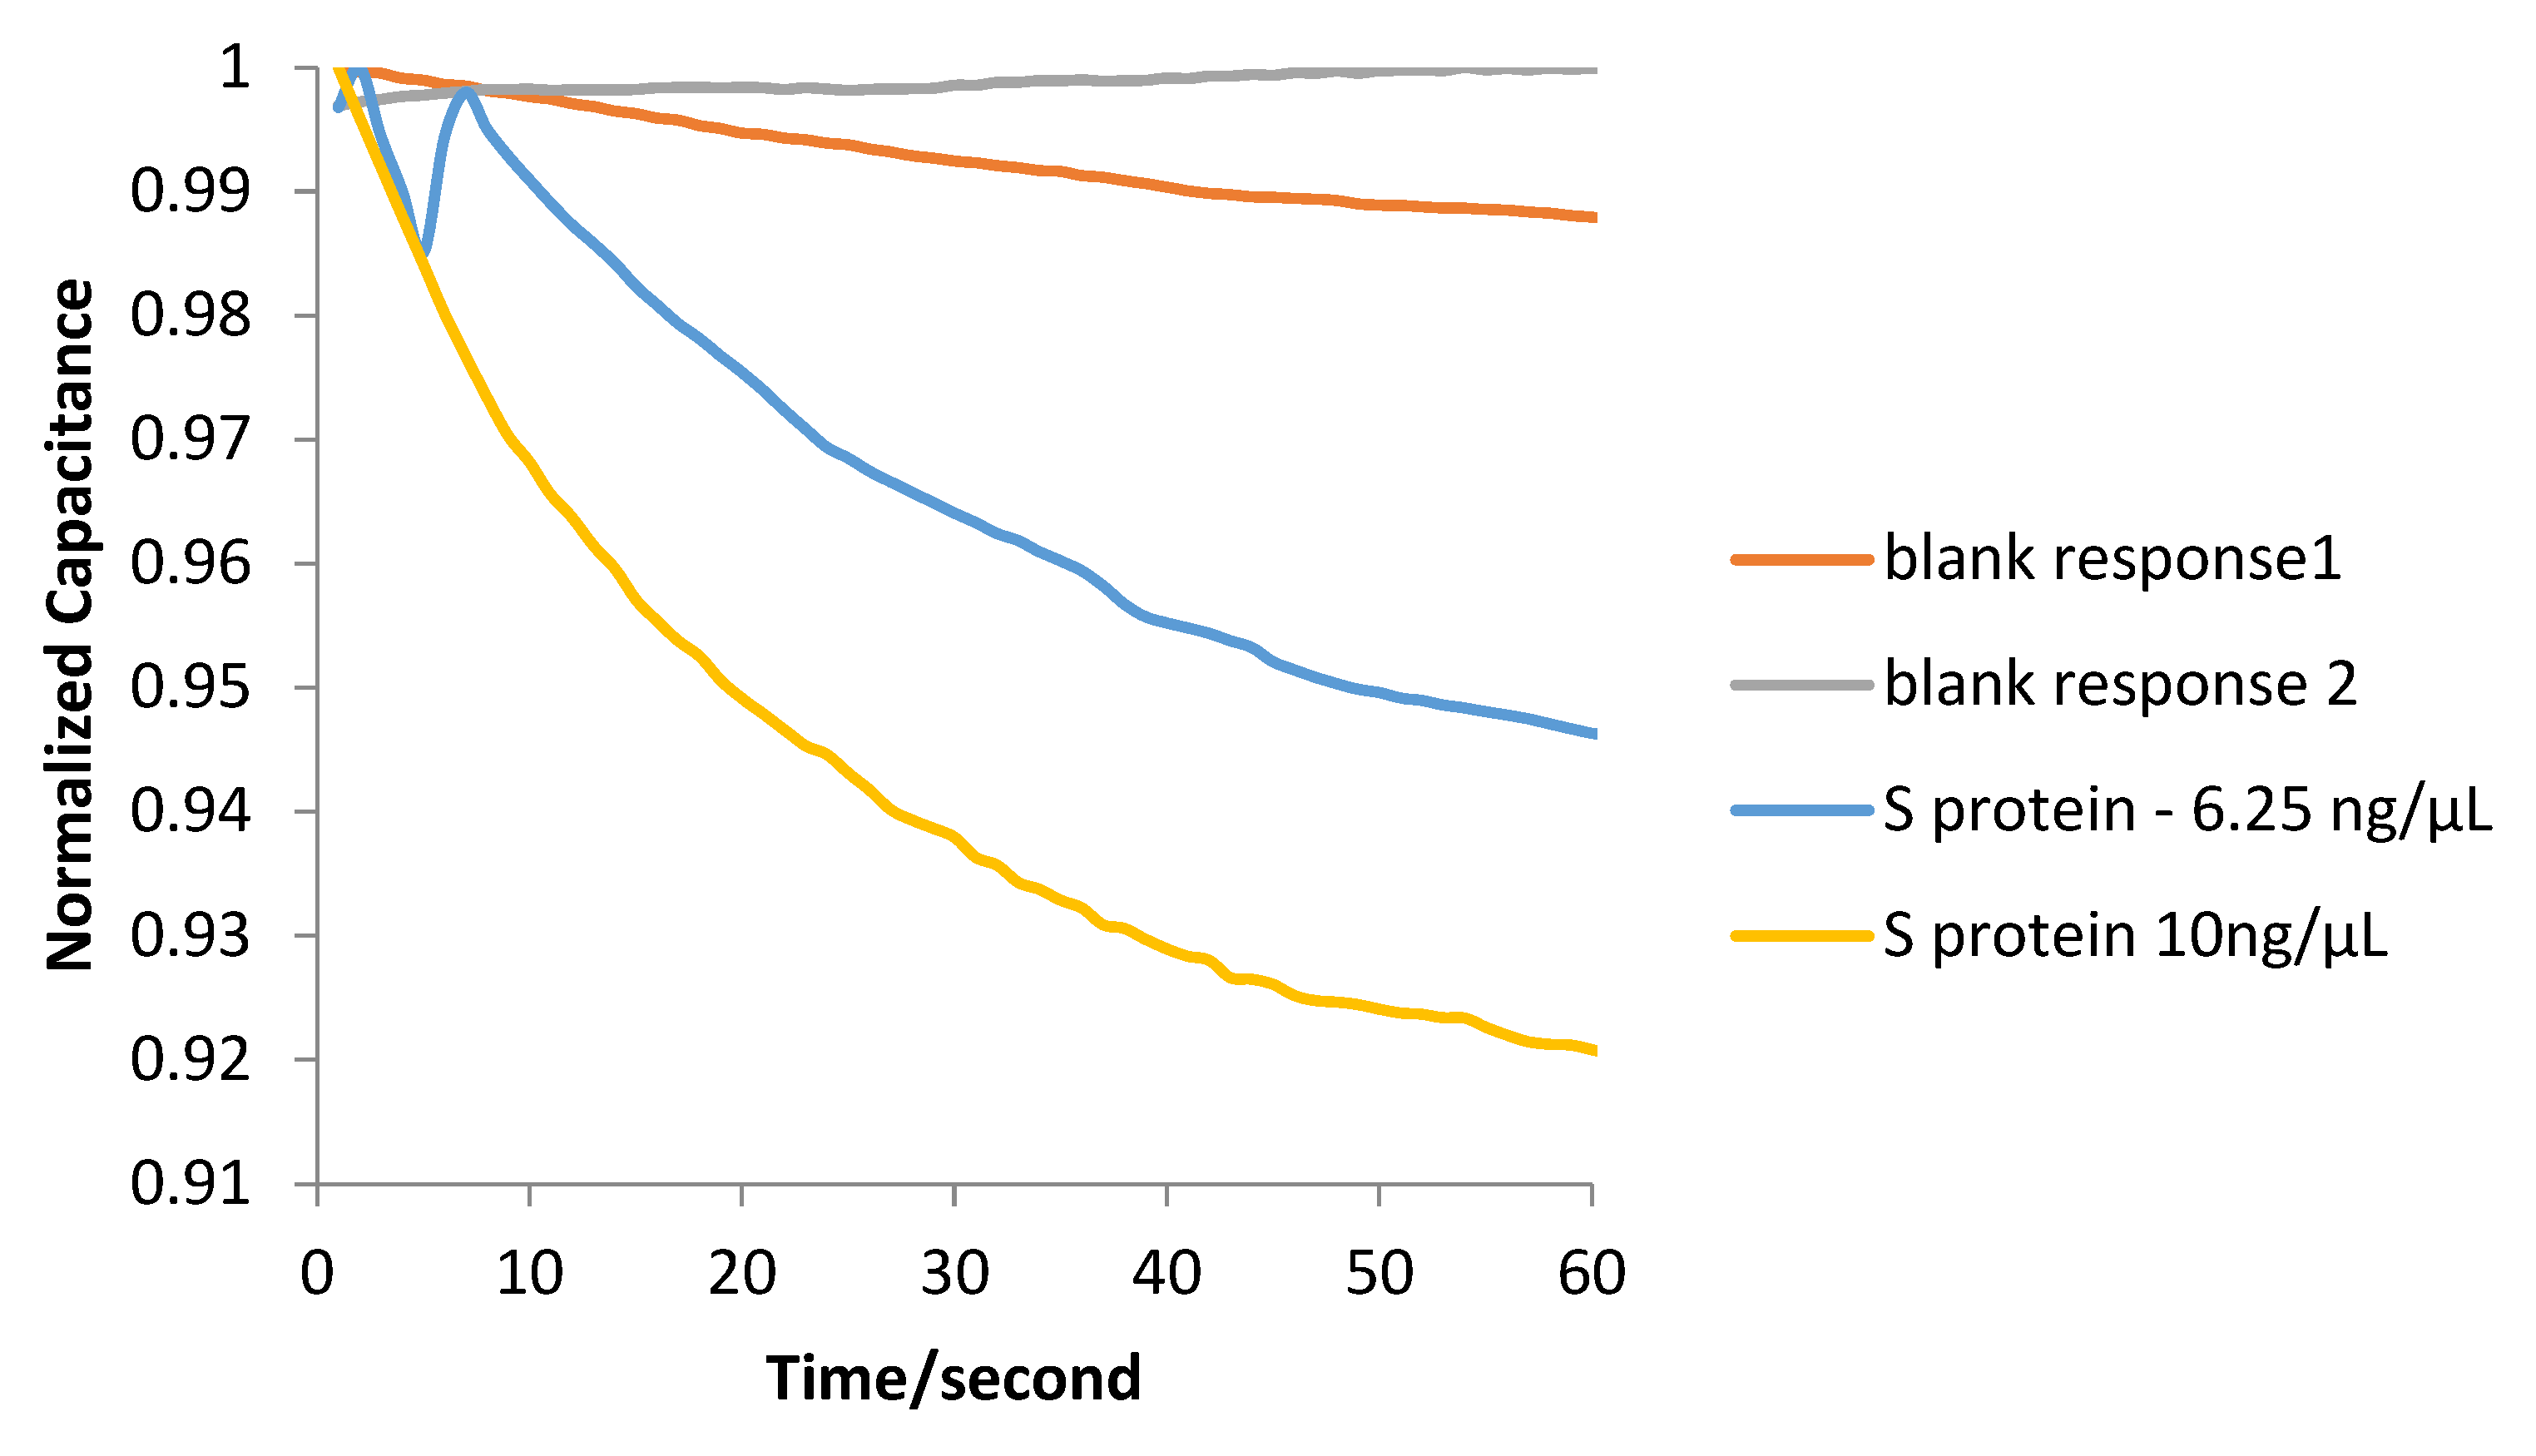
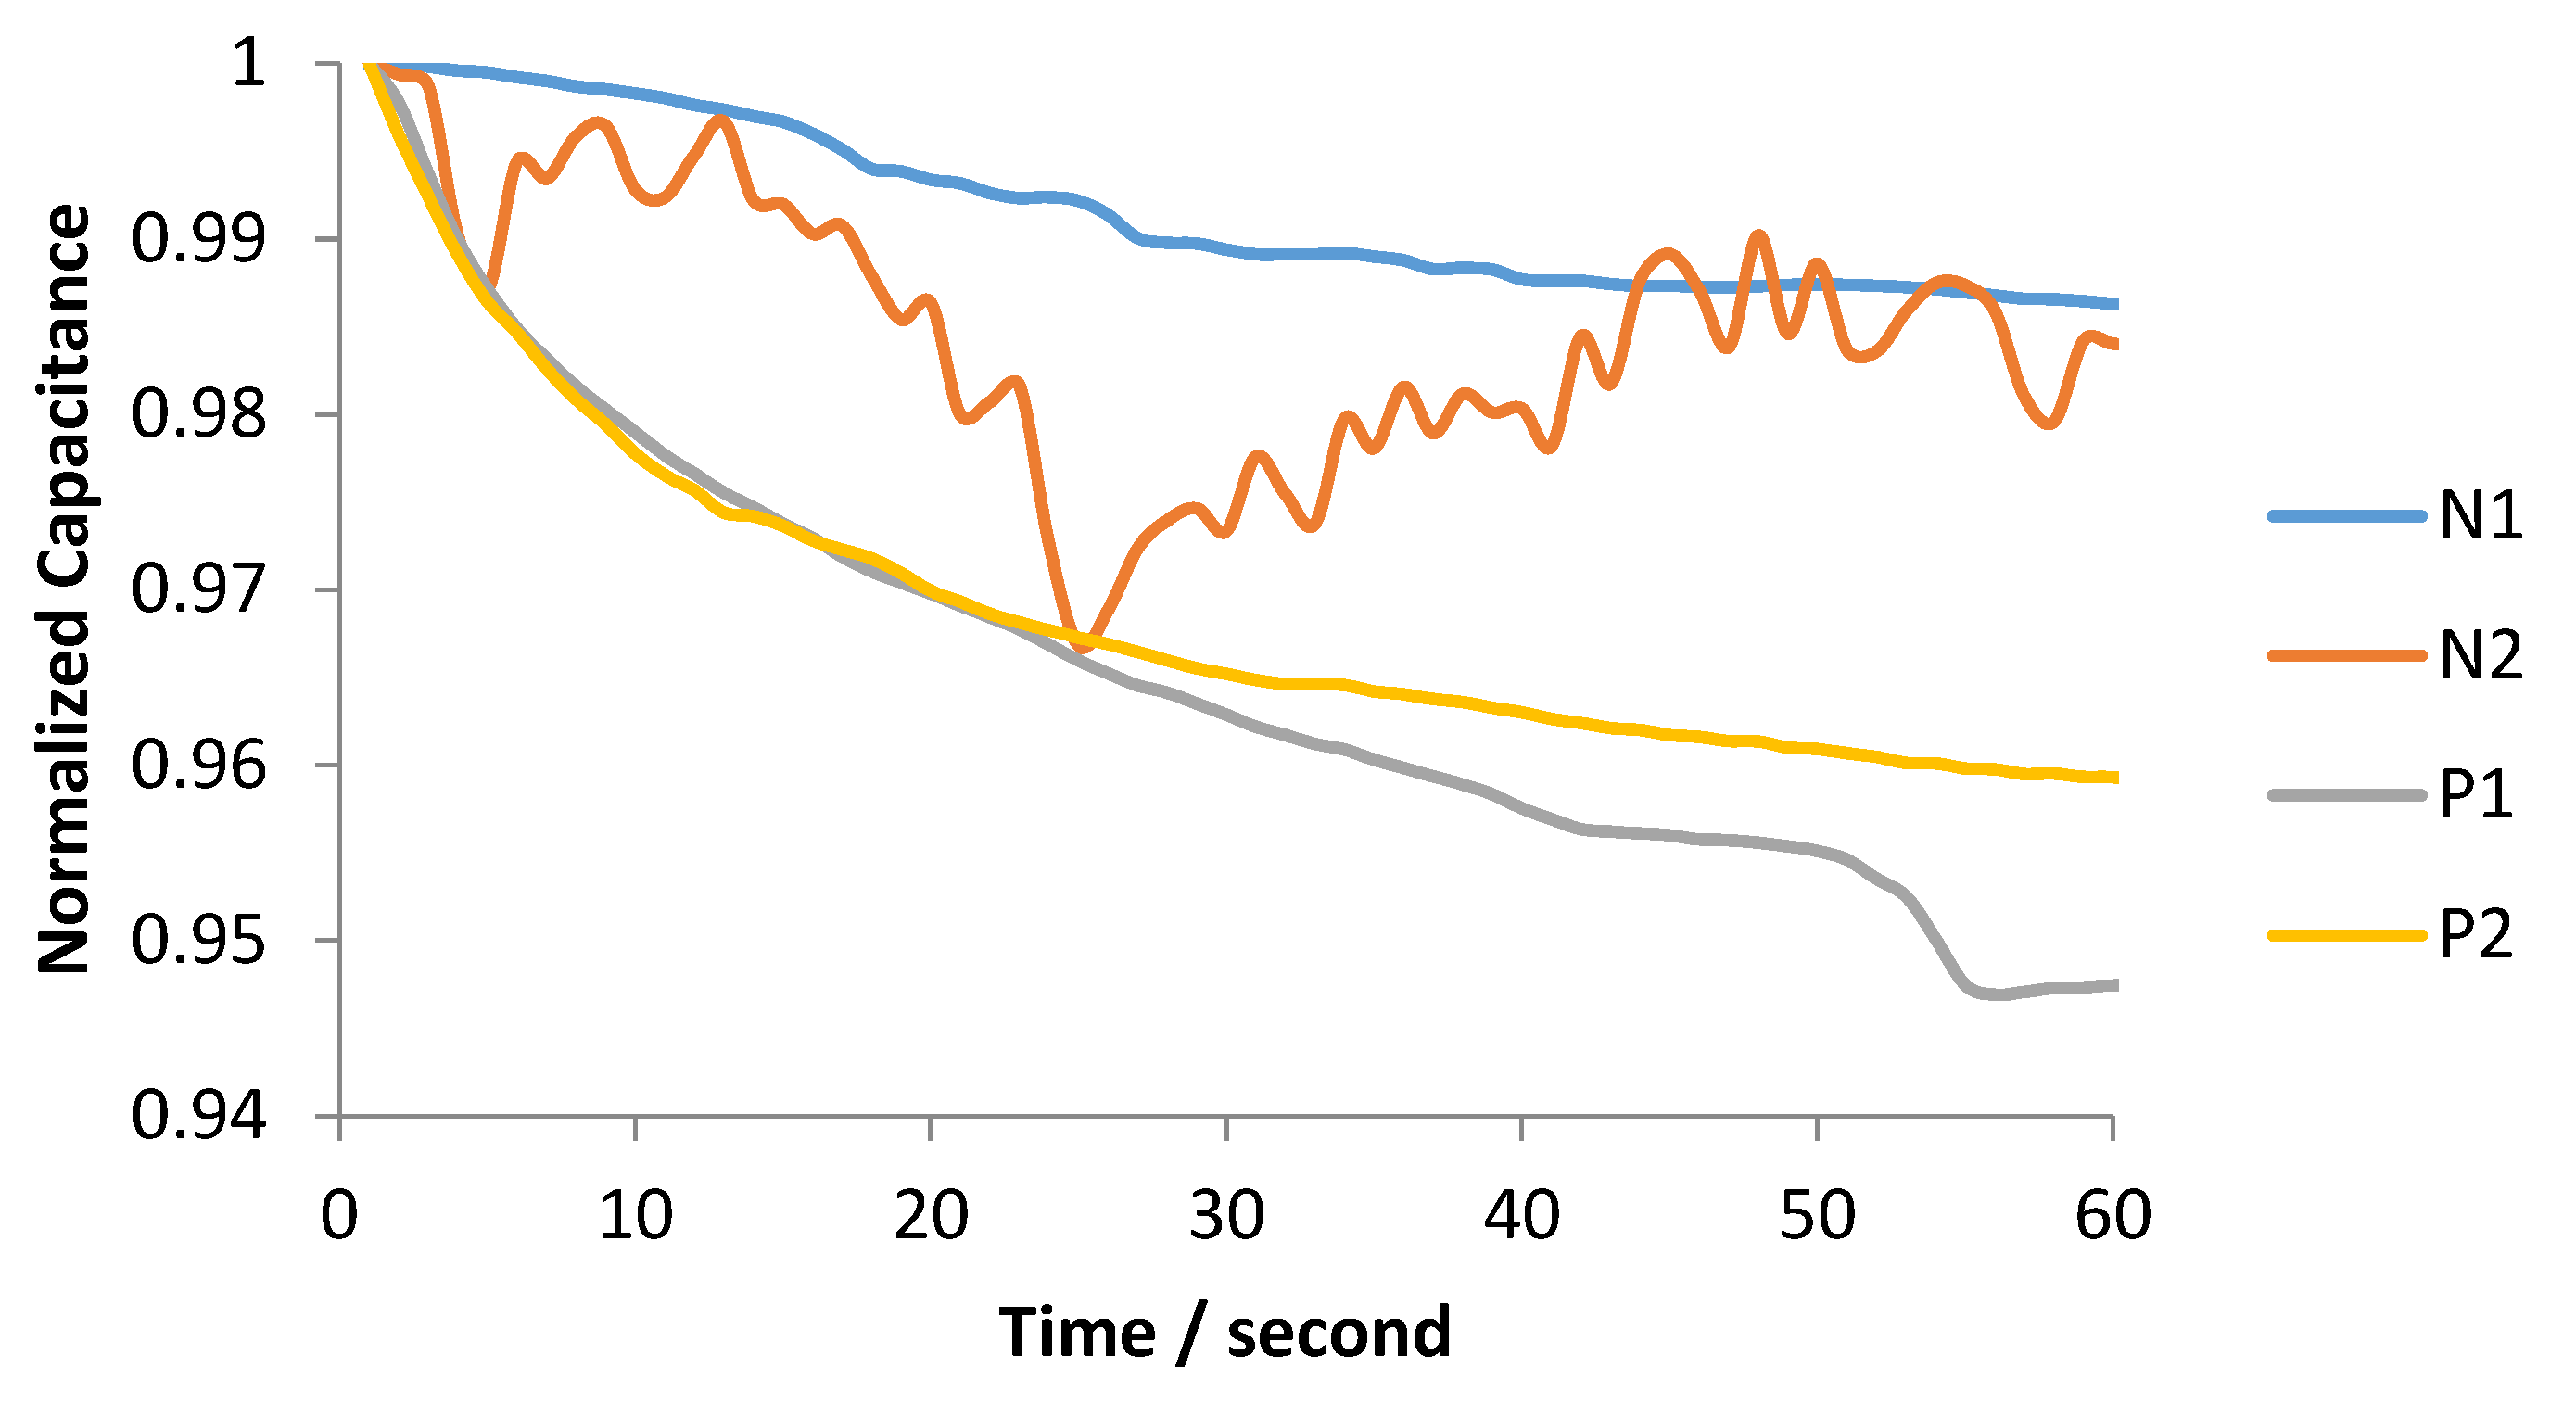
3.2. Device Operation with Biological Fluids
3.3. Measurement Procedure and Wireless Transmission to Mobile Application
4. Conclusions
Author Contributions
Funding
Informed Consent Statement
Acknowledgments
Conflicts of Interest
References
- Morales-Narváez, E.; Dincer, C. The impact of biosensing in a pandemic outbreak: COVID-19. Biosens. Bioelectron. 2020, 163, 112274. [Google Scholar] [CrossRef] [PubMed]
- Allan-Blitz, L.T.; Klausner, J.D. A Real-World Comparison of SARS-CoV-2 Rapid Antigen Testing versus PCR Testing in Florida. J. Clin. Microbiol. 2021, 59, e01107-21. [Google Scholar] [CrossRef] [PubMed]
- Kohmer, N.; Toptan, T.; Pallas, C.; Karaca, O.; Pfeiffer, A.; Westhaus, S.; Widera, M.; Berger, A.; Hoehl, S.; Kammel, M.; et al. Article the comparative clinical performance of four SARS-CoV-2 rapid antigen tests and their correlation to infectivity in vitro. J. Clin. Med. 2021, 10, 328. [Google Scholar] [CrossRef] [PubMed]
- Scohy, A.; Anantharajah, A.; Bodéus, M.; Kabamba-Mukadi, B.; Verroken, A.; Rodriguez-Villalobos, H. Low performance of rapid antigen detection test as frontline testing for COVID-19 diagnosis. J. Clin. Virol. 2020, 129, 104455. [Google Scholar] [CrossRef] [PubMed]
- Eshghifar, N.; Busheri, A.; Shrestha, R.; Beqaj, S. Evaluation of Analytical Performance of Seven Rapid Antigen Detection Kits for Detection of SARS-CoV-2 Virus. Int. J. Gen. Med. 2021, 14, 435–440. [Google Scholar] [CrossRef] [PubMed]
- Li, R.; Liu, J.; Zhang, H. The challenge of emerging SARS-CoV-2 mutants to vaccine development. J. Genet. Genom. 2021, 48, 102. [Google Scholar] [CrossRef] [PubMed]
- Imran, S.; Ahmadi, S.; Kerman, K. Electrochemical biosensors for the detection of SARS-CoV-2 and other viruses. Micromachines 2021, 12, 174. [Google Scholar] [CrossRef] [PubMed]
- Abid, S.A.; Ahmed Muneer, A.; Al-Kadmy, I.M.S.; Sattar, A.A.; Beshbishy, A.M.; Batiha, G.E.S.; Hetta, H.F. Biosensors as a future diagnostic approach for COVID-19. Life Sci. 2021, 273, 119117. [Google Scholar] [CrossRef] [PubMed]
- Mahmoudinobar, F.; Britton, D.; Montclare, J.K. Protein-based lateral flow assays for COVID-19 detection. Protein Eng. Des. Sel. 2021, 34, gzab010. [Google Scholar] [CrossRef] [PubMed]
- Tahamtan, A.; Ardebili, A. Real-time RT-PCR in COVID-19 detection: Issues affecting the results. Expert Rev. Mol. Diagn. 2020, 20, 453–454. [Google Scholar] [CrossRef] [Green Version]
- Rasmi, Y.; Li, X.; Khan, J.; Ozer, T.; Choi, J.R. Emerging point-of-care biosensors for rapid diagnosis of COVID-19: Current progress, challenges, and future prospects. Anal. Bioanal. Chem. 2021, 413, 4137–4159. [Google Scholar] [CrossRef] [PubMed]
- Shen, Y.; Anwar, T.B.; Mulchandani, A. Current status, advances, challenges and perspectives on biosensors for COVID-19 diagnosis in resource-limited settings. Sens. Actuators Rep. 2021, 3, 100025. [Google Scholar] [CrossRef] [PubMed]
- Iliescu, F.S.; Ionescu, A.M.; Gogianu, L.; Simion, M.; Dediu, V.; Chifiriuc, M.C.; Pircalabioru, G.G.; Iliescu, C. Point-of-care testing-the key in the battle against SARS-CoV-2 pandemic. Micromachines 2021, 12, 1464. [Google Scholar] [CrossRef] [PubMed]
- Mehrdad, S.; Wang, Y.; Atashzar, S.F. Perspective: Wearable Internet of Medical Things for Remote Tracking of Symptoms, Prediction of Health Anomalies, Implementation of Preventative Measures, and Control of Virus Spread During the Era of COVID-19. Front. Robot. AI 2021, 8, 610653. [Google Scholar] [CrossRef] [PubMed]
- Chandra, M.; Kumar, K.; Thakur, P.; Chattopadhyaya, S.; Alam, F.; Kumar, S. Digital technologies, healthcare and COVID-19: Insights from developing and emerging nations. Health Technol. 2022, 12, 547–568. [Google Scholar] [CrossRef] [PubMed]
- Malliga, S.; Kogilavani, S.V.; Nandhini, P.S. A Comprehensive Review of Applications of Internet of Things for COVID-19 Pandemic. IOP Conf. Ser. Mater. Sci. Eng. 2021, 1055, 012083. [Google Scholar] [CrossRef]
- Mavrikou, S.; Tsekouras, V.; Hatziagapiou, K.; Paradeisi, F.; Bakakos, P.; Michos, A.; Koutsoukou, A.; Konstantellou, E.; Lambrou, G.I.; Koniari, E.; et al. Clinical Application of the Novel Cell-Based Biosensor for the Ultra-Rapid Detection of the SARS-CoV-2 S1 Spike Protein Antigen: A Practical Approach. Biosensors 2021, 11, 224. [Google Scholar] [CrossRef] [PubMed]
- Fathi-Hafshejani, P.; Azam, N.; Wang, L.; Kuroda, M.A.; Hamilton, M.C.; Hasim, S.; Mahjouri-Samani, M. Two-Dimensional-Material-Based Field-Effect Transistor Biosensor for Detecting COVID-19 Virus (SARS-CoV-2). ACS Nano 2021, 15, 11461–11469. [Google Scholar] [CrossRef]
- Rashed, M.Z.; Kopechek, J.A.; Priddy, M.C.; Hamorsky, K.T.; Palmer, K.E.; Mittal, N.; Valdez, J.; Flynn, J.; Williams, S.J. Rapid detection of SARS-CoV-2 antibodies using electrochemical impedance-based detector. Biosens. Bioelectron. 2021, 171, 112709. [Google Scholar] [CrossRef] [PubMed]
- Seo, G.; Lee, G.; Kim, M.J.; Baek, S.H.; Choi, M.; Ku, K.B.; Lee, C.S.; Jun, S.; Park, D.; Kim, H.G.; et al. Rapid Detection of COVID-19 Causative Virus (SARS-CoV-2) in Human Nasopharyngeal Swab Specimens Using Field-Effect Transistor-Based Biosensor. ACS Nano 2020, 14, 5135–5142. [Google Scholar] [CrossRef] [PubMed] [Green Version]
- Garg, M.; Sharma, A.L.; Singh, S. Advancement in biosensors for inflammatory biomarkers of SARS-CoV-2 during 2019–2020. Biosens. Bioelectron. 2021, 171, 112703. [Google Scholar] [CrossRef] [PubMed]
- Sharma, P.K.; Kim, E.-S.; Mishra, S.; Ganbold, E.; Seong, R.-S.; Kaushik, A.K.; Kim, N.-Y. Ultrasensitive and Reusable Graphene Oxide-Modified Double-Interdigitated Capacitive (DIDC) Sensing Chip for Detecting SARS-CoV-2. ACS Sens. 2021, 6, 3468–3476. [Google Scholar] [CrossRef] [PubMed]
- McCarthy, M.W. At-home coronavirus testing: The next game-changer? Expert Rev. Mol. Diagn. 2021, 21, 1–2. [Google Scholar] [CrossRef] [PubMed]
- Toppings, N.B.; Mohon, A.N.; Lee, Y.; Kumar, H.; Lee, D.; Kapoor, R.; Singh, G.; Oberding, L.; Abdullah, O.; Kim, K.; et al. A rapid near-patient detection system for SARS-CoV-2 using saliva. Sci. Rep. 2021, 11, 13378. [Google Scholar] [CrossRef] [PubMed]
- Donato, L.J.; Trivedi, V.A.; Stransky, A.M.; Misra, A.; Pritt, B.S.; Binnicker, M.J.; Karon, B.S. Evaluation of the Cue Health point-of-care COVID-19 (SARS-CoV-2 nucleic acid amplification) test at a community drive through collection center. Diagn. Microbiol. Infect. Dis. 2021, 100, 115307. [Google Scholar] [CrossRef] [PubMed]
- Ravi, N.; Cortade, D.L.; Ng, E.; Wang, S.X. Diagnostics for SARS-CoV-2 detection: A comprehensive review of the FDA-EUA COVID-19 testing landscape. Biosens. Bioelectron. 2020, 165, 112454. [Google Scholar] [CrossRef] [PubMed]
- Singh, A.; Sharma, A.; Ahmed, A.; Sundramoorthy, A.K.; Furukawa, H.; Arya, S.; Khosla, A. Recent advances in electrochemical biosensors: Applications, challenges, and future scope. Biosensors 2021, 11, 336. [Google Scholar] [CrossRef]
- Georgas, A.; Lampas, E.; Houhoula, D.P.; Skoufias, A.; Patsilinakos, S.; Tsafaridis, I.; Patrinos, G.P.; Adamopoulos, N.; Ferraro, A.; Hristoforou, E. ACE2-based capacitance sensor for rapid native SARS-CoV-2 detection in biological fluids and its correlation with real-time PCR. Biosens. Bioelectron. 2022, 202, 114021. [Google Scholar] [CrossRef] [PubMed]
- Mazlan, N.S.; Ramli, M.M.; Abdullah, M.M.A.B.; Halin, D.S.C.; Isa, S.S.M.; Talip, L.F.A.; Danial, N.S.; Murad, S.A.Z. Interdigitated electrodes as impedance and capacitance biosensors: A review. AIP Conf. Proc. 2017, 1885, 020276. [Google Scholar] [CrossRef]
- Lan, J.; Ge, J.; Yu, J.; Shan, S.; Zhou, H.; Fan, S.; Zhang, Q.; Shi, X.; Wang, Q.; Zhang, L.; et al. Structure of the SARS-CoV-2 spike receptor-binding domain bound to the ACE2 receptor. Nature 2020, 581, 215–220. [Google Scholar] [CrossRef] [PubMed] [Green Version]
- Shang, J.; Ye, G.; Shi, K.; Wan, Y.; Luo, C.; Aihara, H.; Geng, Q.; Auerbach, A.; Li, F. Structural basis of receptor recognition by SARS-CoV-2. Nature 2020, 581, 221–224. [Google Scholar] [CrossRef] [PubMed] [Green Version]
- Vásquez, V.; Navas, M.-C.; Jaimes, J.A.; Orozco, J. SARS-CoV-2 electrochemical immunosensor based on the spike-ACE2 complex. Anal. Chim. Acta 2022, 1205, 339718. [Google Scholar] [CrossRef] [PubMed]
- Suh, J.-S.; Kim, H.-S.; Kim, T.-J. Development of a SARS-CoV-2-derived receptor-binding domain-based ACE2 biosensor. Sens. Actuators B Chem. 2021, 334, 129663. [Google Scholar] [CrossRef] [PubMed]
- Lee, J.-H.; Lee, Y.; Lee, S.K.; Kim, J.; Lee, C.-S.; Kim, N.H.; Kim, H.G. Versatile role of ACE2-based biosensors for detection of SARS-CoV-2 variants and neutralizing antibodies. Biosens. Bioelectron. 2022, 203, 114034. [Google Scholar] [CrossRef] [PubMed]
- Georgas, A.; Agiannis, K.; Papakosta, V.; Angelopoulos, S.; Ferraro, A.; Hristoforu, E. A portable screening device for SARS-CoV-2 with smartphone readout. Eng. Proc. 2022, 16, 7. [Google Scholar] [CrossRef]
- Karki, J. Active Low-Pass Filter Design; Texas Instruments: Dallas, TX, USA, 2000. [Google Scholar]
- Cheon, Y. Multiplatform application development for android and java. In Proceedings of the 2019 IEEE 17th International Conference on Software Engineering Research, Management and Applications (SERA), Honolulu, HI, USA, 29–31 May 2019; pp. 1–5. [Google Scholar] [CrossRef] [Green Version]
- Ng, C.L.; Reaz, M.B.I.; Chowdhury, M.E.H. A Low Noise Capacitive Electromyography Monitoring System for Remote Healthcare Applications. IEEE Sens. J. 2020, 20, 3333–3342. [Google Scholar] [CrossRef]
- Ng, C.L.; Reaz, M.B.I. Characterization of textile-insulated capacitive biosensors. Sensors 2017, 17, 574. [Google Scholar] [CrossRef] [Green Version]
- Lee, K.H.; Choi, S.; Lee, J.O.; Yoon, J.B.; Cho, G.H. CMOS capacitive biosensor with enhanced sensitivity for label-free DNA detection. In Proceedings of the 2012 IEEE International Solid-State Circuits Conference, San Francisco, CA, USA, 19–24 February 2012; Volume 55, pp. 120–121. [Google Scholar] [CrossRef]
- Mattiasson, B.; Hedström, M. Capacitive biosensors for ultra-sensitive assays. TrAC—Trends Anal. Chem. 2016, 79, 233–238. [Google Scholar] [CrossRef]
- Grimes, D.A.; Schulz, K.F. Uses and abuses of screening tests. Lancet 2002, 359, 881–884. [Google Scholar] [CrossRef]


Publisher’s Note: MDPI stays neutral with regard to jurisdictional claims in published maps and institutional affiliations. |
© 2022 by the authors. Licensee MDPI, Basel, Switzerland. This article is an open access article distributed under the terms and conditions of the Creative Commons Attribution (CC BY) license (https://creativecommons.org/licenses/by/4.0/).
Share and Cite
Georgas, A.; Agiannis, K.; Papakosta, V.; Priftis, P.; Angelopoulos, S.; Ferraro, A.; Hristoforou, E. A Biosensor Platform for Point-of-Care SARS-CoV-2 Screening. Biosensors 2022, 12, 487. https://0-doi-org.brum.beds.ac.uk/10.3390/bios12070487
Georgas A, Agiannis K, Papakosta V, Priftis P, Angelopoulos S, Ferraro A, Hristoforou E. A Biosensor Platform for Point-of-Care SARS-CoV-2 Screening. Biosensors. 2022; 12(7):487. https://0-doi-org.brum.beds.ac.uk/10.3390/bios12070487
Chicago/Turabian StyleGeorgas, Antonios, Konstantinos Agiannis, Vasiliki Papakosta, Panagiotis Priftis, Spyridon Angelopoulos, Angelo Ferraro, and Evangelos Hristoforou. 2022. "A Biosensor Platform for Point-of-Care SARS-CoV-2 Screening" Biosensors 12, no. 7: 487. https://0-doi-org.brum.beds.ac.uk/10.3390/bios12070487