Painful Cutaneous Electrical Stimulation vs. Heat Pain as Test Stimuli in Conditioned Pain Modulation †

 , ,
, ,
Abstract
:1. Introduction
2. Materials and Methods
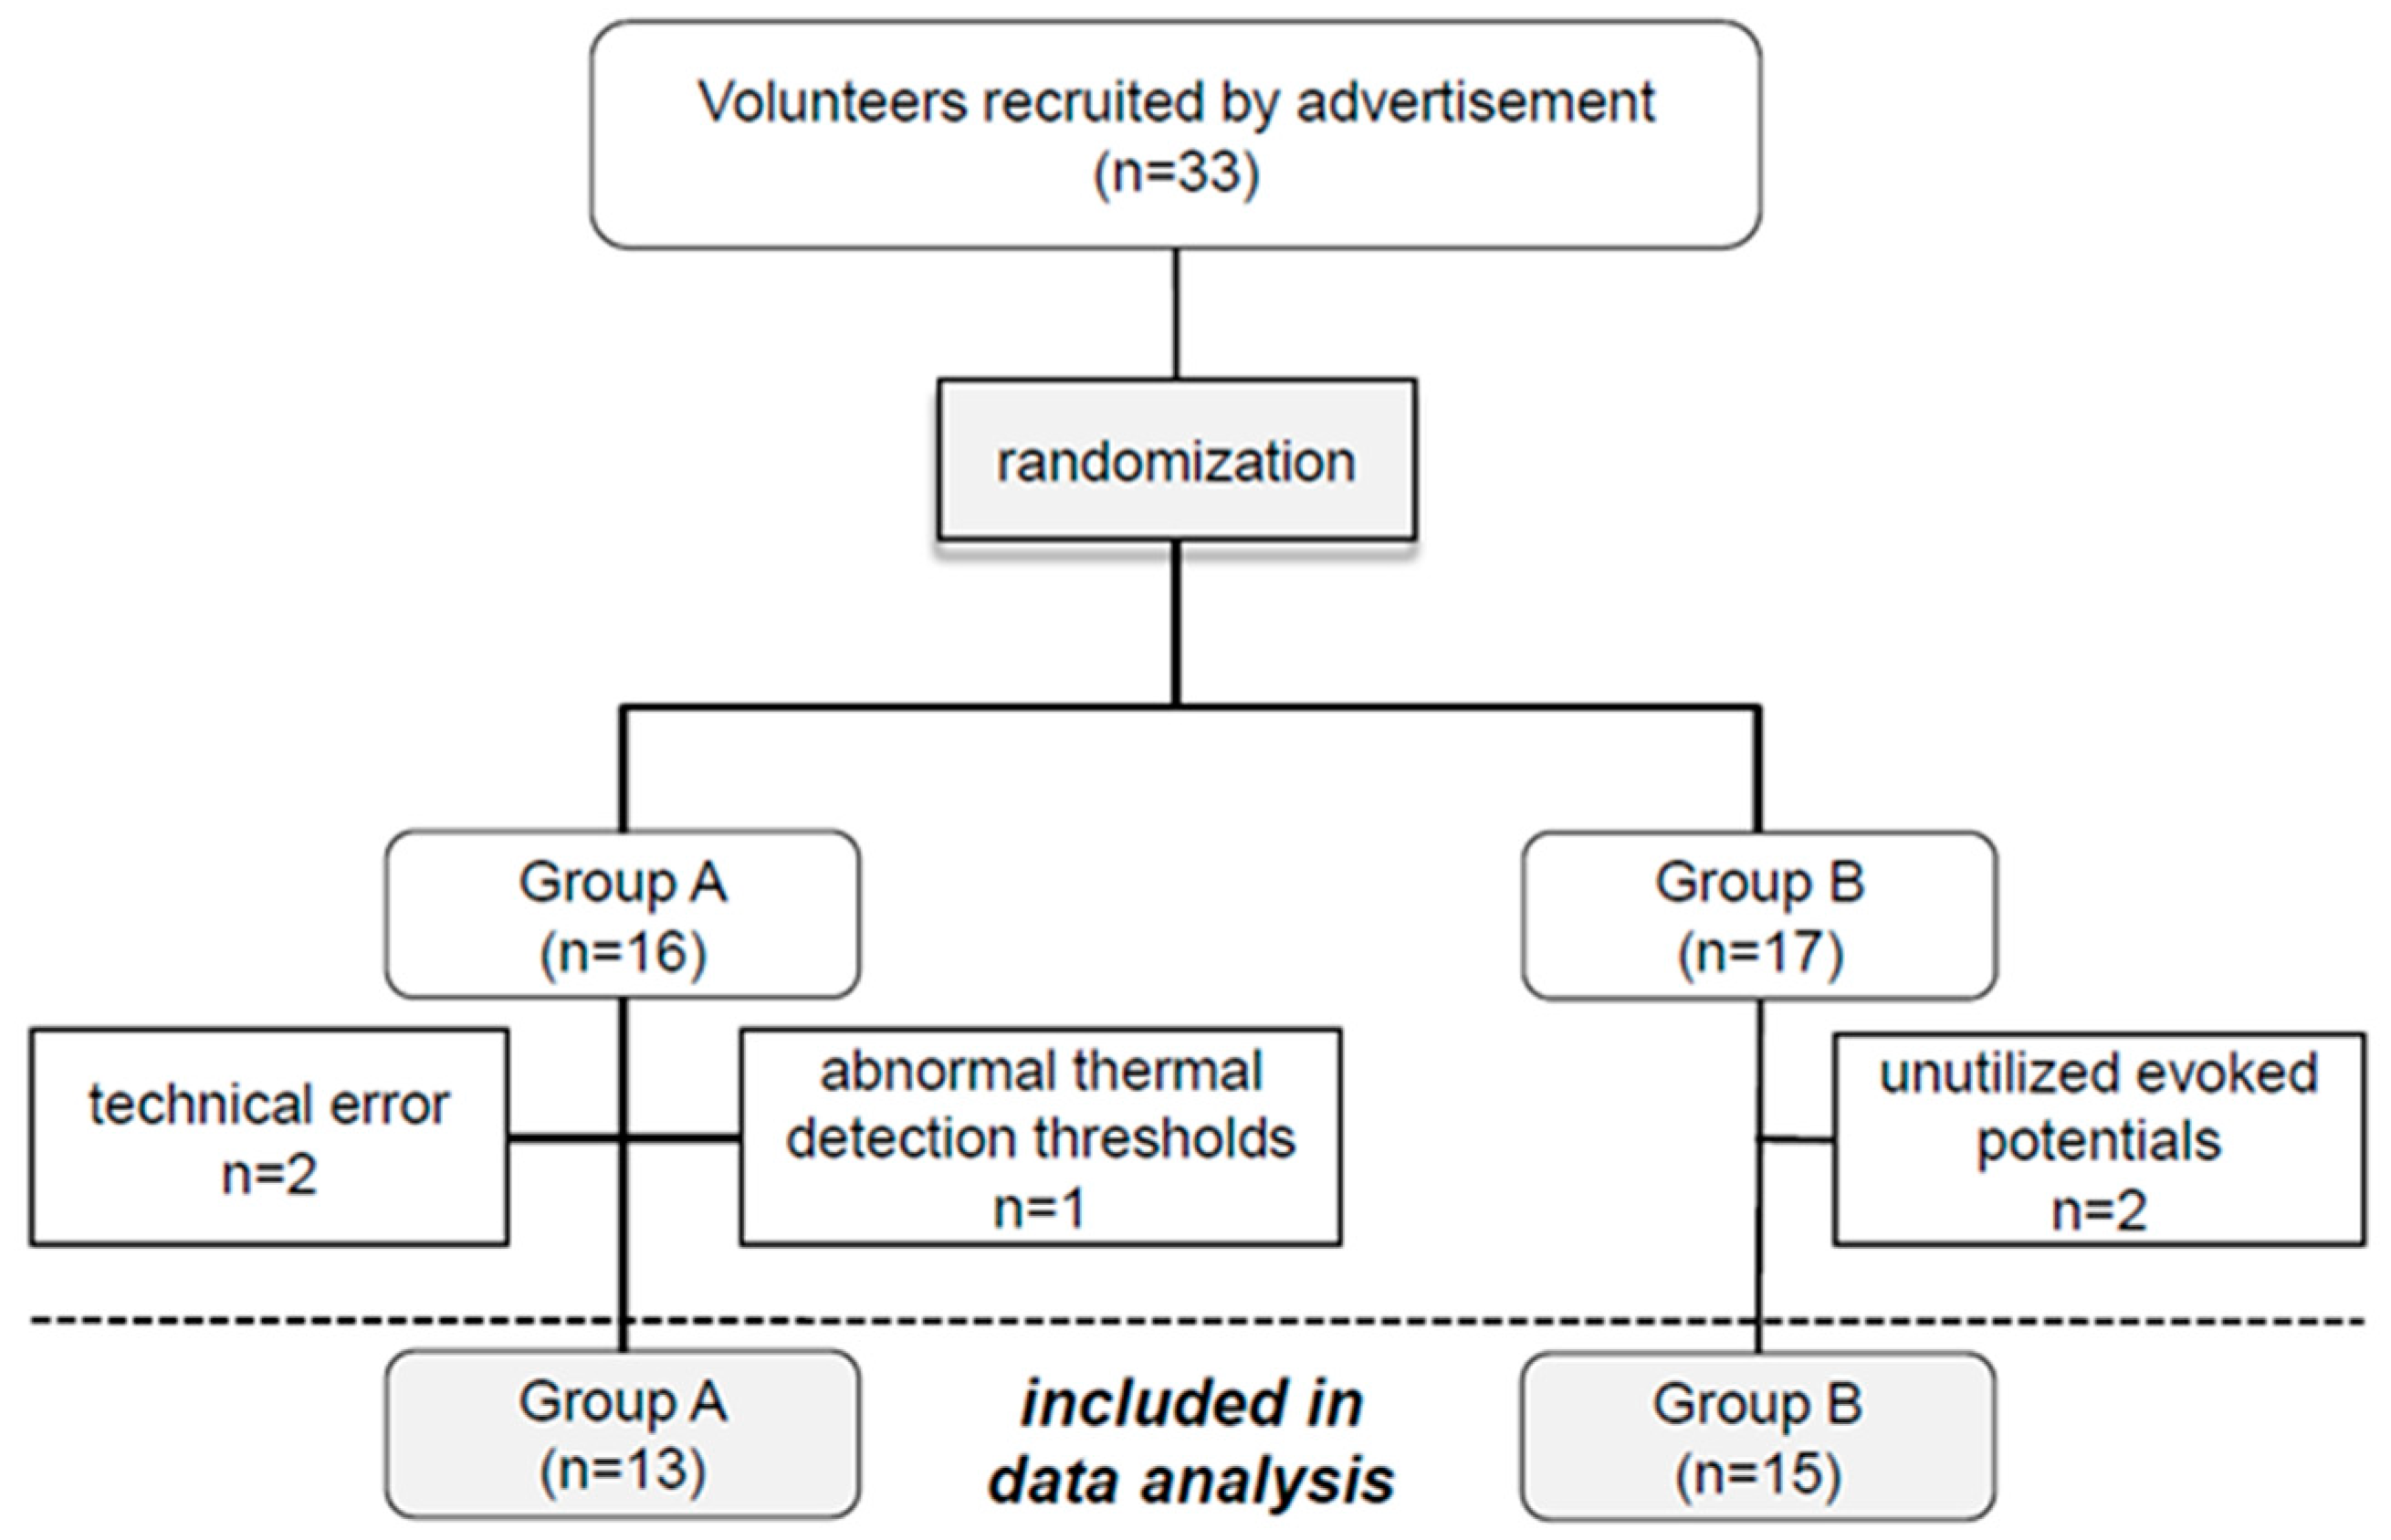
2.1. Subjects
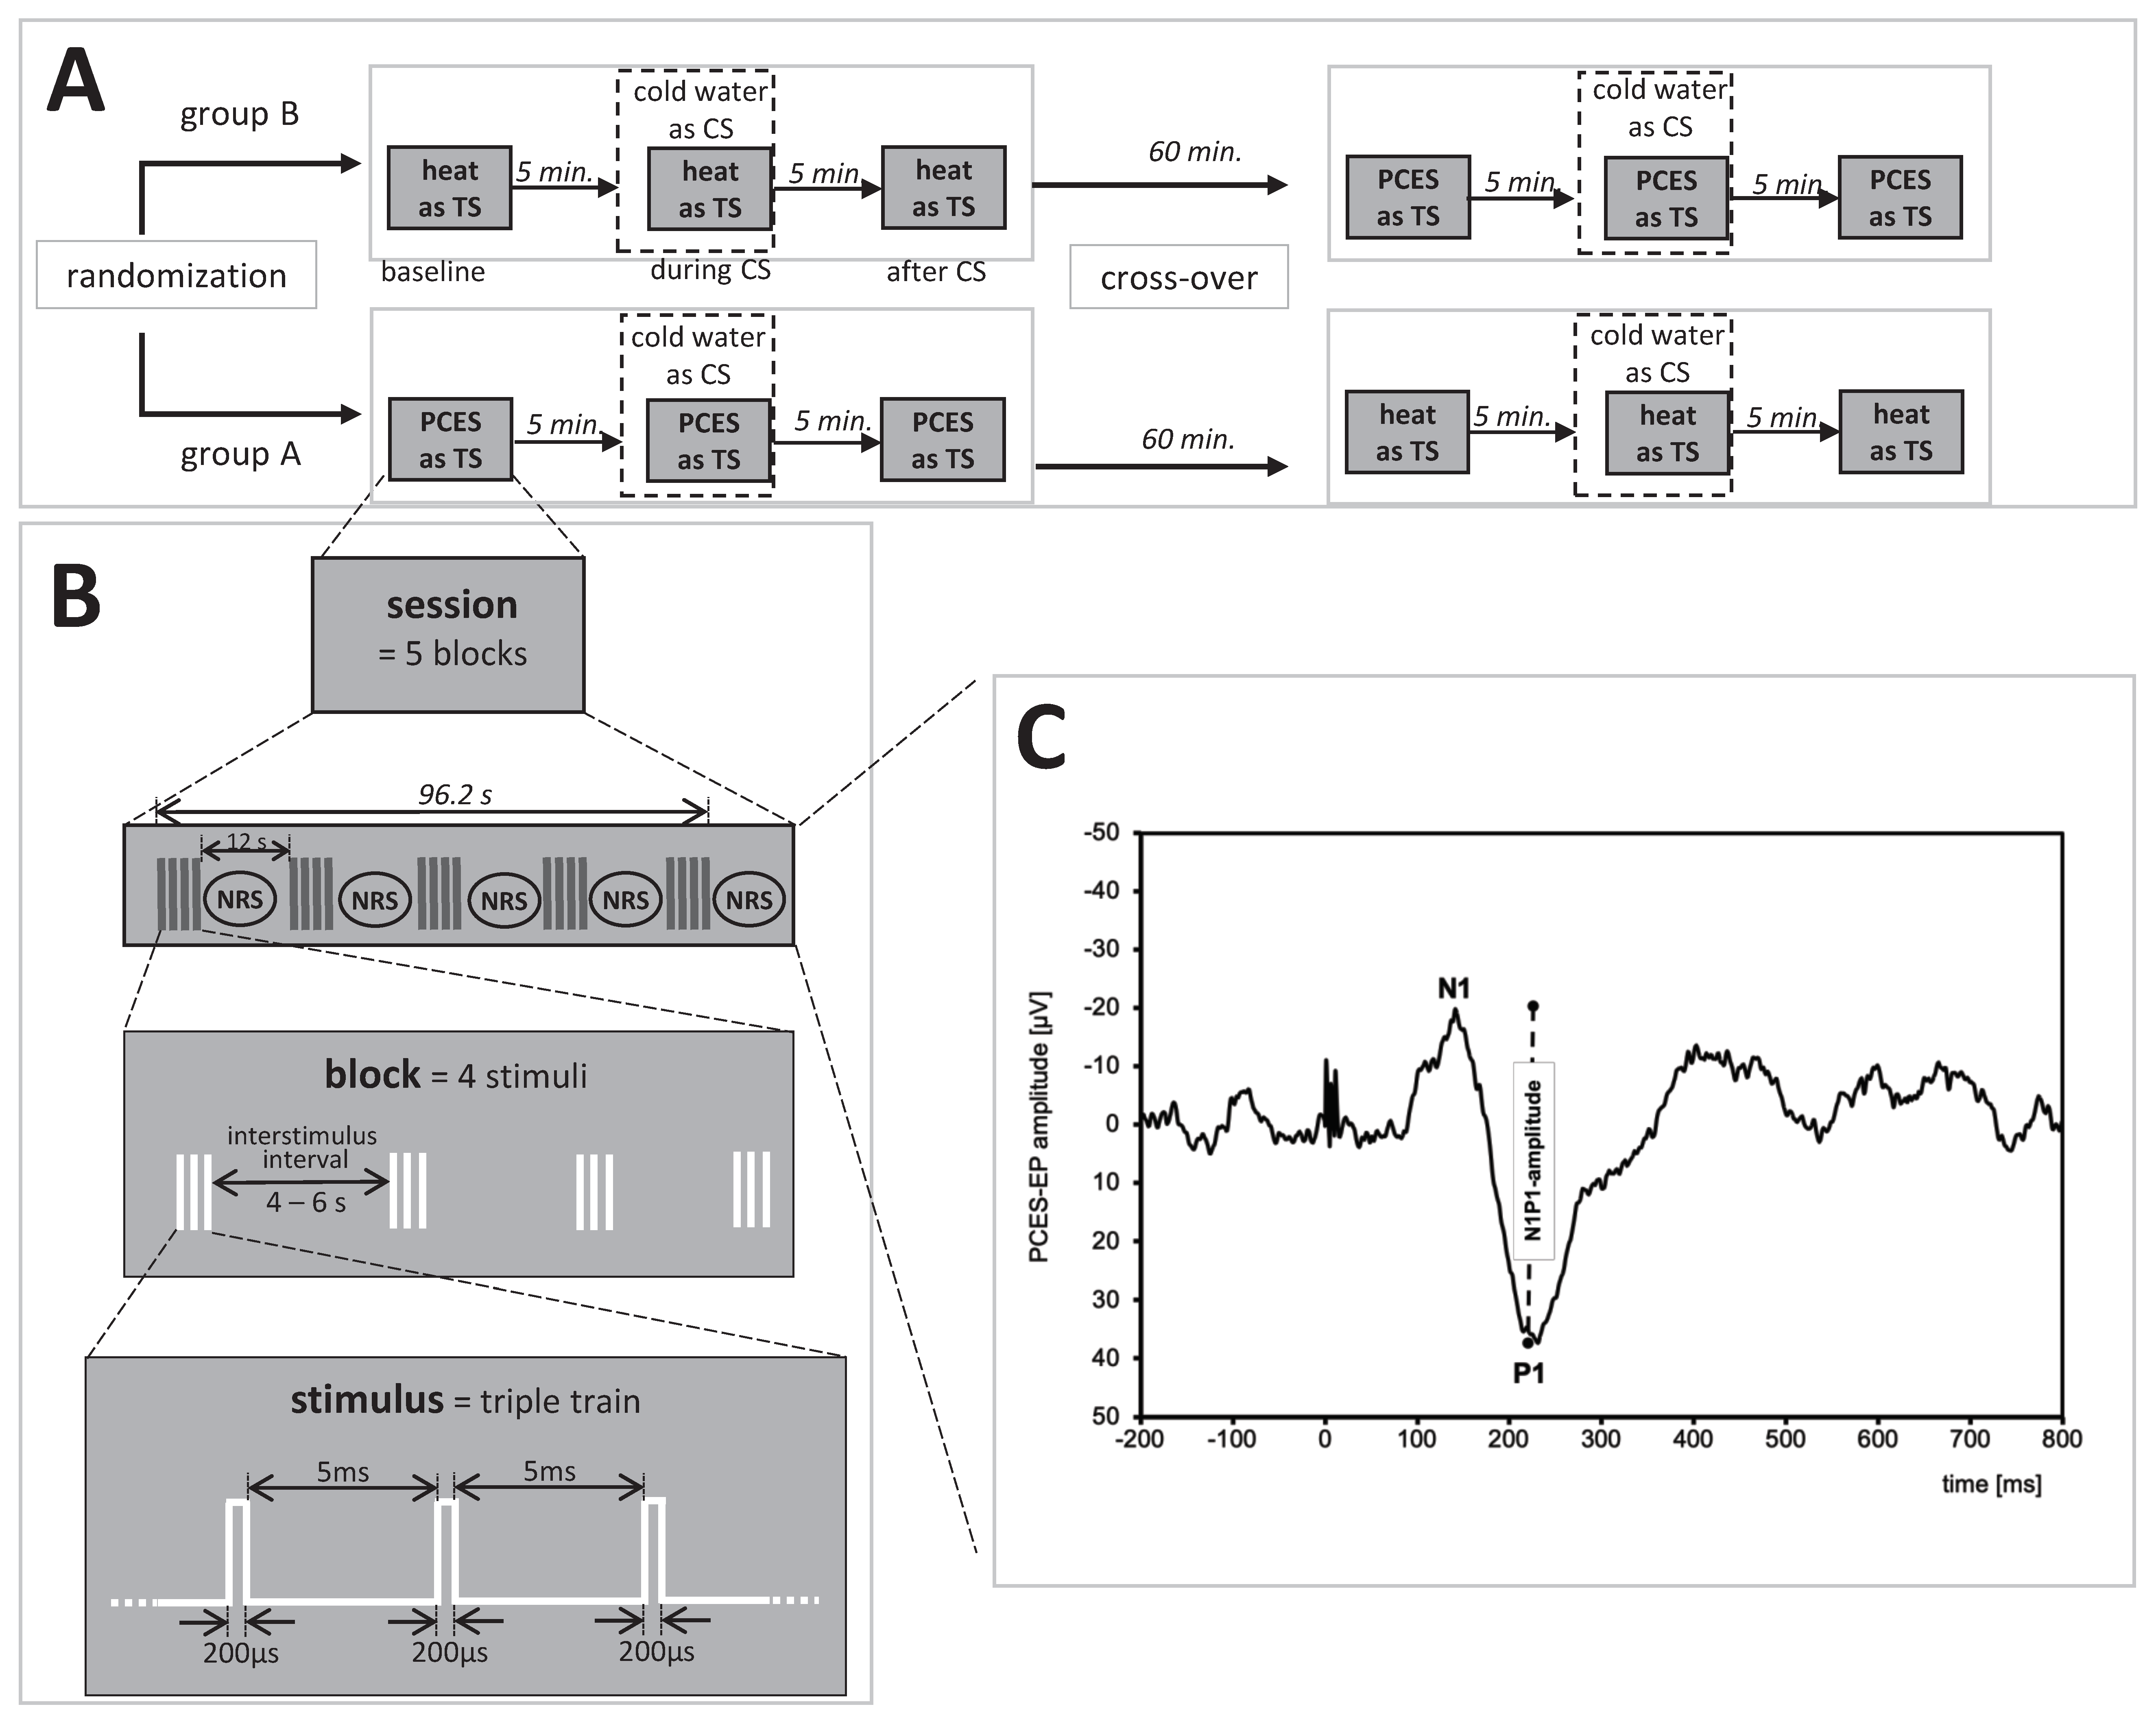
2.2. Study Design
2.3. Test Stimulus Calibration
2.3.1. Painful Cutaneous Electrical Stimulation (PCES)
2.3.2. Tonic Heat
2.4. Conditioning Stimulus
2.5. CPM-Procedure
2.5.1. CPM-Paradigm Based on PCES
2.5.2. CPM-Paradigm Based on Heat Pain
2.5.3. Calculation of the Early CPM-Effect
2.5.4. Calculation of the Late CPM-Effect
2.5.5. CPM-Effect Based on the PCES-Amplitude
2.6. Statistical Analysis
3. Results
3.1. Subjects
3.2. Stimulation Intensities for Both CPM Paradigm
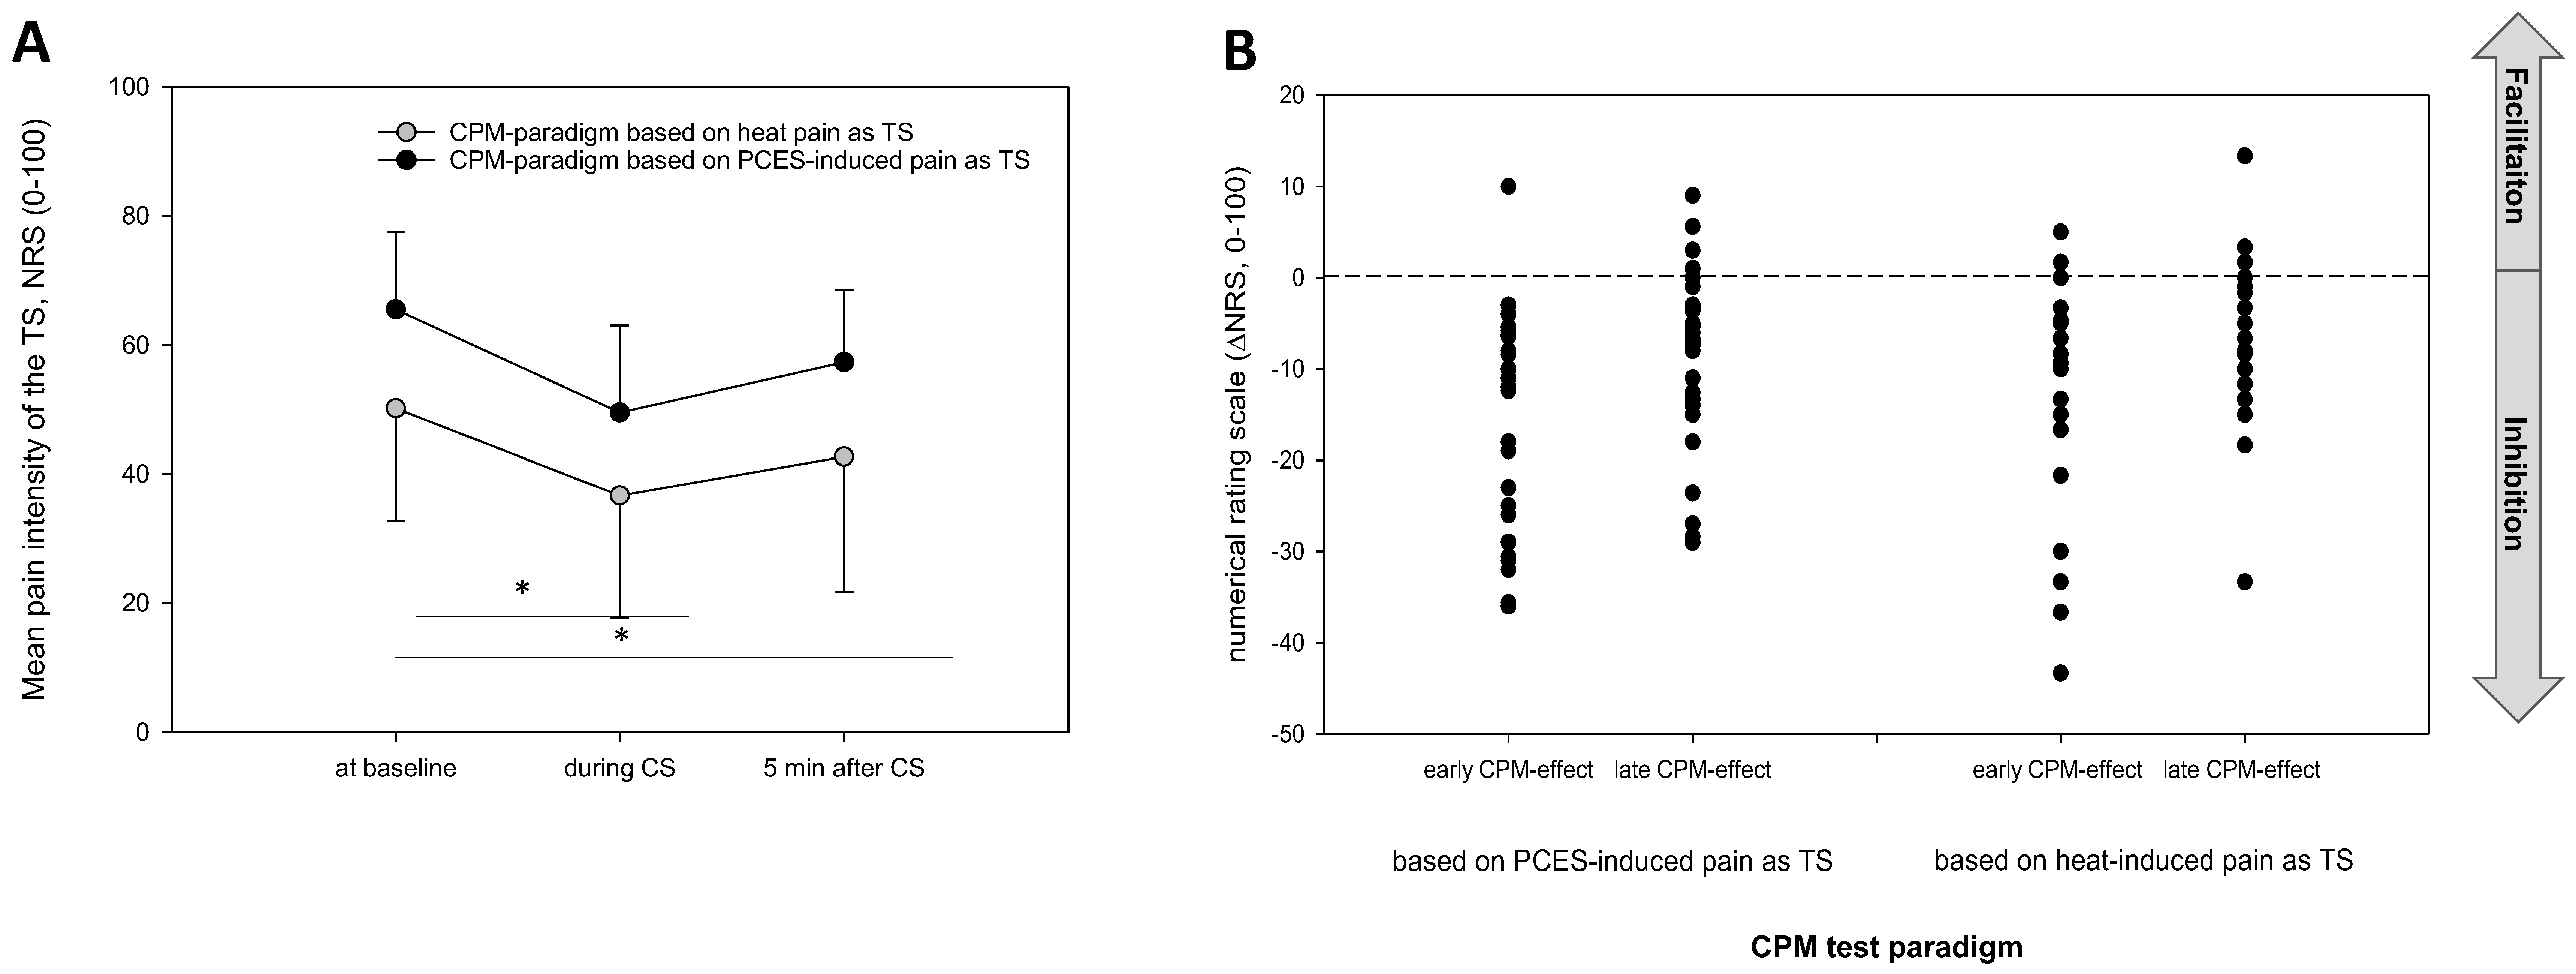
3.3. Comparison of the Pain Ratings between Both Testing Paradigms
3.4. Comparison of the CPM-Effects Based on Pain Ratings between Both Testing Paradigms
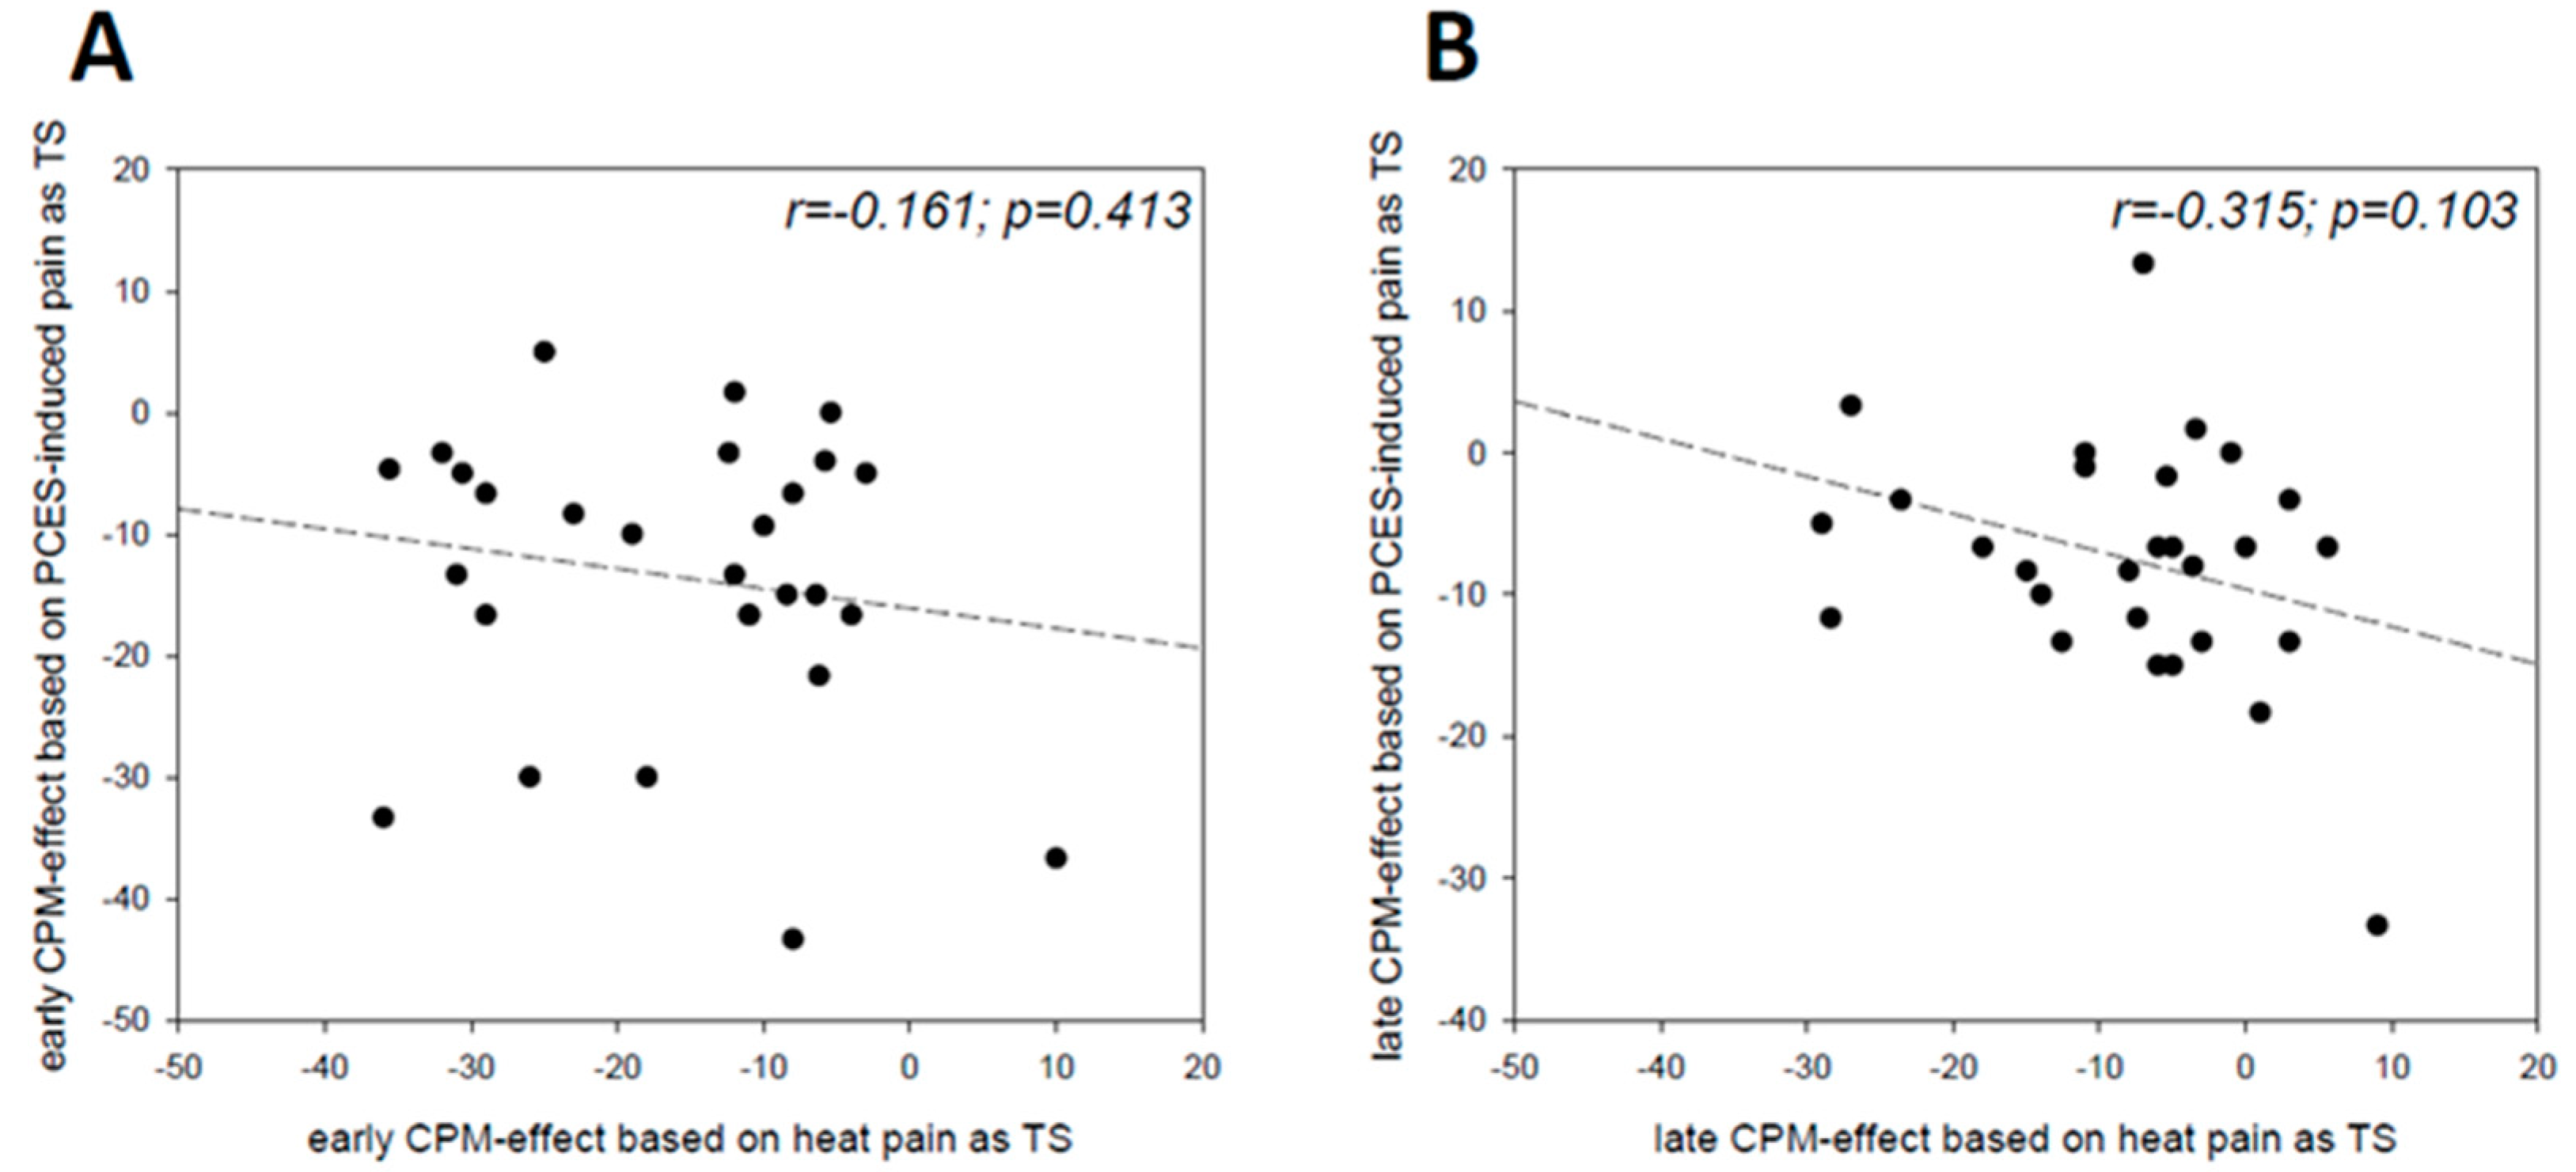
3.5. Relation between the Magnitude of the CPM-Effect and CS
3.6. CPM-Effect Based on PCES-Amplitudes
4. Discussion
4.1. Extend and Duration of the CPM-effect
4.2. Defining Responders and Non-Responders
4.3. Modality Specific Effects
4.4. Strengths and Limitations
5. Conclusions
Author Contributions
Funding
Acknowledgments
Conflicts of Interest
References
- Yarnitsky, D.; Granot, M.; Granovsky, Y. Pain modulation profile and pain therapy: Between pro- and antinociception. Pain 2014, 155, 663–665. [Google Scholar] [CrossRef] [PubMed]
- Lockwood, S.; Dickenson, A.H. What goes up must come down: Insights from studies on descending controls acting on spinal pain processing. J. Neural Transm. 2019. [Google Scholar] [CrossRef] [PubMed] [Green Version]
- Leone, C.; Truini, A. The CPM Effect: Functional Assessment of the Diffuse Noxious Inhibitory Control in Humans. J. Clin. Neurophysiol. 2019, 36, 430–436. [Google Scholar] [CrossRef] [PubMed]
- O’Brien, A.T.; Deitos, A.; Triñanes Pego, Y.; Fregni, F.; Carrillo-de-la-Peña, M.T. Defective Endogenous Pain Modulation in Fibromyalgia: A Meta-Analysis of Temporal Summation and Conditioned Pain Modulation Paradigms. J. Pain 2018, 19, 819–836. [Google Scholar] [CrossRef] [PubMed]
- Petersen, K.K.; McPhee, M.E.; Hoegh, M.S.; Graven-Nielsen, T. Assessment of conditioned pain modulation in healthy participants and patients with chronic pain: Manifestations and implications for pain progression. Curr. Opin. Support. Palliat. Care 2019, 13, 99–106. [Google Scholar] [CrossRef] [PubMed] [Green Version]
- Yarnitsky, D.; Granot, M.; Nahman-Averbuch, H.; Khamaisi, M.; Granovsky, Y. Conditioned pain modulation predicts duloxetine efficacy in painful diabetic neuropathy. Pain 2012, 153, 1193–1198. [Google Scholar] [CrossRef]
- Kisler, L.B.; Weissman-Fogel, I.; Coghill, R.C.; Sprecher, E.; Yarnitsky, D.; Granovsky, Y. Individualization of Migraine Prevention: A Randomized Controlled Trial of Psychophysical-based Prediction of Duloxetine Efficacy. Clin. J. Pain 2019, 35, 753–765. [Google Scholar] [CrossRef]
- Nir, R.-R.; Yarnitsky, D. Conditioned pain modulation. Curr. Opin. Support. Palliat. Care 2015, 9, 131–137. [Google Scholar] [CrossRef]
- Yarnitsky, D.; Bouhassira, D.; Drewes, A.M.; Fillingim, R.B.; Granot, M.; Hansson, P.; Landau, R.; Marchand, S.; Matre, D.; Nilsen, K.B.; et al. Recommendations on practice of conditioned pain modulation (CPM) testing. Eur. J. Pain 2015, 19, 805–806. [Google Scholar] [CrossRef]
- Gehling, J.; Mainka, T.; Vollert, J.; Pogatzki-Zahn, E.M.; Maier, C.; Enax-Krumova, E.K. Short-term test-retest-reliability of conditioned pain modulation using the cold-heat-pain method in healthy subjects and its correlation to parameters of standardized quantitative sensory testing. BMC Neurol. 2016, 16, 125. [Google Scholar] [CrossRef] [Green Version]
- Kumowski, N.; Hegelmaier, T.; Kolbenschlag, J.; Maier, C.; Mainka, T.; Vollert, J.; Enax-Krumova, E. Unimpaired endogenous pain inhibition in the early phase of complex regional pain syndrome. Eur. J. Pain 2017, 21, 855–865. [Google Scholar] [CrossRef] [PubMed]
- Goudman, L.; Laton, J.; Brouns, R.; Nagels, G.; Huysmans, E.; Buyl, R.; Ickmans, K.; Nijs, J.; Moens, M. Cortical mapping of painful electrical stimulation by quantitative electroencephalography: Unraveling the time-frequency-channel domain. J. Pain Res. 2017, 10, 2675–2685. [Google Scholar] [CrossRef] [PubMed] [Green Version]
- Motohashi, K.; Umino, M.; Fujii, Y. An experimental system for a heterotopic pain stimulation study in humans. Brain Res. Brain Res. Protoc. 2002, 10, 31–40. [Google Scholar] [CrossRef]
- Motohashi, K.; Umino, M. Heterotopic painful stimulation decreases the late component of somatosensory evoked potentials induced by electrical tooth stimulation. Brain Res. Cogn. Brain Res. 2001, 11, 39–46. [Google Scholar] [CrossRef]
- Chen, A.C.; Treede, R.D.; Bromm, B. Tonic pain inhibits phasic pain: Evoked cerebral potential correlates in man. Psychiatry Res. 1985, 14. [Google Scholar] [CrossRef]
- Plaghki, L.; Delisle, D.; Godfraind, J.M. Heterotopic nociceptive conditioning stimuli and mental task modulate differently the perception and physiological correlates of short CO2 laser stimuli. Pain 1994, 57. [Google Scholar] [CrossRef]
- Watanabe, I.; Svensson, P.; Arendt-Nielsen, L. Influence of segmental and extra-segmental conditioning, stimuli on cortical potentials evoked by painful electrical stimulation. Somatosens. Mot. Res. 1999, 16, 243–250. [Google Scholar] [CrossRef]
- Torta, D.M.; Churyukanov, M.V.; Plaghki, L.; Mouraux, A. The effect of heterotopic noxious conditioning stimulation on Aδ-, C- and Aβ-fibre brain responses in humans. Eur. J. Neurosci. 2015, 42, 2707–2715. [Google Scholar] [CrossRef]
- Rustamov, N.; Tessier, J.; Provencher, B.; Lehmann, A.; Piché, M. Inhibitory effects of heterotopic noxious counter-stimulation on perception and brain activity related to Aβ-fibre activation. Eur. J. Neurosci. 2016, 44, 1771–1778. [Google Scholar] [CrossRef]
- Höffken, O.; Özgül, Ö.S.; Enax-Krumova, E.K.; Tegenthoff, M.; Maier, C. Evoked potentials after painful cutaneous electrical stimulation depict pain relief during a conditioned pain modulation. BMC Neurol. 2017, 17, 167. [Google Scholar] [CrossRef] [Green Version]
- Granot, M.; Weissman-Fogel, I.; Crispel, Y.; Pud, D.; Granovsky, Y.; Sprecher, E.; Yarnitsky, D. Determinants of endogenous analgesia magnitude in a diffuse noxious inhibitory control (DNIC) paradigm: Do conditioning stimulus painfulness, gender and personality variables matter? Pain 2008, 136, 142–149. [Google Scholar] [CrossRef] [PubMed]
- Gierthmühlen, J.; Enax-Krumova, E.K.; Attal, N.; Bouhassira, D.; Cruccu, G.; Finnerup, N.B.; Haanpää, M.; Hansson, P.; Jensen, T.S.; Freynhagen, R.; et al. Who is healthy? Aspects to consider when including healthy volunteers in QST-based studies—A consensus statement by the EUROPAIN and NEUROPAIN consortia. Pain 2015, 156, 2203–2211. [Google Scholar] [CrossRef] [PubMed]
- Oldfield, R.C. The Assessment and Analysis of Handedness: The Edinburgh Inventory. Neuropsychologia 1971, 9, 97–113. [Google Scholar] [CrossRef]
- Rolke, R.; Baron, R.; Maier, C.; Tölle, T.R.; Treede, R.-D.; Beyer, A.; Binder, A.; Birbaumer, N.; Birklein, F.; Bötefür, I.C.; et al. Quantitative sensory testing in the German Research Network on Neuropathic Pain (DFNS): Standardized protocol and reference values. Pain 2006, 123, 231–243. [Google Scholar] [CrossRef] [PubMed]
- Magerl, W.; Krumova, E.K.; Baron, R.; Tölle, T.; Treede, R.-D.; Maier, C. Reference data for quantitative sensory testing (QST): Refined stratification for age and a novel method for statistical comparison of group data. Pain 2010, 151, 598–605. [Google Scholar] [CrossRef] [PubMed]
- Kaube, H.; Katsarava, Z.; Käufer, T.; Diener, H.-C.; Ellrich, J. A new method to increase nociception specificity of the human blink reflex. Clin. Neurophysiol. 2000, 111, 413–416. [Google Scholar] [CrossRef]
- Katsarava, Z.; Ayzenberg, I.; Sack, F.; Limmroth, V.; Diener, H.-C.; Kaube, H. A novel method of eliciting pain-related potentials by transcutaneous electrical stimulation. Headache 2006, 46, 1511–1517. [Google Scholar] [CrossRef]
- Özgül, Ö.S.; Maier, C.; Enax-Krumova, E.K.; Vollert, J.; Fischer, M.; Tegenthoff, M.; Höffken, O. High test-retest-reliability of pain-related evoked potentials (PREP) in healthy subjects. Neurosci. Lett. 2017, 647, 110–116. [Google Scholar] [CrossRef]
- Obermann, M.; Pleger, B.; de Greiff, A.; Stude, P.; Kaube, H.; Diener, H.-C.; Katsarava, Z. Temporal summation of trigeminal pain in human anterior cingulate cortex. Neuroimage 2009, 46, 193–200. [Google Scholar] [CrossRef]
- Obermann, M.; Katsarava, Z.; Esser, S.; Sommer, C.; He, L.; Selter, L.; Yoon, M.-S.; Kaube, H.; Diener, H.-C.; Maschke, M. Correlation of epidermal nerve fiber density with pain-related evoked potentials in HIV neuropathy. Pain 2008, 138, 79–86. [Google Scholar] [CrossRef]
- Defrin, R.; Tsedek, I.; Lugasi, I.; Moriles, I.; Urca, G. The interactions between spatial summation and DNIC: Effect of the distance between two painful stimuli and attentional factors on pain perception. Pain 2010, 151, 489–495. [Google Scholar] [CrossRef]
- Lewis, G.N.; Heales, L.; Rice, D.A.; Rome, K.; McNair, P.J. Reliability of the conditioned pain modulation paradigm to assess endogenous inhibitory pain pathways. Pain Res. Manag. 2012, 17, 98–102. [Google Scholar] [CrossRef] [PubMed]
- Tesarz, J.; Gerhardt, A.; Schommer, K.; Treede, R.-D.; Eich, W. Alterations in endogenous pain modulation in endurance athletes: An experimental study using quantitative sensory testing and the cold-pressor task. Pain 2013, 154, 1022–1029. [Google Scholar] [CrossRef] [PubMed]
- La Cesa, S.; Di Stefano, G.; Leone, C.; Pepe, A.; Galosi, E.; Alu, F.; Fasolino, A.; Cruccu, G.; Valeriani, M.; Truini, A. Skin denervation does not alter cortical potentials to surface concentric electrode stimulation: A comparison with laser evoked potentials and contact heat evoked potentials. Eur. J. Pain 2018, 22, 161–169. [Google Scholar] [CrossRef] [PubMed]
- Perchet, C.; Frot, M.; Charmarty, A.; Flores, C.; Mazza, S.; Magnin, M.; Garcia-Larrea, L. Do we activate specifically somatosensory thin fibres with the concentric planar electrode? A scalp and intracranial EEG study. Pain 2012, 153, 1244–1252. [Google Scholar] [CrossRef] [PubMed]
- Eitner, L.; Özgül, Ö.S.; Enax-Krumova, E.K.; Vollert, J.; Maier, C.; Höffken, O. Conditioned pain modulation using painful cutaneous electrical stimulation or simply habituation? Eur. J. Pain 2018, 22, 1281–1290. [Google Scholar] [CrossRef]
- Fujii, K.; Motohashi, K.; Umino, M. Heterotopic ischemic pain attenuates somatosensory evoked potentials induced by electrical tooth stimulation: Diffuse noxious inhibitory controls in the trigeminal nerve territory. Eur. J. Pain 2006, 10, 495–504. [Google Scholar] [CrossRef]
- Willer, J.C.; de Broucker, T.; Le Bars, D. Encoding of nociceptive thermal stimuli by diffuse noxious inhibitory controls in humans. J. Neurophysiol. 1989, 62, 1028–1038. [Google Scholar] [CrossRef]
- Serrao, M.; Rossi, P.; Sandrini, G.; Parisi, L.; Amabile, G.A.; Nappi, G.; Pierelli, F. Effects of diffuse noxious inhibitory controls on temporal summation of the RIII reflex in humans. Pain 2004, 112, 353–360. [Google Scholar] [CrossRef]
- Pickering, G.; Pereira, B.; Dufour, E.; Soule, S.; Dubray, C. Impaired modulation of pain in patients with postherpetic neuralgia. Pain Res. Manag. 2014, 19, e19–e23. [Google Scholar] [CrossRef] [Green Version]
- Hackett, J.; Naugle, K.E.; Naugle, K.M. The Decline of Endogenous Pain Modulation with Aging: A Meta-Analysis of Temporal Summation and Conditioned Pain Modulation. J. Pain 2019. [Google Scholar] [CrossRef] [PubMed]
- Nir, R.-R.; Yarnitsky, D.; Honigman, L.; Granot, M. Cognitive manipulation targeted at decreasing the conditioning pain perception reduces the efficacy of conditioned pain modulation. Pain 2012, 153, 170–176. [Google Scholar] [CrossRef] [PubMed]
- Nir, R.-R.; Granovsky, Y.; Yarnitsky, D.; Sprecher, E.; Granot, M. A psychophysical study of endogenous analgesia: The role of the conditioning pain in the induction and magnitude of conditioned pain modulation. Eur. J. Pain 2011, 15, 491–497. [Google Scholar] [CrossRef]
- Kennedy, D.L.; Kemp, H.I.; Ridout, D.; Yarnitsky, D.; Rice, A.S.C. Reliability of conditioned pain modulation: A systematic review. Pain 2016, 157, 2410–2419. [Google Scholar] [CrossRef]
- Rankin, G.; Stokes, M. Reliability of assessment tools in rehabilitation: An illustration of appropriate statistical analyses. Clin. Rehabil. 1998, 12, 187–199. [Google Scholar] [CrossRef]
- Locke, D.; Gibson, W.; Moss, P.; Munyard, K.; Mamotte, C.; Wright, A. Analysis of meaningful conditioned pain modulation effect in a pain-free adult population. J. Pain 2014, 15, 1190–1198. [Google Scholar] [CrossRef]
- Kakigi, R. Diffuse noxious inhibitory control. Reappraisal by pain-related somatosensory evoked potentials following CO2 laser stimulation. J. Neurol. Sci. 1994, 125, 198–205. [Google Scholar] [CrossRef]
- Reinert, A.; Treede, R.-D.; Bromm, B. The pain inhibiting pain effect: An electrophysiological study in humans. Brain Res. 2000, 862, 103–110. [Google Scholar] [CrossRef]
- Sandrini, G.; Serrao, M.; Rossi, P.; Romaniello, A.; Cruccu, G.; Willer, J.C. The lower limb flexion reflex in humans. Prog. Neurobiol. 2005, 77, 353–395. [Google Scholar] [CrossRef]
- Yarnitsky, D. Role of endogenous pain modulation in chronic pain mechanisms and treatment. Pain 2015, 156 (Suppl. 1), S24–S31. [Google Scholar] [CrossRef]
- Aparecida da Silva, V.; Galhardoni, R.; Teixeira, M.J.; Ciampi de Andrade, D. Not just a matter of pain intensity: Effects of three different conditioning stimuli on conditioned pain modulation effects. Neurophysiol. Clin. 2018, 48, 287–293. [Google Scholar] [CrossRef] [PubMed]
- Oono, Y.; Wang, K.; Svensson, P.; Arendt-Nielsen, L. Conditioned pain modulation evoked by different intensities of mechanical stimuli applied to the craniofacial region in healthy men and women. J. Orofac. Pain 2011, 25, 364–375. [Google Scholar] [PubMed]
- Ibancos-Losada, M.D.R.; Osuna-Pérez, M.C.; Castellote-Caballero, M.Y.; Díaz-Fernández, Á. Conditioned Pain Modulation Effectiveness: An Experimental Study Comparing Test Paradigms and Analyzing Potential Predictors in a Healthy Population. Brain Sci. 2020, 10, 599. [Google Scholar] [CrossRef] [PubMed]
- Vaegter, H.B.; Petersen, K.K.; Mørch, C.D.; Imai, Y.; Arendt-Nielsen, L. Assessment of CPM reliability: Quantification of the within-subject reliability of 10 different protocols. Scand. J. Pain 2018, 18, 729–737. [Google Scholar] [CrossRef] [Green Version]
- Imai, Y.; Petersen, K.K.; Mørch, C.D.; Arendt Nielsen, L. Comparing test-retest reliability and magnitude of conditioned pain modulation using different combinations of test and conditioning stimuli. Somatosens. Mot. Res. 2016, 33, 169–177. [Google Scholar] [CrossRef]
- Agostinho, C.M.S.; Scherens, A.; Richter, H.; Schaub, C.; Rolke, R.; Treede, R.-D.; Maier, C. Habituation and short-term repeatability of thermal testing in healthy human subjects and patients with chronic non-neuropathic pain. Eur. J. Pain 2009, 13, 779–785. [Google Scholar] [CrossRef]
- Greffrath, W.; Baumgärtner, U.; Treede, R.-D. Peripheral and central components of habituation of heat pain perception and evoked potentials in humans. Pain 2007, 132, 301–311. [Google Scholar] [CrossRef]
- Li, J.; Simone, D.A.; Larson, A.A. Windup leads to characteristics of central sensitization. Pain 1999, 79, 75–82. [Google Scholar] [CrossRef]
- Baron, R.; Hans, G.; Dickenson, A.H. Peripheral input and its importance for central sensitization. Ann. Neurol. 2013, 74, 630–636. [Google Scholar] [CrossRef]


| Factor | F-Value | Significance | Partial η2 |
|---|---|---|---|
| time | F 2;52 = 62.931 | p < 0.001 | 0.708 |
| time * randomisation group | F 2;52 = 1.295 | p = 0.283 | 0.047 |
| testing paradigm | F 1;26 = 14.744 | p = 0.001 | 0.362 |
| testing paradigm * randomisation group | F 1;26 = 3.931 | p = 0.058 | 0.131 |
| time * testing paradigm | F 2;52 = 0.373 | p = 0.690 | 0.014 |
| time * testing paradigm * randomisation group | F 2;52 = 0.558 | p = 0.576 | 0.021 |
| PCES-Induced Pain | Heat Pain | |||||
|---|---|---|---|---|---|---|
| First Pain Rating | Last Pain Rating | p-Value | First Pain Rating | Last Pain Rating | p-Value | |
| Baseline | 62.1 ± 14.4 | 67.4 ± 14.5 | 0.080 | 61.6 ± 13.9 | 43.2 ± 23.5 | <0.001 |
| During CS | 46.9 ± 13.2 | 51.1 ± 15.2 | 0.076 | 43.4 ± 18.7 | 31.0 ± 21.2 | <0.001 |
| After CS | 55.1 ± 13.8 | 57.9 ± 12.8 | 0.241 | 49.8 ± 19.7 | 37.0 ± 22.8 | <0.001 |
| CPM Testing Paradigm Based on PCES | CPM Testing Paradigm Based on Heat Pain | |||
|---|---|---|---|---|
| Early CPM-Effect | Late CPM-Effect | Early CPM-Effect | Late CPM-Efect | |
| absolute number of responders (CPM-effect >0) | 27 | 22 | 25 | 23 |
| relative number [%] of responders | 96 | 79 | 89 | 82 |
| absolute magnitude of the CPM-effect | −16.0 ± 11.8 | −8.17 ± 9.99 | −13.5 ± 12.0 | −7.5 ± 8.4 |
| relative magnitude [%] of the CPM-effect | −22.7 ± 17.9 | −11.5 ± 14.3 | −29.2 ± 24.8 | −19.3 ± 23.4 |
© 2020 by the authors. Licensee MDPI, Basel, Switzerland. This article is an open access article distributed under the terms and conditions of the Creative Commons Attribution (CC BY) license (http://creativecommons.org/licenses/by/4.0/).
Share and Cite
Enax-Krumova, E.; Plaga, A.-C.; Schmidt, K.; Özgül, Ö.S.; Eitner, L.B.; Tegenthoff, M.; Höffken, O. Painful Cutaneous Electrical Stimulation vs. Heat Pain as Test Stimuli in Conditioned Pain Modulation . Brain Sci. 2020, 10, 684. https://0-doi-org.brum.beds.ac.uk/10.3390/brainsci10100684
Enax-Krumova E, Plaga A-C, Schmidt K, Özgül ÖS, Eitner LB, Tegenthoff M, Höffken O. Painful Cutaneous Electrical Stimulation vs. Heat Pain as Test Stimuli in Conditioned Pain Modulation . Brain Sciences. 2020; 10(10):684. https://0-doi-org.brum.beds.ac.uk/10.3390/brainsci10100684
Chicago/Turabian StyleEnax-Krumova, Elena, Ann-Christin Plaga, Kimberly Schmidt, Özüm S. Özgül, Lynn B. Eitner, Martin Tegenthoff, and Oliver Höffken. 2020. "Painful Cutaneous Electrical Stimulation vs. Heat Pain as Test Stimuli in Conditioned Pain Modulation " Brain Sciences 10, no. 10: 684. https://0-doi-org.brum.beds.ac.uk/10.3390/brainsci10100684