Article

Studying Individual Differences in Spatial Cognition Through Differential Item Functioning Analysis

1
Department of Educational Sciences, Psychology, Communication, University of Bari, 70121 Bari, Italy
2
Helmholtz Institute, Experimental Psychology, Utrecht University, 3584 CS Utrecht, The Netherlands
*
Author to whom correspondence should be addressed.
Submission received: 28 September 2020 / Revised: 21 October 2020 / Accepted: 22 October 2020 / Published: 24 October 2020
(This article belongs to the Special Issue Effects of Individual Differences on Spatial Cognition)

Abstract

:
Background: In the field of spatial cognition, the study of individual differences represents a typical research topic. Gender and age have been prominently investigated. A promising statistical technique used to identify the different responses to items in relation to different group memberships is the Differential Item Functioning Analysis (DIF). The aim of the present study was to investigate the DIF of the Landmark positioning on a Map (LPM) task, across age groups (young and elderly) and gender, in a sample of 400 healthy human participants. Methods: LPM is a hometown map completion test based on well-known and familiar landmarks used to assess allocentric mental representations. DIF was assessed on LPM items two times: on categorical (i.e., positions) and coordinate (i.e., distances) scores, separately. Results: When positions and distances were difficult to assess with respect to the intended reference point, the probability to endorse the items seemed to get worse for the elderly compared to the younger participants. Instead other features of landmarks (high pleasantness, restorativeness) seemed to improve the elderly performance. A gender-related improvement of probability to endorse distance estimation of some landmarks, favoring women, emerged, probably associated with their repeated experiences with those landmarks. Overall, the complexity of the task seemed to have a differential impact on young and elderly people while gender-oriented activities and places seemed to have a differential impact on men and women. Conclusions: For the first time DIF was applied to a spatial mental representation task, based on the schematic sketch maps of the participants. The application of DIF to the study of individual differences in spatial cognition should become a systematic routine to early detect differential items, improving knowledge, as well as experimental control, on individual differences.

1. Introduction

The study of individual differences represents a major topic in psychological sciences. Individuals show differences in behavior, cognition, personality, and attitudes, arising from biological as well as cultural and socio-economic factors. In spatial cognition as well, the study of individual differences has represented a classical research line. Gender and age have received greater attention with respect to other variables. Regarding gender differences, several reviews and meta-analyses witnessed the amount of primary studies on the role of gender in spatial abilities (e.g., [1,2,3,4,5]), mental rotation [6,7,8], spatial orientation [9], spatial navigation [10], spatial learning and memory in cognition [11] and sports [12], categorical and coordinate spatial relations [13], visuo-spatial abilities in adults [14] and in students with learning disabilities [15], and spatial reasoning [16]. Age differences have also been investigated and summarized in reviews and meta-analyses concerning spatial cognition in general [17,18] spatial memory [19] and spatial navigation processes in both normal [20] and impaired aging [21], egocentric and allocentric spatial reference frames in aging [22] virtual reality for the diagnosis of spatial navigation disorders [23], visuospatial working memory [24], topographical disorientation in aging within familiar and unfamiliar environment [25], and heritability of cognitive aging [26]. Dealing with gender and age differences in assessment and intervention contexts poses at least two complementary issues, one in which researchers and professionals are interested in finding and employing tools that can dissolve such differences, and the other in which they are interested in finding and employing tools that can maximize them. Sometimes the aim is to rely on a tool to assess a construct without worrying about a potential differential effect due to individual differences, and some other times the aim is to select a tool suitable to assess a construct in a specific group only (i.e., women rather than men, or elderly rather than young people). Moreover, when creating a psychological test, it is a rare eventuality to think of different forms suitable to specific groups before a general validation has occurred. In a similar vein, it is equally rare to obtain invariance across given groups without modifying the structure of a test, by adding or deleting items.
A statistical and psychometrics technique used to identify tests whose scores may be affected by groups’ characteristics is Differential Item Functioning (DIF) analysis. DIF occurs when groups show different probabilities of endorsing a single item on a multi-item scale after controlling for overall scale scores. An item is considered as having DIF when individuals with the same ability but coming from different groups show an unequal probability of giving a response. An item is considered as non-DIF when individuals with the same competence have equal probability of giving a correct response, irrespective of group membership. It is worthwhile to note that DIF can be used for measurements across both groups times. Several data analytic strategies have been adopted for detecting DIF, such as the Mantel-Haenszel approach, the odds ratios, Item Response Theory models, and logistic regression. The latter method is widespread for the following reasons: first, several standardized tests or experimental trials and measures use questions which are or can be dichotomized as “correct” or “incorrect”, and logistic regression represents the natural strategy to analyze binary outcomes (e.g., [27,28]). Second, logistic regression can detect both uniform and non-uniform DIF employing two or more categorical groups or a continuous random variable, thus allowing for a wide applicability for most psychological measures. Third, it can be used on single items of a test to retain or remove one or more items. Indeed, logistic regression for detecting DIF involve running a separate analysis for each item. The independent variables are an ability matching variable, usually a total score of a test, group membership, and an interaction term between the two former variables. The dependent variable is the probability or likelihood of endorsing an item or getting a correct response. The logistic regression equation used to detect DIF is the following:
Y = β0 + β1M + β2G + β3MG
where β0 corresponds to the intercept or the probability of a response when M and G are equal to 0, β1 corresponds to weight coefficient for the first independent variable, M, namely the matching variable used to link individuals on ability, β2 corresponds to weight coefficient for the second independent variable, G, namely the group membership variable, and β3 corresponds to weight coefficient for the interaction term between the two above mentioned variables, MG. Variables are entered hierarchically by the following sequence: matching variable M, grouping variable G, and the interaction variable MG.
DIF analysis has been proficiently used in several psychological fields, such as social (e.g., [29,30,31]), clinical (e.g., [32,33]), and cognitive (e.g., [34,35]) psychology. Its use seems not to be confined to paper-and-pencil self-reported questionnaires only, but there also is a large employment for behavioral (e.g., [36]), neuropsychological and performance-based tools (e.g., [37,38,39]). To the best of our knowledge, there are no studies employing DIF analysis in spatial cognition performance measures, except for Choo, Park, and Nelson [40] which evaluated the impact of mild learning disabilities on students’ spatial thinking skills.
In the present study, DIF analysis based on logistic regression will be applied to a task developed by Lopez et al. [25] to investigate hometown topographical knowledge. Recent literature showed that familiarity with the environment might represent a protective factor from spatial memory impairment in non-pathological cognitive aging, in particular for allocentric tasks. Indeed, information consolidated across a huge number of retrieval episodes seems to be solidly preserved in elderly people, making them to obtain a performance comparable with that of younger people [41,42,
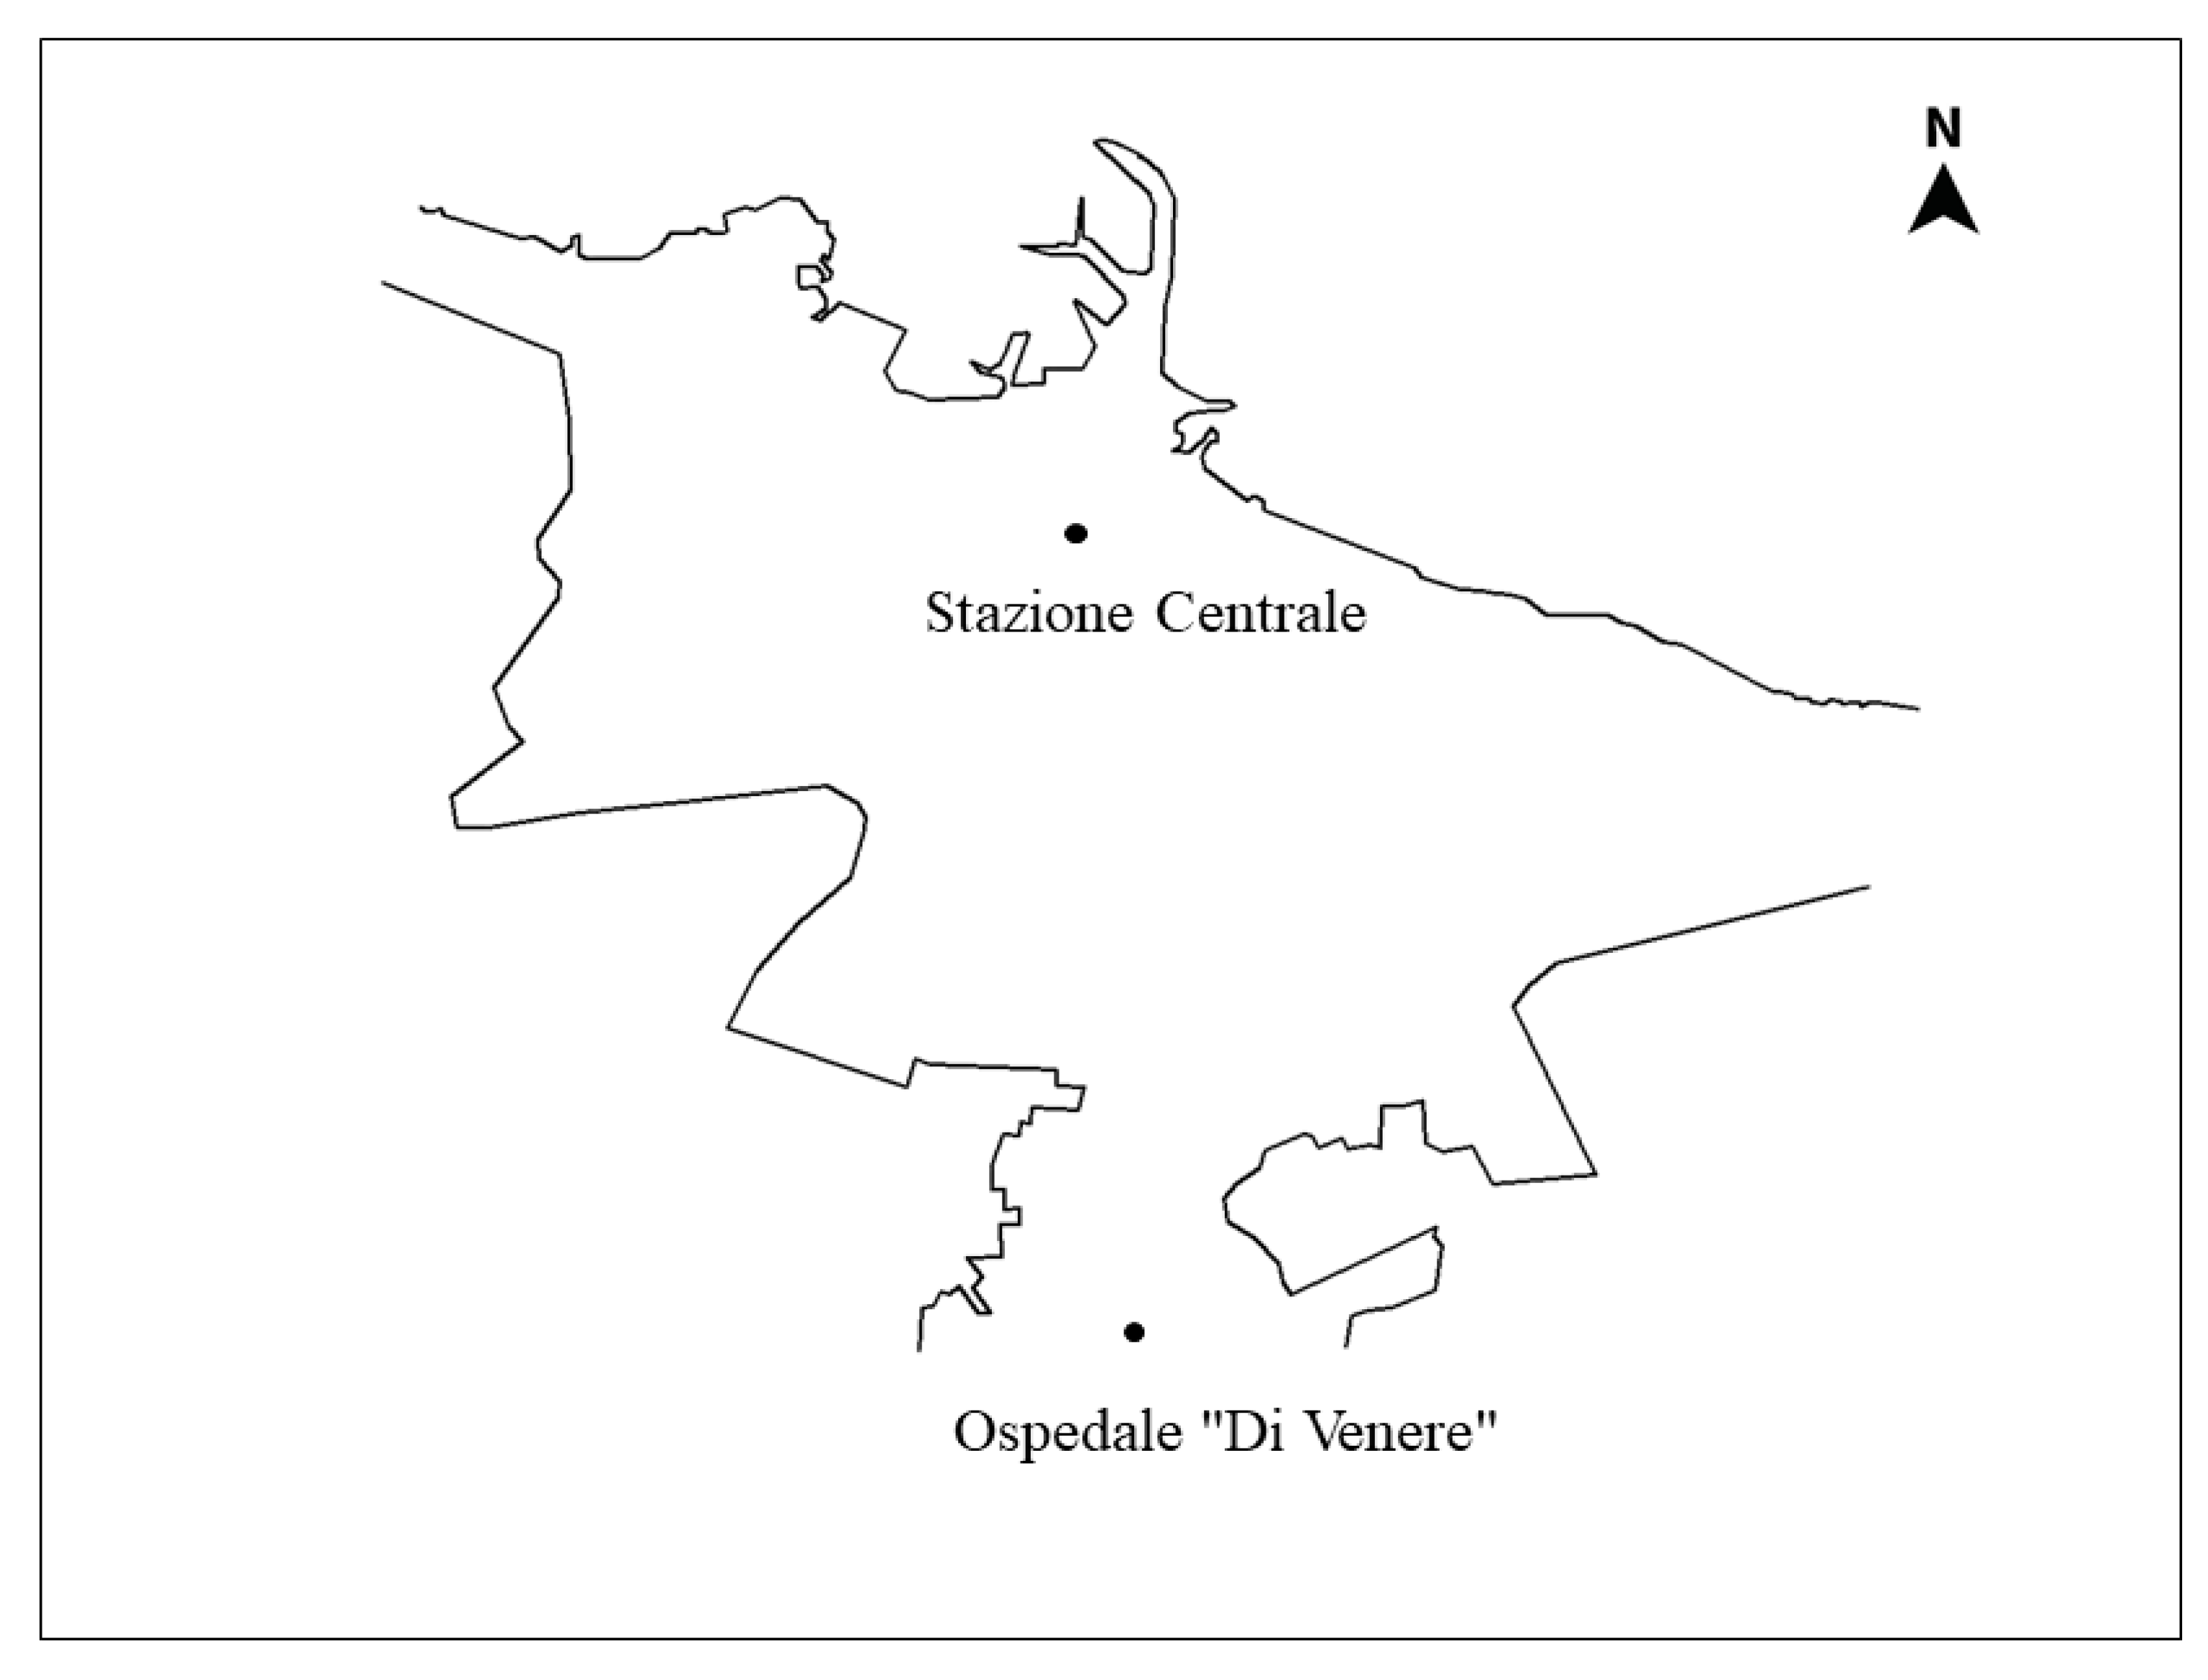
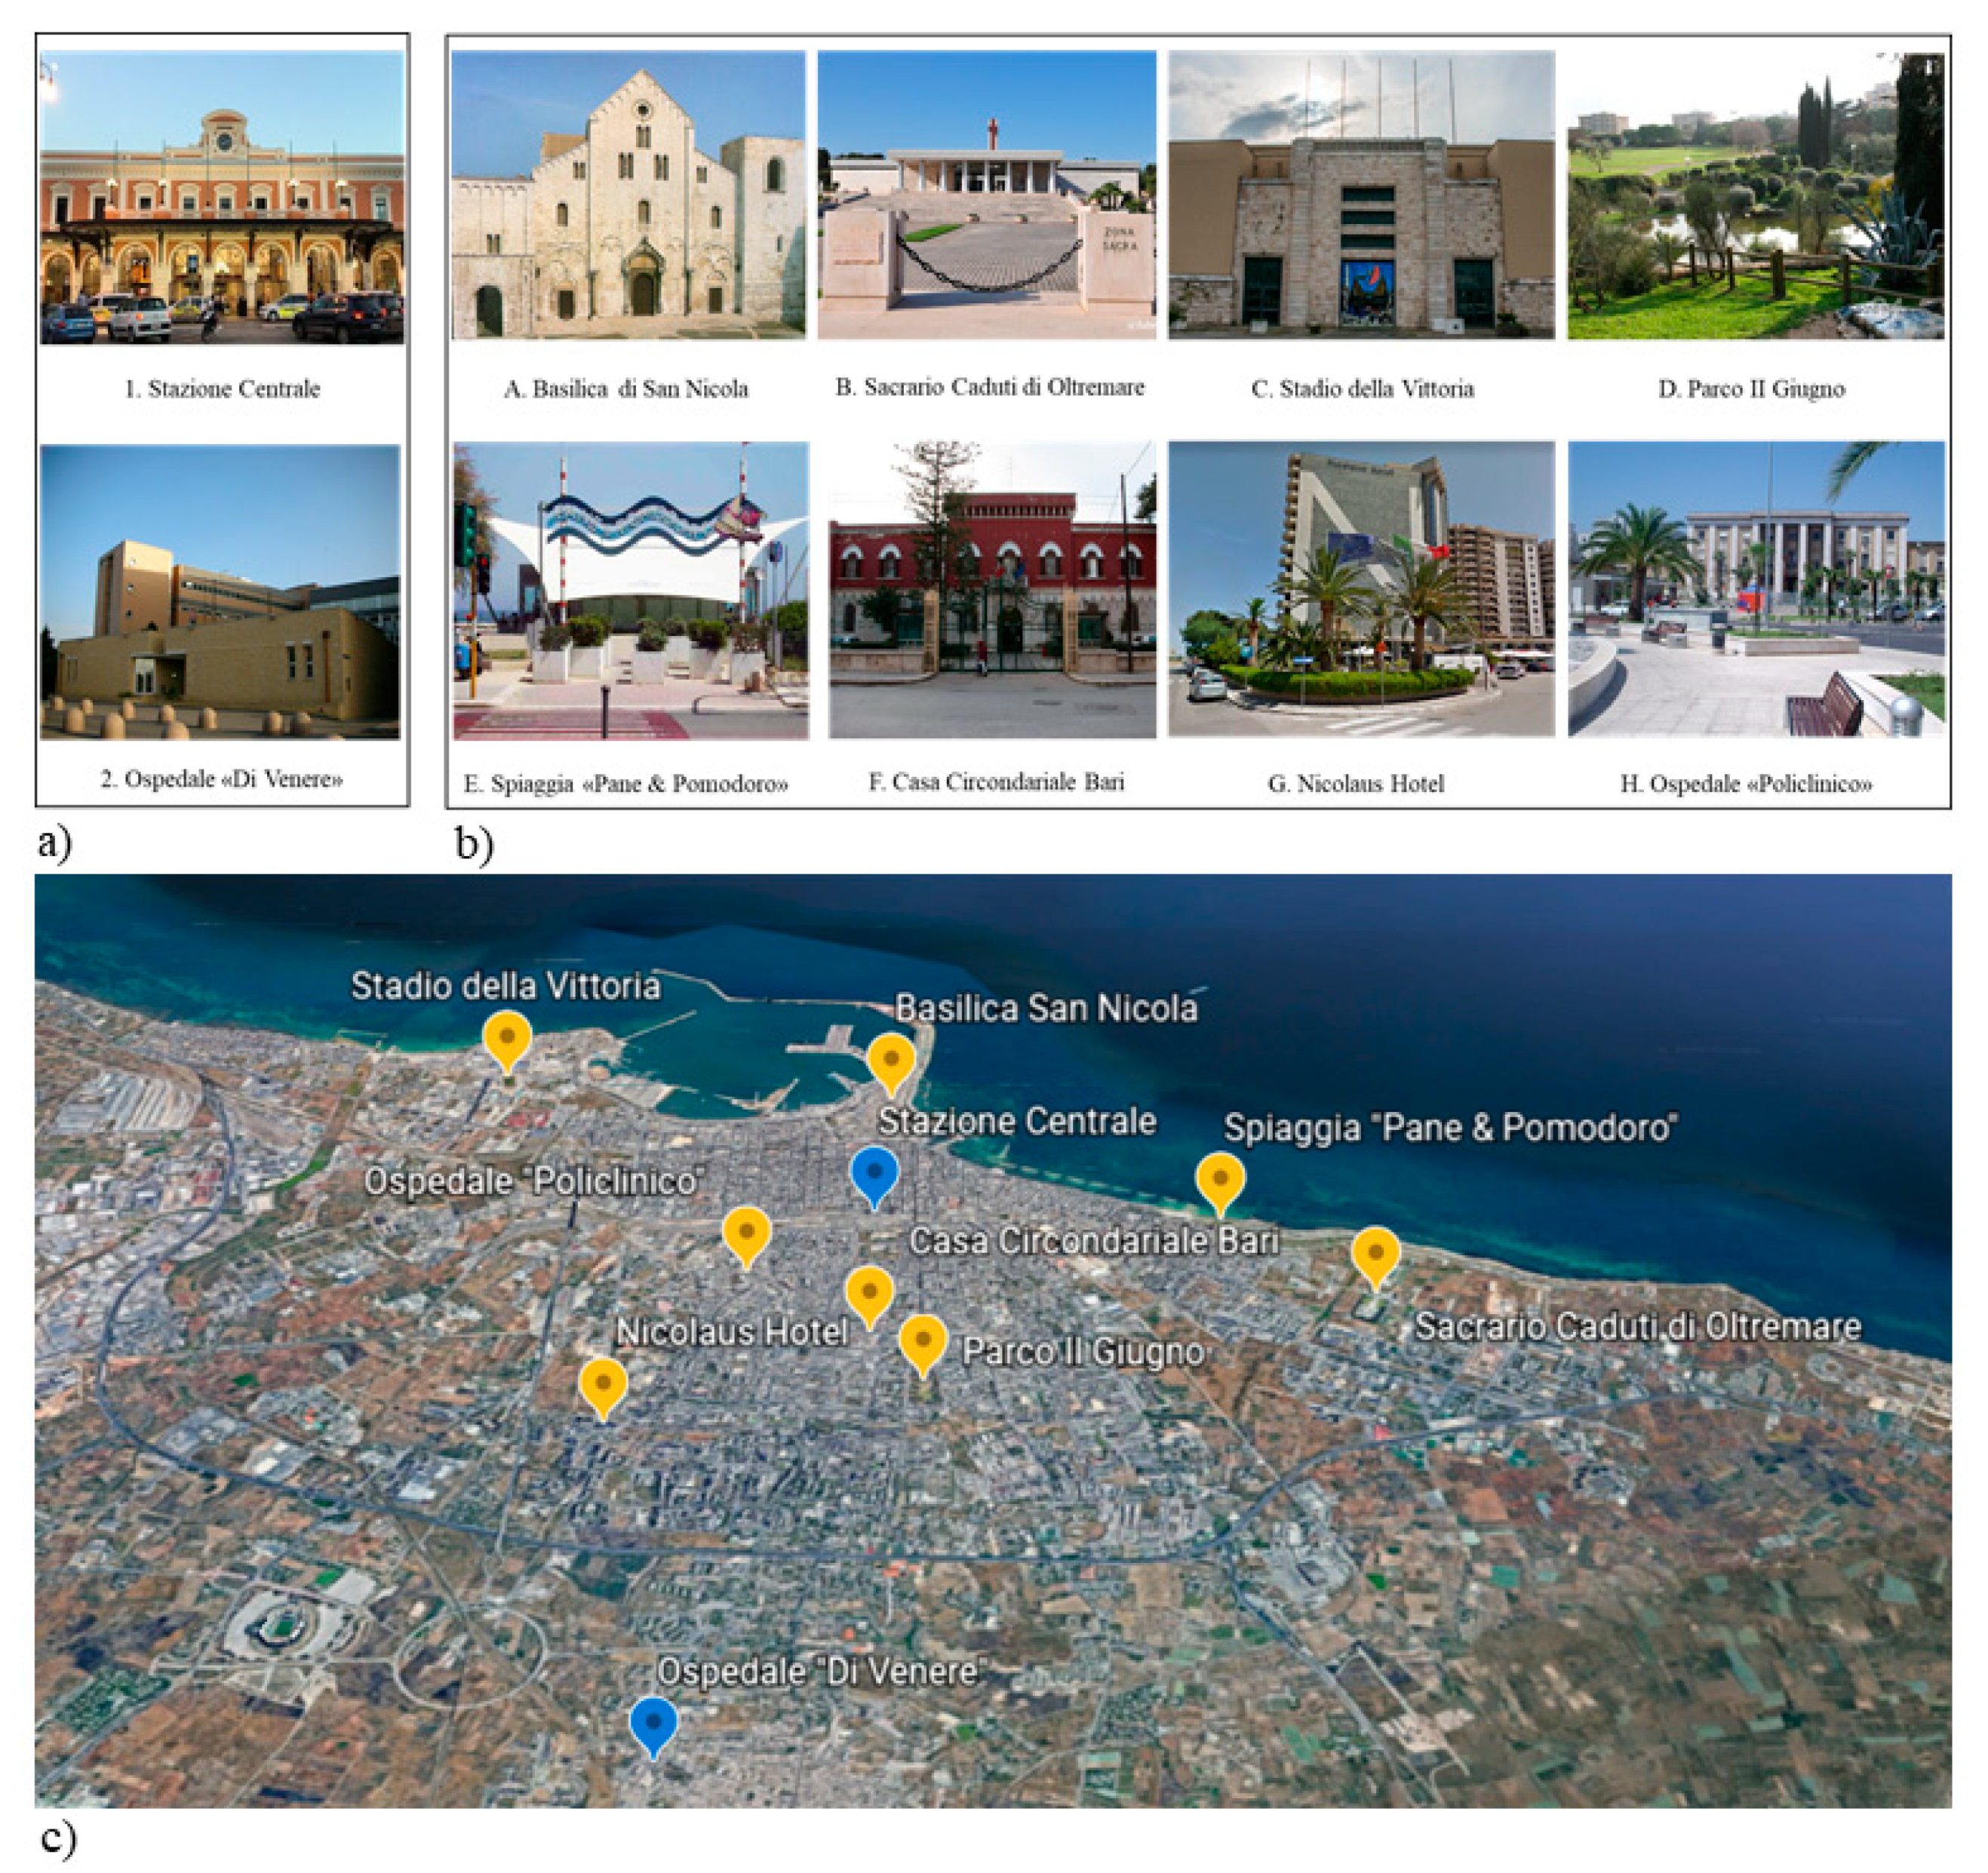
43]. The Landmark Positioning on a Map (LPM, [25]) is used to assess allocentric remote spatial memory, in which participants had to identify and pinpoint the correct position of eight well-known landmarks of their hometown on a blind map of the city, keeping in mind metric (i.e., relative distances) as well as categorical (“A is above/below and left/right of B”) spatial relationship between landmarks. LPM is intended to be age and education fair, as it did not favor young people compared with aged ones or healthy elderly with high and low level of education [44]. In the study, the group dependent contribution of a single item to the total score of the test is not known. There could be some items which elicit different performances favoring a specific group of participants, for example men over women or young over elderly people, other items which favor the other group, and still others which do not show any difference in functioning between groups.
In this view, the theoretical and practical relevance for using DIF analysis in the field of spatial cognition and in particular in spatial memory based on familiar topographical information is given by, for instance, the selection of items which can be representative and fair for many groups of people. Such selection could stimulate the construction of standardized tools, even within an ecological approach, to study spatial mental representations, where it could be difficult to control for previous learning processes, strength and accessibility of memory trace, and, as such for individual differences. DIF analysis allows to identify the differential functioning between groups. In this framework, it is then possible (a) to remove the unfair landmarks with respect to different groups or (b) to select landmarks which are appropriate for a specific group only. It is worthwhile to note that DIF analysis do not tell anything per se about the fairness or the biasedness of a test and, consequently, the eventual choice to exclude/substitute an item is demanded to the researcher.
The aim of the present study is twofold: (1) to investigate DIF on the landmarks of a test of familiar spatial mental representations in relation to age and gender groups, and (2) to investigate whether DIF is present specifically on categorical (i.e., positions) and coordinate (i.e., distances) scores.

2. Materials and Methods

2.1. Participants

A power analysis to estimate the required sample size was carried out using G*Power 3.1 [45]. The sample size was established by considering three aspects: a level of significance equal to 0.05; a power of 0.95; and an odd ratio of 1.5. As a result, a sample size of 417 participants was sufficient to warrant that the probability of correctly rejecting the H0 hypothesis was 95%, indicating that there is no relation between the main predictor and result variable.
Four hundred and twenty participants were recruited. Twenty elderly participants were excluded because their global cognitive functioning, assessed by the Montreal Cognitive Assessment [46,47], fell under the normality criterium (>17 points; [48]). At the end of the enrolment procedure, four hundred healthy participants (201 women) took part in the study. All participants were from the metropolitan area of Bari (Apulia, Italy). Two hundred and three young university students (i.e., age mean ± sd 23.61 ± 5.53; level of education mean ± sd 16.17 ± 1.61), and 197 elderly people (i.e., age mean ± sd 73.06 ± 6.80; level of education mean ± sd 11.47 ± 5.08) were enrolled in the study. Descriptive statistics for the two groups are reported in Table 1. All participants, blind to the hypothesis of the study, signed a consensus form. The local ethical committee (No. 3660-CEL03/17 November 2017) approved the study protocol, and the whole study was performed following the Helsinki Declaration and its later amendments.

2.2. Materials and Procedure

Hometown Task: Landmark Positioning on a Map

Participants were required to complete landmark positioning on a map task (LPM, [25], see Figure 1. Participants were first required to recognize 10 well-known landmarks in their hometown that were displayed in photographs (see Figure 2a,b). The given references for the hometown map were the marking for North, and two of the 10 landmarks, namely one in the centre of a semi-blind map and the other further outside the city on the map. The two landmarks served as positional and distance reference points which allowed participants to infer positions and distances of the other landmarks. The participant had to pinpoint all the other eight landmarks, keeping in mind the metric (i.e., relative distances) as well as categorical (relative positions) spatial relations between landmarks (see Figure 2c). The LPM task is known to be relatively unbiased with respect to age and education, and relatively sensitive in discriminating between different levels of cognitive functioning [44].
Participants were assessed individually in a well-lit, quiet room without disturbances. Each step in the testing procedure was made clear to the participants beforehand. Data were collected in one session ranging between 15–30 min. Breaks were allowed on request.

2.3. Scoring Method

Categorical and coordinate scores were computed. Categorical and coordinate spatial relations could be considered as latent variables. They can be operationalized according to two empirical measures, namely relative positions, and distances, respectively.
In order to evaluate the landmarks positions’ the following procedure was followed: the target area was divided into four quadrants, starting from the origin (Bari Central Railway Station, Landmark 1, in Figure 2), namely the point where a two-axes, east-west and north-south, intersect. For each correct position, participants were awarded of 1 point, conversely 0 was assigned for incorrect positions, regardless of the distance from the origin.
In order to evaluate distances, a circle, whose origin coincided with Bari Central Railway Station, was drawn with a radius equal to the median distance from the centre of the circle to each landmark. In this way, four far and four near landmarks were identified. Each positioning was awarded of 1 when the reference point was positioned at the correct distance from the origin, and of 0 vice versa, regardless of the position.

2.4. Statistical Analysis

The analyses focused on evaluating binary differential item functioning (DIF) of LPM Task across age group (young and elderly participants), and gender. DIF analysis seeks to find out if the young and the elderly, and men and women, were equally proficient, that is had an equal probability of positioning a given item (landmark) correctly. In this case two logistic regressions were used to detect both uniform and non-uniform DIF with two categorical variables: age and gender. Uniform DIF is a pattern of DIF where the degree of DIF is constant across the spectrum of ability being assessed by a test, whereas non-uniform DIF acts as a function of both the degree of ability and the grouping variable. Logistic regression is considered the most flexible method of detecting DIF (for more details, [49,50]). Age group and gender were considered as the grouping variables (G) with a binary classification 0/1 (young and elderly participants and women and men, respectively). The general categorical and coordinate scores were considered as the matching variables (θ, or latent ability variable). Using jamovi [51] as a statistic software, which facilitates the reporting of DIF analyses, DIF computation involved the estimation of three models and the comparison of these models’ fit. The first model is based on calculation of the main effect of the matching variable; the second one contains the main effect of the matching variable and the main effect of the grouping variable, and the third model contains also an interaction term between the matching and the grouping variable. A chi-square test with two degrees of freedom between these three models is performed to detect DIF, which is present if individuals matched on ability show significantly different probabilities of responding to an item, and thus differing logistic regression curves. On the contrary, DIF is not present if curves for both groups are the same, and then the item is considered as unbiased. Finally, there is evidence of uniform DIF if the intercepts and matching variable parameters for both groups are not equal, while there is evidence of nonuniform DIF if there is a nonzero interaction parameter [52]. If the change in model fit is not statistically significant, the item is not flagged as exhibiting DIF. Otherwise, if the change in model fit is significant, the item is flagged as exhibiting DIF. Uniform and non-uniform types of DIF were assessed for checking simultaneously for significant main and interaction effects. Wald and LTR (Likelihood Ratio Test)as Flagging Criteria (tests used for assessing statistical significance of regression coefficients) and Zumbo-Thomas (ZT) and Jodoin-Gierl (JG) as Evaluation Scale (classification scheme for DIF effect sizes on the Naeglekirke’s R2R2) scale) were calculated. Items flagged, as exhibiting DIF, were evaluated using the following effect sizes scale for ZT method: “‘A”: Negligible effect (0 ≤ ΔR2 ≤ 0.13),“B”: Moderate effect (0.13 ≤ ΔR2 ≤ 0.26), and “C”: Large effect (0.26 ≤ ΔR2 ≤ 1); for JG method: “A”: Negligible effect (0 ≤ ΔR2 ≤ 0.035), “B”: Moderate effect (0.035 ≤ ΔR2 ≤ 0.07), and “C”: Large effect (0.07 ≤ ΔR2 ≤ 1). JG method has a less conservative assessment criterion, compared to ZT method. To the study objectives, ZT effect sizes were reported and interpreted.
Items flagged should have p-values’ of the χ2 statistic associated with the standard 2-degrees of freedom for Likelihood Ratio/Wald test below the chosen threshold of 0.05. In the present research the item flagged were discussed, regardless small, moderate, or large effect size. The binary logistic regression coefficients and the associated odds were used to interpreted DIF, in terms of the increased likelihood of response between groups. The item response curves were plotted for any item being assessed for DIF. The curves provide a visual representation of the full model used in the DIF analysis. The different groups are colour coded, with 95% confidence intervals represented by gray shading overlaying each line. The Y-axis of the plot is the probability (from 0 to 1) of correct positioning (categorical component) and correct estimation of distance with respect to Bari Central Railway Station (coordinate component), and the X-axis is the range of the matching variable (i.e., the latent ability measure) used in the logistic models. Line graphs illustrate the trends of the probability of correct item positioning or distance estimation from Bari Central Railway Station, by the participants. If the lines are parallel to x-axis, no change in slope over the spectrum of θ (test taker proficiency) is exhibit, instead, if the lines are not parallel, crossing one another, the plot indicates that difficulty of the item changes as a function of both group membership and θ level (e.g., [53]).

3. Results

Descriptive statistics and preliminary analyses on categorical and coordinate scores are reported in Table 1.

3.1. Grouping Variable: Age

Considering categorical scores as matching variable, four items of the LPM task were flagged (see Table 2). according to the Zumbo and Thomas (ZT) scale. The flagged items showed a A-Level DIF, as shown in Table 3.
Each item is discussed in turn, reporting also the plots showing the item characteristic curves (see Figure 3).
Item#1: Basilica di San Nicola
The age DIF test is statistically significant χ2 (2) = 11.06, p = 0.004. The ΔR2 = 0.037 is a small effect by ZT criterion. Both the significance test and the effect size suggested age DIF. As emerged from Table 3 the young were approximately 1.4 times more likely to correctly place item#1 than the elderly. Figure 3 shows that the probability of the young to locate the item increased at higher item response scores more than that of the elderly, whose probability remains the same for low, medium and high scores. In other words, the item was not discriminated by the elderly regardless the level of ability.
Item#2: Casa Circondariale di Bari
The age DIF test is statistically significant χ2 (2) = 19.08, p < 0.001. The ΔR2 = 0.053 is a small effect by ZT criterion. Both the significance test and the effect size suggested age DIF. As emerged from Table 3 the young were uniformly 1.2 times more likely to correctly place item#2 than the elderly.
Item#4: Spiaggia “Pane & Pomodoro”
The age DIF test was statistically significant χ2 (2) = 11.48, p = 0.003. The ΔR2 = 0.041 is a small effect by ZT criterion. Both the significance test and the effect size suggest age DIF. As emerged from Table 3 the elderly were approximately 1.8 times more likely to correctly place item#4 than the young. Figure 3 shows that the probability of correctly positioning the item was greater for the elderly at low levels of ability, while it was greater for young people at high levels of ability.
Item#5: Parco II Giugno
The age DIF test is statistically significant χ2 (2) = 9.30, p = 0.010. The ΔR2 = 0.016 is a small effect by ZT criterion. Both the significance test and the effect size suggested age DIF. As emerged from Table 3 the elderly were approximately 1.4 times more likely to correctly place item#5 than the young. Figure 3 shows that at low levels of ability, the probability of correctly positioning the item was slightly lower for the elderly, while at high levels of ability the probability became lower for the young. Taking into account coordinate scores as matching variable, one item of LPM task (Item#4: Spiaggia “Pane & Pomodoro”) was flagged, and it exhibited A-Level DIF according to ZT scale. The results are summarized in Table 2. Item#4 is discussed below. The item characteristic curve was reported in Figure 3.
Item#4: Spiaggia “Pane & Pomodoro”
As shown in Table 4, the age DIF test is statistically significant χ2 (2) = 13.53, p = 0.001, ΔR2 = 0.067. Both the significance test and the effect size suggest age DIF. The young were approximately 1.5 times more likely to make a correct estimation of distance than the elderly. Figure 3 shows that young people had a higher probability to give a correct answer at high levels of ability. Conversely, at low levels of ability the probability became higher for the elderly. Item#4 seemed to cause confusion: the gray shading overlaying each line was very wide (high variability in the first part of the curve), showing that the item had not a reliable score.

3.2. Grouping Variable: Gender

Considering categorical scores as matching variable, only the item Parco II Giugno was flagged and exhibited A-Level DIF according to ZT scale. The results are summarized in Table 5. Each item is discussed in turn, reporting also the plots showing the item characteristic curves (see Figure 4).
Item#5: Parco II Giugno
As emerged from Table 6, the gender DIF test is statistically significant χ2 (2) = 6.86, p = 0.032, ΔR2 = 0.013. Both the significance test and the effect size indicate gender DIF. Men were approximately 1.8 times more likely to place item#5 than women. Figure 4 shows that at low levels of ability, the probability of correctly positioning the item was slightly lower for men, while for high levels of ability the probability became lower for women.
Considering coordinate scores as matching variable, two items were flagged. As shown in Table 7, Basilica di San Nicola (Item#1) and Stadio della Vittoria (Item#8) exhibited A-Level DIF according to ZT scale.
Item#1: Basilica di San Nicola
The gender DIF test is statistically significant χ2 (2) = 6.04, p = 0.049. The ΔR2 = 0.015 is a small effect by ZT criterion. Both the significance test and the effect size suggested gender DIF. As emerged from Table 7 women were approximately 1.7 times more likely to make a correct estimation of distance than men. Figure 4 shows that at low levels of ability, the probability of give the correct response was slightly higher for men, while at high levels of ability women had a significantly higher probability than men to correctly estimate distance. It is evident that the interaction is confined in the initial part of the distribution, showing preponderant uniform effect of the grouping variable, for the benefit of women.
Item#8: Stadio della Vittoria
The gender DIF test is statistically significant χ2 (2) = 9.87, p = 0.007. The ΔR2 = 0.070 is a small effect by ZT criterion. Both the significance test and the effect size suggest gender DIF. Ceiling effects emerged from Figure 4: the probability to correctly estimate distance was substantially equivalent between men and women, with an overall benefit for women (Uniform type of DIF).

4. Discussion

Item analysis examines participant responses to individual test items (questions, trials, stimuli) to assess the effectiveness and reliability of those items and, in turns, of the test as a whole. Item analysis is especially valuable in improving items which will be used again in later assessment procedures, and it can also be employed to support the researcher decision in eliminating or substituting ambiguous or misleading items. The use of binary differential item functioning (DIF) gave the opportunity to arrange a study on individual differences, consisting of a detailed item characteristic analysis. Usually, in spatial cognition, researchers investigate internal consistency, reliability and construct validity of the tests, or individual differences on the complete scales, eluding the study of item characteristics. Instead, DIF analysis paves the way to two opposite aims: a) to identify differential item functioning to make the scale unbiased with respect to the intended variable, possibly replacing items, freeing the test from probable biases; and b) to identify differential item functioning to better discriminate between certain characteristics, such as, age, gender or, even better, between different cognitive styles (e.g., [54]).
For the first time, in the present study, binary differential item functioning (DIF) was applied to a spatial mental representation task, based on the schematic sketch map of the participants. LPM task is a hometown map completion test used to assess allocentric topographical disorientation, and to discriminate, in particular, typical from atypical aging [25,41,44]. The aim of the present study was to examine individual differences (age and gender-related) and to speculate why some items showed a spread between age or gender groups. We explored age and gender DIF, across young and elderly participants, and men and women, measuring the accuracy in placing each landmark of LPM task, in terms of both categorical and coordinate spatial relations. The interest of research in deepening the differences in the encoding of categorical and coordinate spatial relations has important practical implications for the assessment of topographical orientation along life span (e.g., [42,55]). From preliminary analysis, on the overall categorical score, age and gender differences did not emerge, while on the overall coordinate score age differences occurred, in favor of the young. Notwithstanding these global results, the expected direction of effects, on each item, were not present. It is evident that DIF analysis is useful for tasks or tests that show clear grouping effects, but even when grouping effect are not present, there is no guarantee that the items behave in a completely fair way, hiding unexpected effects, actually. Age and gender item-related differences were discussed below into details.

4.1. Age Related Differences

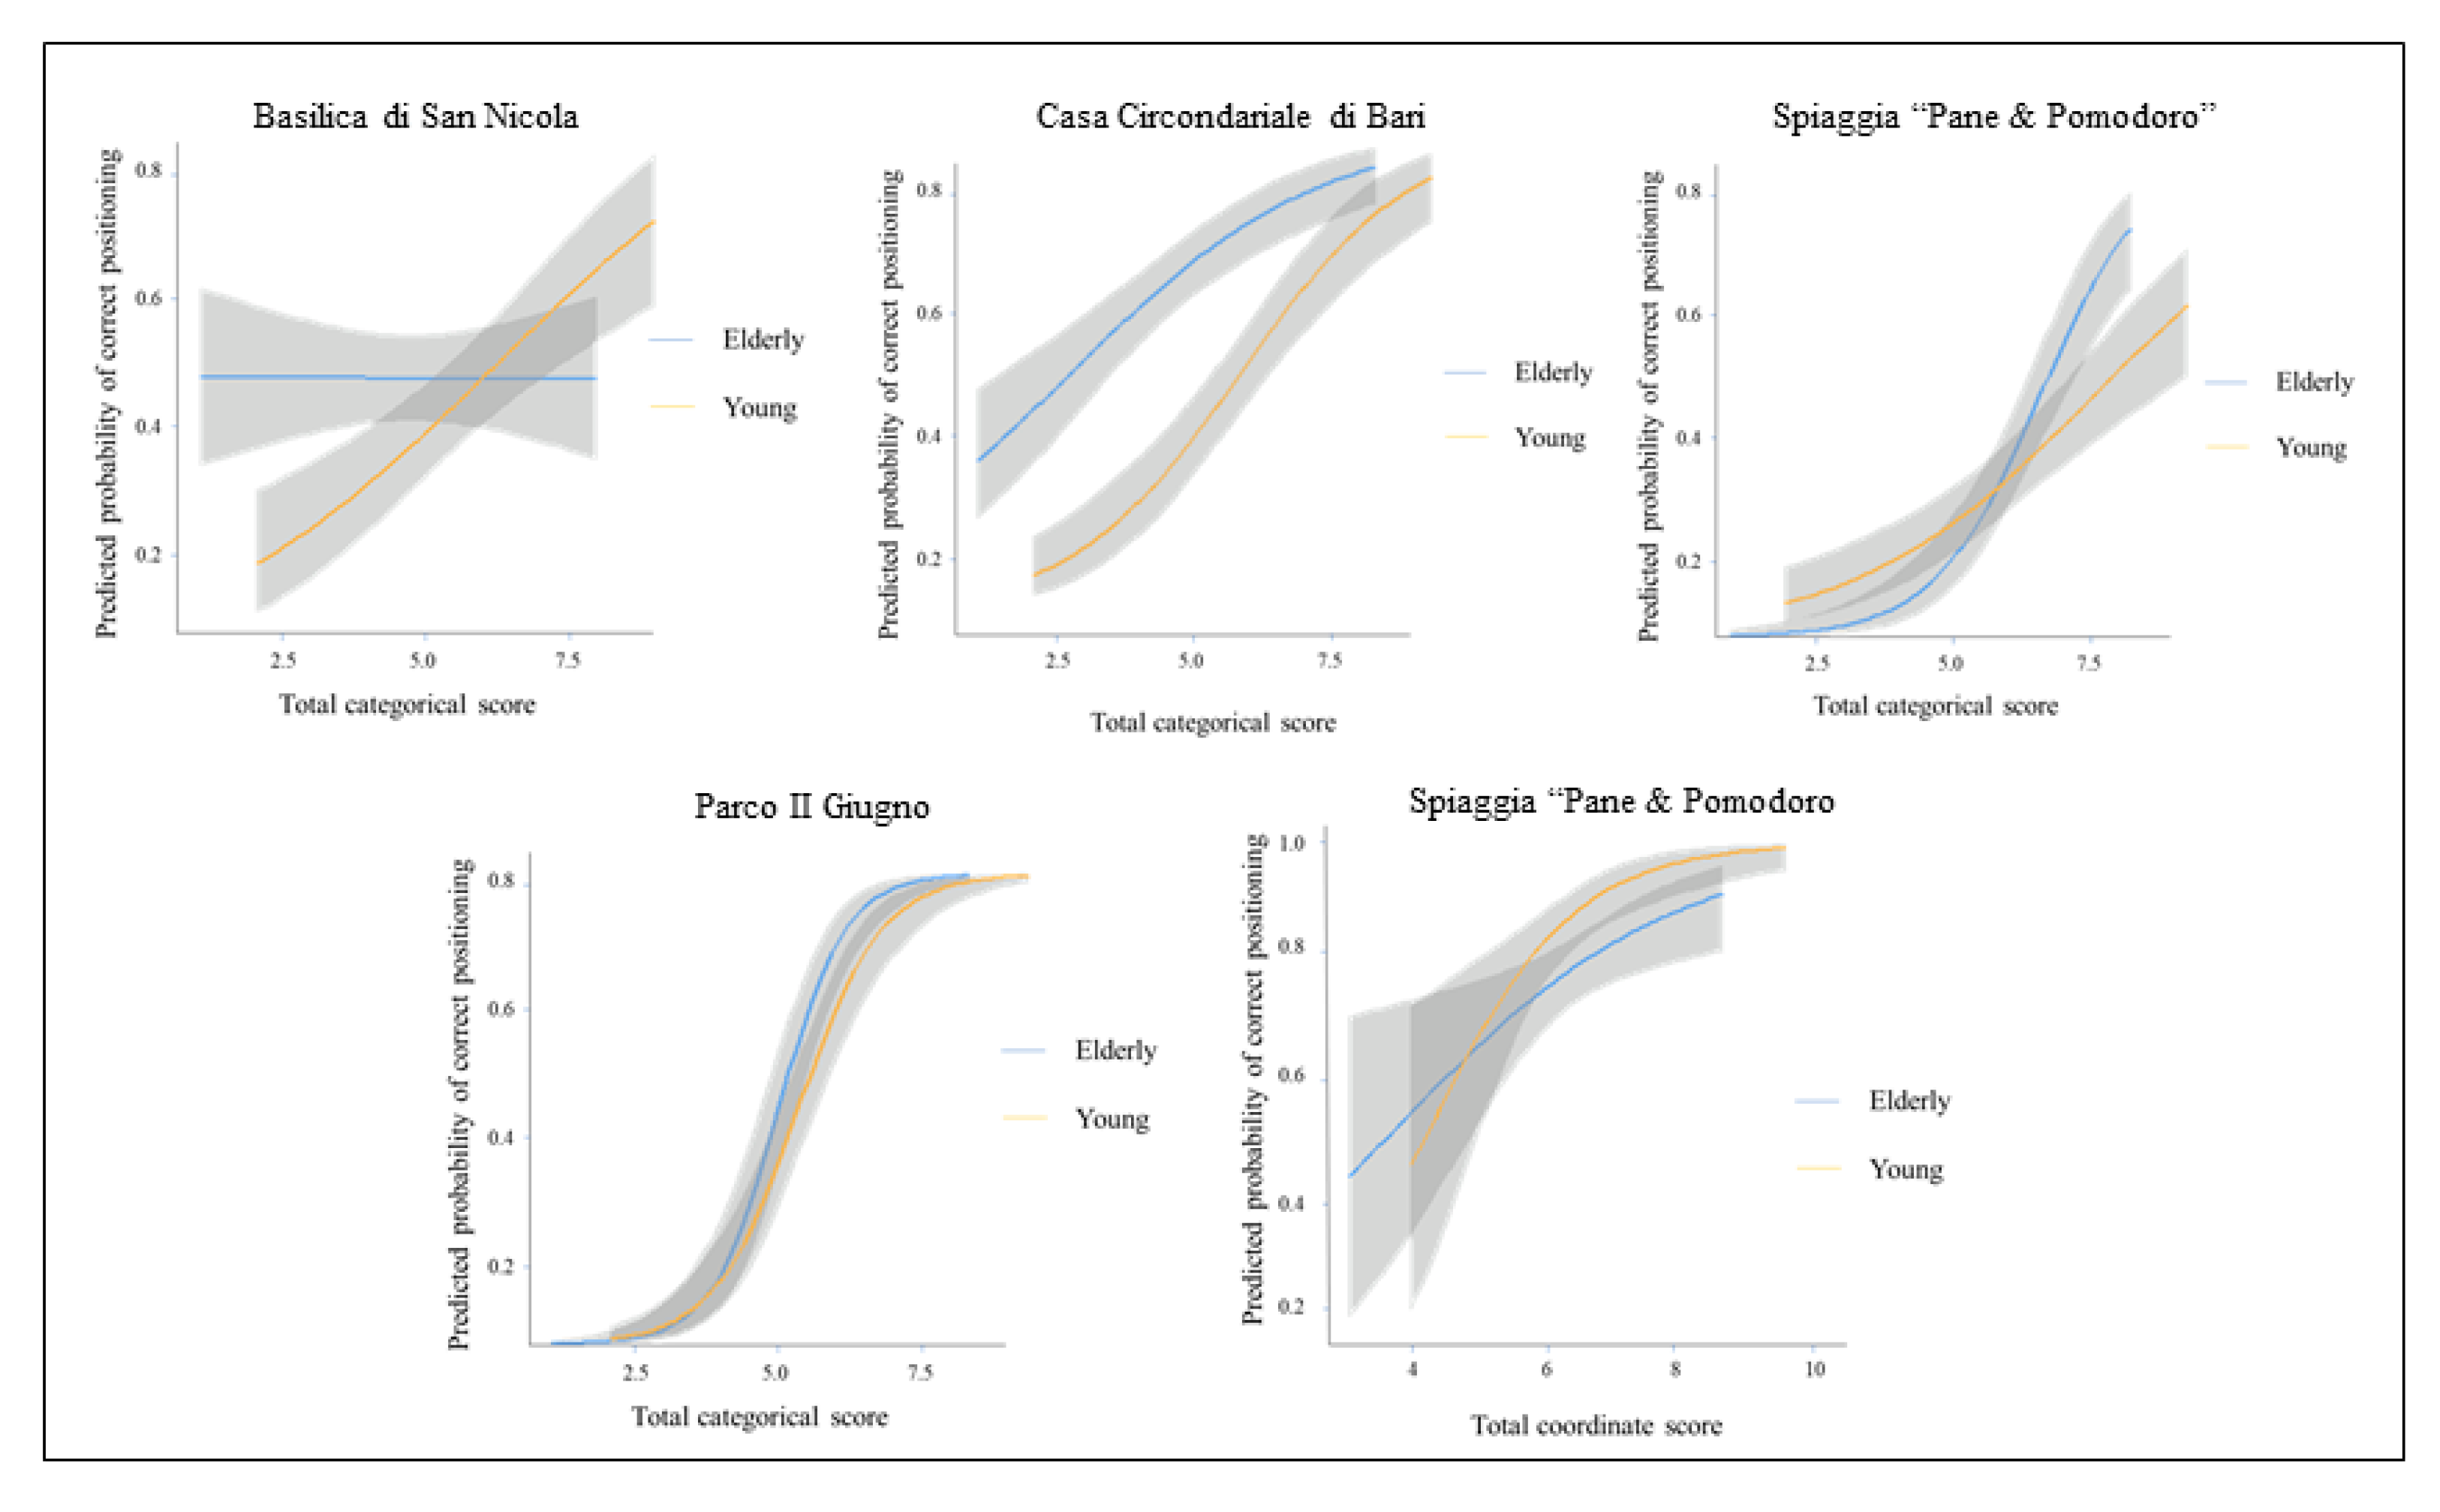
The first research question concerns age-related differences in categorical and coordinate spatial relations. With respect to the categorical component, four items showed age differences. Item#1 and Item#2 showed a clear disadvantage for elderly participants. This evidence can be explained by the difficulty of the landmark placement process. The items are almost perfectly aligned to the fixed reference point, on the North–South axis. This result is compatible with previous findings of Costa and Bonetti [56] and Lopez and colleagues [44] using the Map of Italy and also with Dror and Kosslyn [57], Saimpont [58] and De Beni [59], with regard to the differential access to mental spatial representations of landmark placed in front or behind the intended place of observation (i.e., aligned and counter-aligned landmarks). On the other hand, the elderly showed a slight advantage, with respect to the young, in placing Item#4 and Item#5. It is likely that this advantage is attributable to their non-spatial features. They are visually prominent, structurally significant, and salient [60,61]. They are characterized by a certain shape (they are extended in the space), visible from the pathway, with a leisure meaning (a beach with a seaside pathway and the city largest urban park, respectively), fundamental qualities contributing to their strong place identity [62]. They can be qualified as visually, semantically, and structurally attractive [63] and they are frequented by the elderly as meeting and socialization places. These characteristics improve their memorability [64], and attenuate age-related memory deficits [65].
Only the Item#4 showed age differences in distance estimation from the reference point, in favour of the young. This landmark is particularly close to the circumference of the circle used as reference to score the participants’ performance.. Overall, elderly people seemed to suffer from the complexity of the task. Landmarks characterized by a hard discrimination, due to their alignment with the reference point or to the proximity to the circumference adopted as reference for distance calculation, contribute to the disadvantage for the elderly in particular in distance estimation (e.g., [66,67]).

4.2. Gender Related Differences

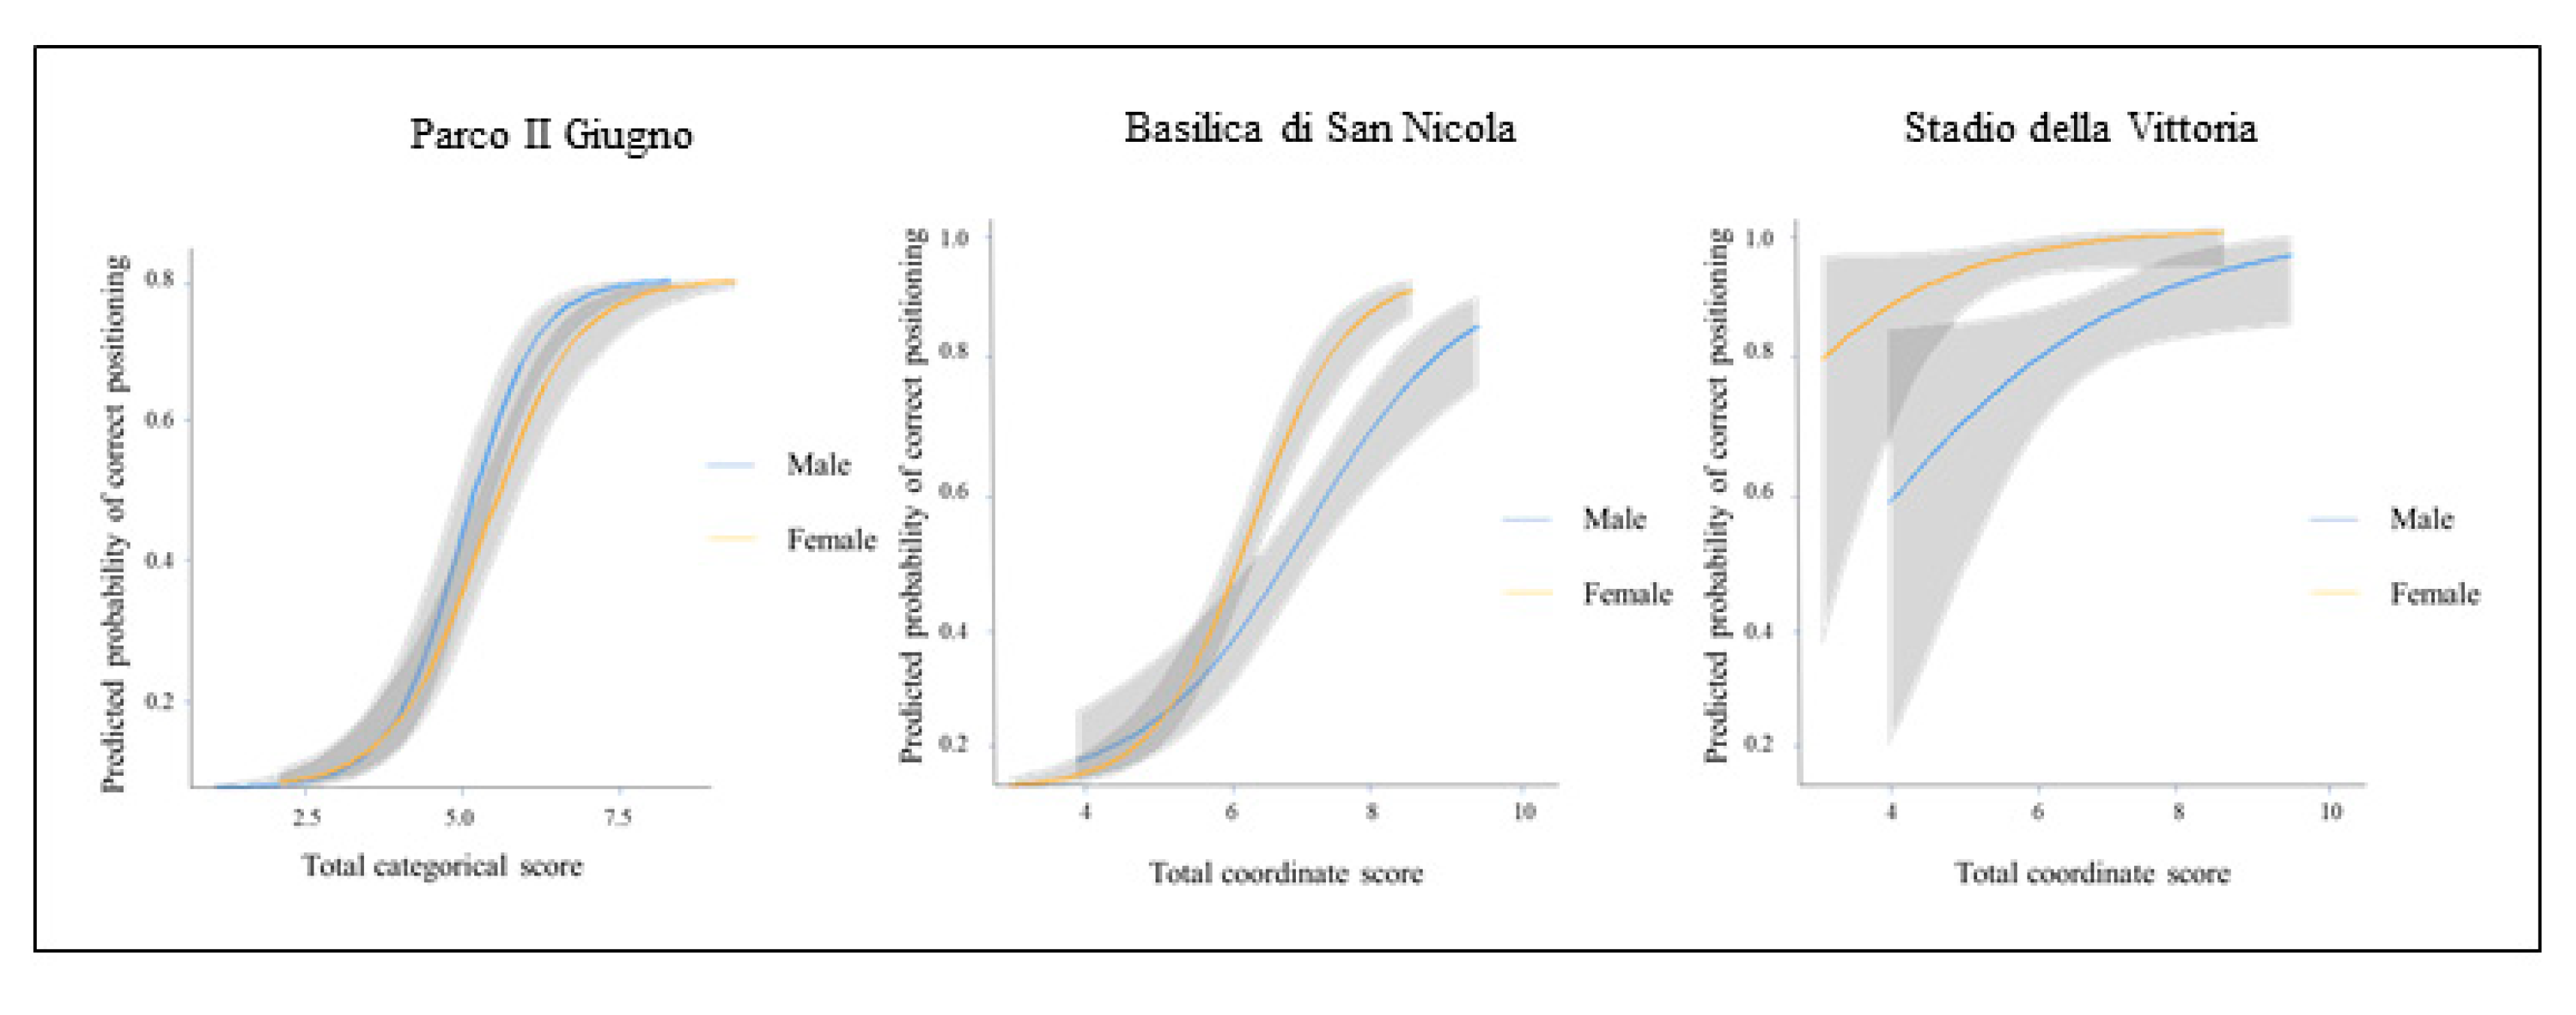
Regarding categorical scores, men seemed to have a higher probability to correctly place the Item#5 compared to the women. The park is used for street sport purposes from male population (basket and soccer for the youngest, and bowl games for the elderly). On the other hand, women seemed to be more accurate in the estimation of distances regarding Item#1 and Item#8. Concerning Item#1, it is known that there is a gender gap in attendance at places of worship [68]. Moreover, Italian women report higher rates of weekly church attendance than men [69]. Item#8 is the old stadium of the city of Bari withdrawn in 1990. Currently, it hosts children’s theatre, and it is near to a pool center frequented predominantly by women (i.e., for the availability of aqua fitness and prenatal and childbirth classes). Moreover, the parental role with children, in holding daily activities including sports or culture, is carried out mainly by women (e.g., [70]). Hence, it is more likely that women frequented those places more than men.
This study has a potential limitations: the DIF effects, according to Zumbo-Thomas scale, can be considered small, nonetheless it can be considered significant and potentially informative regarding the contribution of each item to the differences between levels of grouping variables.

5. Conclusions

The investigation of differential item functioning (DIF) is a key methodology to show measurement similarities across different groups with respect to a certain feature [32]. Concerning the study of individual differences in spatial cognition, differences may arise in behavior, cognitive style, cognition, personality, attitudes, and demographic characteristics e.g., [11,31,71,72]. So, the use of DIF could make a substantial contribution to ensure a valid interpretation of group differences in those variables that affect spatial cognition.
Moreover, the relapses from the clinical and applicative point of view (i.e., driving assessment, personality evaluation) should be taken into consideration. A statistically significant DIF could give the clinician the opportunity to establish if an item could be considered clinically meaningful, and to be used for diagnostic purposes, and in all those assessment and evaluation contexts that lead to important decisions for the individuals, for instance the forensic context such as the assignment or the renewal of the firearms license, the fitness to drive, and the evaluation of parenting competences [73,74,75,76,77].

Author Contributions

Conceptualization, A.L. and A.B.; methodology, A.L. and A.B.; software, A.L., A.B. and A.O.C.; validation, A.L., A.B. and A.O.C.; formal analysis, A.L.; investigation, A.L., A.B. and A.O.C.; resources A.B. and A.P.; data curation, A.L. and A.O.C; writing—original draft preparation, A.L. and A.O.C; writing—review and editing, A.L., A.B., A.O.C., L.T., A.P.; visualization, A.L.; supervision, A.B. and A.P.; project administration, A.B. and A.P; funding acquisition, A.B. and A.P. All authors have read and agreed to the published version of the manuscript.

Funding

The present article was supported by the Project “Apulia Smart Drivers”, granted by the Apulia Region (Grant No. B34I19000180002).

Acknowledgments

Thanks to study participants and students of the Department of Educational Sciences, Psychology and Communication, University of Studies of Bari “Aldo Moro”.

Conflicts of Interest

The authors have no conflicts of interest to declare.

References

  1. O’Gorman, R. Sex differences in spatial abilities: An evolutionary explanation. Ir. J. Psychol. 1999, 20, 95–106. [Google Scholar] [CrossRef]
  2. Reilly, D.; Neumann, D.L. Gender-role differences in spatial ability: A meta-analytic review. Sex. Roles 2013, 68, 521–535. [Google Scholar] [CrossRef] [Green Version]
  3. Bocchi, A.; Palermo, L.; Boccia, M.; Palmiero, M.; D’Amico, S.; Piccardi, L. Object recognition and location: Which component of object location memory for landmarks is affected by gender? Evidence from four to ten year-old children. Appl. Neuropsychol. Child 2020, 9, 31–40. [Google Scholar] [CrossRef] [PubMed]
  4. Wang, L.; Carr, M. Working memory and strategy use contribute to gender differences in spatial ability. Educ. Psychol. 2014, 49, 261–282. [Google Scholar] [CrossRef]
  5. Yuan, L.; Kong, F.; Luo, Y.; Zeng, S.; Lan, J.; You, X. Gender differences in large-scale and small-scale spatial ability: A systematic review based on behavioral and neuroimaging research. Front. Behav. Neurosci. 2019, 13, 128. [Google Scholar] [CrossRef] [PubMed] [Green Version]
  6. Spence, I.; Feng, J. Video games and spatial cognition. Rev. Gen. Psychol. 2010, 14, 92–104. [Google Scholar] [CrossRef] [Green Version]
  7. Voyer, D. Time limits and gender differences on paper-and-pencil tests of mental rotation: A meta-analysis. Psychon. Bull. Rev. 2011, 18, 267–277. [Google Scholar] [CrossRef] [Green Version]
  8. Hirnstein, M.; Hugdahl, K.; Hausmann, M. Cognitive sex differences and hemispheric asymmetry: A critical review of 40 years of research. Laterality Asymmetries Body Brain Cogn. 2019, 24, 204–252. [Google Scholar] [CrossRef]
  9. Coluccia, E.; Louse, G. Gender differences in spatial orientation: A review. J. Environ. Psychol. 2004, 24, 329–340. [Google Scholar] [CrossRef]
  10. Shansky, R.M. Sex differences in behavioral strategies: Avoiding interpretational pitfalls. Curr. Opin. Neurobiol. 2018, 49, 95–98. [Google Scholar] [CrossRef]
  11. Voyer, D.; Postma, A.; Brake, B.; Imperato-McGinley, J. Gender differences in object location memory: A meta-analysis. Psychon Bull. Rev. 2007, 14, 23–38. [Google Scholar] [CrossRef] [PubMed] [Green Version]
  12. Li, R. Why women see differently from the way men see? A review of sex differences in cognition and sports. J. Sport Health Sci. 2014, 3, 155–162. [Google Scholar] [CrossRef] [PubMed] [Green Version]
  13. Jager, G.; Postma, A. On the hemispheric specialization for categorical and coordinate spatial relations: A review of the current evidence. Neuropsychologia 2003, 41, 504–515. [Google Scholar] [CrossRef]
  14. Joseph, R. The evolution of sex differences in language, sexuality, and visual-spatial skills. Arch. Sex. Behav. 2000, 29, 35–66. [Google Scholar] [CrossRef] [PubMed]
  15. Vogel, S.A. Gender differences in intelligence, language, visual-motor abilities, and academic achievement in students with learning disabilities: A review of the literature. J. Learn. Disabil. 1990, 23, 44–52. [Google Scholar] [CrossRef]
  16. Lauer, J.E.; Yhang, E.; Lourenco, S.F. The development of gender differences in spatial reasoning: A meta-analytic review. Psychol. Bull. 2019, 145, 537–565. [Google Scholar] [CrossRef]
  17. Moffat, S.D. Aging and spatial navigation: What do we know and where do we go? Neuropsychol. Rev. 2009, 19, 478–489. [Google Scholar] [CrossRef]
  18. Klencklen, G.; Després, O.; Dufour, A. What do we know about aging and spatial cognition? Reviews and perspectives. Ageing Res. Rev. 2012, 11, 123–135. [Google Scholar] [CrossRef]
  19. Beaudet, G.; Bouet, V.; Jozet-Alves, C.; Schumann-Bard, P.; Dauphin, F.; Paizanis, E.; Freret, T. Spatial memory deficit across aging: Current insights of the role of 5-HT7 receptors. Front. Behav. Neurosci. 2015, 8, 448. [Google Scholar] [CrossRef] [Green Version]
  20. Li, A.W.Y.; King, J. Spatial memory and navigation in ageing: A systematic review of MRI and fMRI studies in healthy participants. Neurosci. Biobehav. Rev. 2019, 103, 33–49. [Google Scholar] [CrossRef]
  21. Lithfous, S.; Dufour, A.; Després, O. Spatial navigation in normal aging and the prodromal stage of alzheimer’s disease: Insights from imaging and behavioral studies. Ageing Res. Rev. 2013, 12, 201–213. [Google Scholar] [CrossRef]
  22. Colombo, D.; Serino, S.; Tuena, C.; Pedroli, E.; Dakanalis, A.; Cipresso, P.; Riva, G. Egocentric and allocentric spatial reference frames in aging: A systematic review. Neurosci. Biobehav. Rev. 2017, 80, 605–621. [Google Scholar] [CrossRef] [PubMed]
  23. Cogné, M.; Taillade, M.; N’Kaoua, B.; Tarruella, A.; Klinger, E.; Larrue, F.; Sorita, E. The contribution of virtual reality to the diagnosis of spatial navigation disorders and to the study of the role of navigational aids: A systematic literature review. Ann. Phys. Rehabil. Med. 2017, 60, 164–176. [Google Scholar] [CrossRef] [PubMed]
  24. Zarantonello, L.; Schiff, S.; Amodio, P.; Bisiacchi, P. The effect of age, educational level, gender and cognitive reserve on visuospatial working memory performance across adult life span. Aging Neuropsychol. Cogn. 2020, 27, 302–319. [Google Scholar] [CrossRef]
  25. Lopez, A.; Caffò, A.O.; Bosco, A. Topographical disorientation in aging. Familiarity with the environment does matter. Neurol. Sci. 2018, 39, 1519–1528. [Google Scholar] [CrossRef]
  26. Reynolds, C.A.; Finkel, D. A meta-analysis of heritability of cognitive aging: Minding the “missing heritability” gap. Neuropsychol. Rev. 2015, 25, 97–112. [Google Scholar] [CrossRef] [Green Version]
  27. Kutner, M.H.; Nachtsheim, C.J.; Neter, J.; Li, W. Applied Linear Statistical Models; McGraw-Hill Irwin: New York, NY, USA, 2005. [Google Scholar]
  28. McCulloch, C.E.; Searle, S.R.; Neuhaus, J.M. Generalized, Linear, and Mixed Models; Wiley QA: Hoboken, NJ, USA, 2008. [Google Scholar]
  29. Smith, L.L. On the usefulness of item bias analysis to personality psychology. Pers. Soc. Psychol Bull. 2002, 28, 754–763. [Google Scholar] [CrossRef]
  30. Baranik, L.E.; Meade, A.W.; Lakey, C.E.; Lance, C.E.; Hu, C.; Hua, W.; Michalos, A. Examining the differential item functioning of the rosenberg self-esteem scale across eight countries. J. Appl. Soc. Psychol. 2008, 38, 1867–1904. [Google Scholar] [CrossRef]
  31. Church, A.T.; Alvarez, J.M.; Mai, N.T.Q.; French, B.F.; Katigbak, M.S.; Ortiz, F.A. Are cross-cultural comparisons of personality profiles meaningful? Differential item and facet functioning in the revised NEO personality inventory. J. Pers Soc. Psychol. 2011, 101, 1068–1089. [Google Scholar] [CrossRef]
  32. Reise, S.P.; Waller, N.G. Item response theory and clinical measurement. Annu. Rev. Clin. Psychol. 2009, 5, 27–48. [Google Scholar] [CrossRef] [Green Version]
  33. Paulsen, J.; Svetina, D.; Feng, Y.; Valdivia, M. Examining the impact of differential item functioning on classification accuracy in cognitive diagnostic models. Appl. Psychol. Meas. 2020, 44, 267–281. [Google Scholar] [CrossRef] [PubMed]
  34. Teresi, J.A.; Kleinman, M.; Ocepek-Welikson, K. Modern psychometric methods for detection of differential item functioning: Application to cognitive assessment measures. Stat. Med. 2000, 19, 1651–1683. [Google Scholar] [CrossRef]
  35. Crane, P.K.; van Belle, G.; Larson, E.B. Test bias in a cognitive test: Differential item functioning in the CASI. Stat. Med. 2004, 23, 241–256. [Google Scholar] [CrossRef] [PubMed]
  36. Tesio, L. Measuring behaviours and perceptions: Rasch analysis as a tool for rehabilitation research. J. Rehabil. Med. 2003, 35, 105–115. [Google Scholar] [CrossRef] [Green Version]
  37. Crane, P.K.; Gibbons, L.E.; Jolley, L.; van Belle, G. Differential item functioning analysis with ordinal logistic regression techniques: DIF detect and dif with par. Med. Care. 2006, 44, S115–S123. [Google Scholar] [CrossRef]
  38. Freitas, S.; Prieto, G.; Simões, M.R.; Santana, I. Scaling cognitive domains of the montreal cognitive assessment: An analysis using the partial credit model. Arch. Clin. Neuropsychol. 2015, 30, 435–447. [Google Scholar] [CrossRef] [Green Version]
  39. Thomas, M.L.; Brown, G.G.; Gur, R.C.; Moore, T.M.; Patt, V.M.; Risbrough, V.B.; Baker, D.G. A signal detection–item response theory model for evaluating neuropsychological measures. J. Clin. Exp. Neuropsyc. 2018, 40, 745–760. [Google Scholar] [CrossRef]
  40. Choo, S.; Park, S.; Nelson, N.J. Evaluating spatial thinking ability using item response theory: Differential item functioning across math learning disabilities and geometry instructions. Learn. Disabil. Q. 2020. [Google Scholar] [CrossRef]
  41. Lopez, A.; Caffò, A.O.; Spano, G.; Bosco, A. The effect of aging on memory for recent and remote egocentric and allocentric information. Exp. Aging Res. 2019, 45, 57–73. [Google Scholar] [CrossRef]
  42. Lopez, A.; Caffò, A.O.; Postma, A.; Bosco, A. How to separate coordinate and categorical spatial relation components in integrated spatial representations: A new methodology for analysing sketch maps. Scand. J. Psychol. 2020, 61, 607–615. [Google Scholar] [CrossRef]
  43. Caffò, A.O.; Lopez, A.; Spano, G.; Stasolla, F.; Serino, S.; Cipresso, P.; Bosco, A. The differential effect of normal and pathological aging on egocentric and allocentric spatial memory in navigational and reaching space. Neurol. Sci. 2020, 4, 1741–1749. [Google Scholar] [CrossRef] [PubMed]
  44. Lopez, A.; Caffò, A.O.; Bosco, A. Memory for familiar locations: The impact of age, education and cognitive efficiency on two neuropsychological allocentric tasks. Assessment 2019. [Google Scholar] [CrossRef] [PubMed]
  45. Faul, F.; Erdfelder, E.; Buchner, A.; Lang, A.G. Statistical power analyses using G* power 3.1: Tests for correlation and regression analyses. Behav. Res. Methods 2009, 41, 1149–1160. [Google Scholar] [CrossRef] [Green Version]
  46. Nasreddine, Z.S.; Phillips, N.A.; Bédirian, V.; Charbonneau, S.; Whitehead, V.; Collin, I.; Chertkow, H. The Montreal cognitive assessment, MoCA: A brief screening tool for mild cognitive impairment. J. Am. Geriatr. Soc. 2005, 53, 695–699. [Google Scholar] [CrossRef]
  47. Bosco, A.; Caffò, A.O.; Spano, G.; Lopez, A. Beyond the cutoffs: A Bayesian approach to the use of the Montreal cognitive assessment as a screening tool for mild cognitive impairment and dementia. In Diagnosis and Management in Dementia; Academic Press: Cambridge, MA, USA, 2020; pp. 395–410. [Google Scholar]
  48. Bosco, A.; Spano, G.; Caffò, A.O.; Lopez, A.; Grattagliano, I.; Saracino, G.; Lancioni, G.E. Italians do it worse. Montreal cognitive assessment (MoCA) optimal cut-off scores for people with probable Alzheimer’s disease and with probable cognitive impairment. Aging Clin. Exp. Res 2017, 26, 1113–1120. [Google Scholar] [CrossRef]
  49. Moses, T.; Miao, J.; Dorans, N.J. A comparison of strategies for estimating conditional DIF. J. Educ. Behav. Stat. 2010, 35, 726–743. [Google Scholar] [CrossRef]
  50. Magis, D.; Béland, S.; Tuerlinckx, F.; De Boeck, P. A general framework and an R package for the detection of dichotomous differential item functioning. Behav. Res. Methods. 2010, 42, 847–862. [Google Scholar] [CrossRef] [Green Version]
  51. The Jamovi Project. Jamovi (Version 1.2) [Computer Software]. 2020. Available online: https://www.jamovi.org (accessed on 15 October 2020).
  52. Hancock, G.R.; Mueller, R.O.; Stapleton, L.M. Survival analysis. In The Reviewers Guide to Quantitative Methods in the Social Sciences; Routledge: England, UK, 2010. [Google Scholar]
  53. Friesen, L. Psychometrics & Post-Data Analysis: A Software Implementation for Binary Logistic Regression in Jamovi. Ph.D. Thesis, University of British Columbia, Vancouver, BC, Canada, 2019. [Google Scholar]
  54. Nori, R.; Palmiero, M.; Bocchi, A.; Giannini, A.M.; Piccardi, L. The specific role of spatial orientation skills in predicting driving behaviour. Transp. Res. Part. F Traffic Psychol. Behav. 2020, 71, 259–271. [Google Scholar] [CrossRef]
  55. Lopez, A.; Postma, A.; Bosco, A. Categorical & coordinate spatial information: Can they be disentangled in sketch maps? J. Environ. Psychol. 2020, 68, 101392. [Google Scholar] [CrossRef]
  56. Costa, M.; Bonetti, L. Geometrical distortions in geographical cognitive maps. J. Environ. Psychol. 2018, 55, 53–69. [Google Scholar] [CrossRef]
  57. Dror, I.E.; Kosslyn, S.M. Mental imagery and aging. Psychol. Aging 1999, 9, 90. [Google Scholar] [CrossRef]
  58. Saimpont, A.; Pozzo, T.; Papaxanthis, C. Aging affects the mental rotation of left and right hands. PLoS ONE 2009, 4, e6714. [Google Scholar] [CrossRef]
  59. De Beni, R.; Pazzaglia, F.; Gardini, S. The role of mental rotation and age in spatial perspective-taking tasks: When age does not impair perspective-taking performance. Appl. Cogn. Psychol. Off. J. Soc. Appl. Res. Mem. Cogn. 2006, 20, 807–821. [Google Scholar] [CrossRef]
  60. Lynch, K. The Image of the City; MIT Press: Cambridge, MA, USA, 1960. [Google Scholar]
  61. Sorrows, M.E.; Hirtle, S.C. The nature of landmarks for real and electronic spaces. In International Conference on Spatial Information Theory; Springer: Berlin/Heidelberg, Germany, 1999; pp. 37–50. [Google Scholar]
  62. Nuhn, E.; Timpf, S. Personal dimensions of landmarks. In The Annual International Conference on Geographic Information Science; Springer: Cham, Switzerland, 2017. [Google Scholar]
  63. Raubal, M.; Winter, S. Enriching wayfinding instructions with local landmarks. In International Conference on Geographic Information Science; Springer: Berlin/Heidelberg, Germany, 2002. [Google Scholar]
  64. Bainbridge, W.A. Memorability: How what we see influences what we remember. In Psychology of Learning and Motivation; Academic Press: Cambridge, MA, USA, 2019. [Google Scholar]
  65. Altgassen, M.; Phillips, L.H.; Henry, J.D.; Rendell, P.G.; Kliegel, M. Emotional target cues eliminate age differences in prospective memory. Q. J. Exp. Psychol. 2010, 63, 1057–1064. [Google Scholar] [CrossRef] [PubMed]
  66. Hoyer, W.J.; Rybash, J.M. Age and visual field differences in computing visual-spatial relations. Psychol. Aging. 1992, 7, 339. [Google Scholar] [CrossRef]
  67. Meadmore, K.L.; Dror, I.E.; Bucks, R.S. Lateralisation of spatial processing and age. Laterality 2009, 14, 17–29. [Google Scholar] [CrossRef] [PubMed]
  68. De Vaus, D.; McAllister, I. Gender differences in religion: A test of the structural location theory. Am. Sociol. Rev. 1987, 52, 472–481. [Google Scholar] [CrossRef]
  69. Istat, I.M. Aspetti Della Vita Quotidiana. Available online: https://www.istat.it/ (accessed on 15 October 2020).
  70. McHale, S.M.; Huston, T.L. Men and women as parents: Sex role orientations, employment, and parental roles with infants. Child Dev. 1984, 55, 1349–1361. [Google Scholar] [CrossRef]
  71. Bocchi, A.; Giancola, M.; Piccardi, L.; Palmiero, M.; Nori, R.; D’Amico, S. How would you describe a familiar route or put in order the landmarks along it? It depends on your cognitive style! Exp. Brain Res. 2018, 236, 3121–3129. [Google Scholar] [CrossRef]
  72. Picucci, L.; Caffo, A.O.; Bosco, A. Age and sex differences in a virtual version of the reorientation task. Cogn. Process. 2009, 10, 272–275. [Google Scholar] [CrossRef]
  73. Caffò, A.O.; Tinella, L.; Lopez, A.; Spano, G.; Massaro, Y.; Lisi, A.; Bosco, A. The drives for driving simulation: A scientometric analysis and a selective review of reviews on simulated driving research. Front. Psychol. 2020, 11, e917. [Google Scholar] [CrossRef]
  74. Spano, G.; Caffò, A.O.; Lopez, A.; Mallia, L.; Gormley, M.; Innamorati, M.; Bosco, A. Validating driver behavior and attitude measure for older Italian drivers and investigating their link to rare collision events. Front. Psychol. 2019, 10, 368. [Google Scholar] [CrossRef] [PubMed]
  75. Martino, V.; Grattagliano, I.; Bosco, A.; Massaro, Y.; Lisi, A.; Campobasso, F.; Catanesi, R. A new index for the MMPI-2 test for detecting dissimulation in forensic evaluations: A pilot study. J. Forensic Sci. 2016, 61, 249–253. [Google Scholar] [CrossRef]
  76. Bosco, A.; Massaro, Y.; Lisi, A.; Di Conza, A.; Campobasso, F.; Caffò, A.O.; Grattagliano, I. Detecting faking good in military enlistment procedure according to a new index for the MMPI-2. Ital. J. Criminol. 2020, 14, 99–109. [Google Scholar]
  77. Coppola, G.; Cassibba, R.; Bosco, A.; Papagna, S. In search of social support in the NICU: Features, benefits and antecedents of parents’ tendency to share with others the premature birth of their baby. J. Matern. 2013, 26, 1737–1741. [Google Scholar] [CrossRef]
Figure 1. Semi-blind map with two fixed reference points and North.
Brainsci 10 00774 g001
Figure 2. Map of Hometown, City of Bari: (a) pictures of fixed reference points; (b) pictures of landmarks to be placed on the semi-blind map; (c) the map with the expected positions and distances (Illustration free downloaded from Google Earth).
Brainsci 10 00774 g002
Figure 3. Item response curves of items reporting age DIF on categorical and coordinate scores.
Brainsci 10 00774 g003
Figure 4. Item response curves reporting gender DIF on categorical and coordinate scores.
Brainsci 10 00774 g004
Table 1. Means ± standard deviations for Categorical and coordinate scores are based on z transformations. Significant main effects of age-group and gender on demographical variables were obtained through t test. *** p < 0.001.
YOUNGELDERLY
WOMENMENWOMENMENGroup AgeGender
(N = 103) (N = 100) (N = 98)(N = 99)
Age, years 24 ± 623 ± 673 ± 773 ± 7***-
Education, years 16 ± 216 ± 111 ± 512 ± 5***n.s
Categorical score0.23 ± 0.92−0.31 ± 1.05−0.15 ± 0.940.02 ± 1.02n.sn.s
Coordinate score0.37 ± 0.880.08 ± 0.85−0.56 ± 0.89−0.03 ± 1.07***n.s
Table 2. Number of DIF items in Categorical and Coordinate components, in Young and Elderly participants.
Effect Size (ZT)YOUNG vs. ELDERLY
CategoryCoordinate
A negligible41
B moderate00
C large00
Table 3. Binary logistic regression coefficients across age groups on categorical scores.
ItemZumbo-Thomasp-Valueχ2 Stat.ΔR2G*θOdd
Basilica di San NicolaA0.00411.0600.037−0.3530.700
Casa Circondariale BariA<0.00119.0800.053−0.1970.820
Nicolaus HotelNo flag0.2123.1000.0050.4931.630
Spiaggia”Pane & Pomodoro”A0.00311.4800.0410.6011.825
Parco II GiugnoA0.0109.3000.0160.3631.430
Ospedale “Policlinico”No flag0.2422.8400.0050.0061.005
Sacrario Caduti di OltremareNo flag0.0894.8500.0100.3221.370
Stadio della VittoriaNo flag0.0705.3200.0300.0871.080
Note. Tests of significance conducted using: 2 degrees of freedom (χ2 significance threshold = 5.991); ΔR2: effect sizes scale; G*θ: interaction between the matching and grouping variables.
Table 4. Binary logistic regression coefficients across age groups on coordinate scores.
ItemZumbo-Thomasp-Valueχ2 Stat.ΔR2G*θOdd
Basilica di San NicolaNo flag0.8230.3900.001−0.0050.990
Casa Circondariale BariNo flag0.0974.6650.010−0.2280.790
Nicolaus HotelNo flag0.3142.3140.0130.3501.410
Spiaggia”Pane & Pomodoro”A0.00113.5300.067−0.4010.670
Parco II GiugnoNo flag0.2572.7200.007−0.2290.790
Ospedale “Policlinico”No flag0.2872.4950.006−0.4200.650
Sacrario Caduti di OltremareNo flag0.9070.1960.001−0.2180.800
Stadio della VittoriaNo flag0.1014.5830.0320.4581.560
Note. Tests of significance conducted using: two degrees of freedom (χ2 significance threshold = 5.991); ΔR2: effect sizes scale; G*θ: interaction between the matching and grouping variables.
Table 5. Number of DIF items in Categorical and Coordinate components, in women and men.
Effect Size (ZT)WOMEN vs. MEN
CategoryCoordinate
A negligible12
B moderate00
C large00
Table 6. Binary logistic regression coefficients across gender groups on categorical scores.
ItemZumbo-Thomasp-Valueχ2 Stat.ΔR2G*θOdd
Basilica di San NicolaNo flag0.6940.7310.0020.0651.060
Casa Circondariale BariNo flag0.8160.4070.001−0.0660.940
Nicolaus HotelNo flag0.1453.8570.006−0.3330.710
Spiaggia”Pane & Pomodoro”No flag0.8210.3940.0010.0991.090
Parco II GiugnoA0.0326.8610.0130.5811.780
Ospedale “Policlinico”No flag0.2572.7160.0050.0201.020
Sacrario Caduti di OltremareNo flag0.4971.3990.0030.0811.080
Stadio della VittoriaNo flag0.5111.3420.0070.1981.200
Note. Tests of significance conducted using: two degrees of freedom (χ2 significance threshold = 5.991); ΔR2: effect sizes scale; G*θ: interaction between the matching and grouping variables.
Table 7. Binary logistic regression coefficients across gender groups on coordinate scores.
ItemZumbo-Thomasp-Valueχ2 Stat.ΔR2G*θOdd
Basilica di San NicolaA0.0496.0410.015−0.5550.570
Casa Circondariale BariNo flag0.6190.9590.0020.1911.200
Nicolaus HotelNo flag0.9350.1350.0010.0871.080
Spiaggia “Pane & Pomodoro”No flag0.5211.3040.0050.2741.300
Parco II GiugnoNo flag0.2312.9270.007−0.0890.920
Ospedale “Policlinico”No flag0.2462.8080.006−0.0490.950
Sacrario Caduti di OltremareNo flag0.4621.5460.011−0.5860.560
Stadio della VittoriaA0.0079.8740.070−0.1500.860
Note. Tests of significance conducted using: 2 degrees of freedom (χ2 significance threshold = 5.991); ΔR2: effect sizes scale; G*θ: interaction between the matching and grouping variables.
Publisher’s Note: MDPI stays neutral with regard to jurisdictional claims in published maps and institutional affiliations.

