Detection of White Matter Ultrastructural Changes for Amyotrophic Lateral Sclerosis Characterization: A Diagnostic Study from Dti-Derived Data

 ,
,  , , ,
, , ,  , and
, and
Abstract
:1. Introduction
2. Materials and Methods
2.1. Study Population and Clinical Data Collection
2.2. Neuropsychological Evaluation
2.3. Genetic Analysis
2.4. MRI Protocol
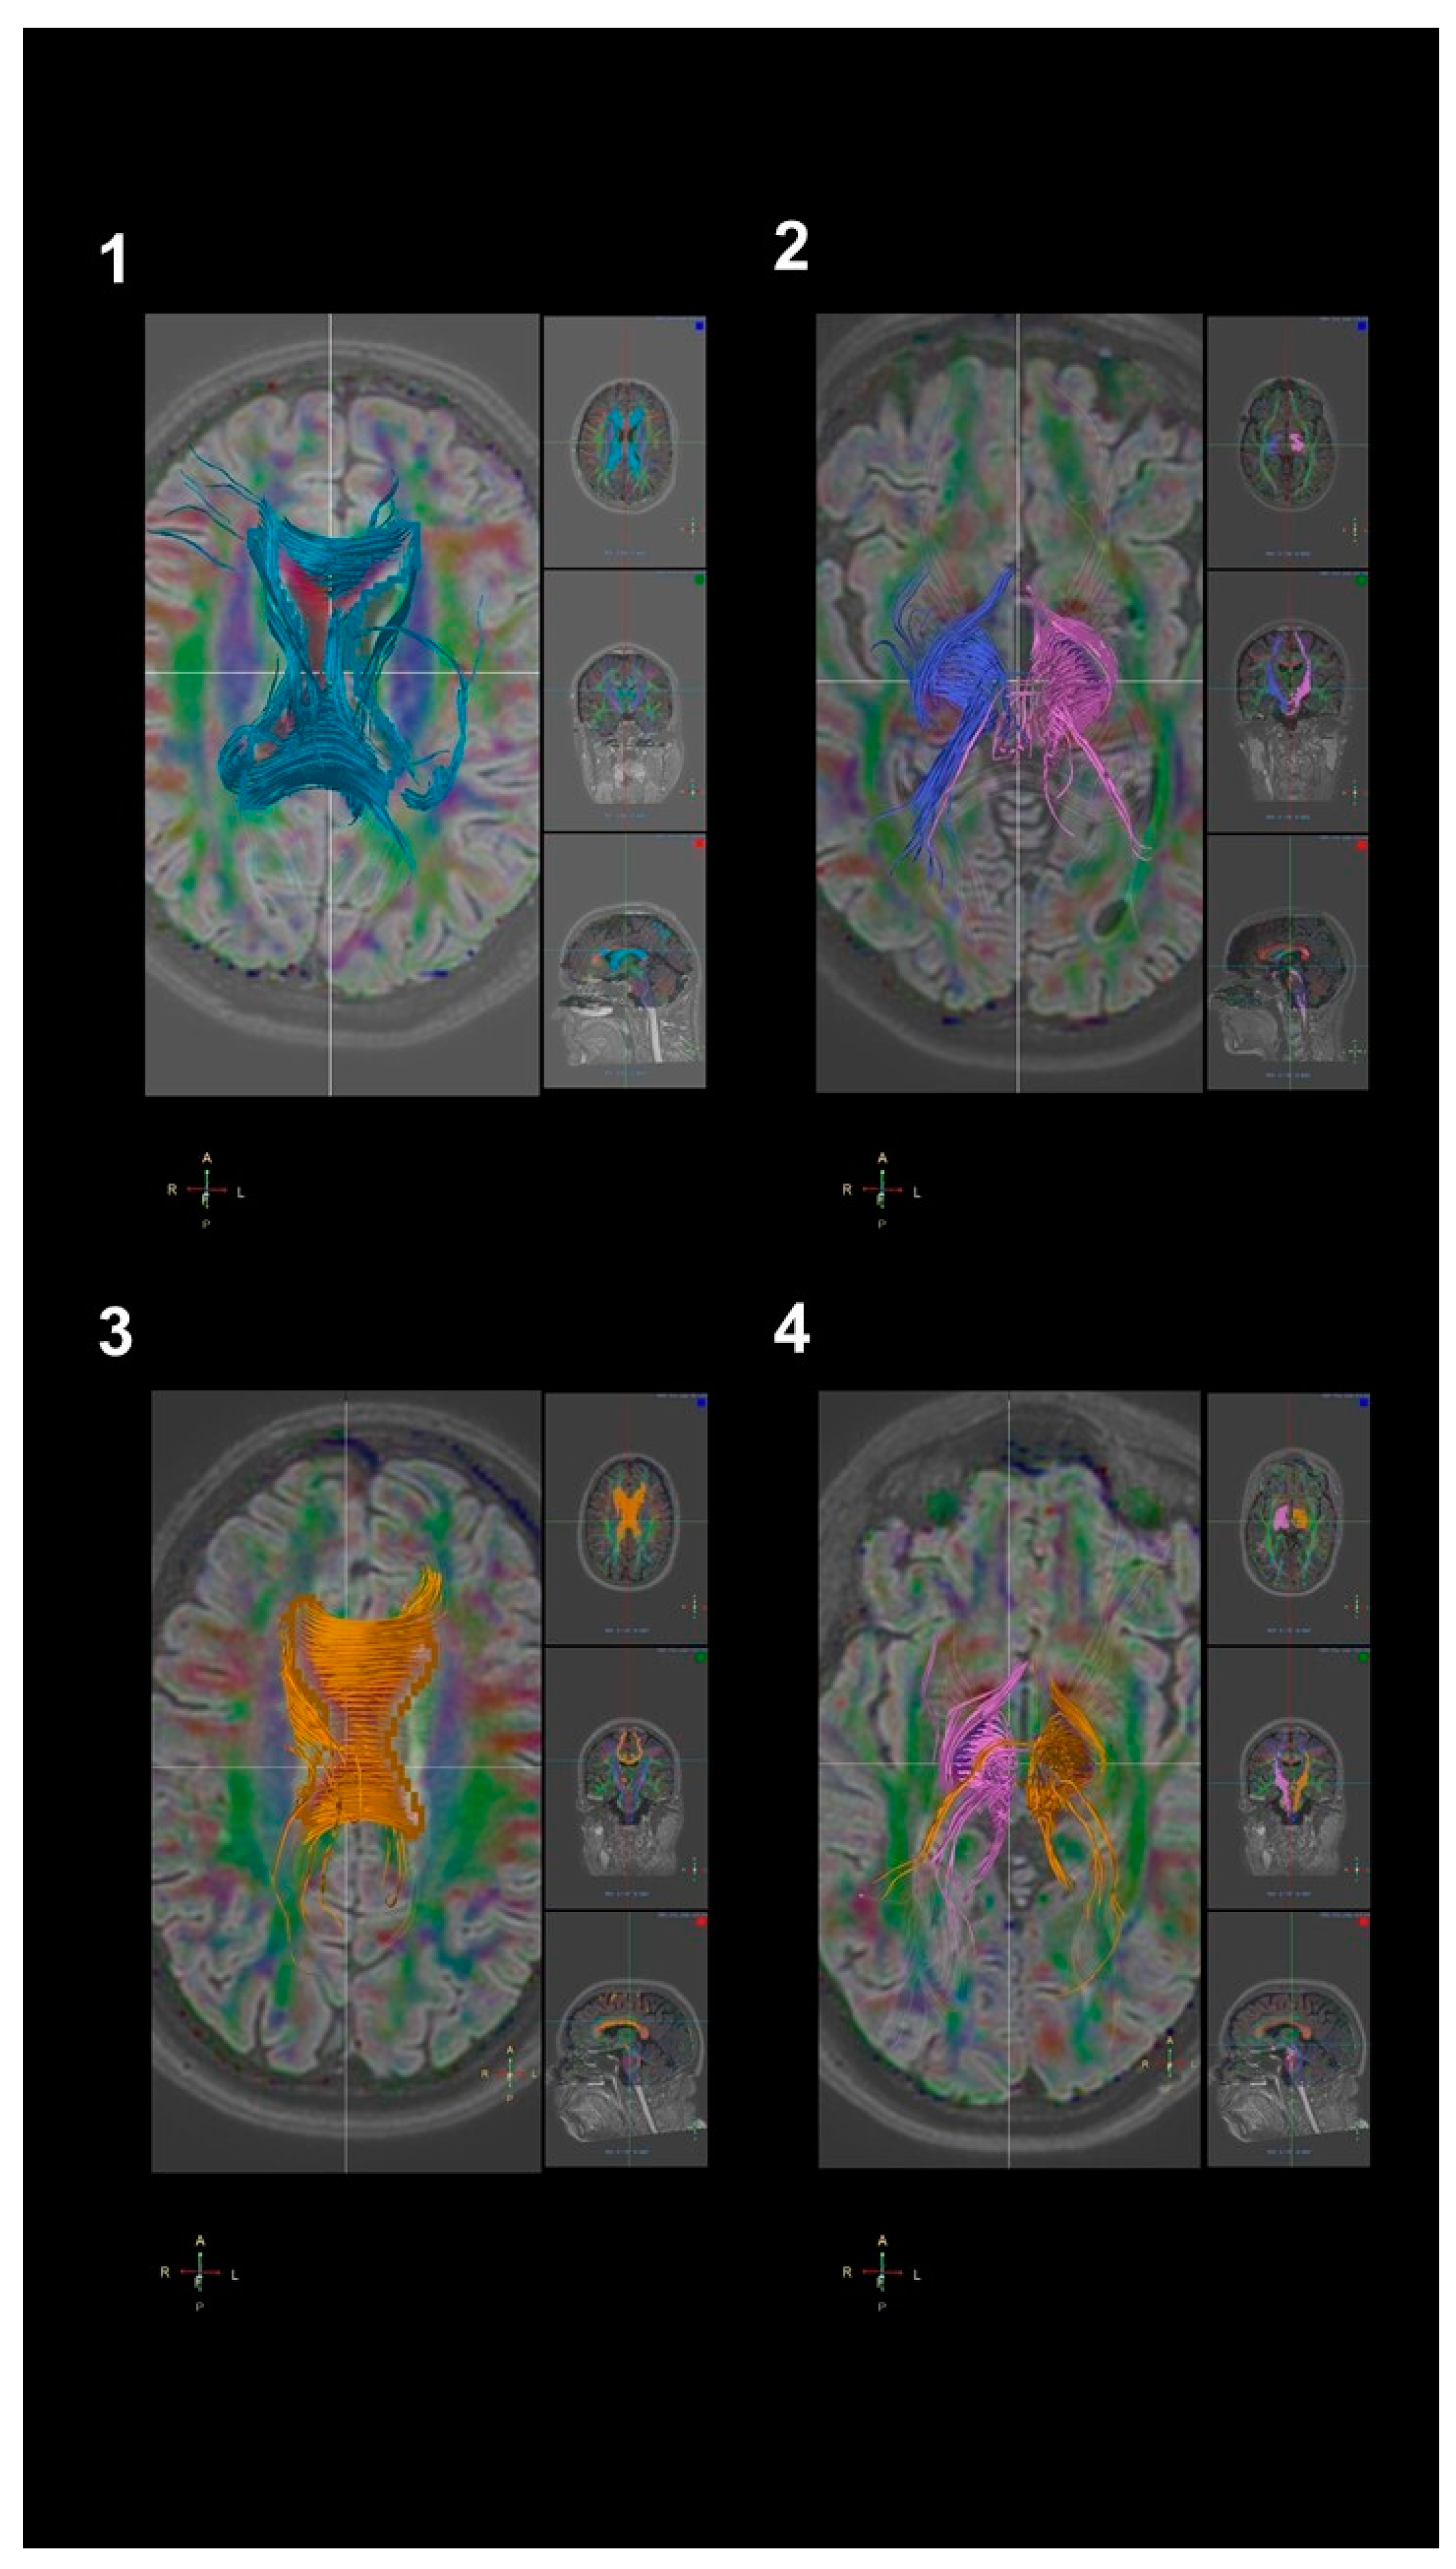
2.5. DTI Analysis
2.6. Statistical Analysis
3. Results
3.1. Patients’ Features
3.2. DTI Findings
3.3. Correlation Analysis within Patients
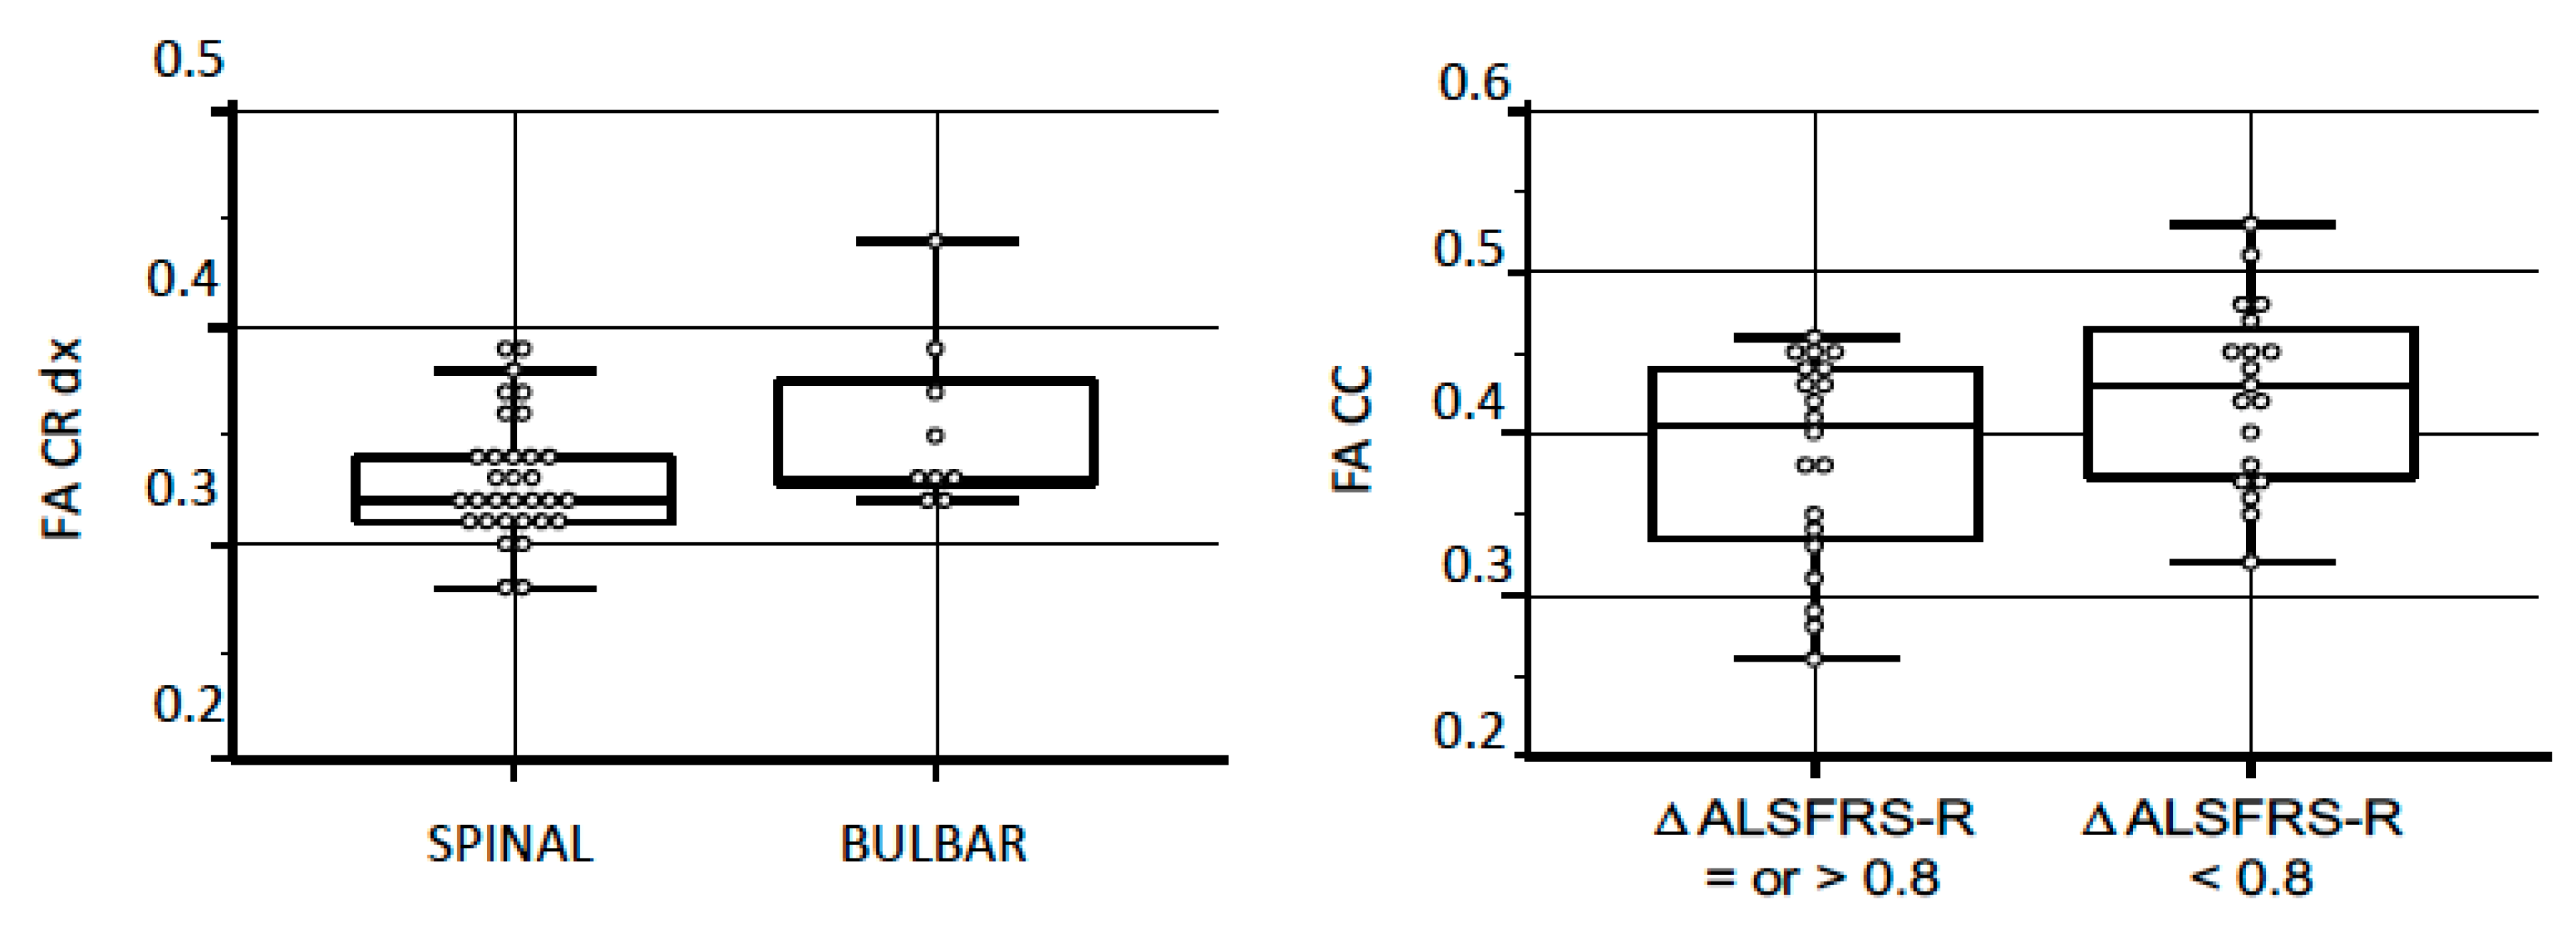
3.4. Group Comparisons
3.5. Disease Progression
3.6. Cognitive Profiles and Gene Mutations
4. Discussion
4.1. Differences in the FA and in the ADC between ALS Patients and Normative Group
4.2. The Differences in the FA and the ADC Based on Patients’ Functional Level (ALSFRS-R Score)
4.3. Lack of Differences in the FA and the ADC Values in c9Orf72 Patients
4.4. Strengths and Limitations
Author Contributions
Funding
Acknowledgments
Conflicts of Interest
References
- Van Es, M.A.; Hardiman, O.; Chio, A.; Al-Chalabi, A.; Pasterkamp, R.J.; Veldink, J.H.; Van den Berg, L.H. Amyotrophic lateral sclerosis. Lancet 2017, 390, 2084–2098. [Google Scholar] [CrossRef]
- Taylor, J.P.; Brown, R.H.; Cleveland, D.W. Decoding ALS: From genes to mechanism. Nature 2016, 539, 197–206. [Google Scholar] [CrossRef] [Green Version]
- Benbrika, S.; Desgranges, B.; Eustache, F.; Viader, F. Cognitive, emotional and psychological manifestations in amyotrophic lateral sclerosis at baseline and overtime: A review. Front. Neurosci. 2019, 13, 951. [Google Scholar] [CrossRef]
- Chio, A.; Logroscino, G.; Hardiman, O.; Swingler, R.; Mitchell, D.; Beghi, E.; Traynor, B.G.; Consortium, E. Prognostic factors in ALS: A critical review. Amyotroph. Lateral Scler. 2009, 10, 310–323. [Google Scholar] [CrossRef] [PubMed] [Green Version]
- Taga, A.; Maragakis, N.J. Current and emerging ALS biomarkers: Utility and potential in clinical trials. Expert Rev. Neurother. 2018, 18, 871–886. [Google Scholar] [CrossRef] [PubMed]
- Smith, M.C. Nerve fibre degeneration in the brain in amyotrophic lateral sclerosis. J. Neurol. Neurosurg. Psychiatry 1960, 23, 269. [Google Scholar] [CrossRef] [PubMed] [Green Version]
- Agosta, F.; Spinelli, E.G.; Filippi, M. Neuroimaging in amyotrophic lateral sclerosis: Current and emerging uses. Expert Rev. Neurother. 2018, 18, 395–406. [Google Scholar] [CrossRef]
- Fabes, J.; Matthews, L.; Filippini, N.; Talbot, K.; Jenkinson, M.; Turner, M.R. Quantitative FLAIR MRI in amyotrophic lateral sclerosis. Acad. Radiol. 2017, 24, 1187–1194. [Google Scholar] [CrossRef] [PubMed] [Green Version]
- Pierpaoli, C.; Jezzard, P.; Basser, P.J.; Barnett, A.; Di Chiro, G. Diffusion tensor MR imaging of the human brain. Radiology 1996, 201, 637–648. [Google Scholar] [CrossRef] [PubMed]
- Huisman, T.A.G.M. Diffusion-weighted and diffusion tensor imaging of the brain, made easy. Cancer Imaging 2010, 10, S163. [Google Scholar] [CrossRef] [Green Version]
- Baliyan, V.; Das, C.J.; Sharma, R.; Gupta, A.K. Diffusion weighted imaging: Technique and applications. World J. Radiol. 2016, 8, 785. [Google Scholar] [CrossRef] [PubMed]
- Beaulieu, C. The biological basis of diffusion anisotropy. In Diffusion MRI; Elsevier: Amsterdam, The Netherlands, 2014; pp. 155–183. [Google Scholar]
- Ellis, C.M.; Simmons, A.; Jones, D.K.; Bland, J.; Dawson, J.M.; Horsfield, M.A.; Williams, S.C.R.; Leigh, P.N. Diffusion tensor MRI assesses corticospinal tract damage in ALS. Neurology 1999, 53, 1051. [Google Scholar] [CrossRef] [PubMed]
- Karlsborg, M.; Rosenbaum, S.; Wiegell, M.R.; Simonsen, H.; Larsson, H.B.W.; Werdelin, L.M.; Gredal, O. Corticospinal tract degeneration and possible pathogenesis in ALS evaluated by MR diffusion tensor imaging. Amyotroph. Lateral Scler. Other Mot. Neuron Disord. 2004, 5, 136–140. [Google Scholar] [CrossRef] [PubMed]
- Senda, J.; Kato, S.; Kaga, T.; Ito, M.; Atsuta, N.; Nakamura, T.; Watanabe, H.; Tanaka, F.; Naganawa, S.; Sobue, G. Progressive and widespread brain damage in ALS: MRI voxel-based morphometry and diffusion tensor imaging study. Amyotroph. Lateral Scler. 2011, 12, 59–69. [Google Scholar] [CrossRef] [PubMed]
- Müller, H.-P.; Agosta, F.; Riva, N.; Spinelli, E.G.; Comi, G.; Ludolph, A.C.; Filippi, M.; Kassubek, J. Fast progressive lower motor neuron disease is an ALS variant: A two-centre tract of interest-based MRI data analysis. NeuroImage Clin. 2018, 17, 145–152. [Google Scholar] [CrossRef] [PubMed]
- Müller, H.-P.; Del Tredici, K.; Lulé, D.; Müller, K.; Weishaupt, J.H.; Ludolph, A.C.; Kassubek, J. In vivo histopathological staging in C9orf72-associated ALS: A tract of interest DTI study. NeuroImage Clin. 2020, 102298. [Google Scholar] [CrossRef]
- Floeter, M.K.; Danielian, L.E.; Braun, L.E.; Wu, T. Longitudinal diffusion imaging across the C9orf72 clinical spectrum. J. Neurol. Neurosurg. Psychiatry 2018, 89, 53–60. [Google Scholar] [CrossRef]
- Du, X.-Q.; Zou, T.-X.; Huang, N.-X.; Zou, Z.-Y.; Xue, Y.-J.; Chen, H.-J. Brain white matter abnormalities and correlation with severity in amyotrophic lateral sclerosis: An atlas-based diffusion tensor imaging study. J. Neurol. Sci. 2019, 405, 116438. [Google Scholar] [CrossRef]
- Baek, S.-H.; Park, J.; Kim, Y.H.; Seok, H.Y.; Oh, K.-W.; Kim, H.-J.; Kwon, Y.-J.; Sim, Y.; Tae, W.-S.; Kim, S.H. Usefulness of diffusion tensor imaging findings as biomarkers for amyotrophic lateral sclerosis. Sci. Rep. 2020, 10, 1–9. [Google Scholar] [CrossRef] [Green Version]
- Kasper, E.; Schuster, C.; Machts, J.; Kaufmann, J.; Bittner, D.; Vielhaber, S.; Benecke, R.; Teipel, S.; Prudlo, J. Microstructural white matter changes underlying cognitive and behavioural impairment in ALS–an in vivo study using DTI. PLoS ONE 2014, 9, e114543. [Google Scholar] [CrossRef]
- Femiano, C.; Trojsi, F.; Caiazzo, G.; Siciliano, M.; Passaniti, C.; Russo, A.; Bisecco, A.; Cirillo, M.; Monsurrò, M.R.; Esposito, F. Apathy is correlated with widespread diffusion tensor imaging (DTI) impairment in amyotrophic lateral sclerosis. Behav. Neurol. 2018. [Google Scholar] [CrossRef]
- Tsujimoto, M.; Senda, J.; Ishihara, T.; Niimi, Y.; Kawai, Y.; Atsuta, N.; Watanabe, H.; Tanaka, F.; Naganawa, S.; Sobue, G. Behavioral changes in early ALS correlate with voxel-based morphometry and diffusion tensor imaging. J. Neurol. Sci. 2011, 307, 34–40. [Google Scholar] [CrossRef]
- Agosta, F.; Al-Chalabi, A.; Filippi, M.; Hardiman, O.; Kaji, R.; Meininger, V.; Nakano, I.; Shaw, P.; Shefner, J.; Van Den Berg, L.H. The El Escorial criteria: Strengths and weaknesses. Amyotroph. Lateral Scler. Front. Degener. 2015, 16, 1–7. [Google Scholar] [CrossRef]
- Cedarbaum, J.M.; Stambler, N.; Malta, E.; Fuller, C.; Hilt, D.; Thurmond, B.; Nakanishi, A.; Group, B.A.S.; BDNF ALS Study Group (Phase III). The ALSFRS-R: A revised ALS functional rating scale that incorporates assessments of respiratory function. J. Neurol. Sci. 1999, 169, 13–21. [Google Scholar] [CrossRef]
- Richards, S.; Aziz, N.; Bale, S.; Bick, D.; Das, S.; Gastier-Foster, J.; Grody, W.W.; Hegde, M.; Lyon, E.; Spector, E. Standards and guidelines for the interpretation of sequence variants: A joint consensus recommendation of the American College of Medical Genetics and Genomics and the Association for Molecular Pathology. Genet. Med. 2015, 17, 405–423. [Google Scholar] [CrossRef] [PubMed]
- Le Bihan, D.; Johansen-Berg, H. Diffusion MRI at 25: Exploring brain tissue structure and function. Neuroimage 2012, 61, 324–341. [Google Scholar] [CrossRef] [PubMed] [Green Version]
- Danielian, L.E.; Iwata, N.K.; Thomasson, D.M.; Floeter, M.K. Reliability of fiber tracking measurements in diffusion tensor imaging for longitudinal study. Neuroimage 2010, 49, 1572–1580. [Google Scholar] [CrossRef] [Green Version]
- Zhang, F.; Chen, G.; He, M.; Dai, J.; Shang, H.; Gong, Q.; Jia, Z. Altered white matter microarchitecture in amyotrophic lateral sclerosis: A voxel-based meta-analysis of diffusion tensor imaging. NeuroImage Clin. 2018, 19, 122–129. [Google Scholar] [CrossRef]
- Zhang, H.; Avants, B.B.; Yushkevich, P.A.; Woo, J.H.; Wang, S.; McCluskey, L.F.; Elman, L.B.; Melhem, E.R.; Gee, J.C. High-dimensional spatial normalization of diffusion tensor images improves the detection of white matter differences: An example study using amyotrophic lateral sclerosis. IEEE Trans. Med. Imaging 2007, 26, 1585–1597. [Google Scholar] [CrossRef]
- Agosta, F.; Pagani, E.; Rocca, M.A.; Caputo, D.; Perini, M.; Salvi, F.; Prelle, A.; Filippi, M. Voxel-based morphometry study of brain volumetry and diffusivity in amyotrophic lateral sclerosis patients with mild disability. Hum. Brain Mapp. 2007, 28, 1430–1438. [Google Scholar] [CrossRef]
- Poujois, A.; Schneider, F.C.; Faillenot, I.; Camdessanché, J.; Vandenberghe, N.; Thomas-Antérion, C.; Antoine, J. Brain plasticity in the motor network is correlated with disease progression in amyotrophic lateral sclerosis. Hum. Brain Mapp. 2013, 34, 2391–2401. [Google Scholar] [CrossRef] [PubMed]
- Kalra, S.; Müller, H.-P.; Ishaque, A.; Zinman, L.; Korngut, L.; Genge, A.; Beaulieu, C.; Frayne, R.; Graham, S.J.; Kassubek, J. A prospective harmonized multicenter DTI study of cerebral white matter degeneration in ALS. Neurology 2020, 95, e943–e952. [Google Scholar] [CrossRef] [PubMed]
- Agosta, F.; Pagani, E.; Petrolini, M.; Caputo, D.; Perini, M.; Prelle, A.; Salvi, F.; Filippi, M. Assessment of white matter tract damage in patients with amyotrophic lateral sclerosis: A diffusion tensor MR imaging tractography study. Am. J. Neuroradiol. 2010, 31, 1457–1461. [Google Scholar] [CrossRef] [PubMed] [Green Version]
- Angstmann, S.; Madsen, K.S.; Skimminge, A.; Jernigan, T.L.; Baaré, W.F.C.; Siebner, H.R. Microstructural asymmetry of the corticospinal tracts predicts right–left differences in circle drawing skill in right-handed adolescents. Brain Struct. Funct. 2016, 221, 4475–4489. [Google Scholar] [CrossRef] [Green Version]
- Gordon, P.H.; Miller, R.G.; Moore, D.H. ALSFRS-R. Amyotroph. Lateral Scler. Other Mot. Neuron Disord. 2004, 5, 90–93. [Google Scholar] [CrossRef]
- Gellersen, H.M.; Guo, C.C.; O’Callaghan, C.; Tan, R.H.; Sami, S.; Hornberger, M. Cerebellar atrophy in neurodegeneration—a meta-analysis. J. Neurol. Neurosurg. Psychiatry 2017, 88, 780–788. [Google Scholar] [CrossRef] [Green Version]
- Qiu, T.; Zhang, Y.; Tang, X.; Liu, X.; Wang, Y.; Zhou, C.; Luo, C.; Zhang, J. Precentral degeneration and cerebellar compensation in amyotrophic lateral sclerosis: A multimodal MRI analysis. Hum. Brain Mapp. 2019, 40, 3464–3474. [Google Scholar] [CrossRef] [Green Version]
- Meoded, A.; Morrissette, A.E.; Katipally, R.; Schanz, O.; Gotts, S.J.; Floeter, M.K. Cerebro-cerebellar connectivity is increased in primary lateral sclerosis. NeuroImage Clin. 2015, 7, 288–296. [Google Scholar] [CrossRef] [Green Version]
- Menke, R.A.L.; Proudfoot, M.; Talbot, K.; Turner, M.R. The two-year progression of structural and functional cerebral MRI in amyotrophic lateral sclerosis. NeuroImage Clin. 2018, 17, 953–961. [Google Scholar] [CrossRef]
- Wang, S.; Poptani, H.; Bilello, M.; Wu, X.; Woo, J.H.; Elman, L.B.; McCluskey, L.F.; Krejza, J.; Melhem, E.R. Diffusion tensor imaging in amyotrophic lateral sclerosis: Volumetric analysis of the corticospinal tract. Am. J. Neuroradiol. 2006, 27, 1234–1238. [Google Scholar]
- Chiò, A.; Moglia, C.; Canosa, A.; Manera, U.; D’Ovidio, F.; Vasta, R.; Grassano, M.; Brunetti, M.; Barberis, M.; Corrado, L. ALS phenotype is influenced by age, sex, and genetics: A population-based study. Neurology 2020, 94, e802–e810. [Google Scholar] [CrossRef] [PubMed]
- Agosta, F.; Ferraro, P.M.; Riva, N.; Spinelli, E.G.; Domi, T.; Carrera, P.; Copetti, M.; Falzone, Y.; Ferrari, M.; Lunetta, C. Structural and functional brain signatures of C9orf72 in motor neuron disease. Neurobiol. Aging 2017, 57, 206–219. [Google Scholar] [CrossRef] [PubMed]


| Variables | Patients | Bulbar Onset | Spinal Onset | p-Value | UMN-Prevalent | Classic | p-Value | ΔALSFRS-R < 0.8 | ΔALSFRS-R ≥ 0.8 | p-Value |
|---|---|---|---|---|---|---|---|---|---|---|
| Number of patients (n) | 41 | 9 | 32 | 10 | 31 | 20 | 21 | |||
| Males/females, n (%) | 19 (46%)/ 22 (54%) | 3 (33%)/ 6 (67%) | 16 (50%)/ 16 (50%) | n.s. | 5 (50%)/ 5 (50%) | 14 (45%)/ 17 (55%) | n.s. | 11 (55%)/ 9 (45%) | 8 (38%)/ 13 (62%) | n.s. |
| Age at onset, mean (SD) | 58.53 (12.38) | 63.96 (12.10) | 56.99 (12.37) | n.s. | 50.56 (12.09) | 61.09 (11.50) | n.s. | 60.81 (11.69) | 56.35 (12.90) | n.s. |
| Diagnostic delay, median (IQR) | 10.00 (6–23) | 8 (6–24.5) | 12 (6–23) | n.s. | 14.6 (9–15) | 16.70 (11–22) | n.s. | 15 (9–18) | 9 (6–15) | n.s. |
| Symptoms onset regions | n.s. | n.s. | ||||||||
| - bulbar, n (%) | 9 (22%) | -- | -- | 2 (20%) | 7 (22%) | 3 (15%) | 6 (28%) | |||
| - spinal, n (%) | 32 (78%) | -- | -- | 8 (80%) | 24 (78%) | 17 (85%) | 15 (72%) | |||
| ALSFRS-R at diagnosis, mean (SD) | 40.18 (5.73) | 43.67 (5.27) | 39.16 (5.73) | 0.03 | 41.10 (3.38) | 39.86 (6.34) | n.s. | 39.16 (7.17) | 41.10 (4.00) | n.s. |
| Monthly ΔALSFRS-R, median (IQR) | 0.95 (0.45–1.44) | 0.95 (0.43–0.95) | 0.95 (0.45–1.44) | n.s. | 1.50 (0.98) | 1.28 (1.99) | n.s. | 0.39 (0.26) | 2.15 (2.10) | <0.001 |
| FVC% at diagnosis, mean (SD) | 86.57 (19.04) | 88 (19.59) | 86.21 (19.24) | n.s. | 99.00 (8.65) | 82.22 (19.81) | 0.02 | 80.58 (18.11) | 92.22 (18.61) | 0.04 |
| Monthly ΔFVC%, median (IQR) | 1.44 (1.00–3.32) | 1.33 (0.97–1.79) | 1.44 (1.00–3.32) | n.s. | 2.51 (2.39) | 2.94 (5.14) | n.s. | 1.27 (1.40) | 4.28 (5.73) | 0.03 |
| Cognitive function, n (%) | n.s. | n.s. | <0.001 | |||||||
| - normal | 25 (61%) | 6 (67%) | 19 (59%) | 7 (70%) | 18 (58%) | 8 (40%) | 17 (81%) | |||
| - impaired | 16 (39%) | 3 (33%) | 13 (41%) | 3 (30%) | 13 (42%) | 12 (60%) | 4 (19%) | |||
| Gene mutation, n (%) | n.s. | n.s. | n.s. | |||||||
| - no mutation | 34 (83%) | 6 (67%) | 28 (87%) | 9 (90%) | 25 (80%) | 17 (85%) | 17 (81%) | |||
| - C9Orf72 | 7 (17%) | 3 (33%) | 4 (13%) | 1 (10%) | 6 (20%) | 3 (15%) | 4 (19%) | |||
| Disease duration, median (IQR) | 23 (10–42) | 23 (12–43.5) | 23 (10–42) | n.s. | 38 (15–42) | 22 (9–25) | 0.05 | 23.5 (5.25–23.75) | 21 (6–21.75) | n.s. |
| Survival rate (alive/deceased), n | 18 (44%)/ 23 (56%) | 4 (44%)/ 5 (56%) | 14 (44%)/ 18 (56%) | n.s. | 5 (50%)/ 5 (50%) | 18 (58%)/ 13 (42%) | n.s. | 10 (50%)/ 20 (50%) | 8 (38%)/ 21 (62%) | n.s. |
| Variables | Patients | Controls | p-Value | Bulbar Onset | Spinal Onset | p-Value | UMN | Classic | p-Value | ΔALSFRS-R < 0.8 | ΔALSFRS-R ≥ 0.8 | p-Value |
|---|---|---|---|---|---|---|---|---|---|---|---|---|
| Fractional Anisotropy, mean (SD) | ||||||||||||
| - corpus callosum | 0.40 (0.06) | 0.65 (0.04) | <0.01 | 0.37 (0.07) | 0.41 (0.06) | n.s. | 0.40 (0.07) | 0.40 (0.06) | n.s. | 0.41 (0.06) | 0.39 (0.07) | 0.04 |
| - right corona radiata | 0.34 (0.03) | 0.61 (0.05) | <0.01 | 0.35 (0.04) | 0.33 (0.03) | 0.05 | 0.32 (0.02) | 0.34 (0.03) | n.s. | 0.34 (0.03) | 0.33 (0.04) | n.s. |
| - left corona radiata | 0.34 (0.04) | 0.66 (0.07) | <0.01 | 0.34 (0.05) | 0.34 (0.03) | n.s. | 0.33 (0.02) | 0.34 (0.04) | n.s. | 0.33 (0.03) | 0.34 (0.04) | n.s. |
| - right cerebral peduncle | 0.34 (0.04) | 0.79 (0.04) | <0.01 | 0.33 (0.05) | 0.34 (0.04) | n.s. | 0.33 (0.05) | 0.34 (0.04) | n.s. | 0.34 (0.04) | 0.34 (0.05) | n.s. |
| - left cerebral peduncle | 0.40 (0.05) | 0.81 (0.04) | <0.01 | 0.39 (0.03) | 0.40 (0.06) | n.s. | 0.40 (0.03) | 0.40 (0.06) | n.s. | 0.40 (0.06) | 0.40 (0.04) | n.s. |
| - right corticospinal tract | 0.53 (0.04) | 0.72 (0.08) | <0.01 | 0.52 (0.02) | 0.53 (0.04) | n.s. | 0.54 (0.04) | 0.53 (0.04) | n.s. | 0.54 (0.04) | 0.52 (0.04) | n.s. |
| - left corticospinal tract | 0.55 (0.11) | 0.75 (0.05) | <0.01 | 0.52 (0.02) | 0.56 (0.13) | n.s. | 0.53 (0.03) | 0.56 (0.13) | n.s. | 0.58 (0.16) | 0.52 (0.03) | 0.09 |
| - right cerebellar peduncle | 0.41 (0.05) | 0.66 (0.06) | <0.01 | 0.40 (0.02) | 0.42 (0.06) | n.s. | 0.41 (0.04) | 0.41 (0.05) | n.s. | 0.41 (0.05) | 0.41 (0.05) | n.s. |
| - left cerebellar peduncle | 0.43 (0.05) | 0.71 (0.10) | <0.01 | 0.43 (0.01) | 0.43 (0.05) | n.s. | 0.44 (0.03) | 0.43 (0.05) | n.s. | 0.44 (0.06) | 0.43 (0.03) | n.s. |
| Apparent diffusion coefficient, mean (SD) | ||||||||||||
| - corpus callosum | 1242 (271) | 825 (78) | <0.01 | 1358 (303) | 1210 (258) | n.s. | 1252 (291) | 1238 (270) | n.s. | 1172 (214) | 1309 (308) | 0.02 |
| - right corona radiata | 692 (65) | 830 (70) | <0.01 | 687 (82) | 694 (62) | n.s. | 697 (82) | 691 (60) | n.s. | 691 (71) | 695 (62) | n.s. |
| - left corona radiata | 764 (120) | 739 (75) | n.s. | 775 (140) | 762 (112) | n.s. | 713 (60) | 781 (131) | n.s. | 792 (136) | 740 (102) | n.s. |
| - right cerebral peduncle | 1337 (240) | 742 (100) | <0.01 | 1388 (263) | 1323 (236) | n.s. | 1429 (274) | 1307 (224) | n.s. | 1321 (246) | 1353 (240) | n.s. |
| - left cerebral peduncle | 1070 (236) | 742 (124) | <0.01 | 1051 (253) | 1076 (236) | n.s. | 1141 (218) | 1047 (240) | n.s. | 1057 (218) | 1083 (258) | n.s. |
| - right corticospinal tract | 888 (67) | 777 (68) | <0.01 | 898 (48) | 886 (72) | n.s. | 896 (44) | 885 (73) | n.s. | 889 (89) | 888 (38) | n.s. |
| - left corticospinal tract | 863 (50) | 731 (77) | <0.01 | 861 (26) | 865 (55) | n.s. | 869 (43) | 862 (52) | n.s. | 862 (62) | 866 (37) | n.s. |
| - right cerebellar peduncle | 965 (243) | 729 (133) | <0.01 | 886 (230) | 988 (246) | n.s. | 1134 (375) | 910 (155) | 0.01 | 919 (148) | 1010 (306) | n.s. |
| - left cerebellar peduncle | 791 (134) | 745 (69) | n.s. | 777 (103) | 796 (143) | n.s. | 767 (133) | 799 (135) | n.s. | 805 (137) | 779 (134) | n.s. |
Publisher’s Note: MDPI stays neutral with regard to jurisdictional claims in published maps and institutional affiliations. |
© 2020 by the authors. Licensee MDPI, Basel, Switzerland. This article is an open access article distributed under the terms and conditions of the Creative Commons Attribution (CC BY) license (http://creativecommons.org/licenses/by/4.0/).
Share and Cite
De Marchi, F.; Stecco, A.; Falaschi, Z.; Filippone, F.; Pasché, A.; Bebeti, A.; Leigheb, M.; Cantello, R.; Mazzini, L. Detection of White Matter Ultrastructural Changes for Amyotrophic Lateral Sclerosis Characterization: A Diagnostic Study from Dti-Derived Data. Brain Sci. 2020, 10, 996. https://0-doi-org.brum.beds.ac.uk/10.3390/brainsci10120996
De Marchi F, Stecco A, Falaschi Z, Filippone F, Pasché A, Bebeti A, Leigheb M, Cantello R, Mazzini L. Detection of White Matter Ultrastructural Changes for Amyotrophic Lateral Sclerosis Characterization: A Diagnostic Study from Dti-Derived Data. Brain Sciences. 2020; 10(12):996. https://0-doi-org.brum.beds.ac.uk/10.3390/brainsci10120996
Chicago/Turabian StyleDe Marchi, Fabiola, Alessandro Stecco, Zeno Falaschi, Francesco Filippone, Alessio Pasché, Alen Bebeti, Massimiliano Leigheb, Roberto Cantello, and Letizia Mazzini. 2020. "Detection of White Matter Ultrastructural Changes for Amyotrophic Lateral Sclerosis Characterization: A Diagnostic Study from Dti-Derived Data" Brain Sciences 10, no. 12: 996. https://0-doi-org.brum.beds.ac.uk/10.3390/brainsci10120996