
Influence of Heart Rate Variability on Abstinence-Related Changes in Brain State in Everyday Drinkers

 ,
,
Abstract
:1. Introduction
2. Materials and Methods
2.1. Study Overview
2.2. Participants
2.3. Heart Rate Assessment and Data Processing for RSA Calculation
2.4. Brain Imaging and Functional Brain Network Analysis
2.4.1. MRI Study Visits
2.4.2. Image Collection
2.4.3. Image Processing and Network Generation
2.4.4. Statistical Analysis and Mixed-Effects Modeling Framework
3. Results
4. Discussion
5. Conclusions
Supplementary Materials
Author Contributions
Funding
Institutional Review Board Statement
Informed Consent Statement
Data Availability Statement
Conflicts of Interest
References
- GBD. Alcohol use and burden for 195 countries and territories 1990–2016: A systematic analysis for the Global Burden of Disease Study 2016. Lancet 2018, 392, 1015–1035. [Google Scholar] [CrossRef]
- Breese, G.R.; Chu, K.; Dayas, C.V.; Funk, D.; Knapp, D.J.; Koob, G.F.; Lê, D.A.; O’Dell, L.E.; Overstreet, D.H.; Roberts, A.J.; et al. Stress enhancement of craving during sobriety: A risk for relapse. Alcohol. Clin. Exp. Res. 2006, 29, 185–195. [Google Scholar] [CrossRef]
- Brown, S.; Vik, P.W.; Patterson, T.L.; Grant, I.; A Schuckit, M. Stress, vulnerability and adult alcohol relapse. J. Stud. Alcohol. 1995, 56, 538–545. [Google Scholar] [CrossRef]
- Marlatt, G.A. Taxonomy of high-risk situations for alcohol relapse: Evolution and development of a cognitive behavioral model. Addiction 1996, 91, S37–S49. [Google Scholar] [CrossRef] [PubMed]
- Walitzer, K.S.; Dearing, R.L. Gender differences in alcohol and substance use relapse. Clin. Psychol. Rev. 2006, 26, 128–148. [Google Scholar] [CrossRef] [PubMed]
- Miller, N.S.; Gold, M.S. Dissociation of “Conscious Desire” (Craving) from and Relapse in Alcohol and Cocaine Dependence. Ann. Clin. Psychiatry 2011, 6, 99–106. [Google Scholar] [CrossRef] [PubMed]
- Porges, S.W. Orienting in a defensive world: Mammalian modifications of our evolutionary heritage. A Polyvagal Theory. Psychophysiology 1995, 32, 301–318. [Google Scholar] [CrossRef] [PubMed]
- Porges, S.W. The Polyvagal Theory: Neurophysiological Foundations of Emotions, Attachment, Communication, Self-Regulation, 1st ed.; W.W. Norton & Company, Inc.: New York, NY, USA, 2011. [Google Scholar]
- Porges, S.W.; Bohrer, R.E. The Analysis of Periodic Processes in Psychophysiological Research, in PRINCIPLES of Psychophysiology: Physical. Social, and Inferential Elements; Cambridge University Press: Cambridge, UK, 1990; pp. 708–753. [Google Scholar]
- Lü, W.; Wang, Z.; You, X. Physiological responses to repeated stress in individuals with high and low trait resilience. Biol. Psychol. 2016, 120, 46–52. [Google Scholar] [CrossRef] [PubMed]
- Butler, E.A.; Willhelm, H.F.; Gross, J.J. Respiratory sinus arrhythmia, emotion, and emotion regulation during social interaction. Psychophysiology 2006, 43, 612–622. [Google Scholar] [CrossRef]
- Ashare, R.; Sinha, R.; Lampert, R.; Weinberger, A.H.; Anderson, G.M.; Lavery, M.E.; Yanagisawa, K.; McKee, S.A. Blunted vagal reactivity predicts stress-precipitated tobacco smoking. Psychopharmacology 2012, 220, 259–268. [Google Scholar] [CrossRef] [PubMed]
- Quintana, D.S.; Guastella, A.J.; McGregor, I.S.; Hickie, I.B.; Kemp, A.H. Heart rate variability predicts alcohol craing in alcohol dependent outpatients: Further evidence for HRV as a psychophysiological marker of self-regulation. Drug Alcohol Depend. 2013, 132, 395–398. [Google Scholar] [CrossRef] [PubMed]
- Quintana, D.S.; Guastella, A.J.; Mcgregor, I.; Hickie, I.B.; Kemp, A.H. Moderate alcohol intake is related to increased heart rate variability in young adults: Implications for health and well-being. Psychophysiology 2013, 50, 1202–1208. [Google Scholar] [CrossRef]
- Pietilä, J.; Helander, E.; Korhonen, I.; Myllymäki, T.; Kujala, U.M.; Lindholm, H. Acute effect of alcohol intake on cardiovascular autonomic regulation during the first hours of sleep in a large real-world sample of Finnish employees: Observational study. JMIR Ment. Health 2018, 5, e23. [Google Scholar] [CrossRef] [PubMed]
- Vatsalya, V.; Momenan, R.; Hommer, D.W.; Ramchandani, V.A. Cardiac reactivity during the ascending phase of acute intravenous alcohol exposure and association with subjective perceptions of intoxication in social drinkers. Alcohol Clin. Exp. Res. 2014, 38, 1247–1254. [Google Scholar] [CrossRef]
- Mayhugh, R.E.; Laurienti, P.J.; Fanning, J.; Gauvin, L.; Heilman, K.J.; Porges, S.W.; Rejeski, W.J. Cardiac vagal dysfunction moderates patterns of craving across the day in moderate to heavy consumers of alcohol. PLoS ONE 2018, 13, e0200424. [Google Scholar] [CrossRef] [PubMed]
- Muralidharan, K.; Benegal, V.; Gangadhar, B.N.; Ganesha, S.; Thirthalli, J. Heart rate variability during sleep in detoxified alcohol-dependent males: A comparison with healthy controls. Indian J. Psychiatry 2013, 55, 173–177. [Google Scholar] [CrossRef]
- Cheng, Y.C.; Huang, Y.C.; Huang, W.L. Heart rate variability as a potential biomarker for alcohol use disorders: A systematic review and meta-analysis. Drug Alcohol Depend. 2019, 204, 107502. [Google Scholar] [CrossRef]
- Ralevski, E.; Petrakis, I.; Altemus, M. Heart rate variabilty in alcohol use: A review. Pharmacol. Biochem. Behav. 2019, 176, 83–92. [Google Scholar] [CrossRef]
- Romero-Martinez, A.; Vitoria-Estruch, S.; Moya-Albiol, L. Emotional and autonomic dysregualation in abstinent alcoholic men: An idiosyntratic profile? Alcohol 2019, 77, 155–162. [Google Scholar] [CrossRef]
- Porges, S.W. Cardiac vagal tone: A physiological index of stress. Neurosci. Biobehav. Rev. 1995, 19, 225–233. [Google Scholar] [CrossRef]
- Porges, S.W.; Byrne, E.A. Research methods for measurement of heart-rate and respiration. Biol. Psychol. 1992, 34, 93–130. [Google Scholar] [CrossRef]
- Thayer, J.F.; Hansen, A.; Saus-Rose, E.; Johnsen, B.H. Heart rate variability, prefrontal neural function, and cognitive performance: The neurovisceral integration perspective on self-regulation, adaptation, and health. Ann. Behav. Med. 2009, 37, 141–153. [Google Scholar] [CrossRef]
- Stange, J.P.; Hamilton, J.; Fresco, D.; Alloy, L. Flexible parasympathetic responses to sadness facilitate spontaneous affect regulation. Psychophysiology 2017, 54, 1054–1069. [Google Scholar] [CrossRef]
- Hess, W. The Central Control of the Activity of Internal Organs; 1949; Nobel Media AB: Oslo, Sweden, 2020. [Google Scholar]
- Koob, G.F.; Volkow, N.D. Neurocircuitry of addiction. Neuropsychopharmacology 2010, 35, 217–238. [Google Scholar] [CrossRef]
- Van Thiel, D.H. Ethanol: Its adverse effects upon the hypothalamic-pituitary-gonadal axis. J. Lab. Clin. Med. 1983, 101, 21–33. [Google Scholar]
- Mayhugh, R.E.; Rejeski, W.J.; Petrie, M.R.; Laurienti, P.J.; Gauvin, L. Differing patterns of stress and craving across the day in moderate-heavy alcohol consumers during their typical drinking routine and an imposed period of alcohol abstinence. PLoS ONE 2018, 13, e0195063. [Google Scholar] [CrossRef] [PubMed]
- Bühler, M.; Mann, K. Alcohol and the human brain: A systematic review of different neuroimaging methods. Alcohol. Clin. Exp. Res. 2011, 35, 1771–1793. [Google Scholar] [CrossRef]
- Holla, B.; Panda, R.; Venkatasubramanian, G.; Biswal, B.; Bharath, R.D.; Benegal, V. Disrupted resting brain graph measures in individuals at high risk for alcoholism. Psychiatry Res. Neuroimaging 2017, 30, 54–64. [Google Scholar] [CrossRef]
- Müller-Oehring, E.M.; Jung, Y.-C.; Pfefferbaum, A.; Sullivan, E.V.; Schulte, T. The resting brain of alcoholics. Cereb. Cortex 2015, 25, 4155–4168. [Google Scholar] [CrossRef] [PubMed]
- Sjoerds, Z.; Stufflebeam, S.M.; Veltman, D.J.; Brink, W.V.D.; Penninx, B.W.J.H.; Douw, L. Loss of brain graph network efficiency in alcohol dependence. Addict. Biol. 2017, 22, 523–534. [Google Scholar] [CrossRef] [PubMed]
- Bullmore, E.; Sporns, O. Complex brain networks: Graph theoretical analysis of structural and functional systems. Nat. Rev. Neurosci. 2009, 10, 186–198. [Google Scholar] [CrossRef]
- NIAAA. Drinking Levels Defined; NIAAA: Bethesda, MD, USA, 2011.
- CDC. Vital signs: Binge drinking prevalence, frequency, and intensity among adults-United States, 2010. Morb. Mortal. Wkly. Rep. (MMWR) 2012, 61, 14–19. [Google Scholar]
- Vakili, S.; Sobell, L.C.; Sobell, M.; Simco, E.; Agrawal, S. Using the Timeline Followback to determine time windows representative of annual alcohol consumption with probelm drinkers. Addict. Behav. 2008, 33, 1123–1130. [Google Scholar] [CrossRef] [PubMed]
- Radloff, L.S. The CES-D scale: A self report depression scale for research in the general population. Appl. Psychol. Meas. 1977, 1, 385–401. [Google Scholar] [CrossRef]
- Wang, M.Q.; Nicholson, M.E.; Jones, C.S.; Fitzhugh, E.C.; Westerfield, C.R. Acute alcohol intoxication, body composition, and pharmacokinetics. Pharmacol. Biochem. Behav. 1992, 43, 641. [Google Scholar] [CrossRef]
- Porges, S.W. Method and Apparatus for Evaluating Rhythmic Oscillations in Aperiodic Physiological Response Systems. U.S. Patent 4510944, 16 April 1985. [Google Scholar]
- Lewis, G.; Furman, S.A.; McCool, M.F.; Porges, S.W. Statistical strategies to quantify respiratory sinus arrhythmia: Are commonly used metrics equivalent? Biol. Psychol. 2012, 89, 349–364. [Google Scholar] [CrossRef] [PubMed]
- Rinolo, T.; Porges, S.W. Inferential and descriptive influcences on measures of respiratory sinus arrhythmia: Samping rate, R-wave trigger accuracy, and variance estimates. Psychophysiology 1997, 34, 613–621. [Google Scholar] [CrossRef]
- Statham, D.J.; Connor, J.P.; Kavanagh, D.J.; Feeney, G.F.X.; Young, R.M.D.; May, J.; Andrade, J. Measuring alcohol craving: Development of the Alcohol Craving Experience questionnaire. Addiction 2011, 106, 1230–1238. [Google Scholar] [CrossRef]
- Cohen, S.; Kamarck, T.; Mermelstein, R. A global measure of percieved stress. J. Health Soc. Behav. 1983, 24, 385. [Google Scholar] [CrossRef]
- Julian, L.J. Measures of anxiety: State-Trait Anxiety Inventory (STAI), Beck Anxiety Inventory (BAI), and Hospital Anxiety and Depression Scale-Anxiety (HADS-A). Arthritis Care Res. 2011, 63, S467–S472. [Google Scholar] [CrossRef]
- Walach, H.; Buchheld, N.; Buttenmüller, V.; Kleinknecht, N.; Schmidt, S. Measuring Mindfulness–The Freiburg Mindfulness Inventory (FMI). Personal. Individ. Differ. 2006, 40, 1543–1555. [Google Scholar] [CrossRef]
- Brown, K.W.; Ryan, R.M. The benefits of being present: Mindfulness and its role in psychological well-being. J. Personal. Soc. Psychol. 2003, 84, 822–848. [Google Scholar] [CrossRef]
- Sullivan, J.T.; Sykora, K.; Schneiderman, J.; Naranjo, C.A.; Sellers, E. Assessment of alcohol withdrawal: The revised Clinical Institute Withdrawal Assessment for alcohol scale (CIWA-Ar). Br. J. Addict. 1989, 84, 1353–1357. [Google Scholar] [CrossRef] [PubMed]
- Ashburner, J.; Friston, K.J. Unified segmentation. Neuroimage 2005, 26, 839–851. [Google Scholar] [CrossRef] [PubMed]
- Kabani, N.J.; MacDonald, D.J.; Holmes, C.J.; Evans, A.C. 3D anatomical atlas of the human brain. Neuroimage 1998, 7, S717. [Google Scholar] [CrossRef]
- Avants, B.B.; Tustison, N.; Song, G. Advanced Normalization Tools (ANTS); Penn Image Computing And Science Laboratory: Philadelphia, PA, USA, 2011. [Google Scholar]
- Shen, X.; Tokoglu, F.; Papademetris, X.; Constable, R.T. Groupwise whole-brain parcellation from resting-state fMRI data for network node identification. NeuroImage 2013, 812, 403–415. [Google Scholar] [CrossRef]
- Biswal, B.; Yetkin, F.Z.; Haughton, V.M.; Hyde, J.S. Functional connectivity in teh motor cortex of resting human brain using echo-planar MRI. Magn. Reson. Med. 1995, 34, 537–541. [Google Scholar] [CrossRef] [PubMed]
- Powers, J.D.; Barnes, K.A.; Snyder, A.Z.; Schlaggar, B.L.; Petersen, S.E. Spurious but systemic correlations in functional connectivity MRI networks arise from subject motion. Neuroimage 2012, 59, 214202154. [Google Scholar]
- Bahrami, M.; Laurienti, P.J.; Simpson, S.L. A MATLAB toolbox for multivariate analysis of brain networks. Hum. Brain Mapp. 2018, 40, 175–186. [Google Scholar] [CrossRef]
- Simpson, S.L.; Laurienti, P.J. A two-part mixed-effects modeling framework for analyzing whole-brain network data. Neuroimage 2015, 113, 310–319. [Google Scholar] [CrossRef] [PubMed]
- Simpson, S.L.; Bahrami, M.; Laurienti, P.J. A mixed-modeling framework for analyzing multitask whole-brain network data. Netw. Neurosci. 2019, 3, 307–324. [Google Scholar] [CrossRef] [PubMed]
- Bahrami, M.; Laurienti, P.J.; Quandt, S.A.; Talton, J.; Pope, C.N.; Summers, P.; Burdette, J.H.; Chen, H.; Liu, J.; Howard, T.D.; et al. The impacts of pesticide and nicotine exposures on functional brain networks in Latino immigrant workers. Neurotoxicology 2017, 62, 138–150. [Google Scholar] [CrossRef] [PubMed]
- Benjamini, Y.; Hochberg, Y. On the adaptive control fo the false discovery rate in multiple testing with independent statistics. J. Educ. Behav. Stat. 2000, 25, 60–83. [Google Scholar] [CrossRef]
- Newman, M.E.; Girvan, M. Finding and evaluating community structure in networks. Phys. Rev. E Stat. Nonlinear Soft Matter Phys. 2004, 69, 026113. [Google Scholar] [CrossRef]
- Demeersman, R.E. Aging as a moderator of respiratory sinus arrhythmia. J. Gerontol. 1993, 48, B74–B78. [Google Scholar] [CrossRef] [PubMed]
- Seo, D.; Jia, Z.; Lacadie, C.M.; Tsou, K.A.; Bergquist, K.; Sinha, R. Sex differences in neural responses to stress and alcohol context cues. Hum. Brain Mapp. 2011, 32, 1998–2013. [Google Scholar] [CrossRef]
- Strogatz, S.H. From Kuramoto to Crawford: Exploring the onset of synchronization in populations of coupled oscillators. Phys. D 2000, 143, 1–20. [Google Scholar] [CrossRef]
- Buzsáki, G. Rhythms of the Brain; Oxford University Press: Oxford, UK; New York, NY, USA, 2006. [Google Scholar]
- Csermely, P. Weak Links: Stabilizers of Complex Systems from Proteins to Social Networks; Dragoman, D., Elitzur, A.C., Silverman, M.P., Tuszynski, J., Zeh, H.D., Eds.; The Frontiers Series; Springer: Berlin, Germany, 2006; p. 410. [Google Scholar]
- Granovetter, M. The strength of weak ties. Am. J. Sociol. 1973, 78, 1360–1380. [Google Scholar] [CrossRef]
- Watts, D.J.; Strogatz, S.H. Collective dynamics of ‘small-world’ networks. Nature 1998, 393, 440–442. [Google Scholar] [CrossRef]
- Romanowicz, M.; Schmidt, J.E.; Bostwick, J.M.; Mrazek, D.A.; Karpyak, V.M. Changes in heart rate variability associated with acute alcohol consumption: Current knowledge and implications for practice and research. Alcohol. Clin. Exp. Res. 2011, 35, 1–14. [Google Scholar] [CrossRef]
- Ellenbroek, B.A. Chapter 13-Heart rate variability as a translational biomarker for emotional and cognitive deficits. Handb. Behav. Neurosci. 2019, 29, 199–212. [Google Scholar]
- Heilman, K.J.; Connolly, S.D.; Padilla, W.O.; Wrzosek, M.I.; Graczyk, P.A.; Porges, S.W. Sluggish vagal brake reactivity to physical exercise challenge in children with selective mutism. Dev. Psychopathol. 2012, 24, 241–250. [Google Scholar] [CrossRef] [PubMed]
- Mendelson, S.D. 6-Depression, metabolic syndrome, and heart disease. Metab. Syndr. Psychiatr. Illn. 2008, 93–103. [Google Scholar] [CrossRef]
- Schwartz, P.J.; Crotti, L.; Insolia, R. Long QT Syndrome: From genetics to management. Circ. Arrhythm. Electrophysiol. 2012, 5, 868–877. [Google Scholar] [CrossRef] [PubMed]
- Billman, G.E.; Schwartz, P.J.; Stone, H.L.S. Baroreceptor reflex control of heart rate: A predictor of sudden cardiac death. Circulation 1982, 66, 874–880. [Google Scholar] [CrossRef]
- Porta, A.; Girardengo, G.; Bari, V.; George, A.L.; Brink, P.A.; Goosen, A.; Crotti, L.; Schwartz, P.J. Autonomic control of heart rate and of QT interval variability influences arrhythmic risk in Long QT Syndrome Type 1. J. Am. Coll. Cardiol. 2015, 65, 367–374. [Google Scholar] [CrossRef] [PubMed]
- del Paso, G.A. A between-subjects comparison of respiratory sinus arrhythmia and baroreceptor cardiac reflex sensitivity as non-invasive measures of tonic parasympathetic cardiac control. Int. J. Psychophysiol. 1996, 22, 163–171. [Google Scholar] [CrossRef]
- Taylor, C.E.; Witter, T.; El Sayed, K.; Hissen, S.L.; Johnson, A.W.; Macefield, V.G. Relationship between spontaneous sympathetic baroreflex sensitivity and cardiac baroreflex sensitivity in healthy young individuals. Physiol. Rep. 2015, 3, e12536. [Google Scholar] [CrossRef]
- Pichon, A.; Nuissier, F.; Chapelot, D. Heart rate variability and depressed mood in physical education students: A longitudinal study. Auton. Neurosci. Basic Clin. 2010, 156, 117–123. [Google Scholar] [CrossRef]
- Forte, G.; Favieri, F.; Casagrande, M. Heart Rate Variability and Cognitive Function: A Systematic Review. Front. Neurosci. 2019, 13, 710. [Google Scholar] [CrossRef] [PubMed]
- Thayer, J.F.; Lane, R.D. A model of neurovisceral integration in emotion regulation and dysregulation. J. Affect. Disord. 2000, 61, 201–216. [Google Scholar] [CrossRef]
- Julian, T.H.; Syeed, R.; Glascow, N.; Zis, P. Alcohol-induced autonomic dysfunction: A systematic review. Clin. Auton. Res. 2020, 30, 29–41. [Google Scholar] [CrossRef] [PubMed]


| Variable | Overall (n = 29) | Male (n = 13) | Female (n = 16) |
|---|---|---|---|
| Age | 38.8 (10.9) [24–60] | 36.6 (6.6) [24–46] | 40.5 (13.3) [24–60] |
| BMI | 24.8 (3.8) [18.9–39] | 25.6 (3.5) [20.4–33.4] | 24.2 (4.0) [18.9–39] |
| Race n (%) | |||
| African American or Black | 2 (6.89%) | 2 (15.38%) | 0 |
| Asian | 1 (3.45%) | 1 (8.34%) | 0 |
| White | 26 (89.66%) | 10 (83.34%) | 16 (100%) |
| Alcohol Use | |||
| Total Years Drinking | 18.9 (10.8) [4–40] | 17.3 (7.2) [6–30] | 20.1 (13.1) [4–40] |
| Timeline Followback 1 | |||
| Percent of Days that were Drinking Days | 81.2% (16.0) [55–100%] | 78.6% (16.4) [55.21–100%] | 83.4% (15.8) [55–100%] |
| Average Drinks Consumed on Drinking Days | 2.3 (0.73) [1.02–5.43] | 2.4 (0.26) [2.02–2.78] | 2.3 (0.96) [1.02–3.88] |
| Cardiac Vagal Tone | |||
| PBRSA | 5.8 (1.69) [0.44–7.90] | 6.0 (0.93) [4.44–7.49] | 5.6 (2.13) [0.44–7.90] |
| Effect | Estimate | Standard Error | Adaptive FDR p-Value |
|---|---|---|---|
| Intercept | 0.2340 | 0.004659 | <0.0001 |
| Drinking State | −0.01502 | 0.005259 | 0.0133 |
| PBRSA-rest | −0.00994 | 0.004340 | 0.0616 |
| Drinking State*PBRSA-rest | 0.01180 | 0.006157 | 0.1106 |
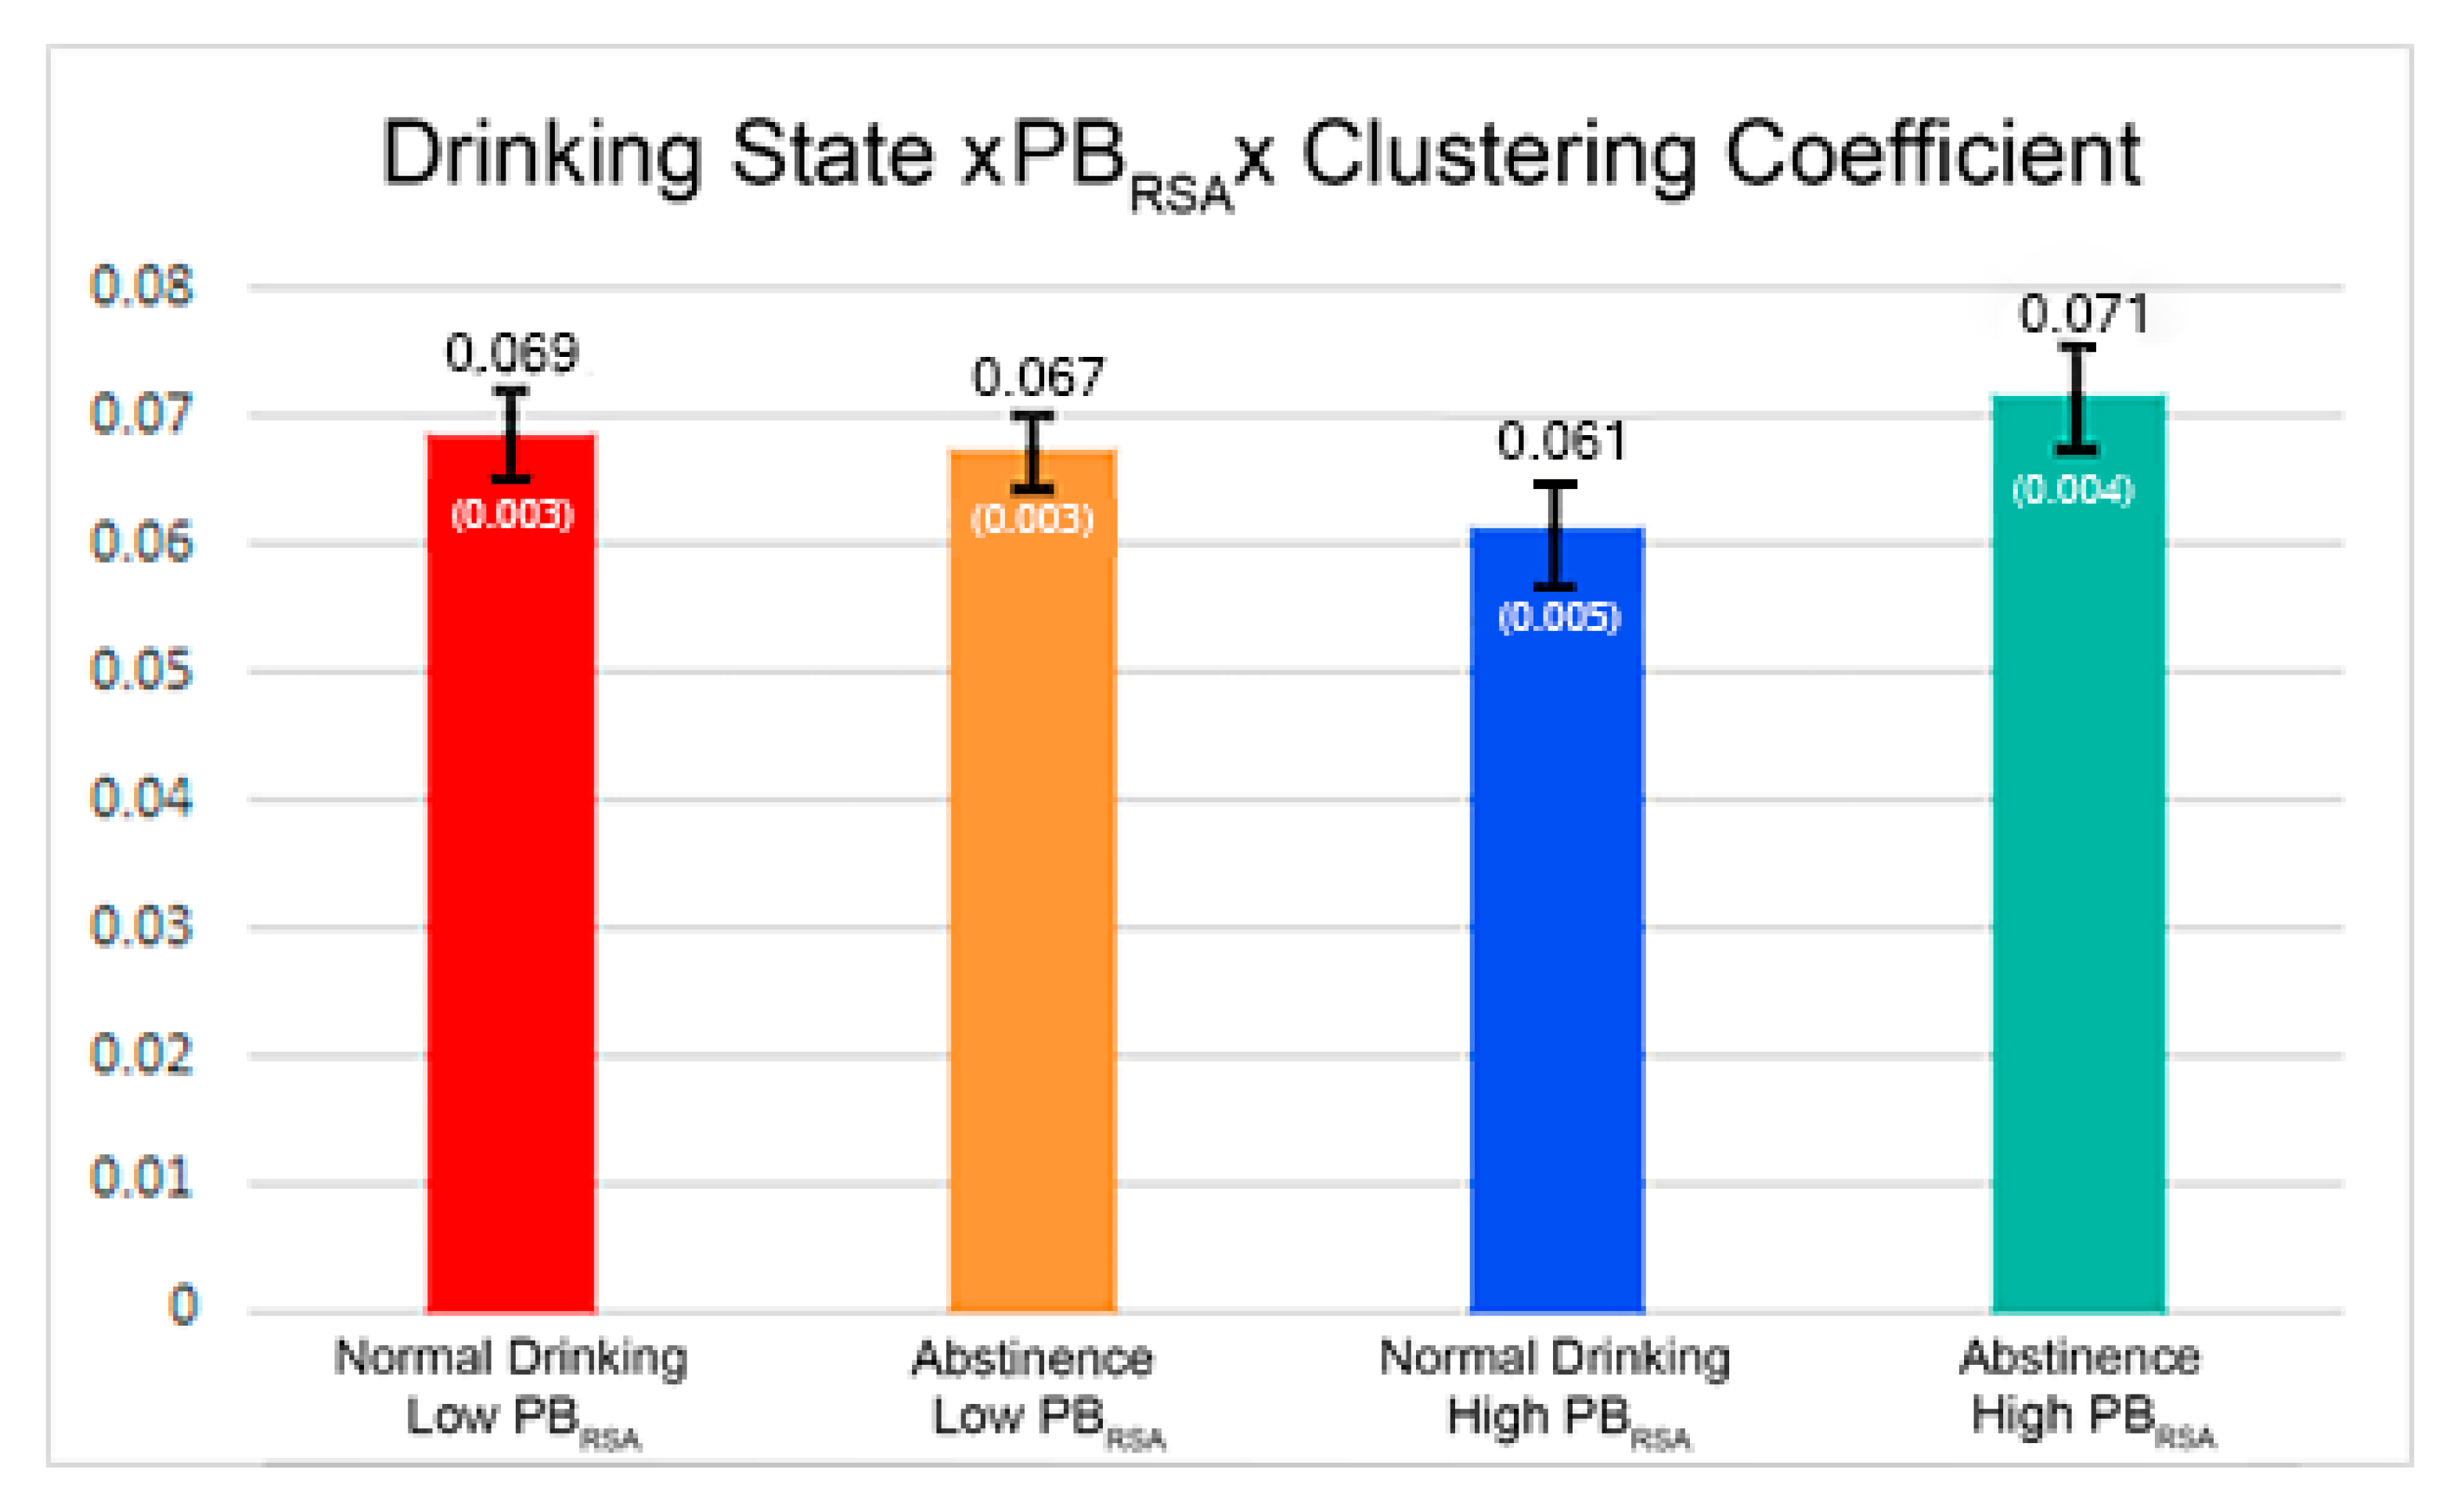
| Clustering Coefficient | 0.06825 | 0.002450 | <0.0001 |
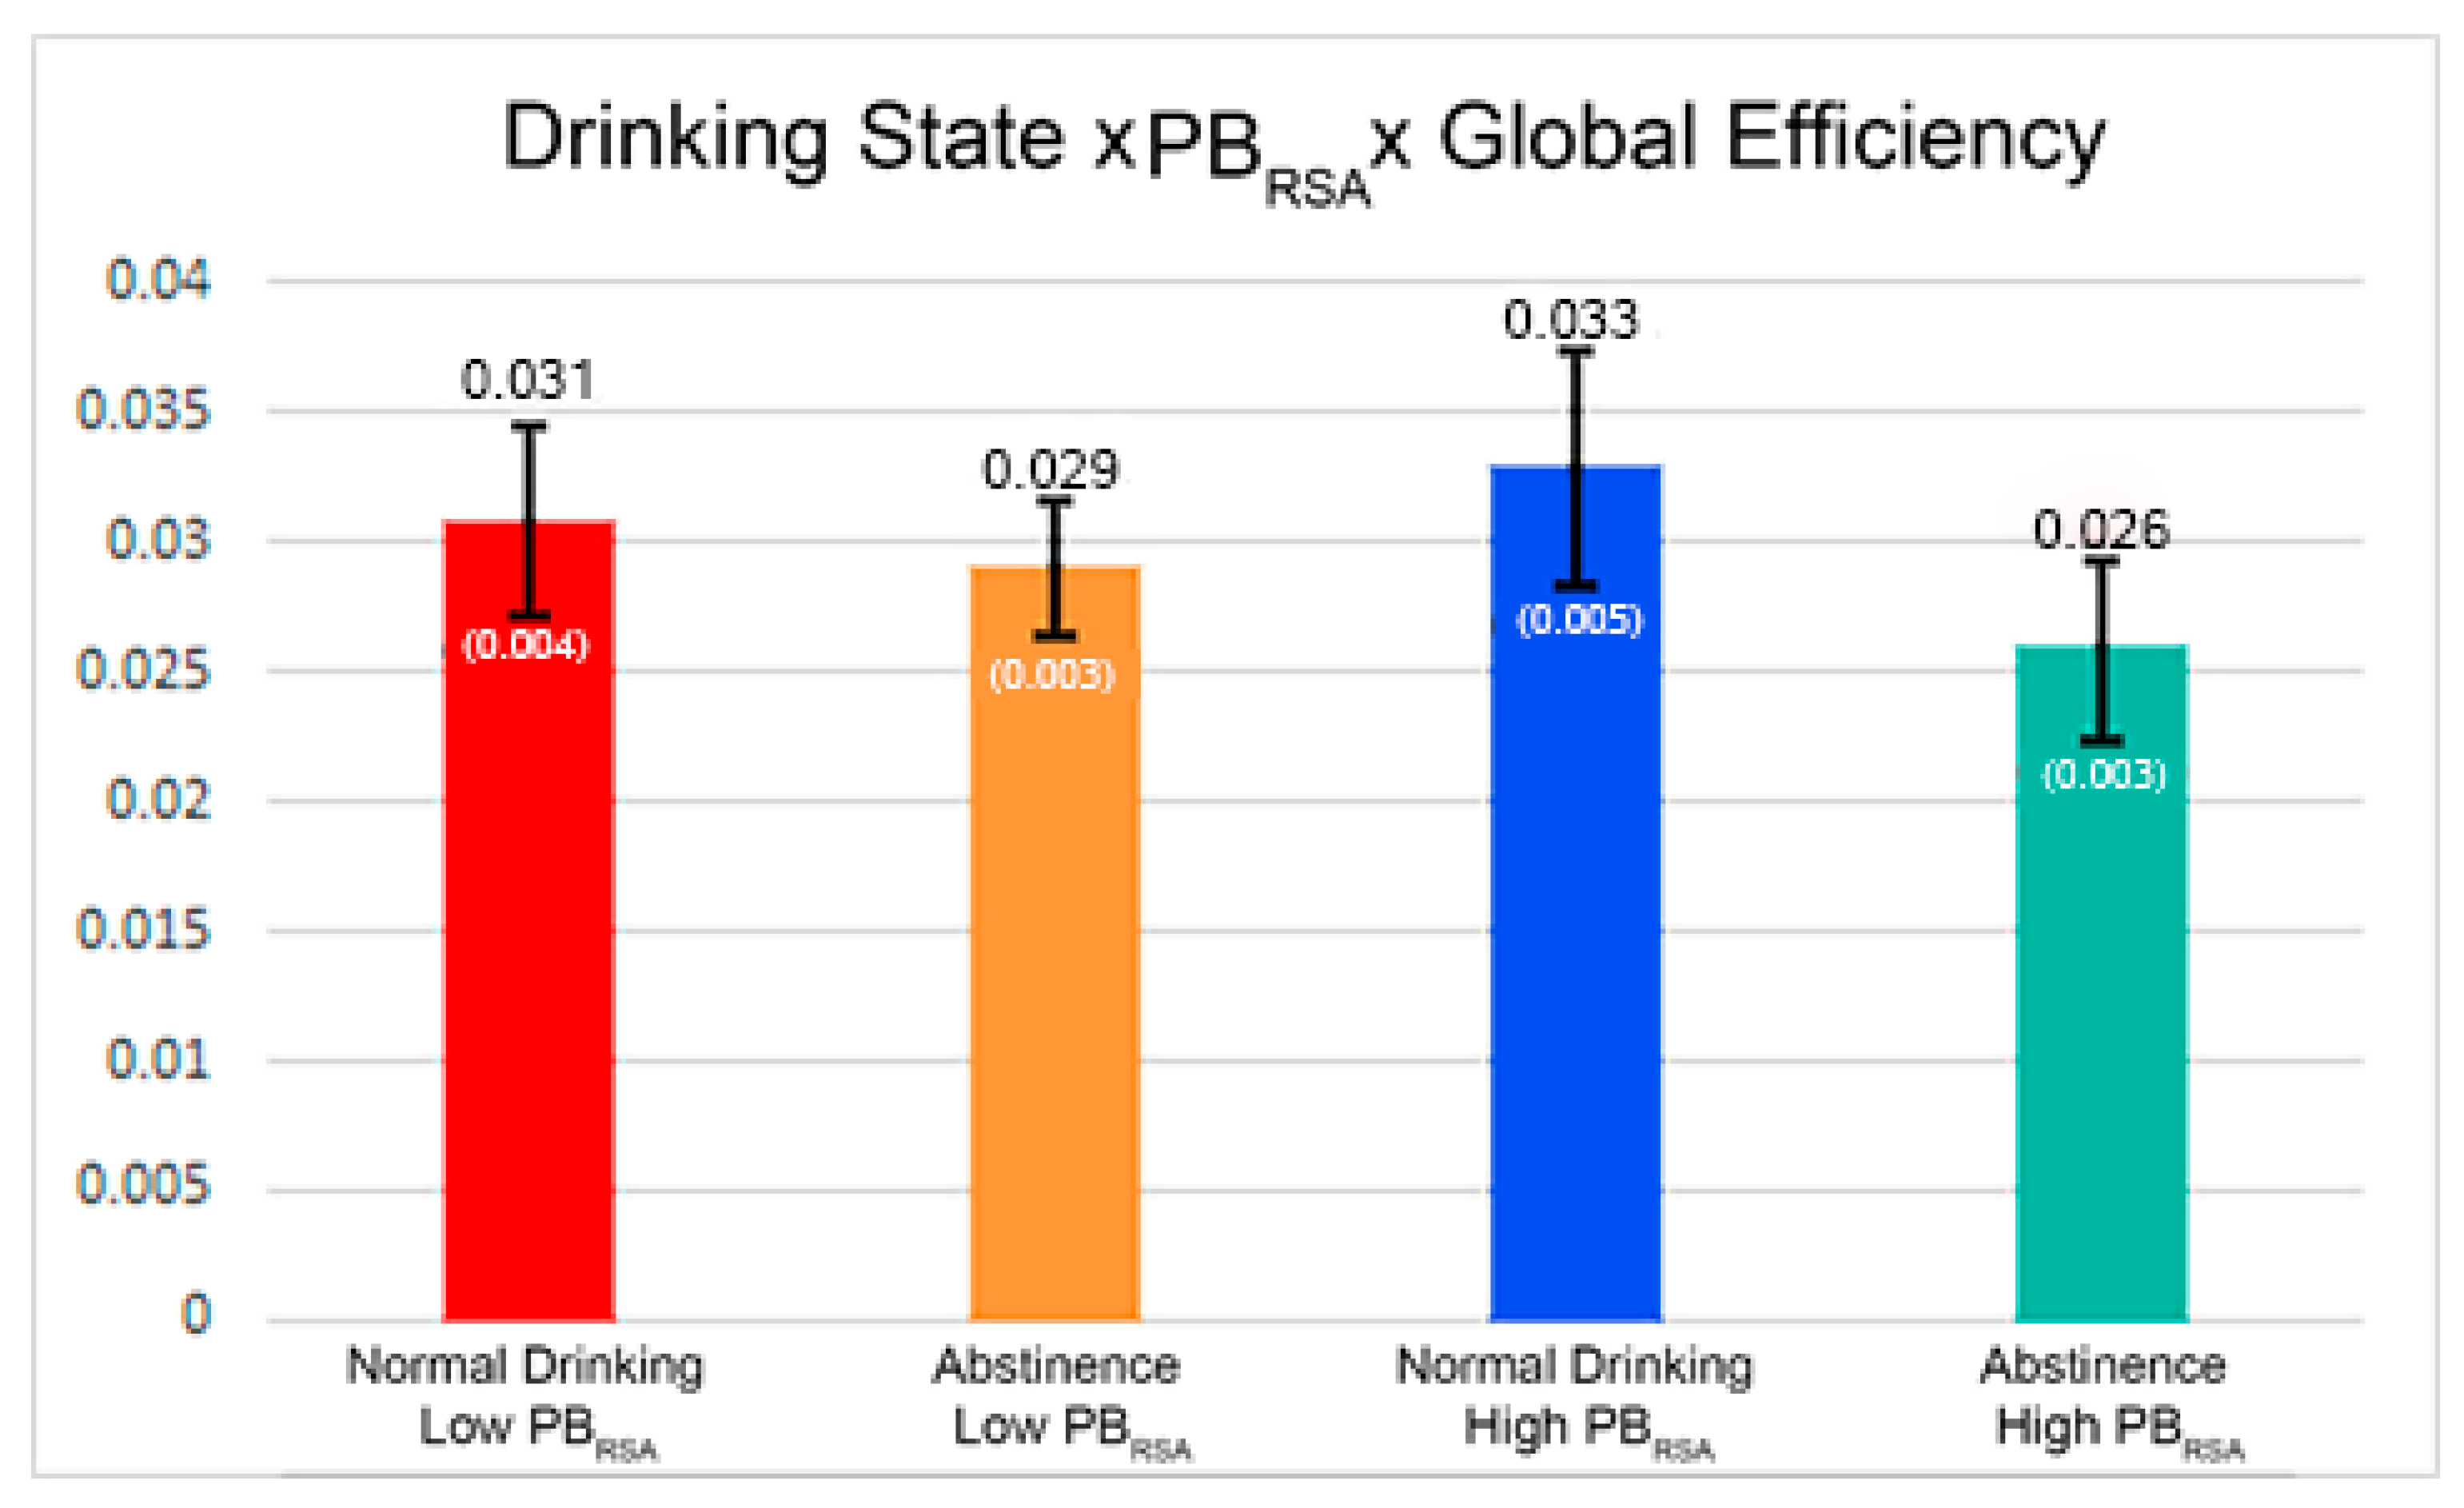
| Global Efficiency | 0.02923 | 0.002528 | <0.0001 |
| Clustering Coefficient*Drinking State | 0.001887 | 0.003163 | 0.5509 |
| Global Efficiency*Drinking State | −0.00456 | 0.003046 | 0.1981 |
| Clustering Coefficient*PBRSA-rest | −0.00532 | 0.002651 | 0.0967 |
| Global Efficiency*PBRSA-rest | 0.000041 | 0.002713 | 0.9879 |
| Clustering Coefficient*Drinking State*PBRSA-rest | 0.01186 | 0.003357 | 0.0014 |
| Global Efficiency*Drinking State*PBRSA-rest | −0.00518 | 0.003226 | 0.1749 |
| Age | −0.00116 | 0.003233 | 0.7187 |
| Sex | −0.00012 | 0.005968 | 0.9843 |
| BMI | −0.00348 | 0.003519 | 0.3786 |
Publisher’s Note: MDPI stays neutral with regard to jurisdictional claims in published maps and institutional affiliations. |
© 2021 by the authors. Licensee MDPI, Basel, Switzerland. This article is an open access article distributed under the terms and conditions of the Creative Commons Attribution (CC BY) license (https://creativecommons.org/licenses/by/4.0/).
Share and Cite
Peterson, H.; Mayhugh, R.E.; Bahrami, M.; Rejeski, W.J.; Simpson, S.L.; Heilman, K.; Porges, S.W.; Laurienti, P.J. Influence of Heart Rate Variability on Abstinence-Related Changes in Brain State in Everyday Drinkers. Brain Sci. 2021, 11, 817. https://0-doi-org.brum.beds.ac.uk/10.3390/brainsci11060817
Peterson H, Mayhugh RE, Bahrami M, Rejeski WJ, Simpson SL, Heilman K, Porges SW, Laurienti PJ. Influence of Heart Rate Variability on Abstinence-Related Changes in Brain State in Everyday Drinkers. Brain Sciences. 2021; 11(6):817. https://0-doi-org.brum.beds.ac.uk/10.3390/brainsci11060817
Chicago/Turabian StylePeterson, Hope, Rhiannon E. Mayhugh, Mohsen Bahrami, Walter Jack Rejeski, Sean L. Simpson, Keri Heilman, Stephen W. Porges, and Paul J. Laurienti. 2021. "Influence of Heart Rate Variability on Abstinence-Related Changes in Brain State in Everyday Drinkers" Brain Sciences 11, no. 6: 817. https://0-doi-org.brum.beds.ac.uk/10.3390/brainsci11060817