
Impaired Arithmetic Fact Retrieval in an Adult with Developmental Dyscalculia: Evidence from Behavioral and Functional Brain Imaging Data


Abstract
:1. Introduction
1.1. Neural Networks for Arithmetic
1.2. Developmental Dyscalculia
1.3. The Current Study
2. Materials and Methods
2.1. Participants
2.1.1. Single Case
2.1.2. Control Group
2.2. Stimuli
2.2.1. Background Measures
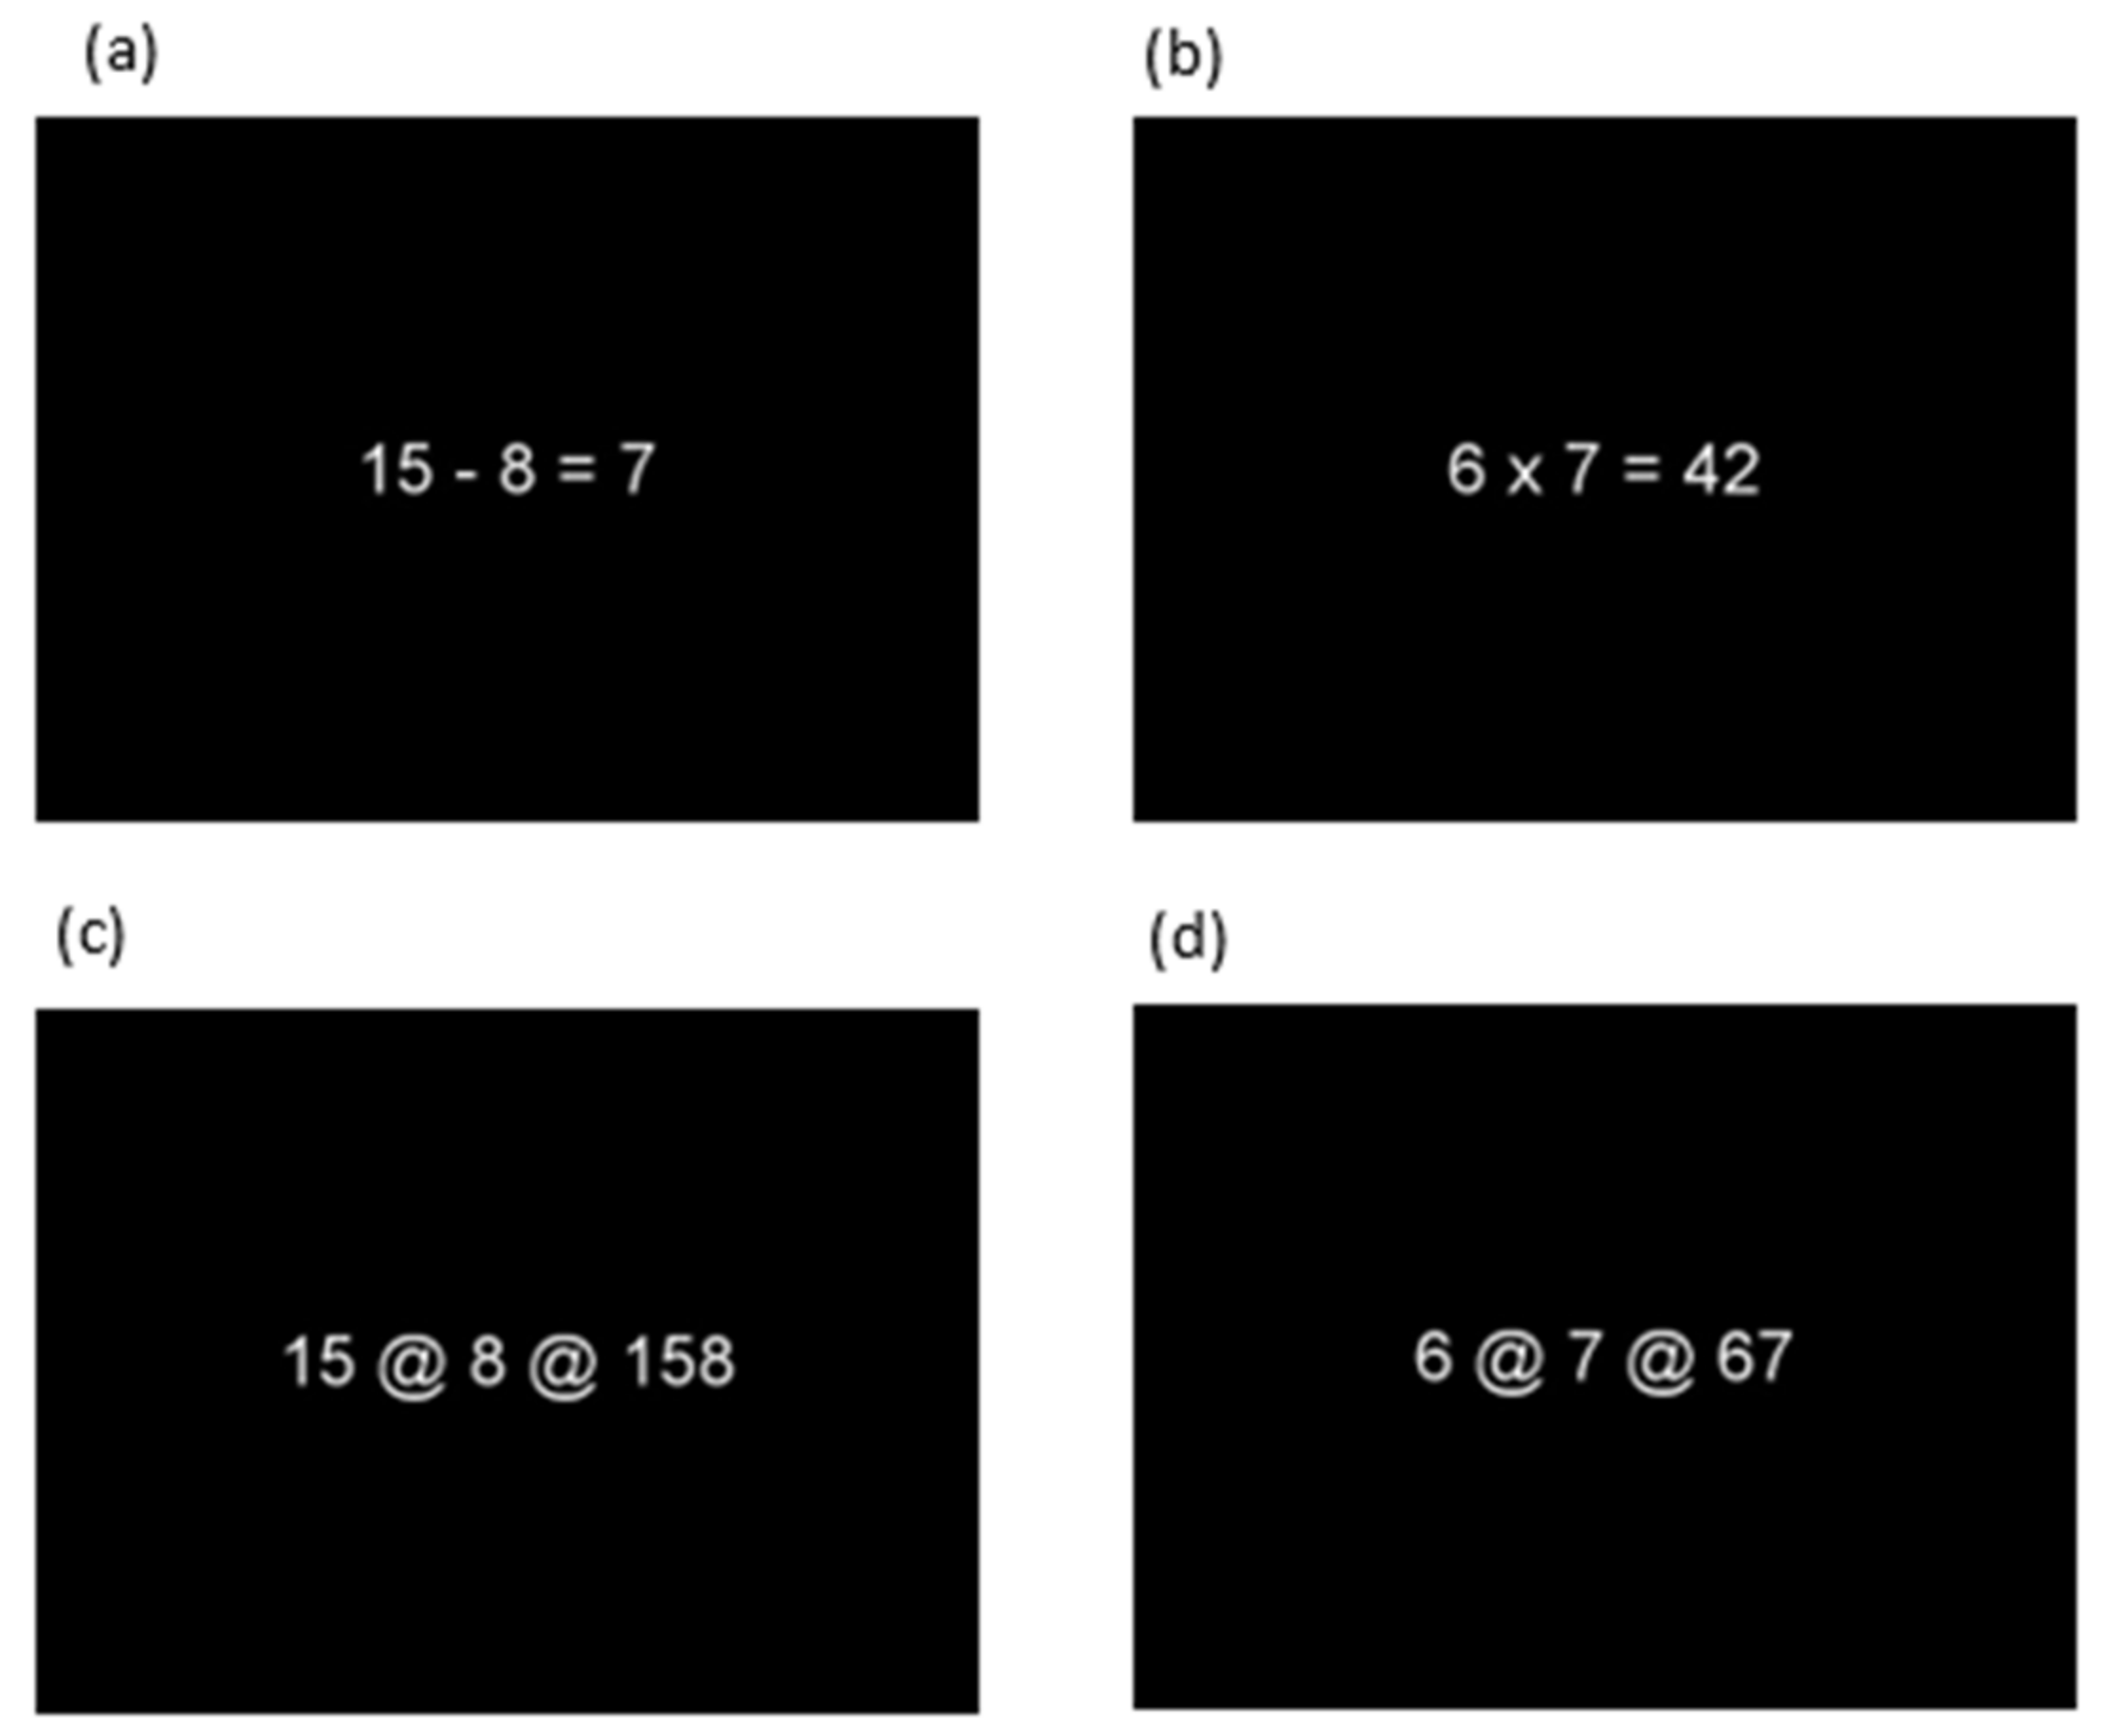
2.2.2. fMRI Tasks
2.2.3. MRI/fMRI Acquisition
2.3. Procedure
2.4. Data Analyses
2.4.1. Behavioral Analyses
2.4.2. fMRI Analysis
3. Results
3.1. Behavioral Results
3.1.1. Background Measures
3.1.2. Behavioral Results of the Calculation Tasks Performed in the fMRI Scanner
3.2. fMRI Results
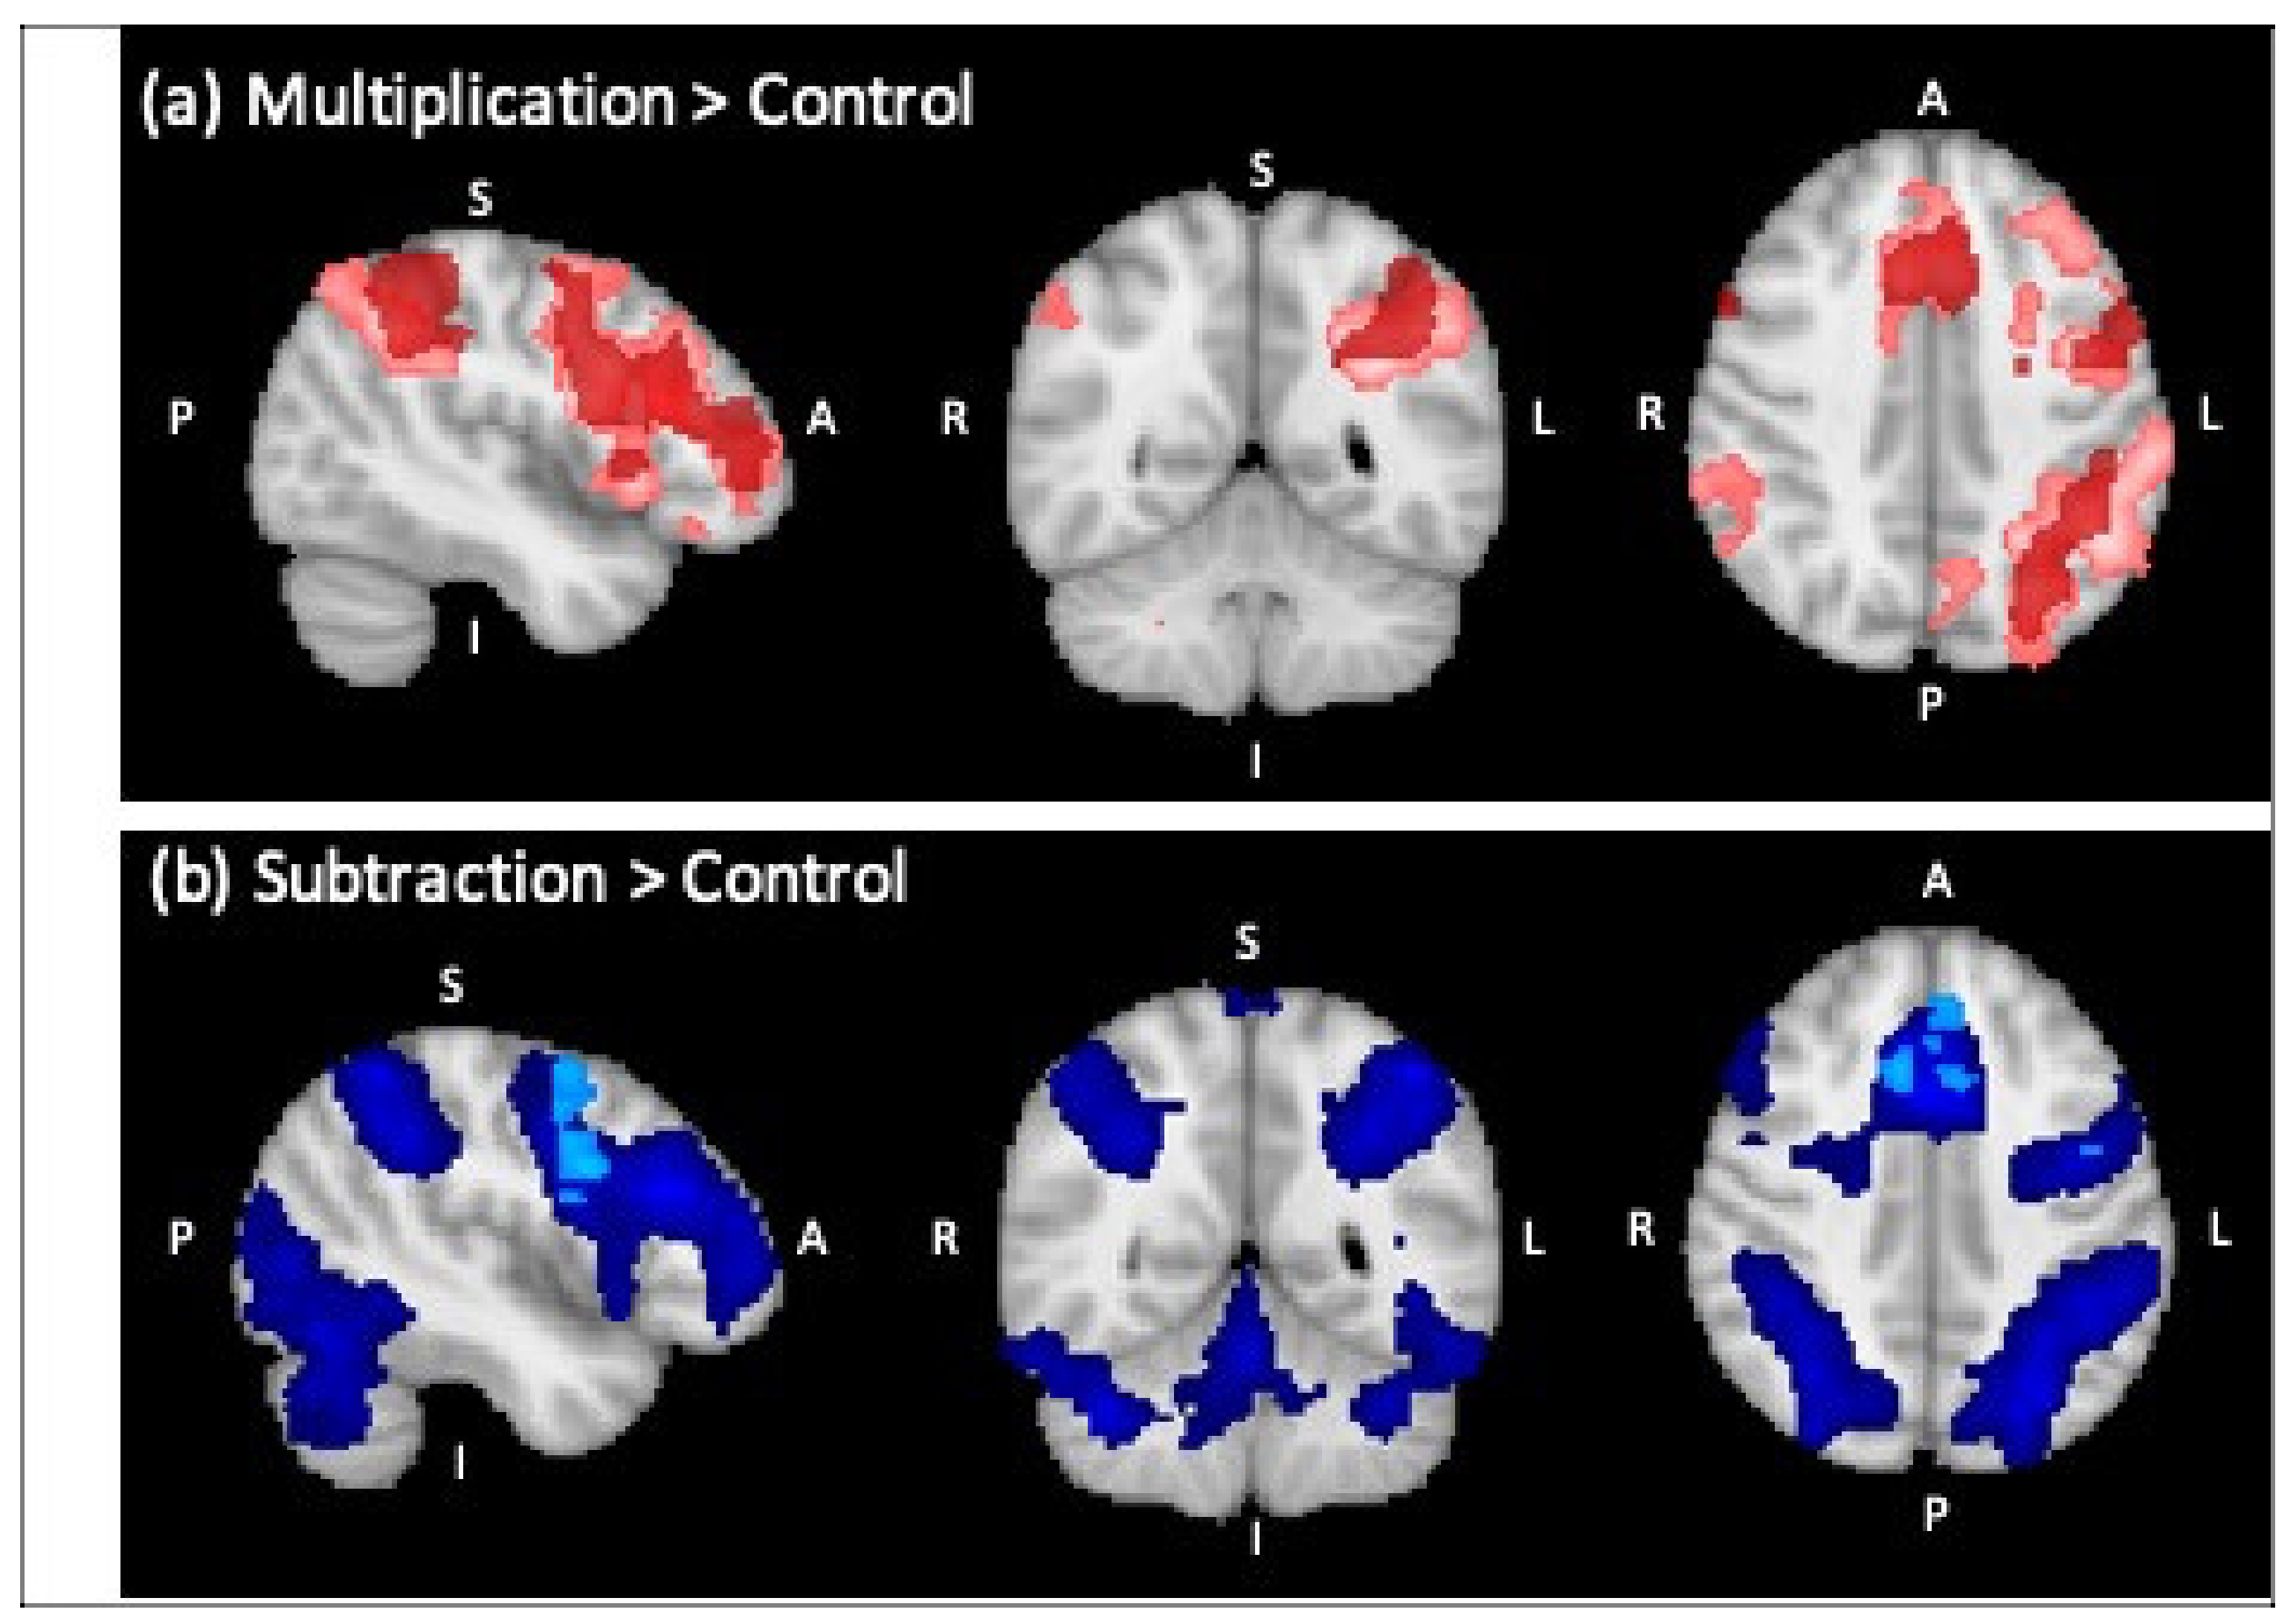
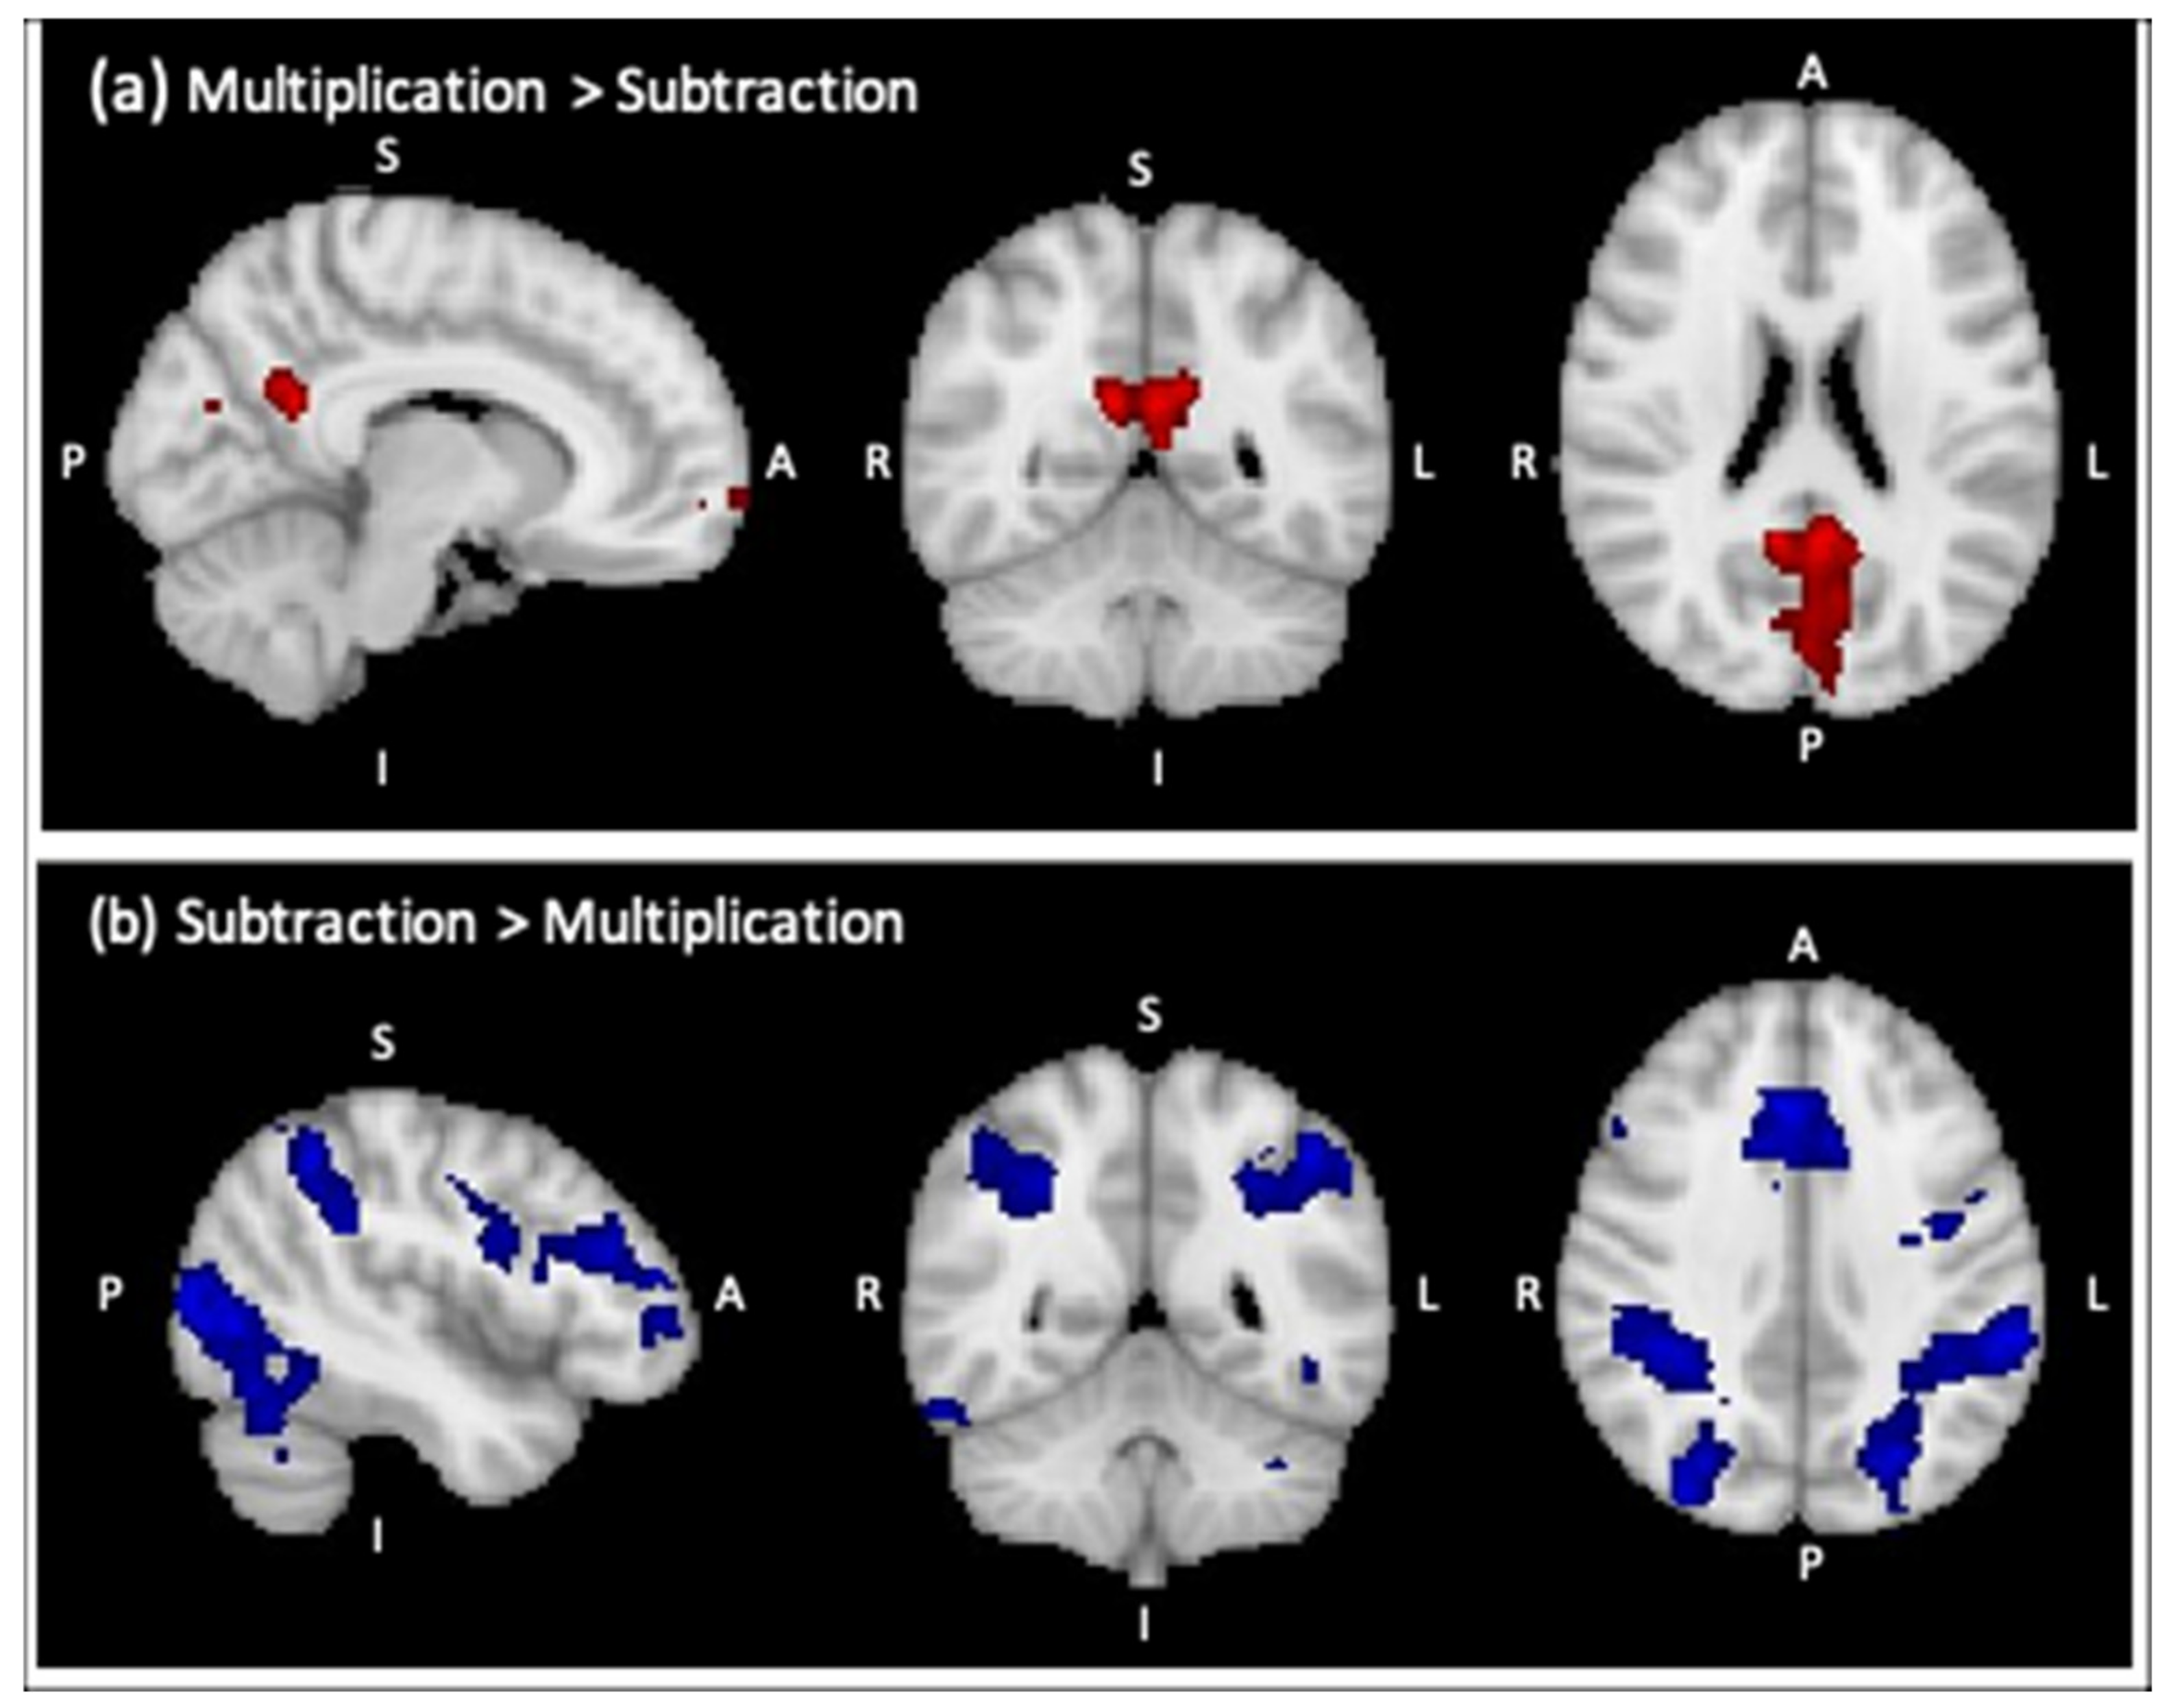
3.2.1. Whole-Brain Analysis
Control Group Only
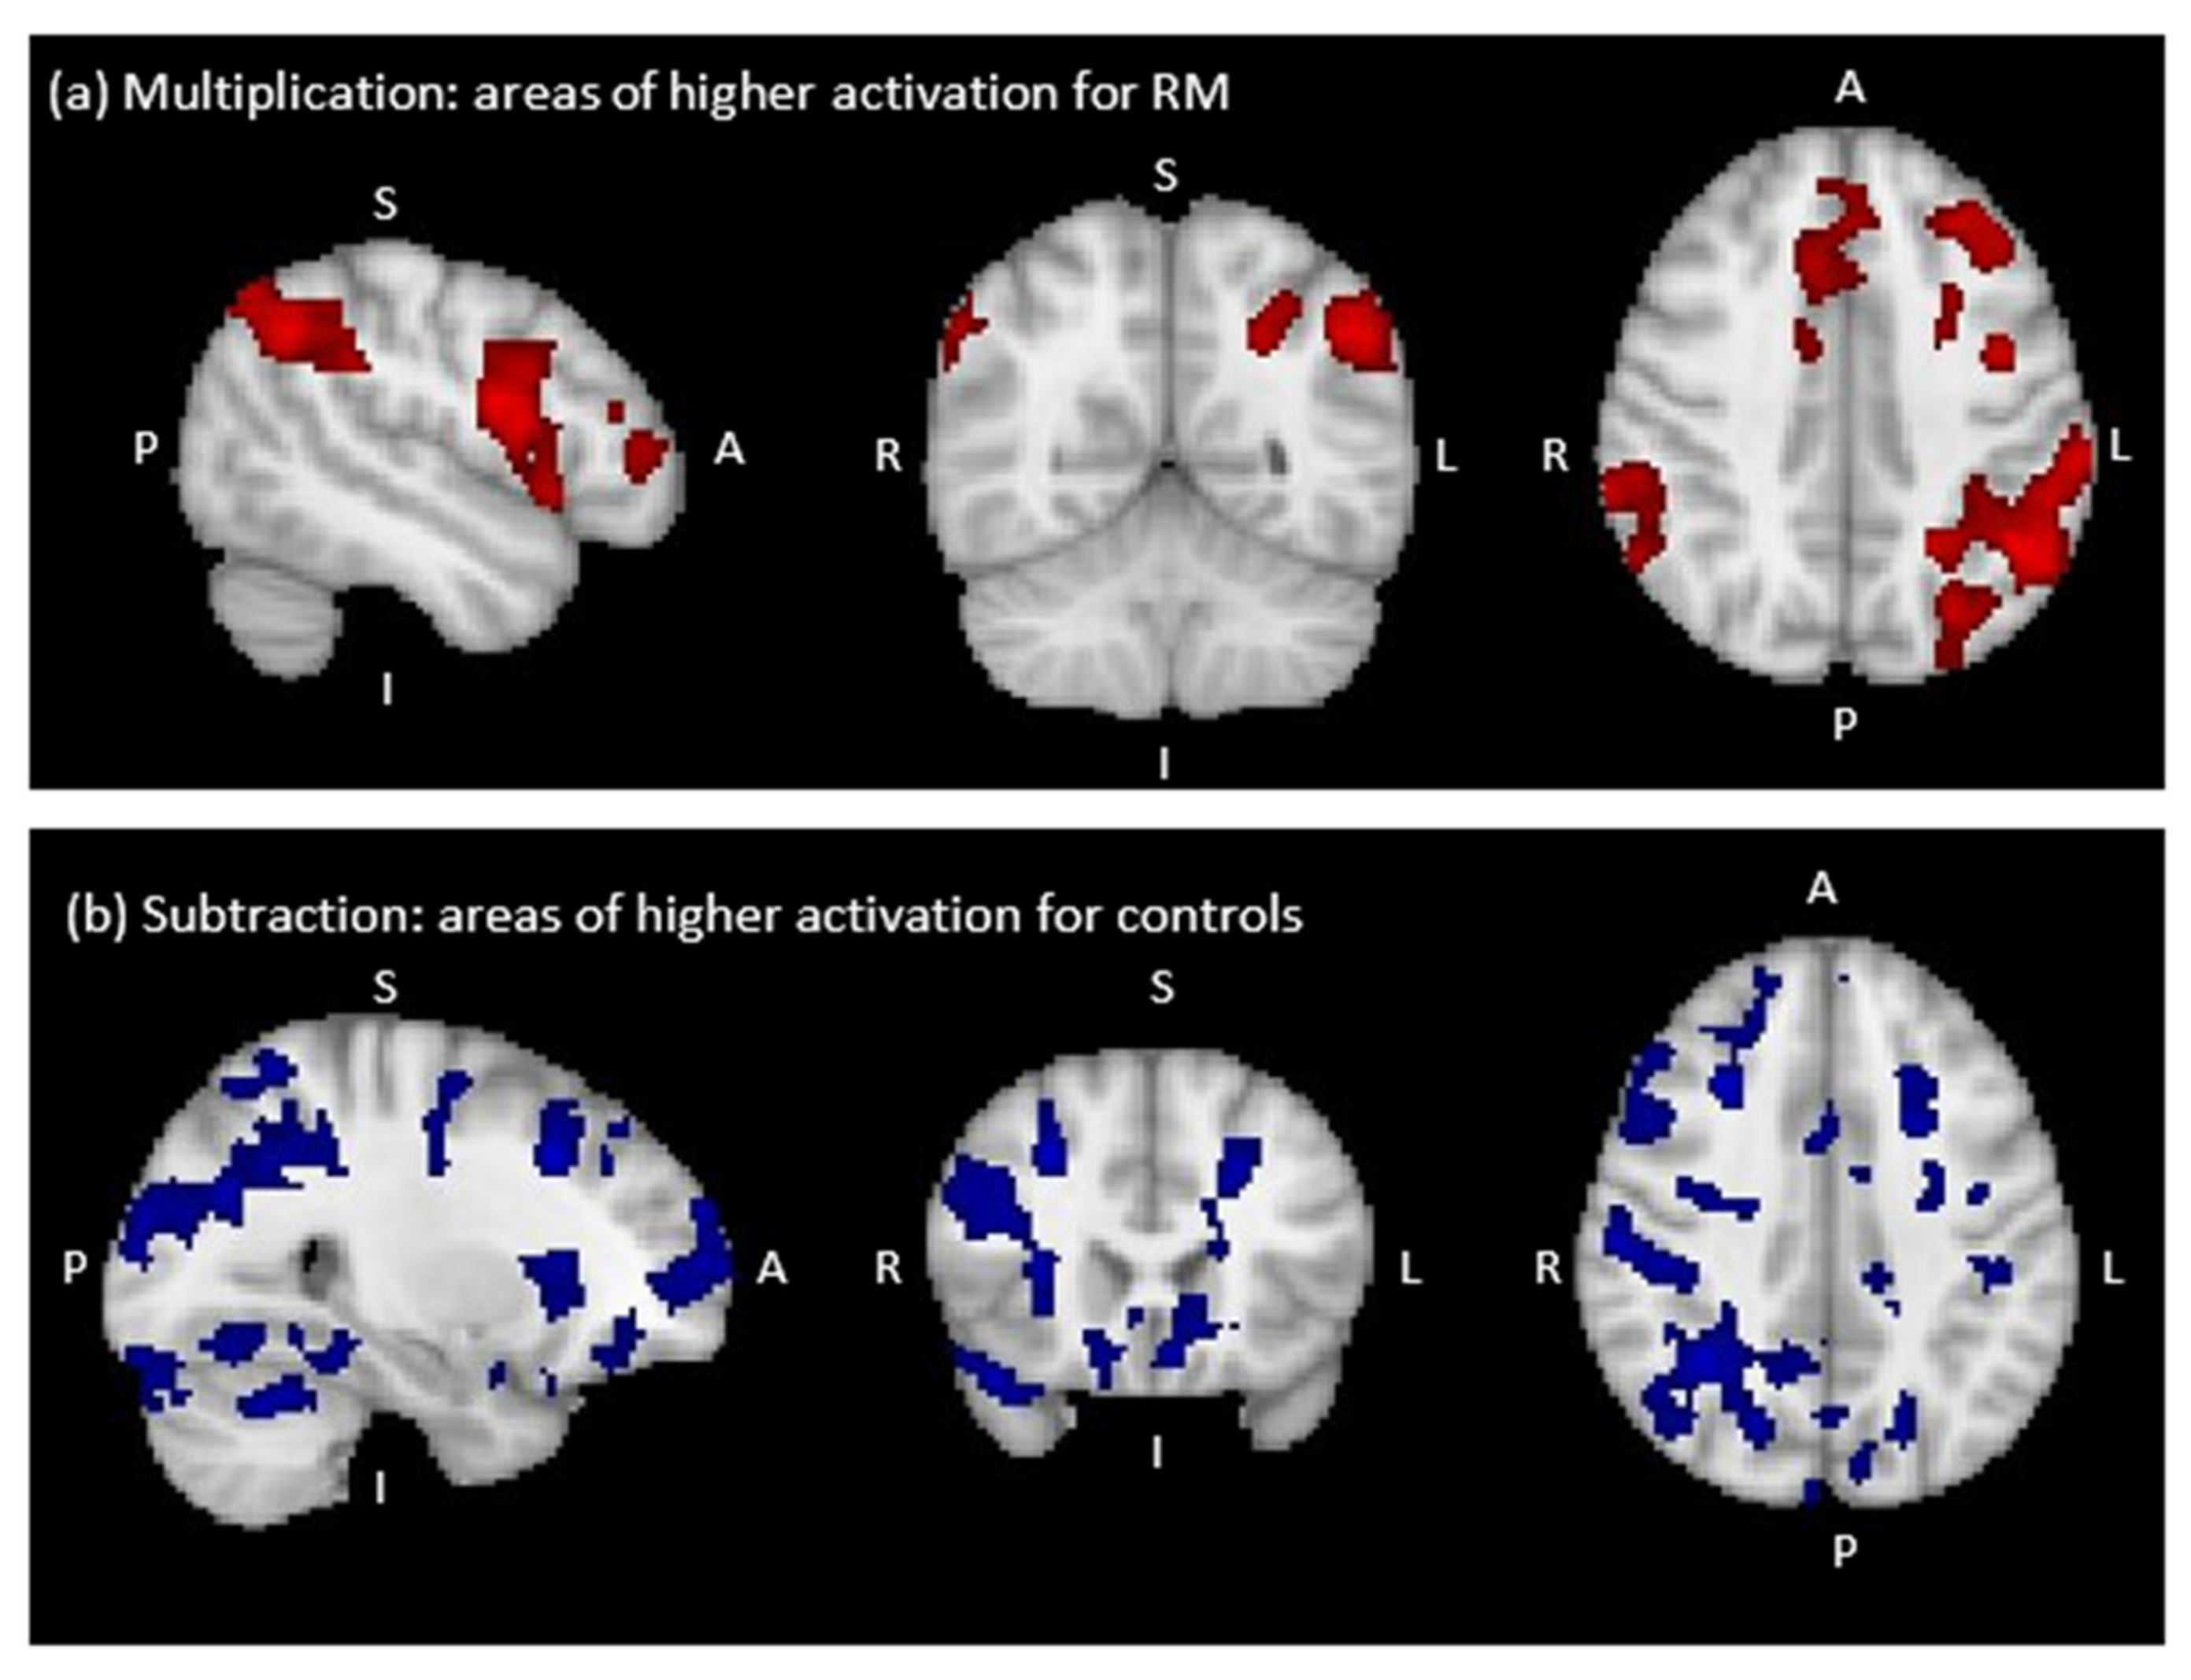
Comparison between RM and the Control Group
3.2.2. Regions-of-Interest Analysis (ROI)
Control Group Only
Comparison between RM and the Control Group
4. Discussion
4.1. Arithmetic Networks in Typical Adults during Subtraction and Multiplication
4.2. Arithmetic Networks in an Adults with Developmental Dyscalculia
4.3. Limitations and Future Research
Author Contributions
Funding
Institutional Review Board Statement
Informed Consent Statement
Data Availability Statement
Acknowledgments
Conflicts of Interest
Appendix A

| Multiplication | Subtraction | ||||||
|---|---|---|---|---|---|---|---|
| 1st Operant | 2nd Operant | Response | Item Type | 1st Operant | 2nd Operant | Response | Item Type |
| 2 | 7 | 14 | correct | 11 | 4 | 7 | correct |
| 2 | 7 | 16 | related | 11 | 4 | 5 | incorrect |
| 7 | 2 | 14 | correct | 11 | 8 | 5 | incorrect |
| 7 | 2 | 15 | unrelated | 11 | 8 | 3 | correct |
| 2 | 8 | 16 | correct | 11 | 6 | 3 | incorrect |
| 2 | 8 | 15 | unrelated | 11 | 6 | 5 | correct |
| 8 | 2 | 16 | correct | 12 | 9 | 3 | correct |
| 8 | 2 | 24 | related | 12 | 9 | 1 | incorrect |
| 3 | 4 | 12 | correct | 12 | 5 | 9 | incorrect |
| 3 | 4 | 15 | related | 12 | 5 | 7 | correct |
| 4 | 3 | 12 | correct | 13 | 7 | 6 | correct |
| 4 | 3 | 10 | unrelated | 13 | 7 | 4 | incorrect |
| 3 | 6 | 18 | correct | 13 | 6 | 9 | incorrect |
| 3 | 6 | 17 | unrelated | 13 | 6 | 7 | correct |
| 6 | 3 | 18 | correct | 14 | 6 | 10 | incorrect |
| 6 | 3 | 12 | related | 14 | 6 | 8 | correct |
| 3 | 8 | 24 | correct | 14 | 3 | 9 | incorrect |
| 3 | 8 | 21 | related | 14 | 3 | 11 | correct |
| 8 | 3 | 24 | correct | 15 | 8 | 9 | incorrect |
| 8 | 3 | 22 | unrelated | 15 | 8 | 7 | correct |
| 3 | 9 | 27 | correct | 15 | 4 | 11 | correct |
| 3 | 9 | 23 | unrelated | 15 | 4 | 9 | incorrect |
| 9 | 3 | 27 | correct | 16 | 9 | 7 | correct |
| 9 | 3 | 36 | related | 16 | 9 | 5 | incorrect |
| 4 | 6 | 24 | correct | 16 | 3 | 15 | incorrect |
| 4 | 6 | 20 | related | 16 | 3 | 13 | correct |
| 6 | 4 | 24 | correct | 17 | 9 | 8 | correct |
| 6 | 4 | 22 | unrelated | 17 | 9 | 6 | incorrect |
| 4 | 7 | 28 | correct | 17 | 8 | 11 | incorrect |
| 4 | 7 | 34 | unrelated | 17 | 8 | 9 | correct |
| 7 | 4 | 28 | correct | 18 | 5 | 15 | incorrect |
| 7 | 4 | 21 | related | 18 | 5 | 13 | correct |
| 4 | 8 | 32 | correct | 18 | 3 | 17 | incorrect |
| 4 | 8 | 36 | related | 18 | 3 | 15 | correct |
| 8 | 4 | 32 | correct | 19 | 7 | 12 | correct |
| 8 | 4 | 26 | unrelated | 19 | 7 | 14 | incorrect |
| 4 | 9 | 36 | correct | 19 | 7 | 12 | correct |
| 4 | 9 | 34 | unrelated | 19 | 7 | 10 | incorrect |
| 9 | 4 | 36 | correct | 19 | 6 | 13 | correct |
| 9 | 4 | 27 | related | 19 | 6 | 11 | incorrect |
| 5 | 7 | 35 | correct | 52 | 39 | 13 | correct |
| 5 | 7 | 30 | related | 52 | 39 | 11 | incorrect |
| 7 | 5 | 35 | correct | 52 | 35 | 17 | correct |
| 7 | 5 | 31 | unrelated | 52 | 35 | 15 | incorrect |
| 5 | 8 | 40 | correct | 58 | 35 | 25 | incorrect |
| 5 | 8 | 44 | unrelated | 58 | 35 | 23 | correct |
| 8 | 5 | 40 | correct | 58 | 24 | 36 | incorrect |
| 8 | 5 | 48 | related | 58 | 24 | 34 | correct |
| 5 | 9 | 45 | correct | 64 | 46 | 18 | correct |
| 5 | 9 | 40 | related | 64 | 46 | 16 | incorrect |
| 9 | 5 | 45 | correct | 64 | 33 | 31 | correct |
| 9 | 5 | 47 | unrelated | 64 | 33 | 29 | incorrect |
| 6 | 7 | 42 | correct | 69 | 47 | 24 | incorrect |
| 6 | 7 | 44 | unrelated | 69 | 47 | 22 | correct |
| 7 | 6 | 42 | correct | 69 | 36 | 33 | correct |
| 7 | 6 | 35 | related | 69 | 36 | 35 | incorrect |
| 6 | 8 | 48 | correct | 73 | 57 | 18 | incorrect |
| 6 | 8 | 42 | related | 73 | 57 | 16 | correct |
| 8 | 6 | 48 | correct | 73 | 46 | 27 | correct |
| 8 | 6 | 52 | unrelated | 73 | 46 | 25 | incorrect |
| 7 | 8 | 56 | correct | 75 | 48 | 29 | incorrect |
| 7 | 8 | 58 | unrelated | 75 | 48 | 27 | correct |
| 8 | 7 | 56 | correct | 75 | 34 | 39 | incorrect |
| 8 | 7 | 48 | related | 75 | 34 | 41 | correct |
| 7 | 9 | 63 | correct | 86 | 59 | 27 | correct |
| 7 | 9 | 56 | related | 86 | 59 | 25 | incorrect |
| 9 | 7 | 63 | correct | 86 | 43 | 45 | incorrect |
| 9 | 7 | 61 | unrelated | 86 | 43 | 43 | correct |
| 8 | 9 | 72 | correct | 87 | 69 | 18 | correct |
| 8 | 9 | 76 | unrelated | 87 | 69 | 16 | incorrect |
| 9 | 8 | 72 | correct | 87 | 58 | 31 | incorrect |
| 9 | 8 | 81 | related | 87 | 58 | 29 | correct |
| 3 | 7 | 21 | correct | 91 | 38 | 53 | correct |
| 3 | 7 | 24 | related | 91 | 38 | 51 | incorrect |
| 7 | 3 | 21 | correct | 91 | 76 | 17 | incorrect |
| 7 | 3 | 19 | unrelated | 91 | 76 | 15 | correct |
| 2 | 9 | 18 | correct | 95 | 21 | 76 | incorrect |
| 2 | 9 | 21 | unrelated | 95 | 21 | 74 | correct |
| 9 | 2 | 18 | correct | 95 | 28 | 67 | correct |
| 9 | 2 | 16 | related | 95 | 28 | 65 | incorrect |
Appendix B

References
- Gross-Tsur, V.; Manor, O.; Shalev, R.S. Developmental Dyscalculia: Prevalence and Demographic Features. Dev. Med. Child Neurol. 1996, 38, 25–33. [Google Scholar] [CrossRef] [PubMed]
- Rubinsten, O.; Henik, A. Developmental Dyscalculia: Heterogeneity Might Not Mean Different Mechanisms. Trends Cogn. Sci. 2009, 13, 92–99. [Google Scholar] [CrossRef] [PubMed]
- Schulz, F.; Wyschkon, A.; Gallit, F.S. Rechenprobleme von Grundschulkindern: Persistenz Und Schulerfolg Nach Fünf Jahren. Lern. Lernstörungen 2018, 7, 67–80. [Google Scholar] [CrossRef]
- Bynner, J.; Parsons, S. New Light on Literacy and Numeracy. National Research and Development Centre for Adult Literacy and Numeracy. 2006. Available online: https://dera.ioe.ac.uk/22308/1/doc_3276.pdf (accessed on 28 April 2022).
- Carpentier, J.C.; Lister, J.; Frumkin, L.; Carpentieri, J. Adult Numeracy: A Review of Research. National Research and Development Centre for Adult Literacy and Numeracy. 2010. Available online: https://discovery.ucl.ac.uk/id/eprint/10069095/1/Carpentier_2009Adultnumeracy.pdf (accessed on 28 April 2022).
- Kaufmann, L.; von Aster, M.; Göbel, S.M.; Marksteiner, J.; Klein, E. Developmental Dyscalculia in Adults. Lern. Lernstörungen 2020, 9, 126–137. [Google Scholar] [CrossRef]
- American Psychiatric Association. Diagnostic and Statistical Manual of Mental Disorders (DSM-5®); American Psychiatric Publishing: Washington, DC, USA, 2013; ISBN 9780890425572. [Google Scholar]
- Rubinsten, O. Co-Occurrence of Developmental Disorders: The Case of Developmental Dyscalculia. Cogn. Dev. 2009, 24, 362–370. [Google Scholar] [CrossRef]
- Kahn, H.J.; Whitaker, H.A. Acalculia: An Historical Review of Localization. Brain Cogn. 1991, 17, 102–115. [Google Scholar] [CrossRef]
- Dehaene, S.; Cohen, L. Towards an anatomical and functional model of number processing. Math. Cogn. 1995, 1, 83–120. [Google Scholar]
- Dehaene, S.; Cohen, L. Cerebral Pathways for Calculation: Double Dissociation between Rote Verbal and Quantitative Knowledge of Arithmetic. Cortex 1997, 33, 219–250. [Google Scholar] [CrossRef]
- Daitch, A.L.; Foster, B.L.; Schrouff, J.; Rangarajan, V.; Kaşikçi, I.; Gattas, S.; Parvizi, J. Mapping Human Temporal and Parietal Neuronal Population Activity and Functional Coupling during Mathematical Cognition. Proc. Natl. Acad. Sci. USA 2016, 113, E7277–E7286. [Google Scholar] [CrossRef] [Green Version]
- Grotheer, M.; Jeska, B.; Grill-Spector, K. A Preference for Mathematical Processing Outweighs the Selectivity for Arabic Numbers in the Inferior Temporal Gyrus. Neuroimage 2018, 175, 188–200. [Google Scholar] [CrossRef]
- Grotheer, M.; Ambrus, G.G.; Kovács, G. Causal Evidence of the Involvement of the Number Form Area in the Visual Detection of Numbers and Letters. Neuroimage 2016, 132, 314–319. [Google Scholar] [CrossRef]
- Grotheer, M.; Herrmann, K.-H.; Kovács, G. Neuroimaging Evidence of a Bilateral Representation for Visually Presented Numbers. J. Neurosci. 2016, 36, 88–97. [Google Scholar] [CrossRef] [Green Version]
- Dehaene, S. The Neural Basis of the Weber–Fechner Law: A Logarithmic Mental Number Line. Trends Cogn. Sci. 2003, 7, 145–147. [Google Scholar] [CrossRef]
- Dehaene, S.; Bossini, S.; Giraux, P. The Mental Representation of Parity and Number Magnitude. J. Exp. Psychol. Gen. 1993, 122, 371. [Google Scholar] [CrossRef]
- Corbetta, M.; Kincade, J.M.; Ollinger, J.M.; McAvoy, M.P.; Shulman, G.L. Voluntary Orienting Is Dissociated from Target Detection in Human Posterior Parietal Cortex. Nat. Neurosci. 2000, 3, 292–297. [Google Scholar] [CrossRef]
- Pinel, P.; Dehaene, S.; Rivière, D.; LeBihan, D. Modulation of Parietal Activation by Semantic Distance in a Number Comparison Task. Neuroimage 2001, 14, 1013–1026. [Google Scholar] [CrossRef] [Green Version]
- Hawes, Z.; Sokolowski, H.M.; Ononye, C.B.; Ansari, D. Neural Underpinnings of Numerical and Spatial Cognition: An FMRI Meta-Analysis of Brain Regions Associated with Symbolic Number, Arithmetic, and Mental Rotation. Neurosci. Biobehav. Rev. 2019, 103, 316–336. [Google Scholar] [CrossRef]
- Menon, V. Arithmetic in the Child and Adult Brain. In The Oxford Handbook of Numerical Cognition; Kadosh, R.C., Dowker, A., Eds.; Oxford University Press: Oxford, UK, 2015; ISBN 9780199642342. [Google Scholar]
- Amalric, M.; Dehaene, S. Origins of the Brain Networks for Advanced Mathematics in Expert Mathematicians. Proc. Natl. Acad. Sci. USA 2016, 113, 4909–4917. [Google Scholar] [CrossRef] [Green Version]
- Amalric, M.; Dehaene, S. Cortical Circuits for Mathematical Knowledge: Evidence for a Major Subdivision within the Brain’s Semantic Networks. Philos. Trans. R. Soc. Lond. B Biol. Sci. 2017, 373, 20160515. [Google Scholar] [CrossRef] [Green Version]
- Amalric, M.; Dehaene, S. A Distinct Cortical Network for Mathematical Knowledge in the Human Brain. Neuroimage 2019, 189, 19–31. [Google Scholar] [CrossRef]
- Piazza, M.; Pinel, P.; Le Bihan, D.; Dehaene, S. A Magnitude Code Common to Numerosities and Number Symbols in Human Intraparietal Cortex. Neuron 2007, 53, 293–305. [Google Scholar] [CrossRef]
- Eger, E.; Michel, V.; Thirion, B.; Amadon, A.; Dehaene, S.; Kleinschmidt, A. Deciphering Cortical Number Coding from Human Brain Activity Patterns. Curr. Biol. 2009, 19, 1608–1615. [Google Scholar] [CrossRef]
- Göbel, S.M.; Johansen-Berg, H.; Behrens, T.; Rushworth, M.F.S. Response-Selection-Related Parietal Activation during Number Comparison. J. Cogn. Neurosci. 2004, 16, 1536–1551. [Google Scholar] [CrossRef]
- Andres, M.; Pelgrims, B.; Michaux, N.; Olivier, E.; Pesenti, M. Role of Distinct Parietal Areas in Arithmetic: An FMRI-Guided TMS Study. Neuroimage 2011, 54, 3048–3056. [Google Scholar] [CrossRef]
- Arsalidou, M.; Taylor, M.J. Is 2+2=4? Meta-Analyses of Brain Areas Needed for Numbers and Calculations. Neuroimage 2011, 54, 2382–2393. [Google Scholar] [CrossRef]
- Faye, A.; Jacquin-Courtois, S.; Reynaud, E.; Lesourd, M.; Besnard, J.; Osiurak, F. Numerical Cognition: A Meta-Analysis of Neuroimaging, Transcranial Magnetic Stimulation and Brain-Damaged Patients Studies. NeuroImage Clin. 2019, 24, 102053. [Google Scholar] [CrossRef]
- Cappelletti, M.; Muggleton, N.; Walsh, V. Quantity without Numbers and Numbers without Quantity in the Parietal Cortex. Neuroimage 2009, 46, 522–529. [Google Scholar] [CrossRef] [Green Version]
- Caron, T.A. Learning Multiplication: The Easy Way. Clear. House 2007, 80, 278–282. [Google Scholar] [CrossRef]
- Zarnhofer, S.; Braunstein, V.; Ebner, F.; Koschutnig, K.; Neuper, C.; Ninaus, M.; Reishofer, G.; Ischebeck, A. Individual Differences in Solving Arithmetic Word Problems. Behav. Brain Funct. 2013, 9, 28. [Google Scholar] [CrossRef] [Green Version]
- Grabner, R.H.; Ansari, D.; Koschutnig, K.; Reishofer, G.; Ebner, F.; Neuper, C. To Retrieve or to Calculate? Left Angular Gyrus Mediates the Retrieval of Arithmetic Facts during Problem Solving. Neuropsychologia 2009, 47, 604–608. [Google Scholar] [CrossRef]
- Delazer, M.; Girelli, L.; Granà, A.; Domahs, F. Number Processing and Calculation--Normative Data from Healthy Adults. Clin. Neuropsychol. 2003, 17, 331–350. [Google Scholar] [CrossRef] [PubMed]
- Delazer, M.; Ischebeck, A.; Domahs, F.; Zamarian, L.; Koppelstaetter, F.; Siedentopf, C.M.; Kaufmann, L.; Benke, T.; Felber, S. Learning by Strategies and Learning by Drill--Evidence from an FMRI Study. Neuroimage 2005, 25, 838–849. [Google Scholar] [CrossRef] [PubMed]
- Dehaene, S.; Spelke, E.; Pinel, P.; Stanescu, R.; Tsivkin, S. Sources of Mathematical Thinking: Behavioral and Brain-Imaging Evidence. Science 1999, 284, 970–974. [Google Scholar] [CrossRef] [PubMed] [Green Version]
- Salillas, E.; Piccione, F.; di Tomasso, S.; Zago, S.; Arcara, G.; Semenza, C. Neurofunctional Components of Simple Calculation: A Magnetoencephalography Study. Cereb. Cortex 2021, 31, 1149–1162. [Google Scholar] [CrossRef]
- Arcara, G.; Pezzetta, R.; Benavides-Varela, S.; Rizzi, G.; Formica, S.; Turco, C.; Piccione, F.; Semenza, C. Magnetoencephalography Reveals Differences in Brain Activations for Fast and Slow Responses to Simple Multiplications. Sci. Rep. 2021, 11, 20296. [Google Scholar] [CrossRef]
- Göbel, S.M.; Rushworth, M.F.; Walsh, V. Inferior Parietal rTMS Affects Performance in an Addition Task. Cortex 2006, 42, 774–781. [Google Scholar] [CrossRef]
- Knops, A.; Thirion, B.; Hubbard, E.M.; Michel, V.; Dehaene, S. Recruitment of an Area Involved in Eye Movements During Mental Arithmetic. Science 2009, 324, 1583–1585. [Google Scholar] [CrossRef] [Green Version]
- Zago, L.; Petit, L.; Turbelin, M.-R.; Andersson, F.; Vigneau, M.; Tzourio-Mazoyer, N. How Verbal and Spatial Manipulation Networks Contribute to Calculation: An FMRI Study. Neuropsychologia 2008, 46, 2403–2414. [Google Scholar] [CrossRef]
- Skagenholt, M.; Träff, U.; Västfjäll, D.; Skagerlund, K. Examining the Triple Code Model in Numerical Cognition: An FMRI Study. PLoS ONE 2018, 13, e0199247. [Google Scholar] [CrossRef] [Green Version]
- Skagerlund, K.; Karlsson, T.; Träff, U. Magnitude Processing in the Brain: An FMRI Study of Time, Space, and Numerosity as a Shared Cortical System. Front. Hum. Neurosci. 2016, 10, 500. [Google Scholar] [CrossRef] [Green Version]
- Arsalidou, M.; Pawliw-Levac, M.; Sadeghi, M.; Pascual-Leone, J. Brain Areas Needed for Numbers and Calculations in Children: Meta-Analyses of FMRI Studies. Dev. Cogn. Neurosci. 2017, 30, 239–250. [Google Scholar] [CrossRef]
- Krinzinger, H.; Koten, J.W.; Horoufchin, H.; Kohn, N.; Arndt, D.; Sahr, K.; Konrad, K.; Willmes, K. The Role of Finger Representations and Saccades for Number Processing: An FMRI Study in Children. Front. Psychol. 2011, 2, 373. [Google Scholar] [CrossRef] [Green Version]
- Andres, M.; Di Luca, S.; Pesenti, M. Finger Counting: The Missing Tool? Behav. Brain Sci. 2008, 31, 642–643. [Google Scholar] [CrossRef]
- Kaufmann, L.; Pixner, S.; Göbel, S.M. Finger Usage and Arithmetic in Adults with Math Difficulties: Evidence from a Case Report. Front. Psychol. 2011, 2, 254. [Google Scholar] [CrossRef] [Green Version]
- Klein, E.; Suchan, J.; Moeller, K.; Karnath, H.-O.; Knops, A.; Wood, G.; Nuerk, H.-C.; Willmes, K. Considering Structural Connectivity in the Triple Code Model of Numerical Cognition: Differential Connectivity for Magnitude Processing and Arithmetic Facts. Brain Struct. Funct. 2016, 221, 979–995. [Google Scholar] [CrossRef]
- Lemaire, P.; Arnaud, L. Young and Older Adults’ Strategies in Complex Arithmetic. Am. J. Psychol. 2008, 121, 1–16. [Google Scholar] [CrossRef]
- Metcalfe, A.W.S.; Campbell, J.I.D. Adults’ Strategies for Simple Addition and Multiplication: Verbal Self-Reports and the Operand Recognition Paradigm. J. Exp. Psychol. Learn. Mem. Cogn. 2011, 37, 661–672. [Google Scholar] [CrossRef]
- Threlfall, J. Strategies and Flexibility in Mental Calculation. ZDM 2009, 41, 541–555. [Google Scholar] [CrossRef]
- Campbell, J.I.; Xue, Q. Cognitive Arithmetic across Cultures. J. Exp. Psychol. Gen. 2001, 130, 299–315. [Google Scholar] [CrossRef]
- Fresnoza, S.; Christova, M.; Purgstaller, S.; Jehna, M.; Zaar, K.; Hoffermann, M.; Mahdy Ali, K.; Körner, C.; Gallasch, E.; von Campe, G.; et al. Dissociating Arithmetic Operations in the Parietal Cortex Using 1 Hz Repetitive Transcranial Magnetic Stimulation: The Importance of Strategy Use. Front. Hum. Neurosci. 2020, 14, 271. [Google Scholar] [CrossRef]
- Van Harskamp, N.J.; Cipolotti, L. Selective Impairments for Addition, Subtraction and Multiplication. Implications for the Organisation of Arithmetical Facts. Cortex 2001, 37, 363–388. [Google Scholar] [CrossRef]
- Ischebeck, A.; Zamarian, L.; Siedentopf, C.; Koppelstätter, F.; Benke, T.; Felber, S.; Delazer, M. How Specifically Do We Learn? Imaging the Learning of Multiplication and Subtraction. Neuroimage 2006, 30, 1365–1375. [Google Scholar] [CrossRef]
- Yu, X.; Chen, C.; Pu, S.; Wu, C.; Li, Y.; Jiang, T.; Zhou, X. Dissociation of Subtraction and Multiplication in the Right Parietal Cortex: Evidence from Intraoperative Cortical Electrostimulation. Neuropsychologia 2011, 49, 2889–2895. [Google Scholar] [CrossRef] [Green Version]
- Della Puppa, A.; De Pellegrin, S.; d’Avella, E.; Gioffrè, G.; Munari, M.; Saladini, M.; Salillas, E.; Scienza, R.; Semenza, C. Right Parietal Cortex and Calculation Processing: Intraoperative Functional Mapping of Multiplication and Addition in Patients Affected by a Brain Tumor. J. Neurosurg. 2013, 119, 1107–1111. [Google Scholar] [CrossRef]
- Semenza, C.; Salillas, E.; De Pallegrin, S.; Della Puppa, A. Balancing the 2 Hemispheres in Simple Calculation: Evidence From Direct Cortical Electrostimulation. Cereb. Cortex 2017, 27, 4806–4814. [Google Scholar] [CrossRef] [Green Version]
- Lee, K.M. Cortical Areas Differentially Involved in Multiplication and Subtraction: A Functional Magnetic Resonance Imaging Study and Correlation with a Case of Selective Acalculia. Ann. Neurol. 2000, 48, 657–661. [Google Scholar] [CrossRef]
- Delazer, M.; Benke, T. Arithmetic Facts without Meaning. Cortex 1997, 33, 697–710. [Google Scholar] [CrossRef]
- Dehaene, S.; Piazza, M.; Pinel, P.; Cohen, L. Three Parietal Circuits for Number Processing. Cogn. Neuropsychol. 2003, 20, 487–506. [Google Scholar] [CrossRef] [Green Version]
- Prado, J.; Mutreja, R.; Zhang, H.; Mehta, R.; Desroches, A.S.; Minas, J.E.; Booth, J.R. Distinct Representations of Subtraction and Multiplication in the Neural Systems for Numerosity and Language. Hum. Brain Mapp. 2011, 32, 1932–1947. [Google Scholar] [CrossRef] [Green Version]
- Kong, J.; Wang, C.; Kwong, K.; Vangel, M.; Chua, E.; Gollub, R. The Neural Substrate of Arithmetic Operations and Procedure Complexity. Brain Res. Cogn. Brain Res. 2005, 22, 397–405. [Google Scholar] [CrossRef]
- Ischebeck, A.; Zamarian, L.; Egger, K.; Schocke, M.; Delazer, M. Imaging Early Practice Effects in Arithmetic. Neuroimage 2007, 36, 993–1003. [Google Scholar] [CrossRef] [PubMed]
- Grabner, R.H.; Ischebeck, A.; Reishofer, G.; Koschutnig, K.; Delazer, M.; Ebner, F.; Neuper, C. Fact Learning in Complex Arithmetic and Figural-Spatial Tasks: The Role of the Angular Gyrus and Its Relation to Mathematical Competence. Hum. Brain Mapp. 2009, 30, 2936–2952. [Google Scholar] [CrossRef] [PubMed]
- Chochon, F.; Cohen, L.; van de Moortele, P.F.; Dehaene, S. Differential Contributions of the Left and Right Inferior Parietal Lobules to Number Processing. J. Cogn. Neurosci. 1999, 11, 617–630. [Google Scholar] [CrossRef] [PubMed] [Green Version]
- Fehr, T.; Code, C.; Herrmann, M. Common Brain Regions Underlying Different Arithmetic Operations as Revealed by Conjunct FMRI-BOLD Activation. Brain Res. 2007, 1172, 93–102. [Google Scholar] [CrossRef]
- Jost, K.; Khader, P.; Burke, M.; Bien, S.; Rösler, F. Dissociating the Solution Processes of Small, Large, and Zero Multiplications by Means of FMRI. Neuroimage 2009, 46, 308–318. [Google Scholar] [CrossRef]
- Kazui, H.; Kitagaki, H.; Mori, E. Cortical Activation during Retrieval of Arithmetical Facts and Actual Calculation: A Functional Magnetic Resonance Imaging Study. Psychiatry Clin. Neurosci. 2000, 54, 479–485. [Google Scholar] [CrossRef] [Green Version]
- Rickard, T.C.; Romero, S.G.; Basso, G.; Wharton, C.; Flitman, S.; Grafman, J. The Calculating Brain: An FMRI Study. Neuropsychologia 2000, 38, 325–335. [Google Scholar] [CrossRef] [Green Version]
- Zago, L.; Pesenti, M.; Mellet, E.; Crivello, F.; Mazoyer, B.; Tzourio-Mazoyer, N. Neural Correlates of Simple and Complex Mental Calculation. Neuroimage 2001, 13, 314–327. [Google Scholar] [CrossRef] [Green Version]
- Rosenberg-Lee, M.; Chang, T.T.; Young, C.B.; Wu, S.; Menon, V. Functional Dissociations between Four Basic Arithmetic Operations in the Human Posterior Parietal Cortex: A Cytoarchitectonic Mapping Study. Neuropsychologia 2011, 49, 2592–2608. [Google Scholar] [CrossRef] [Green Version]
- Maurer, S.; Tanigawa, N.; Sollmann, N.; Hauck, T.; Ille, S.; Boeckh-Behrens, T.; Meyer, B.; Krieg, S.M. Non-Invasive Mapping of Calculation Function by Repetitive Navigated Transcranial Magnetic Stimulation. Brain Struct. Funct. 2016, 221, 3927–3947. [Google Scholar] [CrossRef]
- Salillas, E.; Semenza, C.; Basso, D.; Vecchi, T.; Siegal, M. Single Pulse TMS Induced Disruption to Right and Left Parietal Cortex on Addition and Multiplication. Neuroimage 2012, 59, 3159–3165. [Google Scholar] [CrossRef]
- Cohen Kadosh, R.; Cohen Kadosh, K.; Schuhmann, T.; Kaas, A.; Goebel, R.; Henik, A.; Sack, A.T. Virtual Dyscalculia Induced by Parietal-Lobe TMS Impairs Automatic Magnitude Processing. Curr. Biol. 2007, 17, 689–693. [Google Scholar] [CrossRef]
- Mussolin, C.; De Volder, A.; Grandin, C.; Schlögel, X.; Nassogne, M.-C.; Noël, M.-P. Neural Correlates of Symbolic Number Comparison in Developmental Dyscalculia. J. Cogn. Neurosci. 2010, 22, 860–874. [Google Scholar] [CrossRef]
- Gliksman, Y.; Henik, A. Enumeration and Alertness in Developmental Dyscalculia. J. Cogn. 2019, 2, 5. [Google Scholar] [CrossRef] [Green Version]
- Rubinsten, O.; Henik, A. Automatic Activation of Internal Magnitudes: A Study of Developmental Dyscalculia. Neuropsychology 2005, 19, 641–648. [Google Scholar] [CrossRef] [Green Version]
- Kaufmann, L.; Lochy, A.; Drexler, A.; Semenza, C. Deficient Arithmetic Fact Retrieval—Storage or Access Problem?: A Case Study. Neuropsychologia 2004, 42, 482–496. [Google Scholar] [CrossRef]
- Eckstein, B. Rechnen mit Brüchen und Dezimalzahlen vor dem Beginn einer Berufsausbildung. Lern. Lernstörungen 2016, 5, 189–195. [Google Scholar] [CrossRef]
- Piazza, M.; Facoetti, A.; Trussardi, A.N.; Berteletti, I.; Conte, S.; Lucangeli, D.; Dehaene, S.; Zorzi, M. Developmental Trajectory of Number Acuity Reveals a Severe Impairment in Developmental Dyscalculia. Cognition 2010, 116, 33–41. [Google Scholar] [CrossRef]
- Mussolin, C.; Mejias, S.; Noël, M.-P. Symbolic and Nonsymbolic Number Comparison in Children with and without Dyscalculia. Cognition 2010, 115, 10–25. [Google Scholar] [CrossRef]
- Gliksman, Y.; Henik, A. Conceptual Size in Developmental Dyscalculia and Dyslexia. Neuropsychology 2018, 32, 190–198. [Google Scholar] [CrossRef]
- De Visscher, A.; Noël, M.-P.; Pesenti, M.; Dormal, V. Developmental Dyscalculia in Adults: Beyond Numerical Magnitude Impairment. J. Learn. Disabil. 2018, 51, 600–611. [Google Scholar] [CrossRef]
- Ashkenazi, S.; Henik, A. A Disassociation between Physical and Mental Number Bisection in Developmental Dyscalculia. Neuropsychologia 2010, 48, 2861–2868. [Google Scholar] [CrossRef]
- Skagerlund, K.; Träff, U. Development of Magnitude Processing in Children with Developmental Dyscalculia: Space, Time, and Number. Front. Psychol. 2014, 5, 675. [Google Scholar] [CrossRef] [Green Version]
- Walsh, V. A Theory of Magnitude: Common Cortical Metrics of Time, Space and Quantity. Trends Cogn. Sci. 2003, 7, 483–488. [Google Scholar] [CrossRef]
- Henik, A.; Rubinsten, O.; Ashkenazi, S. Developmental Dyscalculia as a Heterogeneous Disability. In The Oxford Handbook of Numerical Cognition; Oxford University Press: Oxford, UK, 2015; pp. 662–677. [Google Scholar]
- LeFevre, J.-A.; DeStefano, D.; Coleman, B.; Shanahan, T. Mathematical Cognition and Working Memory. In Handbook of Mathematical Cognition; Campbell, J.I.D., Ed.; Psychology Press: New York, NY, USA, 2005; Volume 508, pp. 361–377. [Google Scholar]
- Hawes, Z.; Moss, J.; Caswell, B.; Seo, J.; Ansari, D. Relations between Numerical, Spatial, and Executive Function Skills and Mathematics Achievement: A Latent-Variable Approach. Cogn. Psychol. 2019, 109, 68–90. [Google Scholar] [CrossRef]
- Von Aster, M.G.; Shalev, R.S. Number Development and Developmental Dyscalculia. Dev. Med. Child Neurol. 2007, 49, 868–873. [Google Scholar] [CrossRef]
- Kuhn, J.-T.; Ise, E.; Raddatz, J.; Schwenk, C.; Dobel, C. Basic Numerical Processing, Calculation, and Working Memory in Children with Dyscalculia and/or ADHD Symptoms. Z. Kinder Jugendpsychiatr. Psychother. 2016, 44, 365–375. [Google Scholar] [CrossRef] [Green Version]
- Menon, V. Working Memory in Children’s Math Learning and Its Disruption in Dyscalculia. Curr. Opin. Behav. Sci. 2016, 10, 125–132. [Google Scholar] [CrossRef]
- Mammarella, I.C.; Hill, F.; Devine, A.; Caviola, S.; Szűcs, D. Math Anxiety and Developmental Dyscalculia: A Study on Working Memory Processes. J. Clin. Exp. Neuropsychol. 2015, 37, 878–887. [Google Scholar] [CrossRef]
- Szucs, D.; Devine, A.; Soltesz, F.; Nobes, A.; Gabriel, F. Developmental Dyscalculia Is Related to Visuo-Spatial Memory and Inhibition Impairment. Cortex 2013, 49, 2674–2688. [Google Scholar] [CrossRef] [Green Version]
- Kucian, K.; Ashkenazi, S.S.; Hänggi, J.; Rotzer, S.; Jäncke, L.; Martin, E.; von Aster, M. Developmental Dyscalculia: A Dysconnection Syndrome? Brain Struct. Funct. 2014, 219, 1721–1733. [Google Scholar] [CrossRef] [PubMed] [Green Version]
- Rykhlevskaia, E.; Uddin, L.Q.; Kondos, L.; Menon, V. Neuroanatomical Correlates of Developmental Dyscalculia: Combined Evidence from Morphometry and Tractography. Front. Hum. Neurosci. 2009, 3, 51. [Google Scholar] [CrossRef] [PubMed] [Green Version]
- Ranpura, A.; Isaacs, E.; Edmonds, C.; Rogers, M.; Lanigan, J.; Singhal, A.; Clayden, J.; Clark, C.; Butterworth, B. Developmental Trajectories of Grey and White Matter in Dyscalculia. Trends Neurosci. Educ. 2013, 2, 56–64. [Google Scholar] [CrossRef]
- Ashkenazi, S.; Rosenberg-Lee, M.; Tenison, C.; Menon, V. Weak Task-Related Modulation and Stimulus Representations during Arithmetic Problem Solving in Children with Developmental Dyscalculia. Dev. Cogn. Neurosci. 2012, 2 (Suppl. S1), S152–S166. [Google Scholar] [CrossRef] [PubMed] [Green Version]
- Peters, L.; Bulthé, J.; Daniels, N.; Op de Beeck, H.; De Smedt, B. Dyscalculia and Dyslexia: Different Behavioral, yet Similar Brain Activity Profiles during Arithmetic. NeuroImage Clin. 2018, 18, 663–674. [Google Scholar] [CrossRef]
- Berteletti, I.; Prado, J.; Booth, J.R. Children with Mathematical Learning Disability Fail in Recruiting Verbal and Numerical Brain Regions When Solving Simple Multiplication Problems. Cortex 2014, 57, 143–155. [Google Scholar] [CrossRef] [Green Version]
- Rosenberg-Lee, M.; Ashkenazi, S.; Chen, T.; Young, C.B.; Geary, D.C.; Menon, V. Brain Hyper-Connectivity and Operation-Specific Deficits during Arithmetic Problem Solving in Children with Developmental Dyscalculia. Dev. Sci. 2015, 18, 351–372. [Google Scholar] [CrossRef] [Green Version]
- Wilkinson, G.S. WRAT 3–Wide Range Achievement Test; The Psychological Corporation: San Antonio, TX, USA, 1993. [Google Scholar]
- Crawford, J.R.; Howell, D.C. Comparing an Individual’s Test Score against Norms Derived from Small Samples. Clin. Neuropsychol. 1998, 12, 482–486. [Google Scholar] [CrossRef]
- Crawford, J.R.; Garthwaite, P.H.; Porter, S. Point and Interval Estimates of Effect Sizes for the Case-Controls Design in Neuropsychology: Rationale, Methods, Implementations, and Proposed Reporting Standards. Cogn. Neuropsychol. 2010, 27, 245–260. [Google Scholar] [CrossRef]
- Benjamini, Y.; Hochberg, Y. Controlling the False Discovery Rate: A Practical and Powerful Approach to Multiple Testing. J. R. Stat. Soc. 1995, 57, 289–300. [Google Scholar] [CrossRef]
- Jafari, M.; Ansari-Pour, N. Why, When and How to Adjust Your P Values? Cell J. 2019, 20, 604–607. [Google Scholar] [CrossRef]
- Wechsler, D. Wechsler Abbreviated Scale of Intelligence; The Psychological Corporation: San Antonio, TX, USA, 1999. [Google Scholar]
- Torgesen, J.K.; Wagner, R.K.; Rashotte, C.A. Test of Word Reading Efficiency; Pro-Ed.: Austin, TX, USA, 1999. [Google Scholar]
- Wechsler, D. Wechsler Memory Scale–III.; The Psychological Corporation: San Antonio, TX, USA, 1997. [Google Scholar]
- Oldfield, R.C. The Assessment and Analysis of Handedness: The Edinburgh Inventory. Neuropsychologia 1971, 9, 97–113. [Google Scholar] [CrossRef]
- Cox, R.W. AFNI: Software for Analysis and Visualization of Functional Magnetic Resonance Neuroimages. Comput. Biomed. Res. 1996, 29, 162–173. [Google Scholar] [CrossRef]
- Crawford, J.R.; Garthwaite, P.H. Investigation of the Single Case in Neuropsychology: Confidence Limits on the Abnormality of Test Scores and Test Score Differences. Neuropsychologia 2002, 40, 1196–1208. [Google Scholar] [CrossRef] [Green Version]
- Jenkinson, M.; Beckmann, C.F.; Behrens, T.E.J.; Woolrich, M.W.; Smith, S.M. FSL. Neuroimage 2012, 62, 782–790. [Google Scholar] [CrossRef] [Green Version]
- Smith, S.M. Fast Robust Automated Brain Extraction. Hum. Brain Mapp. 2002, 17, 143–155. [Google Scholar] [CrossRef]
- Jenkinson, M.; Bannister, P.; Brady, M.; Smith, S. Improved Optimization for the Robust and Accurate Linear Registration and Motion Correction of Brain Images. Neuroimage 2002, 17, 825–841. [Google Scholar] [CrossRef]
- Jenkinson, M.; Smith, S. A Global Optimisation Method for Robust Affine Registration of Brain Images. Med. Image Anal. 2001, 5, 143–156. [Google Scholar] [CrossRef]
- Andersson, J.L.; Jenkinson, M.; Smith, S. Non-Linear Registration, Aka Spatial Normalisation FMRIB Technical Report TR07JA2; FMRIB Analysis Group of the University of Oxford: Oxford, UK, 2007. [Google Scholar]
- Woolrich, M.W.; Behrens, T.E.J.; Beckmann, C.F.; Jenkinson, M.; Smith, S.M. Multilevel Linear Modelling for FMRI Group Analysis Using Bayesian Inference. Neuroimage 2004, 21, 1732–1747. [Google Scholar] [CrossRef]
- Eickhoff, S.B.; Heim, S.; Zilles, K.; Amunts, K. Testing Anatomically Specified Hypotheses in Functional Imaging Using Cytoarchitectonic Maps. Neuroimage 2006, 32, 570–582. [Google Scholar] [CrossRef]
- Eickhoff, S.B.; Paus, T.; Caspers, S.; Grosbras, M.-H.; Evans, A.C.; Zilles, K.; Amunts, K. Assignment of Functional Activations to Probabilistic Cytoarchitectonic Areas Revisited. Neuroimage 2007, 36, 511–521. [Google Scholar] [CrossRef]
- Eickhoff, S.B.; Stephan, K.E.; Mohlberg, H.; Grefkes, C.; Fink, G.R.; Amunts, K.; Zilles, K. A New SPM Toolbox for Combining Probabilistic Cytoarchitectonic Maps and Functional Imaging Data. Neuroimage 2005, 25, 1325–1335. [Google Scholar] [CrossRef]
- Choi, H.-J.; Zilles, K.; Mohlberg, H.; Schleicher, A.; Fink, G.R.; Armstrong, E.; Amunts, K. Cytoarchitectonic Identification and Probabilistic Mapping of Two Distinct Areas within the Anterior Ventral Bank of the Human Intraparietal Sulcus. J. Comp. Neurol. 2006, 495, 53–69. [Google Scholar] [CrossRef] [Green Version]
- Scheperjans, F.; Hermann, K.; Eickhoff, S.B.; Amunts, K.; Schleicher, A.; Zilles, K. Observer-Independent Cytoarchitectonic Mapping of the Human Superior Parietal Cortex. Cereb. Cortex 2008, 18, 846–867. [Google Scholar] [CrossRef] [Green Version]
- Caspers, S.; Eickhoff, S.B.; Geyer, S.; Scheperjans, F.; Mohlberg, H.; Zilles, K.; Amunts, K. The Human Inferior Parietal Lobule in Stereotaxic Space. Brain Struct. Funct. 2008, 212, 481–495. [Google Scholar] [CrossRef]
- Geyer, S.; Ledberg, A.; Schleicher, A.; Kinomura, S.; Schormann, T.; Bürgel, U.; Klingberg, T.; Larsson, J.; Zilles, K.; Roland, P.E. Two Different Areas within the Primary Motor Cortex of Man. Nature 1996, 382, 805–807. [Google Scholar] [CrossRef]
- Desikan, R.S.; Ségonne, F.; Fischl, B.; Quinn, B.T.; Dickerson, B.C.; Blacker, D.; Buckner, R.L.; Dale, A.M.; Maguire, R.P.; Hyman, B.T.; et al. An Automated Labeling System for Subdividing the Human Cerebral Cortex on MRI Scans into Gyral Based Regions of Interest. Neuroimage 2006, 31, 968–980. [Google Scholar] [CrossRef]
- Frazier, J.A.; Chiu, S.; Breeze, J.L.; Makris, N.; Lange, N.; Kennedy, D.N.; Herbert, M.R.; Bent, E.K.; Koneru, V.K.; Dieterich, M.E.; et al. Structural Brain Magnetic Resonance Imaging of Limbic and Thalamic Volumes in Pediatric Bipolar Disorder. Am. J. Psychiatry 2005, 162, 1256–1265. [Google Scholar] [CrossRef] [PubMed]
- Goldstein, J.M.; Seidman, L.J.; Makris, N.; Ahern, T.; O’Brien, L.M.; Caviness, V.S., Jr.; Kennedy, D.N.; Faraone, S.V.; Tsuang, M.T. Hypothalamic Abnormalities in Schizophrenia: Sex Effects and Genetic Vulnerability. Biol. Psychiatry 2007, 61, 935–945. [Google Scholar] [CrossRef] [PubMed]
- Makris, N.; Goldstein, J.M.; Kennedy, D.; Hodge, S.M.; Caviness, V.S.; Faraone, S.V.; Tsuang, M.T.; Seidman, L.J. Decreased Volume of Left and Total Anterior Insular Lobule in Schizophrenia. Schizophr. Res. 2006, 83, 155–171. [Google Scholar] [CrossRef] [PubMed]
- De Smedt, B. Chapter 3—Language and Arithmetic: The Potential Role of Phonological Processing. In Heterogeneity of Function in Numerical Cognition; Henik, A., Fias, W., Eds.; Academic Press: Cambridge, MA, USA, 2018; pp. 51–74. ISBN 9780128115299. [Google Scholar]
- Salillas, E.; Wicha, N.Y.Y. Early Learning Shapes the Memory Networks for Arithmetic: Evidence from Brain Potentials in Bilinguals. Psychol. Sci. 2012, 23, 745–755. [Google Scholar] [CrossRef] [Green Version]
- Orrantia, J.; Rodríguez, L.; Múñez, D.; Vicente, S. Inverse Reference in Subtraction Performance: An Analysis from Arithmetic Word Problems. Q. J. Exp. Psychol. 2012, 65, 725–738. [Google Scholar] [CrossRef]
- Huebner, M.G.; LeFevre, J.-A. Selection of Procedures in Mental Subtraction: Use of Eye Movements as a Window on Arithmetic Processing. Can. J. Exp. Psychol. 2017, 72, 171–182. [Google Scholar] [CrossRef]
- Klein, E.; Moeller, K.; Glauche, V.; Weiller, C.; Willmes, K. Processing Pathways in Mental Arithmetic--Evidence from Probabilistic Fiber Tracking. PLoS ONE 2013, 8, e55455. [Google Scholar] [CrossRef] [PubMed] [Green Version]
- Pinel, P.; Dehaene, S. Genetic and Environmental Contributions to Brain Activation during Calculation. Neuroimage 2013, 81, 306–316. [Google Scholar] [CrossRef] [PubMed]
- De Visscher, A.; Berens, S.C.; Keidel, J.L.; Noël, M.-P.; Bird, C.M. The Interference Effect in Arithmetic Fact Solving: An FMRI Study. Neuroimage 2015, 116, 92–101. [Google Scholar] [CrossRef] [PubMed] [Green Version]
- LeFevre, J.-A.; Sadesky, G.S.; Bisanz, J. Selection of Procedures in Mental Addition: Reassessing the Problem Size Effect in Adults. J. Exp. Psychol. Learn. Mem. Cogn. 1996, 22, 216. [Google Scholar] [CrossRef]
- Hubbard, E.M.; Piazza, M.; Pinel, P.; Dehaene, S. Interactions between Number and Space in Parietal Cortex. Nat. Rev. Neurosci. 2005, 6, 435–448. [Google Scholar] [CrossRef]
- Kato, M. Saccade Target Selection and Activation Compared between Frontal and Parietal Eye Fields: A Human Study Using FMRI. Neurosci. Res. 2000, 38, S74. [Google Scholar] [CrossRef]
- Ryan, S.; Bonilha, L.; Jackson, S.R. Individual Variation in the Location of the Parietal Eye Fields: A TMS Study. Exp. Brain Res. 2006, 173, 389–394. [Google Scholar] [CrossRef]
- Brotchie, P.R.; Lee, M.B.; Chen, D.Y.; Lourensz, M.; Jackson, G.; Bradley, W.G., Jr. Head Position Modulates Activity in the Human Parietal Eye Fields. Neuroimage 2003, 18, 178–184. [Google Scholar] [CrossRef]
- Andrzejewska, M.; Stolińska, A. Comparing the Difficulty of Tasks Using Eye Tracking Combined with Subjective and Behavioural Criteria. J. Eye Mov. Res. 2016, 9, 1–16. [Google Scholar] [CrossRef]
- Ashkenazi, S.; Gliksman, Y.; Henik, A. Understanding Estimations of Magnitudes: An FMRI Investigation. Brain Sci. 2022, 12, 104. [Google Scholar] [CrossRef]
- Logie, R.H.; Venneri, A.; Della Sala, S.; Redpath, T.W.; Marshall, I. Brain Activation and the Phonological Loop: The Impact of Rehearsal. Brain Cogn. 2003, 53, 293–296. [Google Scholar] [CrossRef]
- Paulesu, E.; Frith, C.D.; Frackowiak, R.S. The Neural Correlates of the Verbal Component of Working Memory. Nature 1993, 362, 342–345. [Google Scholar] [CrossRef]
- Rusconi, E.; Walsh, V.; Butterworth, B. Dexterity with Numbers: RTMS over Left Angular Gyrus Disrupts Finger Gnosis and Number Processing. Neuropsychologia 2005, 43, 1609–1624. [Google Scholar] [CrossRef]
- Thompson, J.C.; Abbott, D.F.; Wheaton, K.J.; Syngeniotis, A.; Puce, A. Digit Representation Is More than Just Hand Waving. Brain Res. Cogn. Brain Res. 2004, 21, 412–417. [Google Scholar] [CrossRef]
- Haaland, K.Y.; Elsinger, C.L.; Mayer, A.R.; Durgerian, S.; Rao, S.M. Motor Sequence Complexity and Performing Hand Produce Differential Patterns of Hemispheric Lateralization. J. Cogn. Neurosci. 2004, 16, 621–636. [Google Scholar] [CrossRef]
- Andres, M.; Pesenti, M. Finger-Based Representation of Mental Arithmetic. In The Oxford Handbook of Numerical Cognition; Oxford University Press: Oxford, UK, 2015; p. 67. [Google Scholar]
- Kaufmann, L.; Wood, G.; Rubinsten, O.; Henik, A. Meta-Analyses of Developmental FMRI Studies Investigating Typical and Atypical Trajectories of Number Processing and Calculation. Dev. Neuropsychol. 2011, 36, 763–787. [Google Scholar] [CrossRef]
- Bulthé, J.; Prinsen, J.; Vanderauwera, J.; Duyck, S.; Daniels, N.; Gillebert, C.R.; Mantini, D.; Op de Beeck, H.P.; De Smedt, B. Multi-Method Brain Imaging Reveals Impaired Representations of Number as Well as Altered Connectivity in Adults with Dyscalculia. Neuroimage 2019, 190, 289–302. [Google Scholar] [CrossRef]
- De Smedt, B.; Boets, B. Phonological Processing and Arithmetic Fact Retrieval: Evidence from Developmental Dyslexia. Neuropsychologia 2010, 48, 3973–3981. [Google Scholar] [CrossRef] [Green Version]
- Dewi, J.D.; Bagnoud, J.; Thevenot, C. Do Production and Verification Tasks in Arithmetic Rely on the Same Cognitive Mechanisms? A Test Using Alphabet Arithmetic. Q. J. Exp. Psychol. 2021, 74, 2182–2192. [Google Scholar] [CrossRef]


| Test | RM | Controls | Significance Test a | Estimated Effect Size (z cc) b | B-H Adjusted p’c | |||
|---|---|---|---|---|---|---|---|---|
| Mean | SD | N | t | p | ||||
| Cognitive ability (IQ) d | 108 | 121.78 | 10.17 | 18 | −1.319 | 0.102 | −1.355 | 0.255 |
| Arithmetic (WRAT) d | 80 | 100.33 | 11.96 | 18 | −1.654 | 0.058 | −1.699 | 0.193 |
| Spelling (WRAT) d | 101 | 111.94 | 4.43 | 18 | −2.405 | 0.014 | −2.471 | 0.140 |
| Reading (WRAT) d | 119 | 113.44 | 6.47 | 18 | 0.836 | 0.207 | 0.859 | 0.259 |
| Sight Word Reading (TOWRE) d | 104 | 103.17 | 9.61 | 18 | 0.084 | 0.467 | 0.086 | 0.467 |
| Phonemic Decoding (TOWRE) d | 103 | 112.67 | 8.70 | 18 | −1.081 | 0.147 | −1.111 | 0.210 |
| Digit Span Forward e | 10 | 12.30 | 1.85 | 10 | −1.188 | 0.133 | −1.246 | 0.266 |
| Digit Span Backward e | 10 | 8.90 | 2.62 | 10 | 0.400 | 0.349 | 0.419 | 0.388 |
| Spatial Scan Forward e | 7 | 10.90 | 1.92 | 10 | −1.936 | 0.042 | −2.030 | 0.210 |
| Spatial Scan Backward e | 8 | 10.90 | 2.43 | 10 | −1.139 | 0.142 | −1.195 | 0.237 |
| RM | Controls | Significance Test a | Estimated Effect Size (z cc) b | B-H Adjusted p’c | |||
|---|---|---|---|---|---|---|---|
| Mean | SD | t | p | ||||
| Percentage Correct (%) | |||||||
| Multiplication | 68.75 | 91.25 | 5.86 | −3.737 | 0.0008 | −3.840 | 0.003 |
| Multiplication Control | 93.75 | 97.57 | 2.37 | −1.569 | 0.068 | −1.612 | 0.090 |
| Subtraction | 57.50 | 78.40 | 10.80 | −1.873 | 0.039 | −1.924 | 0.078 |
| Subtraction Control | 96.25 | 97.01 | 2.92 | −0.253 | 0.402 | −0.260 | 0.402 |
| Mean Reaction Time (s) | |||||||
| Multiplication | 2.815 | 1.63 | 0.30 | 3.867 | 0.0006 | 3.973 | 0.002 |
| Multiplication Control | 1.611 | 1.30 | 0.18 | 1.652 | 0.058 | 1.697 | 0.117 |
| Subtraction | 2.810 | 2.26 | 0.36 | 1.494 | 0.077 | 1.535 | 0.102 |
| Subtraction Control | 1.712 | 1.47 | 0.23 | 1.029 | 0.159 | 1.057 | 0.159 |
| Region a | Number of voxels | Z-max | MNI Coordinates b | Juelich Histological Atlas c | ||
|---|---|---|---|---|---|---|
| x | y | z | ||||
| Multiplication > Control * | ||||||
| L Inferior Frontal Gyrus | 3906 | 4.75 | −46 | 22 | 20 | Left Broca’s Area (45) |
| L Supramarginal Gyrus | 1994 | 4.15 | −44 | −50 | 36 | Left Anterior IPS (hIP1) |
| R Frontal Orbital cortex | 1968 | 4.17 | 36 | 28 | −6 | - |
| L Paracingulate Gyrus | 1168 | 3.95 | −8 | 10 | 44 | Left Premotor Cortex (Area 6) |
| R Cerebellum | 487 | 4.17 | 36 | −68 | −46 | - |
| L Thalamus | 434 | 3.36 | −10 | −2 | 8 | - |
| Subtraction > Control ** | ||||||
| L Inferior Frontal Gyrus | 31222 | 6.28 | −44 | 24 | 22 | Left Broca’s Area (45) |
| L Angular Gyrus | 5.95 | −45 | −52 | 54 | Inferior Parietal Lobule (PFm) | |
| R Frontal Pole | 5.61 | 35 | 42 | 20 | - | |
| R Superior Parietal Lobule | 2736 | 5.16 | 32 | −64 | 38 | Right Superior Parietal (7A) |
| R Occipital Pole | 246 | 4.13 | 30 | −90 | −12 | Right Visual Cortex (V3V) |
| Multiplication > Subtraction * | ||||||
| R Precuneous Cortex | 1247 | 4.02 | 10 | −52 | 22 | Right WM Cingulum |
| L Frontal Pole | 452 | 4.24 | −6 | 60 | −12 | - |
| Subtraction > Multiplication ** | ||||||
| L Supramarginal Gyrus | 7314 | 5.13 | −52 | −42 | 44 | Left Inferior Parietal (PF) |
| L Middle Frontal Gyrus | 2309 | 4.89 | −48 | 32 | 26 | Left Broca’s Area (45) |
| R Paracingulate Gyrus | 1780 | 5.17 | 6 | 26 | 36 | - |
| R Frontal Orbital Cortex | 1445 | 5.07 | 34 | 24 | −8 | - |
| L Insular Cortex | 1201 | 4.65 | −30 | 22 | −6 | - |
| R Precentral Gyrus | 646 | 4.99 | 32 | −4 | 60 | Right Premotor Cortex (Area 6) |
| R Inferior Temporal Gyrus | 375 | 4.18 | 52 | −60 | −14 | Right Visual Cortex (V5) |
| R Precentral Gyrus | 262 | 4.22 | 52 | 6 | 24 | Right Broca’s Area (44) |
| R Frontal Pole | 197 | 4.04 | 38 | 54 | 18 | - |
| Brain Stem | 160 | 3.99 | 0 | −22 | −24 | - |
| R Middle Frontal Gyrus | 145 | 3.98 | 48 | 30 | 30 | Right Broca’s Area (45) |
| Region a | Number of Voxels | Z-max | MNI Coordinates b | Juelich Histological Atlas c | ||
|---|---|---|---|---|---|---|
| x | y | z | ||||
| Multiplication: RM > Control Group * | ||||||
| L Precentral Gyrus | 10053 | 4.67 | −56 | 8 | 12 | Left Broca’s Area (44) |
| L Inferior Frontal Gyrus | 4.48 | −52 | 8 | 16 | Left Broca’s Area (44) | |
| L Supramarginal Gyrus | 3.01 | −34 | −38 | 38 | Left Anterior IPS (hIP1) | |
| L Angular Gyrus | 3219 | 4.34 | −48 | −56 | 40 | Left Inferior Parietal (PGa) |
| R Frontal Pole | 633 | 4.36 | 24 | 48 | 24 | - |
| R Supramarginal Gyrus | 490 | 3.66 | 64 | −38 | 40 | Right Inferior Parietal (PF) |
| Subtraction: Control Group > RM ** | ||||||
| R Occipital Fusiform Gyrus | 31742 | 5.10 | 16 | −84 | −18 | - |
| R Thalamus | 4.07 | 11 | 1 | 8 | - | |
| L Thalamus | 4.05 | −5 | −10 | 8 | - | |
| R Middle Frontal Gyrus | 1962 | 4.20 | 44 | 26 | 24 | Right Broca’s Area (45) |
| R Frontal Pole | 999 | 3.47 | 28 | 64 | 8 | - |
| L Cerebral White Matter | 776 | 3.74 | −28 | 12 | 22 | - |
| R Temporal Pole | 590 | 3.44 | 42 | 22 | −22 | - |
| R Middle Frontal Gyrus | 456 | 3.89 | 28 | 22 | 38 | - |
| R Superior Frontal Gyrus | 421 | 3.44 | 20 | −4 | 66 | Right Premotor Cortex (Area 6) |
| Region of Interest | RM | Controls a | Significance Test b | Estimated Effect Size (z cc) c | B-H Adjusted p’ d | ||
|---|---|---|---|---|---|---|---|
| Mean | SD | t | p | ||||
| Multiplication | |||||||
| Left IPS | 0.5535 | 0.2659 | 0.1488 | 1.881 | 0.0386 | 1.933 | 0.3087 |
| Right IPS | 0.1944 | 0.0921 | 0.1823 | 0.546 | 0.2960 | 0.561 | 0.3643 |
| Left AG | 0.4109 | −0.0201 | 0.1540 | 2.723 | 0.0072 | 2.798 | 0.1157 |
| Right AG | −0.0443 | −0.1137 | 0.1783 | 0.382 | 0.3536 | 0.393 | 0.3771 |
| Left PSPL | 0.2913 | 0.1482 | 0.1933 | 0.721 | 0.2405 | 0.740 | 0.3498 |
| Right PSPL | 0.0965 | 0.0472 | 0.2183 | 0.22 | 0.4143 | 0.226 | 0.4143 |
| Left Motor | 0.3111 | 0.0920 | 0.1421 | 1.501 | 0.0759 | 1.542 | 0.2428 |
| Right Motor | 0.0598 | −0.1134 | 0.1117 | 1.506 | 0.0752 | 1.547 | 0.3010 |
| Subtraction | |||||||
| Left IPS | 0.2349 | 0.4835 | 0.1807 | −1.339 | 0.0991 | −1.376 | 0.1982 |
| Right IPS | −0.0219 | 0.3397 | 0.2455 | −1.434 | 0.0849 | −1.473 | 0.2263 |
| Left AG | −0.0374 | 0.1154 | 0.2336 | −0.663 | 0.2580 | −0.682 | 0.3434 |
| Right AG | −0.2273 | −0.0977 | 0.2418 | −0.519 | 0.3051 | −0.533 | 0.3487 |
| Left PSPL | −0.1004 | 0.2951 | 0.2335 | −1.647 | 0.0590 | −1.692 | 0.3145 |
| Right PSPL | −0.1602 | 0.2759 | 0.3265 | −1.299 | 0.1056 | −1.335 | 0.1877 |
| Left Motor | −0.0006 | 0.1451 | 0.1584 | −0.898 | 0.1909 | −0.922 | 0.3055 |
| Right Motor | −0.2928 | −0.0623 | 0.1596 | −1.409 | 0.0885 | −1.447 | 0.2022 |
Publisher’s Note: MDPI stays neutral with regard to jurisdictional claims in published maps and institutional affiliations. |
© 2022 by the authors. Licensee MDPI, Basel, Switzerland. This article is an open access article distributed under the terms and conditions of the Creative Commons Attribution (CC BY) license (https://creativecommons.org/licenses/by/4.0/).
Share and Cite
Göbel, S.M.; Terry, R.; Klein, E.; Hymers, M.; Kaufmann, L. Impaired Arithmetic Fact Retrieval in an Adult with Developmental Dyscalculia: Evidence from Behavioral and Functional Brain Imaging Data. Brain Sci. 2022, 12, 735. https://0-doi-org.brum.beds.ac.uk/10.3390/brainsci12060735
Göbel SM, Terry R, Klein E, Hymers M, Kaufmann L. Impaired Arithmetic Fact Retrieval in an Adult with Developmental Dyscalculia: Evidence from Behavioral and Functional Brain Imaging Data. Brain Sciences. 2022; 12(6):735. https://0-doi-org.brum.beds.ac.uk/10.3390/brainsci12060735
Chicago/Turabian StyleGöbel, Silke M., Rebecca Terry, Elise Klein, Mark Hymers, and Liane Kaufmann. 2022. "Impaired Arithmetic Fact Retrieval in an Adult with Developmental Dyscalculia: Evidence from Behavioral and Functional Brain Imaging Data" Brain Sciences 12, no. 6: 735. https://0-doi-org.brum.beds.ac.uk/10.3390/brainsci12060735